To the best of our knowledge there has not been any actual ... sensor network monitoring system deployment in real .... âgoodâ wireless links in the tree topology in order to get good ..... this experiment and used an almost bug-free version of.
1
The Performance of a Wireless Sensor Network for Structural Health Monitoring Jeongyeup Paek∗ , Nupur Kothari∗ , Krishna Chintalapudi∗ , Sumit Rangwala∗ , Ning Xu∗ , John Caffrey† , Ramesh Govindan∗ , Sami Masri† , John Wallace‡ and Daniel Whang‡ ∗ Computer Science Department, University of Southern California, Los Angeles, California, USA. † Civil Engineering Department, University of Southern California, Los Angeles,California, USA. ‡ Civil Engineering Department, University of California Los Angeles, Los Angeles, California, USA.
Abstract— In this paper we evaluate the performance of Wisden - a wireless multi-hop sensor network based data acquisition system for structural health monitoring (SHM) applications. We deploy Wisden in two real environments: a seismic test structure and a four story office building. We examine several aspects such as reliability, latency and data integrity of Wisden, and validate its performance using data obtained from a wired data acquisition system. Our deployments indicate that Wisden can deliver time-synchronized data reliably across multiple hops with tolerable latencies. To the best of our knowledge there has not been any actual deployment based evaluation of a sensor network data acquisition system for SHM till date.
I. I NTRODUCTION Wireless sensor network based monitoring systems can potentially enhance the resolution of sensing and provide information at unprecedented levels of granularity. Recently there has been an immense amount of research examining various aspects and issues pertaining to such monitoring networks. However, with the exception of the habitat monitoring project on the Great Duck island [1], the literature does not contain reports of a sensor network monitoring system deployment in real environments. Such reports not only provide a practical validation for sensor network based systems but also a rich set of experiences resulting from the vagaries of real environments often leading to unforeseen systems design issues and challenges. In this paper, we provide a preliminary validation and evaluation from real-world deployments of wireless sensor network data acquisition
system called Wisden [2] for structural health monitoring (SHM). Structural Health Monitoring (SHM) focuses on developing technologies and systems for assessing the integrity of structures such as buildings, bridges, aerospace structures and off-shore oil rigs [3]. Most existing SHM implementations use wired data acquisition systems to collect vibration data from various locations in the structure induced by ambient sources (e.g., moving vehicles, wind, waves and earthquakes) and analyze it at a central location. Installing a large scale data acquisition system requires instrumentation of long cables within the structure from several different locations (sometimes across several floors and walls). Such an installation usually involves carefully surveying, planning and often changes to the structure/layout (e.g., drilling holes in the walls or building additional structures to support wiring). This may sometimes take several weeks and may often be turn out to be prohibitively expensive [4]. Moreover for old and/or damaged structures, instrumenting a large scale data acquisition system may not be possible for safety reasons. A wireless sensor network based data acquisition system promises enormous benefits such as ease and flexibility of deployment and low maintenance and deployment costs. Lynch et al. [5] designed and fabricated a proof of concept low power wireless sensing unit and validated it by collecting measurements on the Alamosa Canyon Bridge [5]. The wireless sensing unit can acquire data and transmit it to a base-station over a single hop (i.e.,
2
directly to a base station).1 Such a design constrains sensor node placement significantly. By contrast, Wisden [2] provides autonomous multi-hop and maintenance, reliable data transport over multiple hops, and means for synchronizing sensor data acquired at different sensors. Wisden has the basic functionalities crucial to any sensor network based data acquisition system for SHM applications, all in one system. We deployed Wisden in two environments: 1) A seismic test structure - a full scale model of an actual hospital ceiling structure and, 2) The Four Seasons building - a four-story office building in Los Angeles which was recently subjected to forced-vibration testing. We start by providing an overview of Wisden in Section II. Sections III and IV describe our experiences from each of the two evaluation deployments of Wisden. We examine several aspects of Wisden such as data transmission reliability, latency and data integrity. We also validate Wisden using data obtained from a wired data acquisition system. Our deployments indicate that Wisden can deliver time-synchronized data reliably across multiple hops with tolerable latencies. Wisden is a work in progress and we intend to improve our system based on the experiences gained from these deployments. The paper concludes in Section V, which discusses the lessons learned and possible future improvements for Wisden based on our deployment experiences. II. OVERVIEW OF W ISDEN This section provides an overview of Wisden ([2]), only enough to make the paper self-contained. A typical Wisden deployment consists of several tens of nodes placed at different locations on a large structure. Each node has an attached accelerometer that is capable of sensing up to three channels (3-axes) of vibration data, with a configurable sampling rate. A base station provides the functionality equivalent to a data logger or data acquisition unit – i.e., the ability to store samples from every sensor. Nodes self-configure to form a tree topology and then send their vibration data to the sink, potentially over multiple hops. The sink usually forwards this data to a base-station (usually a high end PC). Implicit in the data acquisition system abstraction that Wisden provides are two essential design requirements: that the vibration samples be delivered reliably to the base station, and that samples be time-synchronized. Sensors can be seamlessly removed or added in a working Wisden deployment by placing a new node and turning 1 several single hop commercial wireless sensing products are also available today e.g.,www.microstrain.com.
it off/on. This provides run-time flexibility with respect to the number of channels in the system. As the number of channels increases so does the data generation rate and often this rate may far exceed the throughput provided by the underlying wireless network. For example, a single tri-axial accelerometer generating 16-bit samples at 100Hz (typical to several SHM systems) generates more than 5 Kbps of data including the packet headers and a network of 20 such nodes would lead to a data rate of over 100Kbps. The Chipcon radio (available on Mica2s which Wisden currently uses) nominally provides 19.9 Kbps after accounting for coding overhead, but achievable radio data rates are closer to 10 Kbps. Clearly, such bandwidth limitations imply that continuous data acquisition from even a few tens of sensors is infeasible. Fortunately, most SHM applications are content to acquire vibration data corresponding to interesting events – relatively large motions caused by earthquakes, high wind, or large vehicles. Wisden relies on quiescent periods (when no interesting event is in progress) being long enough for the average data generation rate to be less than the maximum achievable throughput of the network, so that queued samples can eventually be drained (reliably delivered to the sink. Samples obtained during the quiescent periods, are compressed using a lossy run-length encoding scheme to reduce the data-rate. The new ZigBee radios (based on IEEE 802.15.4 and used in MicaZs) are deemed to provide a bandwidth of about 250 Kbps. In our future implementations of Wisden we plan to use MicaZs. This is expected to not only alleviate the severe bandwidth constraints imposed by Mica2s, but also allow us to scale Wisden to potentially large-scale deployments of around 50-100 nodes. In the following sections we provide an overview of the hardware and the three novel software components of Wisden namely, i) Reliable Data Transport ii) Compression and, iii) Data Synchronization. All these components for Wisden software have been implemented in TinyOS. A. Hardware Wisden uses Mica-2 motes as the platform for the sensor nodes. SHM applications usually demand high end accelerometers to measure vibrations (dynamic range of 1-2 g’s, a sensitivity in the µg range and low noise characteristics). Since Mica-2s are not equipped with such high end accelerometers Wisden uses a vibration card designed specifically for high quality vibration sensing. The card allows for sampling frequencies from 5-20,000 Hz (with a programmable anti-aliasing filter)
3
at 16 bits/sample from 4 separate analog input channels. The analog channels are interfaced to a 16-bit analog-todigital converter controlled by an on-board microprocessor. The accelerometer used is capable of sensing tri-axis with its range of -2.5g-2.5g. In turn, the microprocessor can be commanded by an attached Mica2 mote (which runs the Wisden software) to sets the sampling rate, read the output data, and stores the samples into an external 64K byte SRAM. The vibration card is specifically designed for low power operation. The micro-processor and sensing (for sensors and signal conditioning) circuits are powered by two separate controllable power supplies, so that full power is only used up during acquisition (about 100mA at 5V). After data is stored in the on-board SRAM the power for the sensing circuits can be disabled while data is being retrieved. Data can be retained in the SRAM at a very low sleep current (< 50 µA) until needed. For Wisden we modified the on-board microprocessor’s software to permit continuous periodic, sampleby-sample, data acquisition and to not use the on-board SRAM on the vibration card. B. Reliability Reliable delivery of sampled data to the sink is a crucial component of Wisden. Wisden uses both hopby-hop and end-to-end recovery for reliable delivery; the former is a necessary performance optimization in wireless networks where link losses up to 30% are not uncommon [6]. In this section we briefly describe the topology self-configuration and data transport components of Wisden. 1) Topology Self-Configuration: The first step in the Wisden system is topology self-configuration. Specifically, in Wisden, the nodes self-organize themselves into a routing tree rooted at the base station. For this Wisden leverages the software prototype BLAST [7], which supports both tree construction and packet delivery.2 In [7], Woo et al.show that it is important to use only “good” wireless links in the tree topology in order to get good performance. In their approach, nodes select parents based on packet loss performance to potential parents. This packet loss performance can be measured both passively (using actual data transmissions) and actively (using probes sent by nodes). Specifically, BLAST has two separable components: one that performs parent selection, and another that exports data transmission and reception interfaces. Wisden uses only the parent selection component and implements its reliable transport on top of it. 2 BLAST
is a precursor to the MintRouting TinyOS component.
2) Reliable Data-Delivery: Wisden implements a NACK-based hop-by-hop and end-to-end reliability scheme. Each source queues the generated vibration data in its EEPROM and transmits the data to its parent. Parents keep track of sequence numbers of packets that they receive, on a per source basis. A gap in the sequence number of sent packets indicates packet loss. Each node maintains a list of missing packets. When a loss is detected, a tuple containing a source ID and sequence number of the lost packet is inserted into this list. Entries in the “missing packets” list are piggybacked in outgoing transmissions, and children infer losses by overhearing this transmission. Nodes keep a small cache of recently transmitted packets, from which a child can repair losses reported by its parent. Lost packets are often recovered hop-by-hop, however, two factors necessitate end-to-end recovery. First, heavy packet losses can lead to large missing packet lists that might exceed the memory of the motes. We have observed this in our experiments. More fundamentally, a topology change could cause loss of the missing packet list information. For example, when a node selects a new parent, it will no longer respond to repair requests for missing packets. Wisden’s end-to-end recovery scheme is essentially implemented in much the same way as our hop-by-hop scheme. It leverages the fact that the base station has significantly more memory and can keep track of all missing packets. The base station attempts hop-by-hop recovery of a missing packet. When one of its children notices that it has seen a packet from the corresponding source, but does not have a cached copy of that packet, it adds that recovery request to its missing packets list. This request is propagated downward in this manner (using the same mechanisms described for hop-by-hop recovery) until it reaches the source. Since the source maintains generated packets in its EEPROM, it can repair the missing packet. C. Data Compression Continuing the example of Section II if 20 nodes were sampling tri-axial data at 100Hz only for 15 minutes, it would take more than 2 hrs to reliably transmit this data to the sink at 10Kbps. A simple scheme is to detect events and transmit only the data corresponding to the non-quiescent periods (see Section II), so that the effective data rate now depends only on the duty-cycle of the vibrations. In the same example with 20 nodes, if the duty-cycle were just 10% the data generation rate would reduce by a factor of 10 and hence take about 15 minutes to transmit this data. Motivated by this observation we
4
devised a lossy run-length based compression scheme. In our scheme, if the difference between the maximum and minimum values of samples over a window is less than a threshold, the variation is considered insignificant. For such a window of samples, instead of transmitting all the samples we merely transmit the average value of the samples followed by the window size. In our implementation we use a variable size window, the size for the current encoding is chosen run-time to maximize the number of samples encoded. The threshold was chosen experimentally based on the noise floor, so as to avoid transmitting noise samples during the quiescent period. D. Data Synchronization Most data acquisition systems provide the ability to time-stamp samples collected by different sensors in order to correlate them at the base-station. Clearly, if GPS devices were available at every node, this would not be a problem, but the unsuitability of GPS for wireless sensor networks has been well documented [8]. Sensor network time synchronization schemes [8], [9] attempt to synchronize the clocks of all the sensor nodes in the network and are sufficient to solve this problem. However, these schemes incur the overhead of synchronization packets which are transmitted periodically to overcome errors arising from clock skew. Wisden uses a light-weight approach in that it focuses on timestamping the data consistently at the base station, rather than synchronizing clocks network-wide. This approach requires the addition of a small number of bytes to each packet, but otherwise incurs no messaging costs. The Wisden sink synchronizes samples from all the nodes by estimating their generation times according to its own local time. This is done by estimating the residence time of the received sample (time elapsed between the generation of a sample and its receipt at the sink) and subtracting it from the sample’s receipt time at the sink. In Wisden, each node calculates the amount of time spent by a sample at that particular node using its local clock. This amount is added to an residence time field attached to a packet (for simplicity, Wisden associates offsets with only the first sample in a packet), as the packet leaves the node. Noting that propagation delay (of radio waves) incurred over several hundred meters (path distance to sink) is on the order of nanoseconds, the delay from the time of generation of the sample to the time it is received by the base station (or any node) is stored in the packet as the sample travels through different nodes in the network. This is the residence time of the packet in the network. The
tn0B
tn1B tp1B
B
B1 tn 1A
tn0A
tp2B
Fig. 1.
S tn3 A
tp3 A
A1 A
tp3B
B2
tn2A
tp2 A
tp1A
tn2B
4A
tp
A3
A2
Time synchronization example.
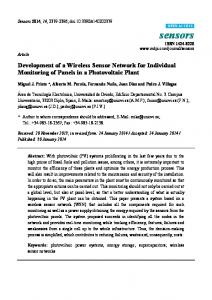
base station (or any node) can thus calculate the time of generation of the sample by subtracting the residence time from its local time. If the base station is GPS synchronized, this approach gives a good approximation. If the residence time field is updated as close to the radio and the accelerometers as possible, then, assuming packet propagation times are negligible in dense sensor deployments, this approach can successfully time-stamp the sample. We illustrate this through an example. In Figure 1 let tniA be the residence time at the ith hop node and let t piA be the propagation delay for the ith hop. Then, the residence time of the sample from A is given by: i=2
i=3
i=0
i=1
TA = ∑ tniA + ∑ t piA .
(1)
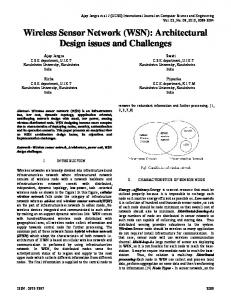
Noting that propagation delay (of radio waves) incurred over several hundred meters (path distance to sink) is on the order of nanoseconds, we neglect the second summation in Equation 1. The time spent at a node is generally on the order of milliseconds and cannot be neglected. Under this assumption, TA can be calculated by summing up the times spent at each node. As this packet reaches the base station S, the base station notes the time (its own local time) at which it received this packet say τA . Hence, the sample must have been generated at τA − TA (TA is obtained from the packet header) in the local time of the sink. The same procedure is applied for sample sB . Now sA and sB can be aligned since τA − TA = τB − TB . III. T HE S EISMIC T EST S TRUCTURE D EPLOYMENT In this section, we discuss our evaluation of Wisden when deployed on a seismic test structure. We start by describing the Seismic Test Structure (STS) and the deployment details. In Section III-B we discuss our deployment experiences, followed by the results of our evaluation in Sections III-C and III-D. The seismic test structure (Figure 2) is a platform for conducting seismic experiments on a full-scale realistic imitation of a 28’ × 48’ sq feet hospital ceiling. The ceiling is complete with real electric lights, fire sprinklers,
5
0.25 A
0.2 0.15
Acceleration (g value)
0.1 0.05 0 −0.05 −0.1 −0.15 −0.2 −0.25
0
Fig. 2.
The seismic test structure
Fig. 4.
1
2
3
4 Time (millisecond)
5
6
7
8 4
x 10
STS: Vibration data: Wisden. 0.25 A
0.2 0.15
Acceleration (g value)
0.1 0.05 0 −0.05 −0.1 −0.15 −0.2 −0.25
Fig. 3.
0
Seismic test structure: Layout of motes Fig. 5.
drop ceiling installations and water pipes carrying water. Furthermore, the ceiling is designed to support 10,000 lb of weight. The entire ceiling can be subjected to uniaxial motion with a peak-to-peak stroke of 10 inches, using a 55,000 lb MTS hydraulic actuator having a ±5 inch stroke. The hydraulic pump delivers up to 40 GPM at 3000 PSI. The test structure consists of seven main trusses, each approximately 20’ in length on a 8’ center and oriented transverse to the direction of motion. These main trusses are connected together by 18 smaller trusses oriented in the direction of motion and a number of cross bracings to prevent racking. The seven main trusses are the primary load bearing members and are constructed from structural steel and plywood. To support the structure, linear bearings are located at each end of the main trusses making a total of 14 linear bearings. Each of the linear bearings is supported by a sturdy column, which is rigidly attached to the concrete floor. The total weight of the moving portion of the test structure is approximately 12,000 lb. A. Our Setup We deployed 9 Wisden nodes (nodes 2-10) at various locations on the ceiling of the seismic test structure as depicted in Figure 3. Accelerometers were attached to
1
2
3
4 Time (millisecond)
5
6
7
8 4
x 10
STS: Vibration data: validation node.
the trusses of the structure with heavy-duty double sided tape and other parts of the devices were securely placed on the trusses. The sink (node 1) was placed on a table located outside the ceiling structure (Figure 3) and was connected to the base-station (a PC) via a serial port (depicted as BS in Figure 3). Node 11, the validationnode collected vibration samples from the structure using the same hardware as Wisden and sent them directly to a PC (Figure 3) over a serial port. The purpose of the validation-node was to compare and validate the data collected using Wisden. Node 11 was co-located with node 5, hence both these nodes were expected to experience the same vibrations (differing only due to noise). All the Wisden nodes were configured to sample at 50Hz along all the three axes. This is a reasonable setting since most civil structures have their dominant frequencies at less than 25Hz. The packet transmission rate of Wisden nodes was configured at 0.5 packets per second to avoid losses due to congestion. Using the hydraulic actuator, we subjected the structure to two kinds of excitations, i) impulses and ii) random shaking over a period of 1 minute. The system was kept running for about 10 minutes after the forcedvibration for the reception of all the outstanding vibration data.
6 0.05
0.15
0.045 0.1
0.04 0.035 power distribution
Acceleration (g value)
0.05
0
−0.05
0.03 0.025 0.02 0.015 0.01
−0.1
0.005
0
Fig. 6.
200
400
600
800 1000 1200 Time (millisecond)
1400
1600
1800
0
2000
STS: Impulse response data: Wisden.
Fig. 8.
0
5
10
Frequency (Hz)
15
20
25
STS: Frequency response data: Wisden.
0.15
0.05 0.045
0.1
0.04 0.035 power distribution
Acceleration (g value)
0.05
0
0.03 0.025 0.02
−0.05
0.015 0.01
−0.1
0.005
0
Fig. 7.
200
400
600
800 1000 1200 Time (millisecond)
1400
1600
1800
0
2000
STS: Impulse response data: wired node.
B. Deployment Experiences Figure 3 shows the topology of the system during the experiments. Solid lines represent the dominant links that were used and the dotted lines are some of the alternative links that Wisden used. The topology shows that we had one-hop network for 99.3% of the time where all nodes were directly connected to the base station. Only 0.7% of the packets were routed over alternative two-hop paths. This is mainly because the dimensions of the structure were small enough for the Mica2’s to communicate with the base station in one-hop with their full radio power. One issue we had while deploying the nodes in the seismic test structure was the alignment of the accelerometers. They must be correctly aligned to sense the exact data in each x, y and z direction. But we did not have an accurate method of doing so other than aligning them using the trusses of the structure as basis. In our results, while the structure moved only in uniaxial direction, Wisden has also detected some vibration in the orthogonal direction. Unless we are confident that the alignment is perfect, we cannot be sure whether this vibration is due to mis-alignment or real vibration experienced by the structure in that direction. So we need to use a compass to align the accelerometers in the future deployments.
Fig. 9.
0
5
10
Frequency (Hz)
15
20
25
STS: Frequency response data: wired node.
C. Validation of the collected data In this section we validate the data collected using Wisden in both time and frequency domains. We compare the data collected by the validation-node (node 11) and node 5. 1) Time domain validation: Figures 4 and 5 depict the sensed vibration activity from nodes 5 (Wisden node) and node 11 (the validation-node) respectively. Visually the Wisden node seems to have collected the same activity data from the structure as the validation-node. A closer inspection, however, revealed an inconsistency in the time-stamps. For some of the collected samples we found the inter-sample times between consecutive samples to be irregular (smaller or larger than expected, sometimes even up to several hundreds of milliseconds). Upon analysis we found that the reason for this discrepancy was not in the data-synchronization mechanism of Wisden, but because we were using the base-station to correct the sink’s local time over a serial port every 20 seconds. This was required since the sink may accumulate significant skew relative to the GPS time. 3 A sudden correction in the sink’s time sometimes lead to the timestamping inconsistencies. To solve this problem, in future 3 Future
Wisden deployments may comprise several GPSsynchronized sinks acting as cluster-heads to multiple clusters of several nodes each.
7 250
1
original packets retransmitted packet lost packets
Node 2 Node 3 Node 4 Node 5 Node 6 Node 7 Node 8 Node 10 Node 11
0.9
200
0.8
% of Packets Recvd
number of packets
0.7 150
100
0.6 0.5 0.4 0.3
50
0.2 0.1
0
Fig. 10.
2
3
4
5
6 node ID
7
8
10
0
11
STS: Bar graph of packets received by nodes
Fig. 12.
x 10
1.5 2 2.5 Latency (milliseconds)
3
3.5
4 5
x 10
0.9 0.8 0.7 % of Packets Recvd
Latency (milliseconds)
3
1
1 Node 2 Node 3 Node 4 Node 5 Node 6 Node 7 Node 8 Node 10 Node 11
3.5
0.5
STS: CDF of latencies of pkts recvd. per node
5
4
0
2.5
2
1.5
0.6 0.5 0.4 0.3
1
0.2 0.5
0
Fig. 11.
0.1
0
50
100 150 Sequence Number
200
0
250
STS: Plot of latency vs. seq. number per node
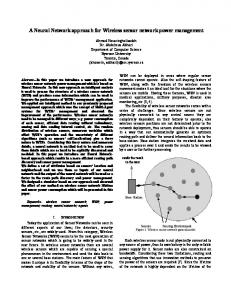
Wisden deployments, we plan to equip the sink directly with a GPS and avoid need for periodic corrections.. 2) Frequency Domain Validation: Figures 6 and 7 are the impulse responses of the ceiling captured during the test (these correspond to zoomed-in versions of region A depicted in Figures 4 and 5). Figures 8 and 9 depict the estimated corresponding power-spectral densities. Figure 9 reveals modes at about 0.5 Hz, 1 Hz, 2.9Hz, 6.1Hz, 8.9Hz and others above 20Hz. The most dominant mode of the structure lies at about 2.9 Hz. As seen in Figure 8 the data collected from the Wisden node accurately captures the dominant 2.90Hz mode and several others, however it misses modes at higher frequencies. This is a consequence of the lossy compression scheme which ignores “small” variations in the data. This is also evident from comparing Figures 6 and 7 where the clipping due to our lossy compression scheme is clearly seen. We plan to eliminate this problem in our future deployments of Wisden. One possible workaround for this problem can be the use of lossless compression schemes during the non-quiescent period. D. System Evaluation In this section we try to evaluate the performance of Wisden as a data acquisition system for the Seismic Test Structure Experiment.
Fig. 13.
0
0.5
1
1.5 2 2.5 Latency (milliseconds)
3
3.5
4 5
x 10
STS: CDF of latencies of total pkts recvd.
The first observation from our experiment is the reduction in latency due to our compression scheme. In our experiment we found that it took Wisden about 7 minutes to transmit the vibration data resulting from the one-minute excitation. Since we are sampling at 50Hz along three axes, each node generated about 150 samples per second and roughly 9000 samples in one minute. If compression were turned off, since Wisden packets are of fixed size and can accommodate 18 uncompressed samples per packet, there would be 500 packets to transmit. At a transmission rate of 1 packet every 2 seconds, this would take more than 15 minutes to transmit all the generated packets in the absence of our compression scheme. Figure 10 displays the number of lost packets, retransmitted packets, and packets received at the sink without any retransmission for each node. The cumulative packet loss over all the nodes was found to be 0.17%. This packet loss occured because we switched off the sink before the retransmissions could reach it and not due to the failure of our end-to-end reliability scheme. These lost packets would have eventually been recovered if we had waited long enough. Figure 11 depicts the plot of packet latency versus sequence numbers for each node. For the initial sequence numbers, the latency is around 2 minutes, which is
8
because initially there were no vibrations and Wisden is configured to send packets once very 2 minutes during this quiescent period to avoid long periods of inactivity. After the excitation of the structure starts, the latency drops down to almost zero suddenly and the latency of each successive packet increases almost linearly. This occurs because during the excitation of the structure, packets are generated at an almost constant rate of around 8.33 pkts/sec, leading to an initial low latency. However, as can be seen from Section III-A the sending rate for packets is only 0.5 pkts/sec, leading to a rate mismatch. This in turn leads to the filling up of queues in a linear fashion (as the difference in rates is almost constant), which then results in a linear increase in latencies of successive packets. When the excitation is over, the queues start emptying (as no new packets are being generated) and the latencies for successive packets start decreasing until they reach the latency of 2 minutes which is the silent period latency. Here we note that for different nodes, the latencies for a certain sequence number are different. This can be explained by noting in Figure 10 that each node generates a different number of packets (due to differences in alignment and positioning of accelerometers). Thus for nodes which generate fewer of packets (e.g. node 7), the latencies are obviously much lower. For nodes which have a higher number of packets (e.g. node 3), the latencies of all packets are higher as the queues are clogged more than in the other nodes. Also important is the fact that although sequence numbers maintain the chronological order, they are not proportional to the generation time of packets, as different nodes produce different number of packets during the same time period (excitation period). This explains our observation that for different nodes, latencies fall back to 2 minutes at different sequence numbers, signifying the end of the excitation period. Figure 13 shows the cumulative distribution function (CDF) of latencies of all the packets received at the sink while Figure 12 depicts the same for each node. From Figure 12 the CDF of latencies is almost linear except for a sudden hike at a latency of around 2 minutes. This indicates that while the packet latencies are almost evenly distributed there are a large number of packets with a latency of around 2 minutes. This hike is easily explained by looking at Figure 11. For the rest of the latencies, the linear characteristic of the CDF curve is due to the fact that since latencies increase linearly with sequence numbers, as shown in Figure 11, packets have latencies evenly spread over the whole spectrum. One thing we observe about Figure 12 is that CDF’s of different nodes have different slopes. The explanation for this observation is identical to the one we provided
for different nodes having different latencies for the same sequence numbers in Figure 11. Hence we can see that while node 7 has the lowest number of packets generated, its CDF has the highest slope in Figure 12 and that node 3 having the largest number of packets generated, has a CDF with the lowest slope. The overall CDF in Figure 13 has a very similar trend except that the curve tapers toward the end. The similarity of the overall CDF to the per-node CDF’s can be explained by the fact that all nodes are most of the times directly connected to the sink and hence have extremely similar trends. The tapering at the end of the overall CDF can be explained by the fact that nodes which do not have too many packets to send, do not have packets with very high latencies, which occur for nodes which have more packets to send. Hence toward the end, only a few nodes contribute to the overall CDF (i.e. there are lesser packets having high latencies than there are for the rest of the latency values), resulting in a tapering of the end of the curve. All in all, Wisden performed admirably for the Seismic Test Structure. Hardly any packets were lost, and not many packets needed to be resent. All the latency graphs showed results which concurred with and validated our understanding of the Wisden system. IV. T HE F OUR S EASONS E XPERIMENT In this section, we discuss our evaluation of Wisden when deployed on the Four Seasons Building (FSB). We start by describing the Four Seasons Building and the deployment details. In Section IV-B we discuss our deployment experiences, followed by the results of our evaluation in Sections IV-C and IV-D. The Four Seasons building, shown in Figure 14, is a four story office building in Los Angeles. It was significantly damaged during the 1994 Northridge earthquake and thereafter abandoned and yellow-tagged (restricted use - area(s) unsafe). This building has a structure common to many buildings which makes the analysis of its earthquake damage (Figure 14) interesting. The UCLA/NEES project was granted permission to perform Forced Vibration Testing on the Four Seasons building and performed tests using Linear inertial shakers and Eccentric mass shakers (Figure 15). They measured the response of the building to the above tests using Building Sensors that contain, among other instruments, tri-axial force-balanced Episensor accelerometers (Figure 17) which monitor the structural vibrations. Their setup consisted of four such Building Sensors placed in four corners of the building on every floor. We took up this unique opportunity to field test Wisden and set up an experiment to collect vibration data
9
Fig. 14.
The Four Seasons Building
Fig. 16.
Four Seasons Building: Layout of motes
Fig. 15.
Eccentric mass shakers
Fig. 17.
Wisden motes co-located with UCLA/NEES accels.
from the building using our own accelerometers. This experiment predated the Seismic Test Structure Experiment described in Section IV. The Seismic Test Structure experiment benefited greatly from our experiences during this experiment and used an almost bug-free version of Wisden compared to that used in this experiment. A. Our Setup For the Four Seasons building experiment we deployed 10 motes in a 90’ × 150’ area on the fourth floor of the Four Seasons building. Four nodes at positions A2, A6, D2 and D6 (Figure 16) were co-located with the wired instruments of NEES group (Figure 17) and others were placed to achieve the goal of both data collection and multi-hop forwarding. All motes were placed on the ground and the accelerometers were fixed on the concrete floor of the building with heavy duty double-sided tape. Every node was within 30 feet of at least one other node but none of the nodes were in direct line-of-sight from any other node. The base station was placed at the southwest corner of the building. B. Deployment Experiences It is well known that wireless communication performance in terms of packet delivery is very lossy and highly variable in the real world environment. The communication environment in the Four Seasons building
was noticeably worse than the seismic test structure. Lacking detailed instrumentation, we cannot differentiate the impact of the structure itself on wireless interference versus interference from equipment that other groups were using. However, the overall average link quality for the links that were selected was 81.12%, but for some links the delivery rate dropped to 37.6%. Considering the fact that these values are for the chosen links, other candidate links must have been even worse. The topology during the experiment is depicted in Figure 16. Although the solid lines represent the dominant links that were used, we experienced frequent route changes throughout the experiment where the dotted lines are some of the sample paths that were used. There were nodes which had 2 or 3 hop paths to the base station while some nodes with even longer geographic distances had direct connections. The frequent changes in routes can be explained by the variable nature of the wireless links. Noise and vibrations generated by things other than structure itself, including the human movements, was also a problem. We could not fix the accelerometers onto any walls, metal frames, nor wooden part of the structure because they had vibration characteristics of their own. Nearby human movements and other devices such as power generator generated fair amount of noise. We found that the noise-levels in the acquired samples
10 0.04
0.05 0.04 0.03
0.03
0.01
power distribution
Acceleration (g value)
0.02
0 −0.01
0.02
−0.02
0.01 −0.03 −0.04 −0.05
Fig. 18.
0
0.5
1
1.5 Time (millisecond)
2
0
2.5
0
5
10
5
x 10
FSB: Vibration data: Wisden.
Fig. 20.
Frequency (Hz)
15
20
25
FSB: Frequency response data: Wisden. 0.70
0.05 0.04
0.60 0.03
0.50
0.01
power distribution
Acceleration (g value)
0.02
0 −0.01 −0.02
0.40
0.30
0.20
−0.03
0.10
−0.04 −0.05
Fig. 19.
0
0.5
1
1.5 Time (millisecond)
2
5
FSB: Vibration data: wired instrument.
from the vibration card increase ”significantly” at low battery levels. Informally, we have noted that a Wisden node with a new set of batteries (including Mica2, vibration card and the accelerometer) typically runs without noticeable increase in noise for at least 24 hours, and at most 48 hours. Finding proper locations for the nodes and firmly fixing the accelerometers were other deployment issues. We fixed our accelerometers to the structure using double sided tapes whereas UCLA/NEES at Four Seasons building fixed their sensors to the structure by drilling through the concrete after tearing off the carpet and the wooden floor. Our small and convenient wireless devices provided us with ease and flexibility of deployment. An interesting observation was that while the UCLA/NEES people took several days to set up their data acquisition system4 , Wisden simply required around half an hour before every experiment. This validates the main design goal of Wisden: convenient and rapid deployment of instrumentation.
4 The
0
2.5 x 10
UCLA/NEES data acquisition system used wired building sensors, to install which, first a survey needed to be conducted to locate parts of the building safe enough for drilling, holes needed to be drilled in the walls/floor, and wires needed to be laid.
Fig. 21.
0
5
10
Frequency (Hz)
15
20
25
FSB: Frequency response data: wired instrument.
C. Validation of the collected data In this section we present the results of the Four Seasons experiment and analyze them, both in time and frequency domains as in Section III. 1) Time domain validation: Figure 18 represents the vibration data we obtained from Wisden node 6 while Figure 19 represents the data UCLA/NEES obtained using their wired building sensor D2. Visually the Wisden node seems to have collected the same activity data from the structure as the validation-node. However, there are many differences in the two data sets. These are primarily due to differences in instrumentation, the compression mechanism of Wisden, and a software bug in Wisden. The differences in instrumentation include: • UCLA/NEES data was sampled at 100Hz whereas our sampling rate was 50Hz. Hence the plot of our data was more sparse (Figure 18) • We had more noise in our sensor readings compared to the Episensor accelerometers used by the UCLA/NEES group. Episensor accelerometers have better bandwidth, resolution and dynamic range performance than our accelerometers. • Our accelerometers were attached to the concrete using double-sided tape only while UCLA/NEES drilled through the structure to firmly fix their
11 6
1
12
x 10
Node 2 Node 3 Node 4 Node 5 Node 6 Node 7 Node 8 Node 9 Node 10 Node 11
0.9 10
0.8
8
0.6
Latency (milliseconds)
% of Packets Recvd
0.7
0.5 0.4
6
4
0.3 0.2
2
0.1 0
Fig. 22.
0
2
4
6 Latency (milliseconds)
8
10
12
FSB: CDF of Latencies of total packets received 1
0.8 0.7
0
500
1000
1500 2000 Sequence Number
2500
3000
3500
Fig. 24. FSB: Plot of Latency vs. Sequence number per node 3500
Node 2 Node 3 Node 4 Node 5 Node 6 Node 7 Node 8 Node 9 Node 10 Node 11
0.9
original packets retransmitted packet lost packets
3000
2500
0.6
number of packets
% of Packets Recvd
0
6
x 10
0.5 0.4 0.3
2000
1500
1000
0.2 500
0.1 0
0
2
4
6 Latency (milliseconds)
8
10
0
12 6
2
3
4
5
x 10
Fig. 23. FSB: CDF of Latencies of packets received per node Fig. 25.
sensors (Figure 17). Thus our sensors were more susceptible to other sources of noise. • Our accelerometers did not guarantee a stable zeroacceleration offset and exhibited occasional offset shifts. The lossy run-length compression used by Wisden degraded the quality of data at points wherever the consecutive sample values were within some threshold (Figure 6), regardless of the fact that we were in the middle of high activity. For example, if the sensed acceleration data was 0.01g, 0.02g, 0.01g in sequence, this is expressed as three 0.013g’s in a row. A software bug in Wisden lead to extremely long retransmission times for some packets. Due to limited duration of the experiment, these packets were never recovered. This corresponds to the big gaps in samples in Figure 18. The lost packets could have been recovered if we had waited longer or if we had done the test with the current fixed version of the software. 2) Frequency domain validation: Figures 20 and 21 depict the power-spectral density of the data obtained by Wisden and UCLA/NEES respectively. As shown in Figure 20, Wisden correctly captures the dominant frequency response of the structure at 3.75Hz, despite noise caused due to packet losses and sampling differences. The packet losses result in widening of the peak and
6
7 node ID
8
9
10
11
FSB: Bar graph of packets received by nodes
introduce several spurious frequencies.
D. System Evaluation During the Four Seasons Experiment, we discovered a software bug in our system which was causing some unexpected behavior. It turned out to be the problem of using 8-bit counters for counting the number of packets pending in the EEPROM of the source node, which resulted in wrap-around of the counter in case of long experiments. waiting to be transmitted. What basically happened was that once we had 256 packets to send, the packet counter wrapped around to indicate that the queues were empty. Thus, these packets were only sent out once other packets were queued, incrementing the counter to a non-zero value. Thus we ended up having huge latencies for such packets. Also at any time after counter-wraparound, there were a minimum of 256 packets in the queue, waiting to be sent. Most of these could not be received at the base station despite waiting around 2 hours after the test for the data to come in and shaking the accelerometers gently to produce packets which would push out the earlier data. This bug was not noticeable when we were conducting short tests in a better wireless communication environment, where fewer packets were queued in the nodes,
12
Figure 25 displays the number of lost packets, retransmitted packets, and packets received at the sink without any retransmission for each node. From the figure we can see that a lot of packets were lost due to the bug, in some cases almost 50% of the packets were lost. Most of the packets that were lost would have been retransmitted packets and hence the number of retransmitted packets is not that high. We can see that nodes have highly varying number of lost packets, which is primarily due to the fact that not all nodes were connected directly to the sink. For example, we note that nodes 2, 5 and 7, which were connected directly to the sink almost all the time (Figure 16), have extremely low number of lost packets, and that nodes 3, and 11, which were predominantly 3 hops away from the sink (Figure 16), have extremely high loss percentage. Hence nodes which were closer to the sink managed to get in most of their packets as opposed to nodes far away from the sink. Figure 22 shows the cumulative distribution of latencies for packets received by all nodes in Wisden, and Figure 23 depicts the cumulative distribution function of latencies for packets received per node in Wisden. The latencies of many packets seem to be abnormally large, which is because of the aforementioned bug in Wisden. Figure 24 represents the plot of latency versus sequence numbers of packets per node. This plot shows clearly the effect of the bug on the latencies. The steep hikes in latency are for packets which needed to be retransmitted. The bug prevented the packets from being retransmitted for a long time, until there were events to initiate the counter wrap around. On the whole, we note that the performance of Wisden was not up to the mark for this experiment primarily due to the software bug. However, looking at Section IV-C we can see that even with the packet losses due to the software bug, the Wisden results were comparable to the wired system of UCLA/NEES. V. C ONCLUSIONS AND F UTURE W ORK In this paper we evaluated and discussed the performance of Wisden for SHM applications in two real-world deployments. We used the results from our deployments to validate Wisden as a data acquisition system for SHM applications. Despite bugs in Wisden software, we were able to accurately determine the dominant modal frequencies of each structure. During the process of experimentation and analysis of results, we found a number of improvements that can be made to Wisden. The current version of Wisden limits the maximum number of nodes it can support, due to the memory constraints of the Mica2’s. This constraint
limits the scalability and the usefulness of the system. To overcome this problem, we are currently in the process of designing the next version of Wisden to support multiple clusters for scalability. While run-length compression played a significant role in our system, it also resulted in loss of data. The system can be improved by using a better compression scheme that can effectively suppress the silent period and at the same time achieve high-quality data compression and collection in the non-quiescent period. Moreover, rather than using a GPS device connected to the PC and sending the GPS time to the sink, we are planning on having a GPS on the mote itself which would result in more accurate time. We are also planning on transitioning Wisden to MicaZ’s which have powerful Zigbee radios. The above improvements would go a long way in making Wisden suitable for practical use by researchers. R EFERENCES [1] A. Mainwaring, J. Polastre, R. Szewcyk, D. Culler, and J. Anderson, “Wireless Sensor Networks for Habitat Monitoring,” in Proceedings of the Workshop on Wireless Sensor Networks and Applications, Atlanta, GA, USA, September 2002. [2] N. Xu, S. Rangwala, K. Chintalapudi, D. Ganesan, A. Broad, R. Govindan, and D. Estrin, “A Wireless Sensor Network for Structural Monitoring,” in Proceedings of the ACM Conference on Embedded Networked Sensor Systems, Baltimore, MD, USA, November 2004. [3] S. W. Doebling, C. R. Farrar, M. B. Prime, and D. W. Shevitz, “Damage Identification and Health Monitoring of Structural and Mechanical Systems from Changes in their Vibration Characteristics: A Literature Review,” Los Alamos National Laboratory, Tech. Rep., May 1996. [4] E. G. Straser and A. S. Kiremidjian, “A Modular, Wireless Damage Monitoring System,” John A. Blume Earthquake Engineering Center, Department of Civil and Environmental Engineering, Stanford University, Stanford, CA, USA, Tech. Rep., 1998. [5] J. P. Lynch, K. H. Law, A. S. Kiremidjian, T. W. Kenny, E. Carryer, and A. Partridge, “The Design of a Wireless Sensing Unit for Structural Health Monitoring,” in Proc. of the 3rd International Workshop on Structural Health Monitoring, Stanford, CA, USA, September 2001. [6] J. Zhao and R. Govindan, “Understanding Packet Delivery Performance In Dense Wireless Sensor Networks), booktitle = Proceedings of the ACM Conference on Embedded Networked Sensor Systems, year = 2003, address = Los Angeles, CA, USA, month = November.” [7] A. Woo, T. Tong, and D. Culler, “Taming the Underlying Challenges of Reliable Multihop Routing in Sensor Networks,” in Proceedings of the First ACM Conference on Embedded Networked Sensor Systems (SenSys 2003)., Los Angeles, CA, November 2003. [8] J. Elson, L. Girod, and D. Estrin, “Fine-grained network time synchronization using reference broadcasts,” in Proceedings of the Fifth Symposium on Operating Systems Design and Implementation (OSDI 2002), Boston, MA, 2002. [9] S. Ganeriwal, R. Kumar, and M. B. Srivastava, “Timing-sync protocol for sensor networks,” in Proceedings of the first international conference on Embedded networked sensor systems. ACM Press, 2003, pp. 138–149.