Pergamon
Comput., Environ. and Urban Systems, Vol. 22, No. 2, pp. 137±155, 1998 # 1998 Elsevier Science Ltd. All rights reserved Printed in Great Britain 0198-9715/98 $19.00 + 0.00
PII: S0198-9715(98)00014-3
THE POTENTIAL OF WEB-BASED MAPPING AND VIRTUAL REALITY TECHNOLOGIES FOR MODELLING URBAN ENVIRONMENTS Simon Doyle1, Martin Dodge2 and Andy Smith3
Centre for Advanced Spatial Analysis, University College London, 1±19 Torrington Place, London WC1E 6BT, U.K.
ABSTRACT. The paper will consider the potential of interactive mapping and virtual reality technologies being developed on the World Wide Web (WWW) for the visualisation, modelling and analysis of urban environments. A range of innovative technologies are being developed that offer different ways of modelling and representing built-form and associated urban information with real-time interaction over the Internet. We shall present a review of the capabilities of the technologies and how they can be applied in the field of planning and design of urban environments. The WWW offers both an interface to, and a delivery channel for, the built environment information as well as being a medium for linking distributed users. We are interested in affordable ``off-the-shelf'' software that is relatively easy to set-up and use and which requires standard PCcomputing power preferable to a home user with a modem link (i.e., not high-end graphics workstations). The advantages and disadvantages which these technologies offer will be considered in terms of the level of realism and interactivity available to the end user. Working examples of these technologies which are being developed by the authors will be demonstrated and discussed throughout so as to qualify this review. The paper will also consider the applications of these technologies in a range of contexts, such as in local planning, urban design, development control, community participation, education and training. The implications for a wide range of potential users including planners, infrastructure managers, built environment students, community groups and interested members of the general public will also be discussed. # 1998 Elsevier Science Ltd. All rights reserved
1
Corresponding author. Tel.: +44-171-391-1781; fax: +44-171-813-2843; e-mail:
[email protected]; http://www.casa.ucl.ac.uk/ 2 E-mail:
[email protected] 3 E-mail:
[email protected] 137
138
S. Doyle et al.
INTRODUCTION Planners and urban designers have employed a wide variety of techniques in order to plan, model and simulate the outcome of a given process or development (Ranziger & Gleixner, 1997). Within these fields, physical models or large-scale plans have been created with three aims: to aid the decision making process, to democratise the planning process and to assist in the conveyance or dissemination of ideas. In the past, schemes which have sought to change given elements of the built environment have employed physical models, perhaps made of cardboard or wood based on architect's plans, perspective drawings and photomontages in order to promote a design solution or proposed planning development. Whilst still employed, such methods may be used less extensively in the future due to the emergence of increasingly more powerful desktop computing with constantly improving graphics capabilities, available at modest financial cost to individuals and agencies alike. This increase in computing power is facilitating the advance of geographic information systems (GIS), multimedia and virtual reality (VR) software within a variety of disciplines which are concerned with modelling or analysis aspects of urban environments. Within a planning context Shiffer's work is one such area where GIS has been successfully coupled to multimedia to model or depict proposed change in built environments (Shiffer, 1992, 1996). The work undertaken involved the use of digital media in public participation, whereby the results of analyses within GIS were shown to an audience of decision makers or interested parties whom the analyses would affect. In a broad sense this use of GIS and related technologies through public participation can be seen as a precursor to the role the World Wide Web (WWW) could take as a distribution mechanism, not only within planning but in any process where consultation may be required. In the following sections, the potential of Web-oriented GIS and VR software will be reviewed with particular reference to the disciplines of planning and urban design. Having outlined these potentials, the ability of the Web to serve as a dissemination mechanism will be discussed. The discussion will be qualified by examples currently being piloted by the authors.
EMBRACING THE WORLD WIDE WEB In the U.K. planning community, the uptake of digital technologies is widespread, with numerous local authorities, central government departments, utilities and policy and decision makers utilising digital data and GIS in both day to day and strategic planning (Batty, 1998). This trend can also be seen within other countries, for instance within the European Union (Von Rimscha, 1997), Australasia (Bishop, 1998) and the U.S.A. (Shiffer, 1992, 1996). In this context we are interested in the way digital map data may be manipulated and how it may be coupled to a variety of VR techniques on the WWW in order to provide what Counsell and Phillips (1997) identify as ``a credible context for visualising proposed changes'' which may occur within the built environment. By simulating change within a computed environment, information can be projected using the WWW and browser technologies as modelling and presentation platforms. Within the U.K. the exposure of GIS and digital data within decision-making agencies, local authorities and national government agencies may be regarded as widespread yet
Mapping and Virtual Reality Technologies for Urban Modelling
139
piecemeal in that there are a variety of systems in use across a number of agencies and local authorities. This is perhaps an artefact of the structure or organisation of the agencies which are responsible for the management and development of the physical environment. Whilst the level of uptake of GIS is varied, the requirement for analysis and planning within the urban environment is more evenly distributed. Nonetheless GIS are being used routinely to solve problems which relate to the built environment (Longley & Clarke, 1995). From this foundation the WWW can be employed as a distribution mechanism for a variety of GIS- or VR-based models and applications. In support of this analytical and planning function, the WWW is beginning to be used as a support tool, examples of these applications include Wandsworth council's on-line planning register, Devon County Council's 2001 structure plan and Westminster City Council's Web-based planning search engine. These examples vary in purpose and in functionality but do mirror Shiffer's (1992, 1996) work by opening up the decision-making process. It may be several years before we see the common use of the WWW by planning departments per se but the potential is beginning to be realised. Public expectation may also rise accordingly as the number of connections to the WWW and the Internet increases. On-line applications currently include banking, home shopping, publishing and distribution of information, it may be seen as only a matter of time before planning or urban design issues are (or are expected to be) addressed in a similar public forum (Batty, 1997a). This may be seen as an evolution of previous desktop-based work, in that the underlying principles of collaboration and consultation are facilitated by geographic information or GIS but with an altered delivery mechanism (i.e., the WWW). The following sections will review, in turn, the elements of digital technology which are currently being harnessed and developed for Web-based dissemination. Whilst the technologies described here may not at present be in the grasp of the majority of planners or urban designers or to those studying the built environment due to technical or institutional reasons, they do at present have great potential (Batty, 1997b). As part of the authors' research these potentials have been examined in four major areas of Web-based development; (1) (2) (3) (4)
interactive mapping; solid and geometric modelling; virtual reality modelling language (VRML); multi-user worlds.
Each of these will be addressed in turn with examples of existing and potential uses being discussed. The review progresses through several areas in which user interactivity is an increasingly key factor leading to the point where multiple users can interact and collaborate in computed digital environments. The paper commences with the traditional two-dimensional representations of the urban environment and develops through the linkage of two- to three-dimensional models and onto collaborative three-dimensional worlds. It is envisaged that this will be regarded as a logical progression in terms of the technologies under review. It will also serve to illustrate the development paths of the more complex applications and will serve to illustrate how GIS and two-dimensional digital data may be engineered in pursuit of Web-based three-dimensional modelling.
140
S. Doyle et al.
INTERACTIVE MAPPING Interactive mapping or Internet GIS has developed rapidly over the past few years resulting in the migration of some GIS functionality to the WWW (Plewe, 1997). This migration has taken elements of GIS to mass audiences. Currently there are a variety of Web sites which use Internet GIS for a diverse range of applications from city guides (http://www.thisislondon.co.uk/), on-line business directories (http://www.scoot.co.uk/) to environmental lobbying (http://www.foe.co.uk/cri/html/postcode.html). These applications incorporate GIS as on-line tools to disseminate information. Whilst not planning based, these examples show how spatial information can be used to inform a given interest group or audience through Internet GIS. Within the planning community there has been a steady growth in the use of digital data of a spatial nature (Longley & Clarke, 1995). This growth is no doubt tied to the rise in sophistication of GIS and the continuing migration of high-end workstation functionality to the desktop. This migration of power to the end user and the increased availability of detailed digital map data has allowed professional decision makers the potential to think ``spatially'' more often in analysing and visualising solutions to problems relating to the built environment. Within the context of the WWW, map style images have been displayed in various formats for a number of years. Whilst these images are useful in certain instances, they offer none of the functionality available to the experienced GIS user. This subsequently reduces the ability of the end user to interrogate information about a given area. By placing planning applications ``on-line'' (i.e., within a Web site which incorporates an interactive map as an interface to the information), interested parties could obtain information on previous developments, site or land ownership, contact details in order to voice an opinion and so on. This utilises the same technologies as the on-line tour guides or business locators mentioned earlier. To date, two broad types of interactive map have been developed by the commercial GIS vendors (i.e., the static map and the dynamic map; Plewe, 1997; Toon, 1997). These broad categories both employ the same kind of client±server relationship where the server is linked to a GIS and associated database which is accessed across the Internet by an end-user's or client WWW browser. Both of these aspects of Internet mapping can facilitate the distribution of spatial information relating to the urban environment; the following sections describes dynamic mapping and static mapping in turn. Dynamic Map The dynamic map is a GIS embedded within a client Web browser wherein the user will typically be able to zoom, pan, identify objects, hotlink to other data and turn layers of data on and off. User actions will be responded to in real time by a map server, thus giving the client or end user a basic GIS interface. Within the commercial market several GIS vendors have dynamic Internet mapping systems within their product range. Autodesk have Map Guide, ESRI produce MapCafe and Intergraph and MapInfo have their own proprietary applications. Whilst not designed to produce extensive analytical capabilities these applications are empowering the Web community by making spatial data more readily available Ð the functionality is at a level where pre-determined data may be queried and examined in such a way that the typical end user is not overwhelmed by unfamiliar
Mapping and Virtual Reality Technologies for Urban Modelling
141
technology but is still capable of learning about, or contributing to any given discussion over the Web. An example of this form of Internet mapping has been developed by the authors for strategic planning for London's Riverside NHS Trust. Within the browser, the end user is able to zoom, pan, examine attribute data, switch vector and raster layers on and off and hotlink to related Web sites and to multimedia clips. In this instance the JAVA programming language is being used to serve the map information to the end user. This is advantageous in that any JAVA-enabled browser can be used to view the application (Netscape 3.0 or Internet Explorer 3.0 or later). As JAVA is platform independent the only prerequisite is for a suitable browser to be used at the client end. Alternatives to the JAVA approach include the use of plug-ins, or applications which are incorporated or loaded into browsers at the client end, Intergraph GeoMedia and Autodesk MapGuide are examples of the plug-in approach. The immediate disadvantage of using a plug-in is that software has to be installed into the browser at the client end prior to data access. This requires some expertise and the appropriate access permissions to alter the client configuration. Furthermore many plug-ins are platform or operating system dependent which in turn may be restrictive in terms of accessing appropriate data. Static Map This kind of interactive map relies on user input to select a set of variables, which in turn generates a map image at the server side. This map is then returned as a ``result'' of the user input. In general, the functionality and scope of the graphic user interface are reduced in comparison to that of the dynamic interactive map but the query capabilities are usually more advanced. This kind of application can prove to be more complex for a ``public'' user to come to terms with if developed at too high a level. With competent programming many GIS functions can be created according to the relevant application. On the WWW there are a range of these query-based applications ranging from a toxin release inventory to geodemographic thematic map applications (http://www.esri.com/). It should be noted that to date the most developed of these applications are U.S. based, this perhaps reflects the physical location of the major GIS vendors, it also reflects the level of accessibility which exists in the U.S.A. with reference to digital data and freedom of information. Interactive mapping within the browser is a rapid area of development for the GIS vendor and user alike. With the advent of Microsoft's Internet Explorer 4.0 the desktop is probably destined to be transformed into a quasi-browser whereby more and more information and applications will be Web enabled or optimised for browser viewing. The ability to provide two-dimensional cartographic or thematic spatial information to the Web community is indeed a useful tool and few would dispute the potential of such an approach in distributing GIS and geographic information. Within the Web browser though, we are able to go beyond the two-dimensional view of the world which many GIS and cartographic agencies still purport. Through the use of a ``z'' dimension (height) we are able to generate models and three-dimensional models of certain urban environments. This allows the opportunity to provide a greater visual impact perhaps by thematically coding three-dimensional building polygons at storey level according to any given associated attribute (e.g., rateable value, occupancy level, housing condition, council tax valuation, building use and so on). Whilst this can be performed in a two-dimensional desktop GIS there are distinct advantages of having a three-dimensional representation especially in terms of visualisation and interaction. There are also numerous ways in which other attribute information can be manipulated by using object height as a descriptive variable
142
S. Doyle et al.
(e.g., building outlines may be extruded according to a socioeconomic or demographic attribute with colour describing some other qualitative or quantitative characteristic of the urban environment). Current research by the authors in this area is being undertaken wherein factors such as retail turnover have been generated as three-dimensional surfaces and draped over building polygons to display characteristics of English and Welsh town centres for central government (DETR, 1998). As the majority of these three-dimensional representations can be generated as VRML files they are viewable through the Web browser and as such are deliverable over the Internet subject to the constraints discussed later. This leads us to the second area of relevance in modelling the urban environment.
SOLID AND GEOMETRIC MODELLING Solid, geometric modelling has traditionally been seated in the domain of specialist computer-aided design (CAD) packages running on high-end graphics workstations. These packages, whilst often achieving a high degree of realism in modelling urban environments, tend to be limited to operation on single machines running the expensive proprietary software, hence restricting access where available, to fixed problems or planning and design issues. The WWW opens up the ability to widely distribute these three-dimensional geometric models albeit with several caveats. The first major restriction is that models need to be developed in accordance with the limitations imposed by a low bandwidth environment. If dissemination is to be effective, the home user with a modem and line rental charges, should not be overlooked Ð this effectively means that download times need to be efficient. To achieve a wide user base on the WWW, models need to be developed in a file size of not more than 300 kilobytes (K) and preferably less than 100 K. Such a limitation on file size sets the challenge of achieving high levels of realism in a low bandwidth environment. The following sections explore issues which need to be addressed when modelling the built environment on the WWW. The use of VRML and other proprietary languages will be explored in conjunction with photospatial panoramic modelling and augmented reality (AR). The potential of each technique for modelling the built environment will be explored with current examples available on the WWW. Virtual Reality Modelling Language VRML provides the basis for the majority of existing urban models on the WWW. Indeed, VRML is summarised in the introduction to the VRML 1.0 specification as a language for describing interactive simulations Ð virtual worlds networked via the global Internet and hyperlinked with the WWW (Bell, Parsis & Pesce, 1995). The language was designed as an open standard for integrating three-dimensional worlds into the Internet and was conceived as such in 1993 through the integration of WWW extensions to Silicon Graphics Open Inventor file format, (Martin & Higgs, 1997). VRML, currently based on specification 2.0 (Moving Worlds), has developed into a de facto standard for the distribution of three-dimensional models on the WWW. VRML provides a flexible, cross-platform (VRML is viewable on any operating system with the appropriate browser) environment to model urban form, the user is able to freely explore a model and view details from any angle, providing a very flexible way of interpreting a model using a suitable browser. As VRML is designed for distribution on the WWW, a block model of a large urban environment can potentially occupy less than
Mapping and Virtual Reality Technologies for Urban Modelling
143
100 K of file space. With an increase in complexity, scale and realism of the modelled objects however, there comes an increase in file size. Furthermore, to achieve realism in terms of being able to identify a polygon as, an ``office block'' or an ``Edwardian terrace'', VRML modellers are sometimes forced to apply textures, or photorealistic facades to the VRML objects in the model thus increasing file size and download time. An example of this kind of model is Virtual Tokyo, developed by Planet 9 Studios (http://www.planet9.com). Within this example the level of realism has been compromised to achieve fluid movement on a home-based PC (taken as a Pentium 90 processor) with an acceptable download time (i.e., 90 sec using a standard 28.8 baud modem). Within the virtual scene the end-user is presented with a series of VRML polygons which have had textures added to them as an aid to visual realism. The current release of VRML (VRML 2.0) allows the developer to increase the level of achievable realism by permitting behaviours to be assigned to objects. Behaviours allow a scene to include object movement and directional sound, significantly increasing levels of physical realism and interactivity. The basic block model is created and appropriate textures applied to aid user recognition. The user can be presented with the ability to move any object within the model on the x, y or z axes. The ability to move aspects of the built environment independently of one another allows each user to create their own interpretation of any given design scenario. The use of VRML 2.0 in this manner is an important step towards the development of Virtual Internet Design Arenas (ViDAs), which will be discussed later. However, as with VRML 1.0, VRML 2.0 is texture dependent and features such as directional sound increase the overall file size and therefore the download time from the WWW.
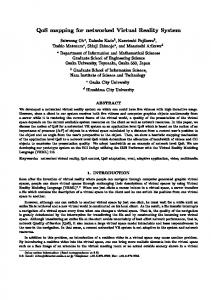
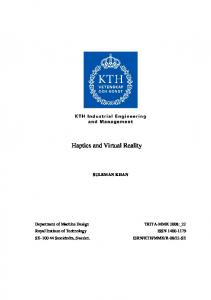
TOWARDS A THREE-DIMENSIONAL GIS There has been considerable research to push the capabilities of urban GIS from simple two-dimensional mapping towards three-dimensional visualisation of the built environment (Faust, 1995). This has often been achieved through the linkage of CAD technologies to GIS databases (Liggett, Friedman & Jepson, 1995). More recently there has been interest in using VR techniques to produce three-dimensional solid geometry models that the user can interactively explore and interrogate. The practical implementation of this has been achieved using VRML with the three-dimensional models being viewed in separate browser applications. In this sense the three-dimensional GIS is created by the ``loose coupling'' of VRML with two-dimensional spatial databases. Examples include the research by Martin and Higgs who coupled ARC/INFO output to VRML to visualise urban property information (Martin & Higgs, 1997), Smith who has created a extension to MapInfo GIS called Pavan which creates VRML models (Smith, 1997) and Dodge who has an developed scripts within ArcView GIS to produce VRML models of small-scale urban scenes (Dodge & Jiang, 1997; Dodge, Smith & Doyle, 1997a, 1997b). Figure 1 shows this approach of ``loose coupling'' GIS to VRML. Adding a Third Dimension To create a three-dimensional model from what may be called two-dimensional data, four distinct processes are applied to the data (Figure 2). In Stage 1, the conventional twodimensional GIS database is used to map the desired spatial information. The user then
144
S. Doyle et al.
FIGURE 1. The ``loose coupling'' of GIS to VRML within a Web browser Ð to the left is a dynamic Internet map of Whitehall and linked to it on the right is the corresponding three-dimensional VRML model (source: authors).
runs a program or script, usually with the GIS, that generates a VRML format output from the two-dimensional geometry and attributes (Stage 2). This output is stored in a data file, external to the GIS (Stage 3), which is loaded into a suitable VRML ``browser'' for viewing (Stage 4). The ``browser'' provides the functionality for the user to interactively explore the three-dimensional model by ``walking'' and ``flying''. The user is unable to modify the model in the ``browser''. Modification of the model requires going back to Stage 1 and making changes to the two-dimensional GIS database and then generating a new VRML model. So there is only a one-way link between the GIS and the VRML, with no means of feedback. Despite this limitation, there are several key benefits to using VRML to produce three-dimensional models from GIS. Firstly, it is a relatively low-cost option in terms of time and money particularly as VRML browsers are largely free software. As the VRML language is an agreed Internet standard and is not proprietary it is therefore easy to distribute models to the Web community. Many of the commercial GIS vendors are now realising the importance and the possibilities of three-dimensional GIS using VR technologies. For example, ESRI Inc. have launched a powerful extension to their desktop GIS ArcView called 3D Analyst (ESRI, 1997). This will provide three-dimensional visualisation capabilities within the GIS itself allowing a degree of modelling and analysis in three dimensions and the ability to exploit a VRML simile on the desktop. This release and others like it is a commercial realisation of the potential of three-dimensional modelling and data display mechanism undertaken in the type of research undertaken by Martin and Higgs (1997) particularly in the use of VRML. We have mentioned VR techniques and the ability to employ them by coupling them to GIS Ð the following section describes VRML and solid and geometric modelling in greater detail. Proprietary Web-Based Virtual Reality Modelling Software A number of commercial vendors have developed their own proprietary modelling software. One of the most widely used of these packages has been produced by Superscape (http://www.superscape.com). Superscape's VRT software has been employed extensively in the development of the company's Virtual World Wide Web (http://www.vwww.com)
Mapping and Virtual Reality Technologies for Urban Modelling
145
FIGURE 2. The four stages of creating three-dimensional models from GIS-based data.
and in the construction of various models of superstore developments and of tourist sites such as Piccadilly circus. These models are presented in a standard Web browser but with need for a proprietary plug-in. The use of proprietary software often allows the development of innovative, highly realistic urban models on the WWW. However, the production and browsing of these models is often dependent on the purchasing of proprietary authoring software (e.g., Superscape VRT or Silicon Graphics Cosmo suite of applications) Ð as opposed to VRML which is an open standard. An obvious contrast between the open standard of VRML and the commercial alternative exists in this context. Photospatial Panoramic Views In contrast to the solid or block modelling discussed already, a number of software companies, have developed photospatial VR systems for use on a variety of operating systems. Apple's QuickTime Virtual Reality (QTVR) is characteristic of a range of WWW development tools utilising photorealistic scenes to create navigable movies. QTVR has the
146
S. Doyle et al.
largest user base with over 3,000 sites on the WWW. Realism is achieved by using photographic rendering which permits the user to pan around the scene or node. Figure 3 illustrates ``The Virtual Streetscape'' an example of the use of QTVR to model the built environment. Developed as a demonstration project of the MIT Department of Urban Studies & Planning's Computer Resource Laboratory, the Virtual Streetscape illustrates how 360 panoramic views can be linked to aerial photographs to create a linkage between more traditional, two-dimensional images and three-dimensional VR scenes. Whilst photographically rendered scenes are highly realistic, the user's viewpoint is fixed to the original location of the camera. The user is not able to ``walk'' around the scenes in the same way as in VRML though nodes can be linked allowing users to ``jump'' between scenes creating a sense of movement. Typical file sizes for QTVR are 200±300 K for each node, placing a restriction on movement as each new node is downloaded separately as the user moves around. The development of a WWW interface featuring panoramic scenes may be viewed in four distinct stages. Stage 1 consists of the data collection for each of the scenes to be created. Each scene consists of approximately 14 photographs, depending on the camera lens used. The photographs are taken, in this case using a digital camera, allowing each to overlap by approximately 5%. The images are then ``stitched'' together (Stage 2) to produce a full 360 panorama using specialist software such as Photovista (http://www.livepicture.com). Links to other scenes and Web resources can now be added (Stage 3). Once the panoramas have been produced they can then be integrated into a WWW page (Stage 4). The ``Wired Whitehall'' integrates information relating to the built environment through photospatial scenes using hot linking software by Jutvision (http://www.visdyn.com). The use of photorealistic VR scenes on the Web is increasing daily Ð in order to add extra value to
FIGURE 3. ``Virtual Streetscape'' (Computer Resource Laboratory, Department of Urban Studies & Planning, MIT).
Mapping and Virtual Reality Technologies for Urban Modelling
147
the scenes within a planning context, representations of real world objects can be placed within the panoramas. This object placement augments the actual with the proposed thus allowing an end-user to simulate or visualise proposed change in a specific location. This technique is encompassed within the broad term of AR (Tuceryan et al., 1995). AR is a technology in which a user's view of the real world is enhanced or augmented with additional information generated from a computer model. The enhancement may take the form of labels, three-dimensional rendered models or shading modifications. The uses of AR in modelling the built environment are numerous, ranging from the placement of a piece of street furniture into a photorealistic scene to the overlay of new urban form. To a limited extent, ``Wired Whitehall'' is a basic example of AR, in that virtual billboards are created within photorealistic panoramas, in order to create hyperlinks of relevance to the urban scene. For example, a virtual billboard near Downing Street allows access to the ``No. 10 Downing Street'' Web site. A degree of interactivity within the urban scene is desirable if various planning schemes are proposed. This can be achieved by combining VRML 2.0 objects and photospatial scenes Ð AR on the WWW. Figure 4 illustrates an application developed by the authors where a VRML 2.0 object is placed into a 360 panoramic image using RealVR. RealVR (http://www.livepicture.com) is a plug-in for the Netscape browser. Whilst similar to QTVR, RealVR allows the insertion of VRML 2.0 objects into scenes. Once an object has been placed, augmenting reality, the user is able to move the object into and out of the panorama. AR is an important step forward in the ability to interact and model the built environment on the WWW.
VIRTUAL WORLDS Having discussed ways in which the built environment can be modelled on the WWW, it is useful to explore the concept of virtual worlds and their ability to introduce aspects of interaction and social behaviour into the types of models already discussed. By allowing
FIGURE 4. Augmented reality on the WWW: object placement within a panoramic scene.
148
S. Doyle et al.
movement within the models we create, users can be presented with the chance to become involved with planing problems Ð for planners this facilitates consultation and also allows the planning community to interact in a common digital space in the pursuit of a design or planning solution. Within virtual worlds participants are generally represented in the model by an avatar or digital alter ego. A user's avatar may take any form, although they are usually based on human form. The user is able to control their avatar, which will dynamically update their view of the world and the other participants' avatars. The user is able to see the threedimensional world through the eyes of their avatar. This allows the user the ability to turn around and look at a fellow avatar, whist holding a conversation thus introducing a meaningful level of social interaction. The more advanced avatar systems available on the WWW also allow the use of physical personal gestures. The most advanced virtual worlds on the WWW have the following features (Rockwell, 1997): (1) (2)
insert/delete objects (e.g., avatars) in scenes at run-time; merge multiple sound streams from distributed sources into the shared scene's current ambient sound (e.g., voices over music); (3) track and communicate the state/behaviour of objects in real time; (4) allow (sets of) objects to be ``driven'' by users in real time; (5) let imported objects become persistent; (6) protect the scene from damage by imported objects; (7) assign objects to a series of different ``owners''; (8) support persistent roles (for people) and rules (for scenes); (9) link objects dynamically to external data/functions; (10) support the free exchange of information among objects. Within the realm of planning and decision making in the urban environment (or even the rural environment) these virtual worlds offer the opportunity to practice, simulate and visualise a design or planning issue in real time in a ``dry'' environment. All that is basically required is a model (a replication of a ``real-world'' space) and the ability to serve it to interested clients. A schema of how a virtual world may be organised is described in Figure 5. Virtual Worlds Ð The Five Stages of Development to Full Interactivity The creation of virtual worlds on the WWW and their ability to be used for collaborative modelling and design of the built environment may be viewed in five distinct stages, ranging from the basic HTML (Hyper Text Mark-up Language) Web site to a fully developed three-dimensional collaborative simulated urban environment. Table 1 and Figure 6, adapted from Rockwell (1997), illustrate the five stages to full interactivity in virtual worlds. Current technology lies between Stages 3 and 4, with the development of open-based standards for the development of multi-user virtual environments. There are more than 10 different software vendors developing multi-user virtual worlds (Yahoo, VR listing). There is considerable variation in their quality and functionality Ð two advanced examples are the Blaxxun and Activeworlds environments. The Blaxxun virtual environment client, CCPRO, is a free Web browser plug-in which can be downloaded from the Blaxxun Web site (http://www.blaxxun.com/); however, it is only available for Windows 95/NT platform. The client comprises three elements, the
149
FIGURE 5. Virtual worlds client/server model.
Mapping and Virtual Reality Technologies for Urban Modelling
150
S. Doyle et al. Table 1. The Five Stages Towards Full Interactivity
Stage of evolution
Description
Level of use for collaborative education/design
HTML Web site HTML site with ``chat'' ability (i.e., Internet relay chat or Java-based chat) Avatar-based graphical interface
No community development Simple anonymous text chat
Weak Ð only information available Medium Ð interaction, ability to communicate in real-life
Personal, organised and structured interactions
Strong Ð development of design/ education arenas based on property software Very strong Ð development of worldwide design/education arenas
Avatar-based 3D using open standards and interactions Avatar-based 3D/open standards/ real-time audio synchronisation
Seamless interconnection of communities and sharing of knowledge across communities Seamless interconnection of communities with natural communication
Very strong Ð design/education arenas further enhanced with realtime audio
three-dimensional view, a chat window and a control panel. The three-dimensional aspect of the system utilises VRML versions 1.0 and 2.0. The ability to interact with objects within a multi-user three-dimensional space allows the creation of what we have termed ``Virtual Internet Design Arenas'' (ViDAs). The Blaxxun CCPRO client also supports environments created using Superscape's proprietary modelling language. The second example is the ActiveWorlds browser (http://www.activeworlds.com). This is a stand-alone client application, again only available for Windows 95/NT platform. The client has a large three-dimensional view window, plus a control panel and the ``chat'' window. The largest of the ActiveWorlds virtual worlds is called Alphaworld which currently has over 200,000 registered ``residents'' who are able to build objects and structures using a simple ``cut-and-paste'' system placement process. Such activities allow the production of ``land use'' maps of Alphaworld, illustrating virtual urban sprawl in the digital environment. Over a period of 15 months over 10 million building objects were placed on the digital
FIGURE 6. Development time line of the five stages towards full interactivity for a virtual world.
Mapping and Virtual Reality Technologies for Urban Modelling
151
plain (Damer, 1998). The map provides ``teleport'' access to any area of Alphaworld simply by clicking on the desired location.
THE ``VIRTUAL DESIGN ARENAS'' INITIATIVE At CASA we are currently developing our own virtual world server, on which we can host small three-dimensional design scenarios. This will be used for experimental teaching and modelling of urban design and planning in a ViDA. The ViDA initiative will be a collaborative venture between the VENUE and On-line Planning projects, both ongoing at CASA. These projects deal with the linkage of GIS to urban design processes and visualisation (VENUE being Virtual Environments for Urban Environments) and the role of the WWW as a medium for planning support or dissemination (On-line Planning). Within the proposed ViDA initiative participants may include: (1) urban design and planning students; (2) interested academics; (3) professional planners and urban designers; (4) ordinary people in public participation experiments; (5) planners and urban designers; (6) the Internet ``general public''. By developing specific virtual worlds, design scenarios can be run in which various people can participate. Two distinct categories of design scenarios ``Virtual Real Places'' and ``Real Virtual Spaces'' will be facilitated. The first type, ``Virtual Real Places'' refers to scenarios using three-dimensional models of real world places (e.g., real developments sites in London). Whilst ``Real Virtual Spaces'' will be completely fictional models, not related to any particular real place. We believe that the three-dimensional worlds do not necessarily have to be based on physically real places to be useful in the design and planning process. In many respects it may be easier to represent the ideas of good and bad design in truly virtual spaces. Figure 7 illustrates the basic design process of the virtual world. Initially ViDA users will be asked to explore the potential of the computer-mediated virtual world, (e.g., becoming used to moving through the three-dimensional model world or using the ``chat'' tool to communicate). Users will then be presented with a series of virtual worlds to evaluate according to a set criteria. Eventually they will be presented with virtual worlds where they can modify the three-dimensional models. In this instance a range of powers of ``modification'' can be permitted such as changing building colours or textures, altering size and plot position, or removing buildings and objects (like street furniture), to creating completely new structures and layouts. Permissions can also be set in order to determine who has the power to make certain changes to the model (development control). All user activities in the multi-user worlds (avatar movement, action and ``chat'' communications) will be discretely logged on the server, thus creating extensive metadata. Analysis of this activity log plus conventional oral and written feedback, will provide interesting insights into group evaluations, design and working in virtual environments. The virtual lecture theatre will be used as a base for the users to initially meet in the virtual world and be introduced to the design concepts by a virtual lecturer.
152
S. Doyle et al.
FIGURE 7. The basic virtual design process of ViDA.
It should be stressed that the ViDA initiative is an experiment in using available multiuser world technologies in urban design. However, we have been considering some of the possibilities which may open up if the initial experiment proves the notion that virtual design and planning are viable (e.g., the possibility to construct more elaborate scenarios, with ``role play'' where different participants assume the ``roles'' of the planner, the developer, the local resident). We would also like to explore the possibilities of ``embedding'' rules into the virtual world of what can be built where. In this way, electronic planning constraints can be implemented and enforced on the designers. In some senses we would be adding a measure of intelligence to our three-dimensional world. We would also envisage the linkage of attribute data to buildings and objects in our worlds perhaps via an object-oriented database where the object identifier forms a primary key. The communication between participants could also be improved beyond ``chat'' text messages using desktop video-conferencing and ``whiteboard'' technologies. There are obviously limitations in the application of virtual worlds to urban design and planning issues. The realism required in the three-dimensional models to be effective for our purposes will needs to be fit for purpose and there may be scenarios where building textures are required or alternative scenarios where building roof morphology need to be calculated accurately. Another limitation in the three-dimensional modelling formats used by the multi-user world systems already outlined is the lack of shadows. Clearly, this will hamper the realism we can achieve in modelling the built environment where lighting is an important issue in a design. Although the clients for the multi-user world system are generally free, they are mostly exclusive to the Windows 95/NT platform. This is a limitation as many users in universities are using systems with older versions of Windows or Macintoshes. Furthermore, server software has to be bought, costing from a few
Mapping and Virtual Reality Technologies for Urban Modelling
153
hundred pounds to a couple of thousand pounds sterling. There is also the danger of becoming locked into proprietary software systems, over which authors have little development control, which can leave users at the mercy of the vendor. This can be particularly problematic with regard to the smaller vendors of Internet software which tend to have unpredictable life-spans. The communication between participants (particularly ones at geographically separate locations) is also dependent on typing text messages in a ``chat'' window. This can be problematic for carrying on in-depth, lengthy ``conversations'', especially for people not adept at typing. However there are many benefits to pursuing the virtual world as a teaching or visualisation medium, not least the connectivity offered by the WWW, in which these applications are founded. The interfaces to these user worlds are also relatively straightforward to master in terms of navigation and communication, with cursor keys or the mouse providing the control mechanism. Model creation is also becoming less complex following research in the linkage of twodimensional data in GIS to three-dimensional VRML or CAD output alluded to in previous sections (Dodge & Jiang, 1997). The models can be modified over a series of hours and readily placed on-line.
CONCLUSIONS This paper has reviewed Web-based technologies available and suitable for the planner and urban designer. The several fields have been discussed in terms of their applicability to Web-based applications relating to the urban environment, these being interactive mapping, solid, geometric modelling, photospatial panoramic views, AR and multi-user virtual worlds. The opportunity these elements allow in order to practice, simulate, visualise and conceptualise issues which relate to the urban environment have also been discussed but there are several issues arising from the potential on offer, especially in terms of current and future Web-based urban modelling. Firstly there are various restrictions in place in relation to commercial datasets and their distribution on the WWW. There are also restrictions in place in terms of confidentiality and data protection. The research which has been and will continue to be undertaken by the authors acknowledges this. The Internet mapping applications developed and described herein are all subject to these constraints relating to commercial copyright (e.g., Ordnance Survey data) and institutional sensitivities (e.g., Riverside NHS Trust) thus curtailing who outside the local area network can view the applications. Furthermore some data types do not lend themselves readily to the creation of three-dimensional models. Building polygons are difficult to extract from remotely sensed images of dense urban areas in comparison to detailed survey data. Roof morphology is also difficult to readily obtain from most commercial three-dimensional datasets. Notwithstanding these factors there is currently tremendous activity in the application of three-dimensional visualisation and linkage of GIS to VRML in the vendor and academic communities. In terms of infrastructure there is also a limitation in terms of band-width in displaying some models live over the WWW. The major casualties of this restriction are larger (i.e., 2 MB+) VRML models. Internet Map servers, Activeworlds and photo-spatial panoramas can all be reduced in file size by the authors to present a real-time interface to the relevant information. There are also costs and benefits in adopting differing software to implement the various techniques of data distribution outlined already. Whilst
154
S. Doyle et al.
there is a large amount of free software or trial shareware on offer, large organisations such as local authorities tend to discourage the unstructured use of such applications due to corporate IT policy or for security reasons. There are also resource issues in terms of storage space or hardware power and currency. Fortunately most if not all of the applications in this paper are capable of being run in a modest NT environment and as such provides a relatively low cost mechanism for development and dissemination. In terms of human factors or institutional issues there is still the need to convince people of the relevance and usefulness of embracing the digital media which are potentially powerful tools though this is common in any field where new technology is being introduced. This review paper promotes the case for the integration of digital data, GIS, VR and the Web in terms of opening up elements of planning processes. There is a huge potential for combinations of the above technologies in urban decision making and with regard to the involvement of the wider community in the decision-making process. Whilst some issues have been summarily reviewed, it is anticipated that the relevance of the emergent technologies and the WWW will have been made clearer in terms of data and model delivery and distribution with regard to the built environment.
REFERENCES Batty, M. (1997a). The Computable City. International Planning Studies, 2, 155±173. Batty, M. (1997b). Virtual Geography. Futures, 29, 337±352. Batty, M. (1998). Digital planning. In P. K. Sikdar, S. L. Dhingra, & K. V. Krishna Rao (Eds.), Computers in urban planning and urban management keynote papers (pp. 13±30). New Delhi: Narosa. Bell, G., Parsis, A., & Pesce, M. (1995). VRML: The virtual reality modelling language version 1.0 specification. In VR for the people: A brief history of VRML [Online]. Available: http://www.gnn.com/gnn/wr/sept29/ features/vrml/history.html Bishop, I. D. (1998). Planning support: Where is the system? Ð A review of developments in hardware and software. In P. K. Sikdar, S. L. Dhingra & K. V. Krishna Rao (Eds.), Computers in urban planning and urban management keynote papers (pp. 37±49). New Delhi: Narosa. Counsell, J., & Phillips, B. (1997). Appropriate data for navigable 3D cityscape interfaces to urban information systems. In S. Hodgson, M. Rumor, & J. J. Harts (Eds.), Proceedings Third JEC-EGI Vienna (pp. 298±307). Netherlands: 105 Press. Damer, B. (1998). Avatars! Exploring and building virtual worlds on the Internet. Berkeley, CA: Peachpit Press. DETR (1998). Town centres: Defining boundaries for statistical monitoring, feasibility study. London: HMSO. Dodge, M., & Jiang, B. (1997, November). Geographical information systems for urban design: Providing new tools and digital data for urban designers. Paper presented at the Learning Spaces Conference, De Montfort University, Milton Keynes [On-line]. Available: http://www.casa.ucl.ac.uk/publications/learning_spaces/ Dodge, M., Smith, A., & Doyle, S. (1997a). Urban science. GIS EUROPE, 6(10), 26±29. Dodge, M., Smith, A., & Doyle, S. (1997b). Visualising urban environments for planning and urban design. AGOCG Graphics, Visualization and the Social Sciences Workshop (Report No. 33). ESRI (1997, Spring). Introducing ArcView 3D Analyst: Powerful tools for creating, analyzing, and visualizing data in 3D on the desktop. ARCNews [On-line]. Available: http://www.esri.com/base/news/arcnews/ spring97articles/07-3d.html Faust, N. L. (1995). The virtual reality of GIS. Environment and Planning B: Planning and Design, 22, 257±268. Liggett, R., Friedman, S., & Jepson, W. (1995). Interactive design/decision making in a virtual urban world: Visual simulation and GIS. In Proceedings of the 1995 ESRI User Conference. California: ESRI. Longley, P., & Clarke, G. (Eds.). (1995). GIS for business and service planning. Cambridge, UK: GeoInformaton International. Martin, D., & Higgs, G. (1997). The visualization of socio-economic GIS data using virtual reality tools. Transactions in GIS, 1(4), 255±265. Plewe, B. (1997). GIS online: Information, retrieval, mapping and the Internet. Santa Fe, NM: OnWord Press. Ranziger, M., & Gleixner, G. (1997). GIS-datasets for 3D urban planning. In S. Hodgson, M. Rumor, & J. J. Harts (Eds.), Proceedings Third JEC-EGI Vienna (pp. 298±307). Netherlands: 105 Press. Rockwell, B. (1997). From chat to civilization: The evolution of online communities [On-line]. Available: http:// www.blaxxun.com/company/vision/cmnty.html
Mapping and Virtual Reality Technologies for Urban Modelling
155
Shiffer, M. J. (1992). Towards a collaborative planning system. Environment and Planning B, 19, 709±722. Shiffer, M. J. (1996). Community-building communications technologies and decision support systems. MIT Colloquium on Advanced Information Technology, Low-income Communities and the City. Massachusetts, USA: Massachusetts Institute of Technology, Department of Urban Studies and Planning. Smith, S. (1997, October). A dimension of sight and sound. Mapping Awareness, pp. 18-21. Toon, M. (1997). The world by your window. GIS EUROPE, 6(11), 38±41. Tuceryan, M., Geer, D. S., Whitaket, R. T., Breen, D., Crampton, C., Rose, E., & Ahlers, K. H. (1995). Calibration requirements and procedures for augmented reality (No. ECRC-95-14). Purdue University, Indianapolis: European Computer-Industry Research Centre. Von Rimscha, M. (1997). 3D or not 3D? GIS EUROPE, 6(10), 20±22.
APPENDIX A: WEB RESOURCES ActiveWorlds Blaxxun ESRI On-line Planning Hot links to the virtual worlds industry Virtual Streetscape
(http://www.activeworlds.com/) (http://www.blaxxun.com/) (http://www.esri.com) (http://www.plannet.co.uk/olp/) (http://www.ccon.org/hotlinks/hotlinks.html) (http://yerkes.mit.edu/ncpc96/home.html)