Sustainable Human–Building Ecosystems
The Power of Data Visualization: A Prototype Energy Performance Map for a University Campus Khaled A. Tarabieh1; Islam O. Elnabarawy2; Islam A. Mashaly3; and Yussra M. Rashed3 1
Assistant Professor of Sustainable Design, Construction and Architectural Engineering Department, School of Sciences and Engineering, American University in Cairo, AUC Ave., P.O. Box 74, New Cairo 11835, Egypt. E-mail:
[email protected] 2 Ph.D. Student, Computer Science Department, Missouri University of Science and Technology, 1870 Miner Circle, Rolla, MO 65409. E-mail:
[email protected] 3 Research Assistant, Construction and Architecture Engineering Department, School of Sciences and Engineering, American University in Cairo, AUC Ave., P.O. Box 74, New Cairo 11835, Egypt. E-mail:
[email protected];
[email protected] Abstract A key factor to promote energy efficiency across campus and buildings is through education and clarity of information. Energy data is complex to understand and difficult to comprehend for the majority of users. Higher education institutions consists of building groups that usually operate according to strategies pre-set by the operation teams that respond to a specific energy demand condition. The purpose of this research is to design a data friendly interface to simplify and assist in the implementation of energy literacy across campus. The research method utilized available energy metered and simulated data at the campus level provided by the university operations. A web based data visualization interface is developed and an energy map is created to inform the campus community on the status of energy consumption. In addition to visualization, the proposed interface helps operators to benchmark campus buildings, promote energy efficiency across campus and disseminate the resulting information in a simple, clear and concise way to the campus community. The interface is a great step towards change of behavior through education, a questionnaire to measure user actions and understanding is distributed to measure the effectiveness of this new approach and the results are compiled to advance the interface design and user experience. INTRODUCTION Based on recent findings in selected literature, clear building energy data proved to be the key to making better energy-based decisions. Whether this data is simulated or acquired through various meters, the usefulness of tracking it goes beyond comparative analyses and benchmarking. Before data metering and visualization became prominent, only simulated energy data could be utilized to make better energy-based decisions regarding the different building components.
© ASCE
194
Sustainable Human–Building Ecosystems
Malkawi et. al. developed a web-based user interface that employed simulated thermal data of buildings to provide an energy-based decision tool for windows by predicting its performance (Malkawi, 2007). However, as energy performance change over the lifetime of the building, energy-based decisions concerning systems and components should be included as well. Using only simulated data for buildings will hardly give a real picture of how a building is actually performing, hence in day-to-day operations, constant data feed and continuous monitoring and analysis of the actual energy data is crucial to improve energy performance and retain savings. Domínguez et al. proposed a tool to collect energy data from university buildings through data mining, monitoring and statistical techniques that led to economic savings of around 15%. The three-layer structure of the developed system started with acquiring data from campus meters, this data was stored and processed then the client was able to access it online as a monitoring interface and conduct a number of relevant statistical analyses (Domínguez, 2013). The measured energy data from campus buildings was used to calibrate simulated energy models. The calibration of simulated energy models often result in better prediction for the building’s performance and accordingly better decisions were made regarding the different building systems, therefore allowing for streamlined calculation of the impacts was done with higher precision. For example, it was possible to use collected real-time campus data, the way Dong et al. did, to develop a building energy model and calibrate it to get performance predictions within ±15% error band. Furthermore, the model was used to adjust energy consuming such as the HVAC system and achieved a high savings rate of 39% (Dong, 2014). Recently, Yarbrough et al. utilized a university campus energy data visualization and comparisons for a more specific analysis. The focus was directed to the peak energy, tracking the buildings contribution and assessing the type of activities and uses that add-up to that peak value (Yarbrough, 2015). In addition, the monitored energy data was visualized and made into a tool for comparative analyses ultimately to assist occupants’ with the required knowledge that can lead to change in behavior and accordingly in saving even more energy. A six week empirical study in a residential building on the campus of Columbia University by Jain et al. demonstrated how the interface components of the eco-feedback system influence energy consumption. The study correlated users’ engagement with different interface tools to the reduction in energy consumption (Jain, 2012). Gulbinas et al. experimented the effect of informing commercial building occupants with their energy consumption through the development of a modular socio-technical energy management system, BizWatts. This system however, only provided the real-time data of plug-load appliances. Nevertheless, the study concluded that providing the occupants with a network level eco-feedback resulted in a statistically significant energy savings (Gulbinas, 2014). Another study was conducted by Emeakaroha et al. on students residential halls, using IPTED (Integration of Persuasive Technology and Energy Delegate) and real time energy feedback energy consumption reduction in 8 halls reached 37% amounting to savings of 1360.49 kWh, and 713.71 kg of CO2 compared to the baseline (Emeakaroha, 2014). In summary, University settings represented a convenient medium to initiate energy performance tool prototype demonstration through actual energy data monitoring and visualization. Data visualization provided comparison among
© ASCE
195
Sustainable Human–Building Ecosystems
196
the different campus buildings, and as a result, it led to a more energy conscious behavior from students, faculty members, staff, and most importantly better understanding of the actual energy performance of building assets, thus improved the operation process and promoted better ways to manage resources. The emerging need by universities for clear data recently used a commercial data visualization tool such as the Building Dashboard by Lucid Design Group (Oakland, California), Energy Efficient Education Dashboard by Quality Automation Graphics (Ankeny, Iowa), or conducted studies and developed their own data analysis and visualization interface tools. The following (Table 1) is a summary of selected studies relevant to this research:
Actual energy data Simulated energy data Peak energy analysis and optimization Calibrate energy models Predicting future consumption Adjust the performance of building systems/ Operations & facility Management Detect power faults and deviations Energy/economic savings Data visualization/statistical analysis Online tool Visualized data availability for occupants Energy savings possibility by influencing occupants’ behavior
© ASCE
(Emeakaroha, 2014)
(Jain, 2012)
(Gulbinas, 2014)
(Malkawi, 2007)
(Domínguez, 2013)
(Dong, 2014)
(Yarbrough, 2015)
Table 1. Summary of the utilization schemes in selected literature
Sustainable Human–Building Ecosystems
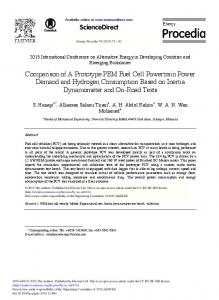
FR RAMEWO ORK Thhis paper explains e thee initial worrk on the developmen d nt of a dataa visualization daashboard thhat can bee of assistaance to booth campus operators and camppus coommunity. The structuural framew work of the data visuallization boaard is dividded innto three coomponents, the monitooring system componeent, the daata processing coomponent, and a the dataa visualization component (see Fig gure 1). Inn the first coomponent “Layer 1: Monitoring”, M the data is collected frrom two maain energy monitoring soources, the first sourcce is the university’s u m c center, whiich m monitors thee electricityy consumptiion data onn the parceels level allong with tthe ennergy used for f the chillled water inn the HVAC C systems. As A for the water w data, itt is coollected man nually by thhe universitty facilities office whicch providess daily data of w water consum mption on the t campus and buildinng levels. In the secon nd componeent “L Layer 2: Daata Processsing” the daata sorting and filterin ng and repoort generation taakes place. In I the third componentt “Layer 3: Visualizatioon”, the datta is uploadded onn the web online o throuugh a data importer i annd is compoosed of the interface and a daata importerr.
Figu ure 1. Fram mework dessign of the data visuallization pro ocess T Thhe raw dataa is presentted in user friendly deesign with comparisonn ability. The tyype of data visualized v o the website are simpple bar graphhs, pie charrts and gaugges on thhat contain energy annd water daata for each building or cluster of buildinngs “pparcel”. Thee electrical energy con nsumption is i presented d in kilowattt hour (kW Wh) annd the wateer is presennted in liteers. The tottal energy of o the whoole campus is caalculated ussing the colllected enerrgy data. Foor better beenchmarkin ng, the enerrgy by usse intensity (EUI) is pllaced at thee main hom mepage of th he website referenced r yeear, where the t EUI is the t total energy consum mption of a building divided d by the t tootal area (kW Wh/m2). Thhis kind of information i n gives the user u the abiility to realiize caampus energgy consumpption compaared to otheer campuses and buildinngs. G GRAPHICA AL USER INTERFAC I CE (GUI) DESIGN D Thhe user intterface for the system m was devveloped usin ng the Sym mphony PH HP framework, combined c w the usee of the Boootstrap CSS with S, jQuery JaavaScript, and a G Google Charrts librariess. The userr-facing weebsite was divided intto three maain seections: Ho ome, Energgy Breakdoown, and Energy Map; M in adddition to tthe © ASCE
197
Sustainable Human–Building Ecosystems
addministrativ ve backendd which can c be useed to editt the diffeerent website coonfiguration ns and uplooad the dataa into the website. w Thhe home page containss a laarge digital meter m displaying the overall camppus energy consumptio c on per year, in adddition to a color-codeed gauge too give the users u a visu ual represen ntation of the t nuumber show wn in the meter. m When n the users first view the t Home page, p they are a shhown the daata for the current c yearr, with the ability a to seelect from previous p yeaars ussing a drop p-down conttrol. In adddition to thee meter andd gauge, thee Home paage coontains a set s of charrts showingg the electtricity, watter, and co ooling enerrgy coonsumptionn for each building b in the selectedd year. Thee users havve a choice of viiewing each of thosee charts, either in baar chart fo ormat with the averaage coonsumptionn displayed as a line over o the chhart; or as a pie chartt showing tthe peercentage consumed by each of the t buildinggs for the currently c selected enerrgy tyype (see Figure 2, 3).
Figure F 2. Bar B chart with w averagee consumption display y
Figuree 3. Pie Cha art display with perceentages The homepage h aalso contain ns a control that is com mmon acrosss most pagges off the websitte, showingg the currentt month’s usage u for a single buildding, for eaach off the energyy types. Thhis data is displayed d a a color-ccoded dial gauge, as g withh a seelector that can be usedd to switch between different builldings, or piick a building att random. Every E time a page is displayed to t the userr, a differennt building is seelected at raandom and its i data is displayed in this controll. The energ gy breakdow wn © ASCE
198
Sustainable Human–Building Ecosystems
paage contain ns a similar dial gaugee control foor each buillding, with an additionnal abbility to sellect which month m to display d from m the data. This allowss the users to coompare the historic ussage data for f this buiilding acrosss differentt months (ssee Fiigure 4).
Figure 4. Data displaay using coolor-coded dial gauge In adddition to thhe dial gauuge control, the energgy breakdow wn page allso coontains a bar chart shhowing the energy connsumption of the seleected building accross all thee months off a selectedd year, withh the option n for the ussers to chooose w which year to t display. This T gives the users an a overall view v of the trends in the t buuildings’ ussage for eacch energy ty ype over thhe span of a year, and the ability to coompare betw ween these trends t acrosss different years (see Figure F 5).
Figure 5. Trends in energy con nsumption per p month Finallly, the energy map is designed d to give users a visual ov verview of tthe ennergy consuumption of the t entire caampus by displaying d a map of thee campus wiith eaach building g highlighteed in a colorr corresponnding to its energy e conssumption (ssee Fiigure 6). The T map iss available in two diffferent moddes, one illustrating tthe cuumulative energy e usagge, and anotther one inddicating thee EUI, for each building (ssee Figure 7). 7
© ASCE
199
Sustainable Human–Building Ecosystems
Figurre 6. Cumu ulative enerrgy consum mption
Fiigure 7. Bu uilding by building b eneergy use in ntensity (EU UI) The website w inttegrated mu ultiple techhnologies too reach a high h level of fleexibility annd usability, clad in a modern useer interfacee design. Thhe Symphony PH HP framew work was ussed as a baasis for the code, whicch offers a modular and a m maintainable way to devvelop the website w efficciently and allow a easy modificatioons inn the future when needded. The in nterface waas implemennted using the Bootstrrap CSS framew work, which offers flexxible and responsive usser interfacee capabilitiees, a to tthe cooupled withh the jQueery JavaScrript library,, which offfers easy access poowerful funnctionality of o JavaScriipt. The chaarts displayyed by the website weere geenerated ussing the Gooogle Chartts (gChartss) chart librrary, which h enabled the t w website to display d cleaan-looking and dynam mic charts that allow the users to innteract withh the data as a they brow wse throughh the webssite and vieew the enerrgy coonsumptionn at differentt times or fo or different energy typees. A ASSESSME ENT A suurvey was conducted to evaluaate the impportance off the enerrgy coonsumptionn data availaability to caampus users and the innfluence this availabiliity caan have onn their behavior. Also o, this survvey was ussed to asseess the userrs’ peerception too the proposed visualizzation methhod versus the t tabular format. Sixxty caampus userss took the survey s incluuding staff, faculty meembers and students. The T suurvey was divided intto three seeparate secttions, the first f contained only the t taabulated datta of the tottal energy consumptio c on of each campus c building throuugh yeear 2014, in n the secondd part the saame data waas given as a chart andd the third paart w was dedicated to the impportance of energy dataa availabilitty to all cam mpus users. e dataa tabulated and in a chart c each at a a time, tthe Lookiing at the energy suurvey takerss were requuested to staate their levvel of underrstanding off it on a scaale from 1 to 10,, 1 being haardly and 100 very clearlly. Then another questiion was givven
© ASCE
200
Sustainable Human–Building Ecosystems
too further asssess the levvel of underrstanding, the t users were asked to t state whiich buuildings scoored an “aboove averagee” energy coonsumption.
Figure 8. Level off understan nding of givven data As seeen in (seee Figure 8 above), moost users fo ound the chhart easier to innterpret, unllike the spreead sheet. The T weighteed average level l of undderstandingg is 9 for the charrt and 6 for the tabulateed data.
d tabulated d data repreesentation Figure 9. Chart and The users weree asked “W Which buiildings scoored an abbove averaage coonsumptionn?” and werre given tabbulated datta once and d chart dataa next. Maany ussers (see Figure 9) failled to identtify the corrrect answerr, only 58.3% and 63.33% piicked buildiings F and I respectiv vely. Buildinng C, being g just below w the averaage coonsumptionn was trickyy, thirteen reegarded it as a above avverage whilee viewing tthe taabulated datta, and only two users while w viewiing the charrt. Using thee charted daata (ssee Figure 10), 1 the useers picked buildings b F and I as thhe building gs with highher thhan average energy connsumption with w a rate of o 96.5% an nd 90% resppectively. The T ovverall resullts showed that the charts are better b repreesentation of o the enerrgy coonsumptionn data, most users could d fully undeerstand charts better thaan tables. Any A coonfusion thaat may occuur in cases like l buildingg C, will bee eradicated d by the use of innteractive chharts which give better insight on the t data shoown.
© ASCE
201
Sustainable Human–Building Ecosystems
F Figure 10. Buildings B haaving an ab bove average energy consumptio c on accordin ng to users’ choiices CONCLUSIION In thiis paper, wee have dem monstrated a new energgy visualizaation tool thhat caan serve as educationaal tool for the t campus communityy and potenntially impaact beehavior by promoting better wayys to learn the energy y performannce issues on caampus. Th he early feedback fe frrom the campus c co ommunity support daata viisualization. The futurre developm ment of thhe dashboarrd will be to includee a caampus operaation decisiion support interface thhat integratee simulated building b daata, acctual and prredicted dataa per academ mic year as shown in (see Figure 11). The errror inn predictionn should be b minimizzed in the future as a result of o continuoous reefinement off the simulaated modelss of campus buildings.
Figure 11. Propossed decision n support in nterface R REFERENC CES M Malkawi, A.,, and Srinivvasan, R. (20007). “Enerrgy based deecision supp port system for faacilities mannagement: inntegration of o data/web mining, kn nowledge baase
© ASCE
202
Sustainable Human–Building Ecosystems
and thermal simulation.” Proceedings of Building Simulation, the International Building Performance Simulation Association (IBPSA). Jain, R. K., et al. (2012). “Assessing eco-feedback interface usage and design to drive energy efficiency in buildings.” Energy and buildings, 48, 8-17. Domínguez, M., et al. (2013). “Power monitoring system for university buildings: Architecture and advanced analysis tools.” Energy and Buildings, 59, 152160. Dong, B., et al. (2014). “Development and calibration of an online energy model for campus buildings.” Energy and Buildings, 76, 316-327. Emeakaroha, A., et al. (2014). “Integrating persuasive technology with energy delegates for energy conservation and carbon emission reduction in a university campus.” Energy, 76, 357-374. Gulbinas, R., et al. (2014). “BizWatts: A modular socio-technical energy management system for empowering commercial building occupants to conserve energy.” Applied Energy, 136, 1076-1084. Yarbrough, I., et al. (2015). “Visualizing building energy demand for building peak energy analysis.” Energy and Buildings, 91, 10-15. Building Dashboard. Lucid Design Group. Accessed 5 June 2015. . Energy Efficient Education Dashboard. Quality Automation Graphics. Accessed 5 June 2015. .
© ASCE
203