Water 2014, 6, 961-975; doi:10.3390/w6040961 OPEN ACCESS
water ISSN 2073-4441 www.mdpi.com/journal/water Article
The Prediction Methods for Potential Suspended Solids Clogging Types during Managed Aquifer Recharge Xinqiang Du, Yunqing Fang, Zijia Wang *, Jiawei Hou and Xueyan Ye Key Laboratory of Groundwater Resources and Environment, Ministry of Education, Jilin University, Changchun 130021, China; E-Mails:
[email protected] (X.D.);
[email protected] (Y.F.);
[email protected] (J.H.);
[email protected] (X.Y.) * Author to whom correspondence should be addressed; E-Mail:
[email protected]; Tel.: +86-431-8850-2850; Fax: +86-431-8850-2850. Received: 17 February 2014; in revised form: 24 March 2014 / Accepted: 11 April 2014 / Published: 22 April 2014
Abstract: The implementation and development of managed aquifer recharge (MAR) have been limited by the clogging attributed to physical, chemical, and biological reactions. In application field of MAR, physical clogging is usually the dominant type. Although numerous studies on the physical clogging mechanism during MAR are available, studies on the more detailed suspended clogging types and its prediction methods still remain few. In this study, a series of column experiments were inducted to show the process of suspended solids clogging process. The suspended solids clogging was divided into three types of surface clogging, inner clogging and mixed clogging based on the different clogging characteristics. Surface clogging indicates that the suspended solids are intercepted by the medium surface when suspended solids grain diameter is larger than pore diameter of infiltration medium. Inner clogging indicates that the suspended solids particles could transport through the infiltration medium. Mixed clogging refers to the comprehensive performance of surface clogging and inner clogging. Each suspended solids clogging type has the different clogging position, different changing laws of hydraulic conductivity and different deposition profile of suspended solids. Based on the experiment data, the ratio of effective medium pore diameter (Dp) and median grain size of suspended solids (d50) was proposed as the judgment index for suspended solids clogging types. Surface clogging occurred while Dp/d50 was less than 5.5, inner clogging occurred while Dp/d50 was greater than 180, and mixed clogging occurred while Dp/d50 was between 5.5 and 180. In order to improve the judgment accuracy and applicability, Bayesian method, which considered more ratios of medium pore diameter (Dp) and different level of grain diameter of
Water 2014, 6
962
suspended solids (di), were developed to predict the potential suspended solids types. Keywords: managed aquifer recharge; suspended solids; physical clogging
1. Introduction With the background of global water scarcity, actively promoting water reuse and excess water storage technology helps solve the problem of groundwater and surface water shortage attributed to uncertain climatic factors. Managed aquifer recharge (MAR) is one of the most effective methods to augment the groundwater resources [1–3]. It may form part of conjunctive use schemes, or be applied to increase water availability and improve water quality. Conventional recharge water resources including native groundwater, potable water and surface water were primarily used in MAR. In recent years, with the growing interest in non-conventional resources, quality and health issues have been raised [4]. Improvements to water quality via MAR have been demonstrated to reduce organic matter [5,6], trace organic compounds [7], nitrogen [8]. Bacteria and virus transport during MAR is another one major concern with using recycled water [9–11]. The water quality change and its related health risks still are the main topics for MAR researches. Clogging issue has been another main limited factor for the implementation of MAR around the world. According to the investigation on 207 groundwater recharge systems in Maryland, USA, the rate of loss function system attributed to clogging increased to 50% in 1990 from 33% in 1986 [12]. Clogging is generally caused by inter-dependent mechanisms that are often hard to distinguish [13–15]. The classification of clogging into physical, chemical and biological processes is quite standard [16]. The role of suspended particles in clogging was recognized early and was often evidenced as the main clogging mode during MAR process [17–19]. It has been observed to depend on the total mass of suspended solids and particle size distribution of the porous media with reduction in basin recharge rates well described by an exponential decay function [20]. The main source of suspended solids mainly comes from recharge water and may also generates from aquifer matrix because of hydrodynamic and hydrochemical function [21,22]. The mechanisms of suspended solids clogging including filtration and deposition function. Modified fouling index (MFI) was mainly used to assess clogging potential of artificial recharge well [23]. Turbidity and concentration of suspended solids of recharge water are the main two common water quality indexes to assess potential of clogging [24,25]. But the judgment criterion for suspended solids clogging is still not uniform. Siriwardene NR et al. (2007) showed that physical clogging was mainly caused by the migration of sediment particles that are less than 6 μm in diameter [26]. Okubo and Matsumoto (1983) showed that physical clogging problems would not occur if the suspended solids (SS) level of recharge water utilized for ASR is 25 mg/L [22]. The recommend limitation of TSS < 100 mg/L was proposed by Winter (2013) [28]. These experiments were conducted to study the MAR clogging problem from the perspective of the nature of suspended solids and do not comprehensively consider the properties of porous media. Thus, the proposed criteria are mostly applicable at limited field conditions. This article was tried to give a more detailed classification for
Water 2014, 6
963
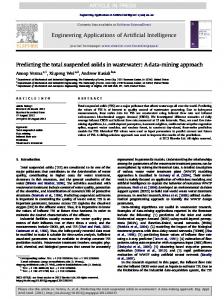
suspended solids clogging and propose prediction methods to predict the potential clogging types. This would be helpful to prevent and control suspended solids clogging during MAR design and operation. 2. Materials and Methods 2.1. Lab-Based Approach A MAR laboratory experimental system included four parts: water supply tank with circulation function (includes a submersible pump with a maximum pump head of 5 m and maximum output 5500 L/h), upper and lower constant-head controller for water supply and drainage (adjustable range is 0 to 1.5 m), experimental seepage column (580 mm in height and with 80 mm inside diameter and is made of Plexiglas), and pressure observation panel. Piezometer tubes were distributed along the experimental column (Figure 1). Figure 1. Schematic diagram of aquifer recharge managed simulated system.
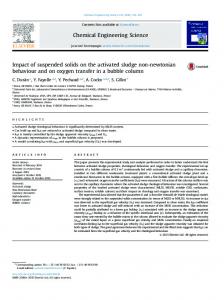
Highly purified Quartz sand and river sand (predominant mineral composition was quartz, with a small amount of feldspar) were adopted as the infiltration medium. The columns were packed with quartz sand in increments of 1cm according to its natural density of 1.6 g/cm3. The suspended solids were collected from lowlands of a field site after a storm event. The particle diameter distribution was measured by TCZ-4 particle analyzer and showed in Figure 2. The coarse particles of diameter greater than 0.1 mm were removed because this part is easily to removal by pretreatment. All the selected suspended solids samples were mixed together. X-ray diffraction (XRD) pattern showed that dominant mineral composition is quartz, Alkali feldspar and Plagioclase (Table 1). The ultra-purified water was produced by machine of ELGA Option R7 and the main characteristics are as follow: TSS = 0 mg/L, TDS = 0 mg/L to 2 mg/L. The recharge water adopted in these lab experiments was mixed sieved suspended solids and ultra-purified water with total suspended solids (TSS) equals to 1000 mg/L and total dissolved solids (TDS) equals to 4 mg/L to 6 mg/L.
Water 2014, 6
964 Table 1. Mineralogy of suspended solids.
Sample No. Quartz Alkali feldspar Plagioclase Calcite Illite-smectite mixed-layer Illite Kaolinite Amphibole
SS1 37 11 20 8 6 12 5 1
SS2 42 16 23 3 2 8 5 1
SS3 46 17 21 4 2 6 3 1
SS4 47 22 22 4 0 0 4 1
SS5 38 11 18 4 4 15 9 1
SS6 43 14 30 2 3 5 3 0
SS7 56 10 21 4 3 2 4 0
SS8 47 14 22 8 4 0 4 1
SS9 49 15 21 6 0 6 3 0
Figure 2. Particle diameter distribution of suspended solids.
The recharge water was feed up from a water tank to the upper constant head controller, flow throughout the column and then discharge via the lower constant head controller. The columns were initially flushed for 4 h with purified water before the experiments to clear any potential pollutants in the infiltration sand. During the operation period, a submersible pump was placed at the bottom of water tank and was used to continuously feed water into the upper constant-head water level controller; the water infiltrated through the columns at a hydraulic gradient of 1. Surplus water overflowed from the upper level controller and was recycled into the water tank. The flow rate and hydraulic head along the infiltration path were observed every 2 h or 4 h manually. TDS was measured using a Multi-parameter Water Quality Portable Meter every 2 h. TSS of inflow and outflow was measured using a PARTECH 740 monitor every 2 h. The time-varying hydraulic conductivity at different positions of the sand columns was calculated based on Darcy’s law (Equation (1)): K=
Ql πr 2 Δh
(1)
where Q (m3/d) is the flow rate; l (m) is the distance between any two piezometric tubes along the column; Δh (m) is the hydraulic head difference at a distance of l; and r (m) is the inner diameter of the column. The clogging degree at different position can be expressed by the ratio of hydraulic
Water 2014, 6
965
conductivity (K) and its initial hydraulic conductivity (K0). If the value of K/K0 is less than 1, that means clogging has happened at the specific time and specific position. At the end of experiment, the sand in column was excavated one centimeter at a time. The suspended solids were separated from each sand sample through the procedures of wash, separation, drying and weight. Seventeen experiments (Table 2) were conducted to simulate the suspended solids clogging process. Coarse sand (I) (sieve number 10 to 20), coarse sand (II) (sieve number 20 to 40), medium sand (sieve number 40 to 70), fine sand (sieve number 70 to 150), and mixed sand (sieve number 20 to 150 with equal amounts of fine sand, medium sand, and coarse sand (II)) were adopted as the infiltration medium. The grain diameters of suspended solids in recharged water were 0.075 mm to 0.05 mm, 0.05 mm to 0.0385 mm, less than 0.0385 mm, and less than 0.013 mm. Table 2. Ratios of infiltration medium effective pore diameter (Dp) and levels of suspended solids grain diameter (di). Experiment
Medium and Dp
No.
(mm)
E2
Coarse sand (I), 0.453
E4
di (mm)
Dp/d10
Dp/d20
Dp/d30
Dp/d40
Dp/d50
Dp/d60
Dp/d70
Dp/d80
Dp/d90