process editing and statistical process/device simulation. PREDITOR is implemented ..... /CCC Transactions on Electron Devices, Vol. ED-27, August 1980, pp.
The PREDITOR Process Editor and Statistical Simulator D. M. H. Walker, C. S. Kcllcn, A. J. Strojwas Department of Electrical and Computer Engineering Carnegie Mellon University Pittsburgh, PA 15213-3890 ABSTRACT This paper describes the PREDITOR process editor and slatisiical simulator. PREDITOR provides interactive process editing and statistical process/device simulation. PREDITOR is implemented using the Chip Database (CDB), a 3-D geometry and field database for representing the results of IC process and device simulation. A process step abstraction pwnnits the details of database access and the simulation model to be hidden from the process flow m;mipulation tools. This makes it possible to add external simulators such as SAMPLE and SUPREM-IV to the list of possible process and device simulation models, with only local changes to the PREDITOR code. Using fast analytical models, process simulation and device parameter extraction for a CMOS inverter takes 1.3sec on a DECstation 3100.
1. Introduction Dcvclopmcni of a new iniegraied circuit technology requires the development of unit process steps and process synthesis. Process synthesis requires both the specification of a process flow, or recipe that defines the sequence of unit process steps used during fabrication, and the device topography defined by the lithographic masks. In order to minimize the amount of physical experimentation and reduce the time required to develop a new technology, technology computer-aided design (TCAD) tools such as process and device simulators have been developed. TCAD tools were originally developed independently of each other, using their own input and output file formats, and simulation control. However in order to accelerate process and device development, it is necessary to integraijc multiple process and device simulators into & framework so that the simulators can easily communicate. A standard technology CAD framework has been proposed to lie together the various asf)ects of process and device simulation, such as data representation, data conversion, visualization, and simulation control [1]. A key aspect of the TCAD framework is the need to describe the wafer state during process and device simulations. This wal'er stale includes the fabricated geometrical structures and fields such as doping profiles, and is known as the semiconductor wafer representation (SWR). There are several existing SWR implementations [2, 3] based on the Profile Interchange Format (PIF) [4]. A standard for an SWR database interface is under development [5]. Early efforts in developing integrated process/device simulation tools include SIMPL [6], which provided an environment for interactive 2-D process/device simulation, and the Process Engineer's Workbench (PEW) f7j. PEW provided an interactive environment for developing the process flow and mask set, and then compiling it into a process supervisor for use in the FABRICS II statistical process/device simulator [8]. An important part of the PEW system was a database for representing the 3-D structure of the chip. PEW and its geometry database had a number of limitations, such as the difficulty of interfacing third-party process and device simulators, and the inability to represent mesh descriptions of fields. In response, the Chip Database (CDB) was developed to address these problems, and to provide a flexible semiconductor wafer representation database that could easily accommodate representation needs of new process and device simulation models. The PREDITOR process editor and statistical simulator was developed using CDB. PREDITOR combines the features of both PEW and FABRICS in providing both a process editing and statistical process/device simulation capability. In the following sections we first describe PREDITOR and its use of the CDB database, give some PREDITOR examples and performance data, and conclude with directions for future work.
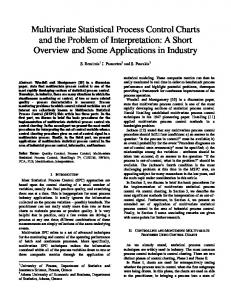
2. The PREDITOR System PREDITOR (PRocess EDITOR) is a process editor and statistical process/device simulator. Process flows can be iiiicraciively specified and both nominal and statistical process/device simulations performed. Simulation results can be viewed in a variety of ways including cross-sections and graphs. The organization of PREDITOR is shown in Figure 1. The CDB databa.sc [91 provides the basic 3-D geometry and field representations necessary to store the wafer stiile. CDB is organized to provide fast access to support analyticiil models and statistical simulation. At the same time, it is general enough to accommodate numerical simulation models. The surface of the wafer is broken into rectangular regions. Within each region is a unique stack of layers and fields, along with surface descriptions defining the iiiicrfacc between layers. All the objects in the daliibasc can have name-value attributes attached to them, providing
120
menus
2-D graphs
forms
/
crosssections] mask editor
t STEPS
PREDITQR
y
histograms scattergrams
~ )
t CDB ^xtensloJD CCDB
D
Fig. 1: PREDITOR Organization database extensibility. CDB extensions are provided as needed to accommodate new simulation models. Examples of such extensions include new mesh types, such as a triangular mesh, and new surface model types, such as piecewise linear or cubic spline. The basic unit manipulated by PREDITOR is the process step. The STEPS module provides an abstract data type for process steps. A process step is a parameterized simulation routine such as a process simulation step or data extraction step. Data extraction steps are treated as equivalent to process simulation steps so that they can be inserted into the process recipe for taking the equivalent of in-line measurements. This module provides facilities for creating and editing process steps, assembling them into process recipes, and editing the recipes. These recipes can then be executed to modify the database or extract information from it. New process steps are made known to the system by writing step models. The step model is a data type which contains information about step parameters such as parameter names, types, units, and default parameter values, as well as a simulation routine to call with the parameter values when the step is executed. For example, once the data structure for an ion implant step is specified, one can create an implant step using the Implant Model by simply calling: ~ imp_stcp = CDB_Step_Create(Implant_Modcl); This creates an Implant step and sets the parameters (dopant, dose and energy) with the default values. The parameters can be modified using the data access functions in the step model. Once the parameters are set, the step can be executed using: CDB_Step_Executc(imp_step); By using the STEPS module, the process simulation and data extraction routines can all have a common interface to the system. Since the process flow parser, file writer and graphical editors do not have to be modified with the addition of new types of processing steps, new steps can be easily added. A menu/forms-based process flow editor uses the STEPS module to specify a process. A simple mask editor permits the user to specify the artworic associated with the lithography steps. A process/device simulator then executes this process flow using the appropriate simulation models. After the simulaUon is performed, the user can examine the data stored in the CDB database. This can be done a number of ways: • Print the values of the attributes (global or region-specific) using the attributes' "Print" function. • Display the surface of the chip using different colors for the different surface materials. • Plot the doping profiles in a given region. • Plot a cross-sectional view along a cut line. • Extract a doping profile mesh along a cut line and display the carrier concentration and electric field meshes returned by the Poisson solver. • Print the values of the extracted device parameters. • Plot the I-V curves of the extracted devices. Once the user is satisfied with the nominal process/device simulation, the process can be simulated statistically. This is done by perturbing the process step input parameters using a normal distribution and user-supplied variances. The device parameters for each simulation are then stored for analysis. After a statistical simulation, the user can:
121
• Print the device parameters for a particular run. • Print the means, variances, maximum or minimum of the device parameters. • Display a histogram of a device parameter. • Display a scattergram comparing two device parameters. • Write the statistical information out to a file for further analysis. PREDITOR currently combines the capabilities of both PEW and FABRICS. The STEPS module was used to encapsulate the FABRICS simulation routines, so PREDITOR is able to provide all the process editing and interactive simulation capabilities of PEW as well as the statistical simulation capabilities and performance of FABRICS. Additional simulation routines have been written to take advantage of the flexibility of CDB and its extensions. Examples include a 2-D small-geometry MOSFET device model and a Poisson equation solver that both make use of a 2-D rectangular mesh of doping concentrations. The SAMPLE topography simulator [10] has also been interfaced. This required extending CDB to include piecewise linear surfaces. These same CDB extensions arc used to represent the geometrical structures generated by SUPREM-IV [11]. The modular structure of PREDITOR makes it possible to quickly add new CDB data types and new simulation models. For example, the SAMPLE interface was developed in only two person-weeks. This effort consisted of writing a piecewise linear surface model extension to CDB, and writing a wrapper for SAMPLE in order to accept simulation inputs from PREDITOR and store simulation results in CDB.
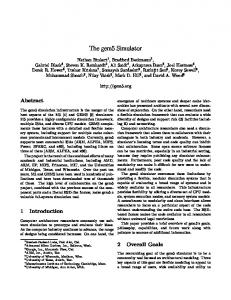
3. PREDITOR Examples To illustrate the use of PREDITOR, a 48-stcp CMOS process was entered and the three mask levels (well, active area, polysilicon) for an inverter were defined using the menus and forms of the user interface. A cross-section of the N-channel device is shown in Figure 2. A histogram of the N-channel threshold voltage is shown in Figure 3. Samples 20 -
^
.i^4==—
'•i
\
xV
^i
15
-
10
-
—16 1*1'^
15
111
IS
0.815 0.825 0.835
Fig. 2: Cross-scciion (5.6^1 wide) of an N-channcl transistor after source-drain implant. The gate-definition resist was not stripped so that it would be visible here. The resist profile was generated by SAMPLE 1.6A.
Vth
Fig. 3: Histogram of N-channcl transistor threshold voltage. The simulation used 100 samples, with standard deviations of 3 degrees on all temperatures, and 10% on all limes, diffusivitics and implant doses and energies.
4. PREDITOR Performance PREDITOR has been run with three example process flows to gather performance information. The processes arc: • NMOS - a self-aligned NMOS process with 20 simulation steps and two masks which define an enhancement transistor. • CMOS - a CMOS process with 48 simulation steps and three masks which define an inverter. • Bipolar - a bipolar process with 47 simulation steps and six masks which define an inverter. Process simulation and device parameter extraction times for the three example process flows are shown in Table 1. These limes arc on a DECslalion 3100. The CMOS and bipolar process simulation times are significantly larger than the NMOS simulation time due to the incrciiscd number of process steps, and the increased number of masks, which results in more regions. For each process step, database access time lakes 14-34% of the CPU time. These overheads may seem large until one considers that these figures are for fast analytical models which involve only the evaluation of simple functions. For numerical simulation, the database access lime would be insignificant. Due to ilic comer-sliiched data structure, tlie time to randomly access a region grows as V^ for N regions. For a typical CMOS inverter and industrial process How, with about 2(X) regions, the random access time to any one region is
122
0.3ms. In actual process simulation with analytical models, neighboring regions are examined one after the other, so the region access time is the cost of a pointer dereference. For statistical simulation, all temperatures were varied with a standard deviation of 3 degrees, and all times, diffusivities, and implant doses and energies were varied with a standard deviation of 10%. The 100-sample simulation times for the different process flows were: NMOS 28.1 sec CMOS 127.2 sec Bipolar 155.6 sec The distribution of N-channcl threshold voltage in the CMOS process is shown in Figure 3. The amount of memory used is highly dependent on the number of regions generated and the size of the attributes stored there. In the example process flows, only analytical doping profiles are used, so no mesh information is stored. The size of the database for these examples is shown in Table 2. For complete industrial process flows, a p-well CMOS inverter takes an average of 180KB of memory, 300KB worst-case, depending on how many regions are created by the mask set. An advanced bipolar inverter takes an average of 187KB of memory, 324KB worst-case. These figures assume analytical doping profiles.
Procass
Stapa
NMOS CMOS Bipolar
20 48 47
Simulation Tlma (sac) with without axtractlon axtractlon 0.28 1.30 1.57
0.085 0.470 0.510
Procaas
Databasa Slza (bytas)
Raglons
NMOS CMOS Bipolar
8120 37400 51300
13 34 54
Table 2: Database Size for Example Processes
Table 1: PREDITOR Simulation Times
5. Conclusions Experience with PREDITOR has been very promising. It achieves the interactive process editing functionality of the Process Engineer's Workbench and the statistical simulation speed of FABRICS. We have demonstrated how ihird-party simulators such as SAMPLE and SUPREM-IV can be integrated into the system as alternative simulation models. In the future work will focus on integrating more simulators and new simulation models, a more modular user interface, and changes to CDB, such as the use of the Hierarchical Chip Database (HCDB) to handle large designs. PREDITOR will also track the Technology CAD Framework standardization efforts.
6. References II] |2j 13] 141 15] 16] |7] 18] 19] 110] III]
D. S. Boning, cd.. "Technology CAD Pramcwork Archiiccturc", Tech. report S90013, Scmiconducior Research Corporation, May 1990. A. S, Wong and A. R. Ncurculher, "The Intcrtool Profile Interchange ronmat: A Technology CAD Environment Approach", Tech. report C90361, Semiconductor Research Corporation, July 1990. D. S. Boning. M. L. Hcytens and A. S. Wong, "The Intertool Profile Interchange Format: A Unified Data Stnjcturing and Management Approach", submitled to IEEE Transactions on CompMer-Aided Design of Integrated Circuits and Systems, July 1990. S. G. Duvall, "An Interchange Pormat for Process and Device Simulation", IEEE Transactions on Computer-Aided Design of Integrated Circuits and Systems, Vol. 7, No. 7, July 1988, pp. 741-754. A. Wong and W. Dietrich (ed.), "Semiconductor Wafer Architecture Document V0.66", Tech. report CFI Documenl tll62 (TCAD-90G-1), CAD Framework Initiative, December 1990. K. Lee and A. R. Neureuther, "SIMPL-2: (Simulated Profiles from the Layout - Version 2)", IEEE Transactions on Computer-Aided Design of Integrated Circuits and Systems, Vol. 7. No. 2, February 1988, pp. 160-167. A. J. Strojwas and S. W. Director, "The Process Engineer's Workbench", IEEE Journal of SolidStale Circuits,\o\. SC-23, No. 2, April 1988, pp. 377-386. S. R. Nassif, A. J. Strojwas and S. W. Director, "FABRICS II; A Statistically Based IC Fabrication Process Simulator", IEEE Transactions on Computer-Aided Design of Integrated Circuits and Systems, Vol, CAD-3, No. 1, January 1984, pp. 40-46. D. M. II. Walker, C. S. Kcllen, and A. J. Strojwas, "A Semiconductor Wafer Represcntaiion Database and Its Use in the PREDITOR Process Editor and Statistical Simulator", Proceedings of the 28th ACM/IEEE Design Automation (DA) Conference, IEEE, June 1991. W. G. Oldham, A. R. Neureuther. C. Sung, J. L. Reynolds, and S. N. Nandgankar. "A General Simulator for VLSI Lithography and Etching Processes: Part II - Application to Deposition and Etching". /CCC Transactions on Electron Devices, Vol. ED-27, August 1980, pp. 1455-1459. M. E. Law and R. W. Dutton, "Verification of Analytic Point Defect Models Using SUPREM-IV", IEEE Transactions on Computer-Aided Design of Integrated Circuits and Systems, Vol. 7, No. 2, February 1988, pp. 181-190.
This work was supported by SEMATECH under contract 89-MC-511.
123