a strong emphasis on the outcome of the process modeling act by analyzing the ... presumably dependent on the process followed to create the process model.
University of Innsbruck Department of Computer Science
Dissertation
The Process of Process Modeling Jakob Pinggera
submitted to the Faculty of Mathematics, Computer Science and Physics of the University of Innsbruck in partial fulfillment of the requirements for the degree of “Doktor der Naturwissenschaften”
Advisor: Assoc.-Prof. Dr. Barbara Weber
Innsbruck, 2014
Abstract Business process models have gained significant importance due to their critical role for managing business processes. In particular, process models support the common understanding of a company’s business processes, enable the discovery of improvement opportunities, and serve as drivers for the implementation of business processes. Still, a wide range of quality problems have been observed. For example, literature reports on error rates between 10% and 20% in industrial process model collections. Most research in the context of quality issues of process models puts a strong emphasis on the outcome of the process modeling act by analyzing the resulting model. However, it is rarely considered that process model quality is presumably dependent on the process followed to create the process model. This thesis strives for addressing this gap by specifically investigating the process of creating process models. In this context, different actions on several levels of abstraction might be considered, including elicitation and formalization of process models. During elicitation information is gathered, which is used in formalization phases for actually creating the formal process model. This thesis focuses on the formalization of process models, which can be considered a process by itself—the Process of Process Modeling (PPM). Due to the lack of an established theory, we follow a mixed method approach to exploratively investigate the PPM. This way, different perspectives are combined to develop a comprehensive understanding. In this context, we attempt to address the following research objectives. First, means for recording and performing a detailed analysis of the PPM are required. For this, a specialized modeling environment— Cheetah Experimental Platform (CEP)—is developed, allowing a systematic investigation of the PPM. Further, a visualization for the PPM, i.e., Modeling Phase Diagrams (MPDs), is presented to support data exploration and hypotheses generation. Second, we attempt to observe and categorize reoccurring behavior of modelers to develop an understanding on how process models are created. Finally, we investigate factors that influence the PPM to understand why certain behavior can be observed. The findings are condensed to form a model on the factors that influence the PPM. Summarized, this thesis proposes means for analyzing the PPM and presents initial findings to form an understanding on how the formalization of process models is conducted and why certain behavior can be observed. While the results cannot be considered an established theory, this work constitutes a first building block toward a comprehensive understanding of the PPM. This will ultimately improve process model quality by facilitating the development of specialized modeling environments, which address potential pitfalls during the creation of process models.
Zusammenfassung Die Wichtigkeit von Gesch¨ aftsprozessmodellen hat in den letzten Jahren signifikant zugenommen, da selbige essentiell f¨ ur das Verst¨andnis von Gesch¨aftsprozessen einer Firma sind. Des Weiteren erlauben Gesch¨aftsprozessmodelle die Identifizierung von Verbesserungsm¨ oglichkeiten und treiben die Implementierung der betrieblichen Gesch¨aftsprozesse voran. Interessanterweise finden sich jedoch in betrieblichen Sammlungen von Gesch¨ aftsprozessmodellen zahlreiche Fehler. In der Literatur werden Fehlerraten zwischen 10% und 20% beschrieben. Forschung im Bereich der Qualit¨at von Gesch¨aftsprozessmodellen fokussiert gr¨oßtenteils auf das Produkt der Prozessmodellierung. Es wird hierbei jedoch vernachl¨assigt, dass die Qualit¨at von Prozessmodellen von dem Prozess der Entstehung des jeweiligen Modells beeinflusst wird. In dieser Arbeit wird versucht diese L¨ ucke, durch Fokussieren auf den Erstellungsprozess von Gesch¨ aftsprozessmodellen, zu schließen. Die Erstellung von Prozessmodellen kann in verschiedene Phasen unterteilt werden. Zum einen existiert eine Phase zur Erhebung von Anforderungen, und zum anderen, eine Phase zur Ausarbeitung des Prozessmodells. In dieser Arbeit wird auf die Ausarbeitung des Modells fokussiert, dem sogenannten Prozess der Prozessmodellierung (PPM). Da im Kontext des PPM auf wenige Vorarbeiten zur¨ uckgegriffen werden kann, wird in dieser Arbeit ein explorativer Ansatz gew¨ahlt, bei welchem quantitative und qualitative Analysen kombiniert werden. Dies erlaubt die Analyse von multiplen Perspektiven welche durch Methodentriangulation zu einem Gesamtbild zusammengef¨ uhrt werden. Hierbei, werden die folgenden Forschungsfragen behandelt. Zum Ersten wird versucht den PPM aufzuzeichnen und Techniken f¨ ur dessen Analyse zu entwickeln. Hierf¨ ur wird ein Programm entwickelt, dass gezielt auf die Anforderungen des PPM eingeht — Cheetah Experimental Platform (CEP). Des Weiteren wird eine Visualisierung f¨ ur den PPM vorgestellt, welche die Datenanalyse unterst¨ utzt, sogenannte Modeling Phase Diagramme (MPDs). Im n¨achsten Schritt wird versucht wiederkehrende Verhaltensweise zu dokumentieren um zu verstehen wie Prozessmodelle erstellt werden. Im letzten Schritt werden Faktoren, welche die Ausarbeitung von Prozessmodellen beeinflussen, untersucht. Auf diesem Weg soll gekl¨art werden warum die beobachteten Verhaltensweisen auftreten. Die Ergebnisse werden in einem initialen Modell zur Beschreibung des PPM zusammengef¨ uhrt. Diese Dissertation beschreibt Techniken zur Analyse des PPM und erste Erkenntnisse aus mehreren Modellierungseinheiten. Das erarbeitete Modell kann hierbei jedoch nicht als fertige Theorie bezeichnet werden, sondern stellt einen ersten Schritt zu einem detaillierten Verst¨ andnis des PPM dar. Auf lange Sicht hoffen wir, dass das Verstehen des PPM die Entwicklung von intelligenten Modellierungsumgebungen, welche die Qualit¨ at von Prozessmodellen verbessern, erm¨oglicht.
Acknowledgements The last few years have been a fascinating journey and learning experiences for me. In this sense, I would like to thank several people, who have supported me over the years. I would not be able to complete this journey without their continuous support. I would like to thank my supervisor Barbara Weber. Thank you for giving me the opportunity and time to develop my own research interests and letting me choose my own topic for this thesis. Working on a topic I am truly committed to made this journey a lot more enjoyable. I would also like to thank you for your continuous support during all stages of this PhD. I would also like to thank Stefan Zugal, who had a tremendous influence on me. I probably would have never pursued a PhD without the prospect of sharing a great work environment. Thank you for the countless discussions regarding work and life in general, the less serious talks, the newly invented words and the great leisure time on mountain tops. This brings me to the people standing behind me for so many years. In this context, I would like to thank my parents for providing me with every opportunity in life and supporting me for the last thirty years. Thank you for never questioning my choices and letting me make my own mistakes. I would also like to thank Stefanie Berster, who has been on my side on this journey we call life for so many years. There are countless things I would like to thank you for and I would still forget about several more. Thank you for helping me up when I fall down, pushing me when necessary, and enjoying the good times together. Thank you for providing me with a home I cherish to go to at night and for all the other little things you do day in, day out. During this PhD I had to pleasure to work with so many great people. Thank you Pnina Soffer, Manfred Reichert, Matthias Weidlich, Dirk Fahland, Pierre Sachse, Marco Furtner, Markus Martini, and everyone else not mentioned explicitly for all the inspiring discussions. Among this group I would like to single out Hajo Reijers, who I consider not only a colleague, but also a friend. Thank you for challenging me in new sports like Padel and Squash and introducing me to the pleasures of Whisky. Further, I am thankful for the funding provided by the Doktoratsstipendium aus der Nachwuchsf¨ orderung and the Austrian Science Fund. Last but not least, I would like to thank everybody, who takes the time to read my tiny contribution to science, which constitutes the essence of my work of the last five years.
Eidesstattliche Erkl¨ arung Ich erkl¨are hiermit an Eides statt durch meine eigenh¨andige Unterschrift, dass ich die vorliegende Arbeit selbst¨ andig verfasst und keine anderen als die angegebenen Quellen und Hilfsmittel verwendet habe. Alle Stellen, die w¨ortlich oder inhaltlich den angegebenen Quellen entnommen wurden, sind als solche kenntlich gemacht. Die vorliegende Arbeit wurde bisher in gleicher oder ¨ahnlicher Form noch nicht als Magister–/Master–/Diplomarbeit/Dissertation eingereicht.
Innsbruck, Juli 2014 Jakob Pinggera
Contents 1 Introduction 1.1 Problem statement . . . . . . . . . . . . . . . . . . . . . . . . . . . . 1.2 A framework for Process of Process Modeling research . . . . . . . . 1.3 Contribution . . . . . . . . . . . . . . . . . . . . . . . . . . . . . . .
1 4 6 8
2 Research Method
13
3 Related work 3.1 Quality frameworks and process model quality . . 3.2 Process model development lifecycle . . . . . . . . 3.3 Process of Process Modeling . . . . . . . . . . . . . 3.4 Tool support for process modeling . . . . . . . . . 3.5 Related research techniques in conceptual modeling
. . . . .
. . . . .
. . . . .
. . . . .
. . . . .
. . . . .
. . . . .
17 17 18 19 20 21
4 Background 4.1 Cognitive foundations of the Process of Process Modeling 4.1.1 Limitations of the human mind . . . . . . . . . . . 4.1.2 Overcoming the limitations of the human mind . . 4.2 Process of programming . . . . . . . . . . . . . . . . . . . 4.2.1 Problem understanding . . . . . . . . . . . . . . . 4.2.2 Method finding / problem decomposition . . . . . 4.2.3 Solution specification . . . . . . . . . . . . . . . . . 4.3 Summary . . . . . . . . . . . . . . . . . . . . . . . . . . .
. . . . . . . .
. . . . . . . .
. . . . . . . .
. . . . . . . .
. . . . . . . .
. . . . . . . .
23 24 24 25 29 30 30 31 31
. . . . .
. . . . .
. . . . .
5 Recording the Process of Process Modeling 5.1 Research outline . . . . . . . . . . . . . . . . . . . . . . . . . . . . . 5.2 RQ1.1 : How can modeling session be conducted in a controlled manner? 5.2.1 A configurable modeling environment . . . . . . . . . . . . . 5.2.2 Components supporting the execution of modeling sessions . 5.2.3 Logging the experimental workflow . . . . . . . . . . . . . . . 5.3 RQ1.2 : How can Process of Process Modeling instances be recorded? 5.3.1 Logging interactions with the modeling environment . . . . .
33 35 36 37 40 40 43 43
5.4 5.5
5.3.2 Supporting the analysis of Process of Process Modeling instances 43 Evaluation . . . . . . . . . . . . . . . . . . . . . . . . . . . . . . . . . 45 Summary . . . . . . . . . . . . . . . . . . . . . . . . . . . . . . . . . 46
6 Analyzing the Process of Process Modeling 6.1 Research outline . . . . . . . . . . . . . . . . . . . . . . . . . . . . . 6.2 A description of the Process of Process Modeling . . . . . . . . . . . 6.2.1 Problem understanding . . . . . . . . . . . . . . . . . . . . . 6.2.2 Method finding . . . . . . . . . . . . . . . . . . . . . . . . . . 6.2.3 Modeling . . . . . . . . . . . . . . . . . . . . . . . . . . . . . 6.2.4 Reconciliation . . . . . . . . . . . . . . . . . . . . . . . . . . . 6.2.5 Validation . . . . . . . . . . . . . . . . . . . . . . . . . . . . . 6.3 Modeling Phase Diagrams . . . . . . . . . . . . . . . . . . . . . . . . 6.3.1 Detecting phases of the Process of Process Modeling . . . . . 6.3.2 Visualizing the Process of Process Modeling . . . . . . . . . . 6.4 Validation . . . . . . . . . . . . . . . . . . . . . . . . . . . . . . . . . 6.4.1 M S1 : Problem understanding, method finding, and validation 6.4.2 M S2 : Modeling and reconciliation . . . . . . . . . . . . . . . 6.4.3 Demonstration . . . . . . . . . . . . . . . . . . . . . . . . . . 6.5 Discussion . . . . . . . . . . . . . . . . . . . . . . . . . . . . . . . . . 6.5.1 RQ1.3 Which activities do modelers perform during the Process of Process Modeling? . . . . . . . . . . . . . . . . . . . . 6.5.2 RQ1.4 How can Process of Process Modeling instances be analyzed and visualized? . . . . . . . . . . . . . . . . . . . . . . 6.5.3 Limitations of Modeling Phase Diagrams . . . . . . . . . . . 6.6 Summary . . . . . . . . . . . . . . . . . . . . . . . . . . . . . . . . . 7 Process of Process Modeling Behavior Patterns 7.1 Research outline . . . . . . . . . . . . . . . . . . . . . . . . . . 7.2 Gaining initial insights into the modeler’s behavior . . . . . . . 7.2.1 Transitions between Process of Process Modeling phases 7.2.2 Conclusion . . . . . . . . . . . . . . . . . . . . . . . . . 7.3 Data Collection . . . . . . . . . . . . . . . . . . . . . . . . . . . 7.3.1 Subjects . . . . . . . . . . . . . . . . . . . . . . . . . . . 7.3.2 Objects . . . . . . . . . . . . . . . . . . . . . . . . . . . 7.3.3 Instrumentation and data collection . . . . . . . . . . . 7.3.4 Execution of the modeling session . . . . . . . . . . . . 7.3.5 Data validation . . . . . . . . . . . . . . . . . . . . . . . 7.3.6 Data analysis . . . . . . . . . . . . . . . . . . . . . . . .
. . . . . . . . . . .
. . . . . . . . . . .
49 51 53 55 55 56 57 58 58 58 62 64 66 74 84 86 86 87 88 90
91 . 92 . 94 . 94 . 97 . 98 . 98 . 99 . 99 . 100 . 100 . 104
7.4
7.5
7.6
7.7
Data exploration . . . . . . . . . . . . . . . . . . . . . . . . . . . . . 7.4.1 Process of Process Modeling instance duration . . . . . . . . 7.4.2 Process of Process Modeling phases . . . . . . . . . . . . . . A catalog of Process of Process Modeling Behavior Patterns and the influence of modeler–specific factors . . . . . . . . . . . . . . . . . . 7.5.1 Problem understanding . . . . . . . . . . . . . . . . . . . . . 7.5.2 Method finding . . . . . . . . . . . . . . . . . . . . . . . . . . 7.5.3 Modeling . . . . . . . . . . . . . . . . . . . . . . . . . . . . . 7.5.4 Reconciliation . . . . . . . . . . . . . . . . . . . . . . . . . . . 7.5.5 Validation . . . . . . . . . . . . . . . . . . . . . . . . . . . . . 7.5.6 Error resolution . . . . . . . . . . . . . . . . . . . . . . . . . . Discussion . . . . . . . . . . . . . . . . . . . . . . . . . . . . . . . . . 7.6.1 RQ2.1 : Which Process of Process Modeling Behavior Patterns can be identified based on the modelers’ interactions with the modeling environment? . . . . . . . . . . . . . . . . . . . . . 7.6.2 RQ3.1 : Which modeler–specific factors influence the occurrence of Process of Process Modeling Behavior Patterns? . . 7.6.3 Limitations of M S3 . . . . . . . . . . . . . . . . . . . . . . . Summary . . . . . . . . . . . . . . . . . . . . . . . . . . . . . . . . .
8 Styles in business process modeling 8.1 Research outline . . . . . . . . . . . . . . . . . . . . . . . . . . . 8.2 Data collection . . . . . . . . . . . . . . . . . . . . . . . . . . . . 8.2.1 Subjects . . . . . . . . . . . . . . . . . . . . . . . . . . . . 8.2.2 Objects . . . . . . . . . . . . . . . . . . . . . . . . . . . . 8.2.3 Instrumentation and data collection . . . . . . . . . . . . 8.2.4 Execution of the modeling session . . . . . . . . . . . . . 8.2.5 Data validation . . . . . . . . . . . . . . . . . . . . . . . . 8.2.6 Data analysis . . . . . . . . . . . . . . . . . . . . . . . . . 8.3 Clustering . . . . . . . . . . . . . . . . . . . . . . . . . . . . . . . 8.3.1 Clustering of the Pre–Flight task . . . . . . . . . . . . . . 8.3.2 Clustering of the NFL Draft task . . . . . . . . . . . . . . 8.4 Factors influencing modeling style . . . . . . . . . . . . . . . . . 8.4.1 Cluster movement . . . . . . . . . . . . . . . . . . . . . . 8.4.2 Stability of measures . . . . . . . . . . . . . . . . . . . . . 8.5 Discussion . . . . . . . . . . . . . . . . . . . . . . . . . . . . . . . 8.5.1 RQ2.2 : Can distinct modeling styles be identified? . . . . 8.5.2 RQ3.2 : How is the Process of Process Modeling influenced task–specific factors? . . . . . . . . . . . . . . . . . . . . .
104 105 108 109 109 113 116 119 130 132 135
136 137 139 140 141 142 144 144 144 145 146 146 148 150 150 160 168 169 172 175 175
. . . . . . . . . . . . . . . . . . . . . . . . . . . . . . . . by . . 176
8.6
8.5.3 Limitations of M S4 . . . . . . . . . . . . . . . . . . . . . . . 177 Summary . . . . . . . . . . . . . . . . . . . . . . . . . . . . . . . . . 178
9 Discussion and future research directions 9.1 RQ1 : How can the Process of Process Modeling be investigated? . . 9.2 RQ2 : How do modelers create process models? . . . . . . . . . . . . 9.3 RQ3 : How do modeler–specific and task–specific factors influence the Process of Process Modeling? . . . . . . . . . . . . . . . . . . . . . . 9.4 Limitations . . . . . . . . . . . . . . . . . . . . . . . . . . . . . . . . 9.5 Future work . . . . . . . . . . . . . . . . . . . . . . . . . . . . . . . .
179 179 180
10 Summary
189
A Appendix A.1 M S1 : A.2 M S2 : A.3 M S3 : A.4 M S4 : A.4.1 A.4.2 B Appendix B.1 M S2 : B.1.1 B.2 M S3 : B.2.1 B.3 M S4 : B.3.1 B.3.2
Problem understanding, method finding, and validation Modeling and reconciliation . . . . . . . . . . . . . . . Process of Process Modeling Behavior Patterns . . . . Styles in business process modeling . . . . . . . . . . . Pre–Flight modeling task . . . . . . . . . . . . . . . . NFL Draft modeling task . . . . . . . . . . . . . . . .
Modeling and reconciliation . . . . . Tests for normal distribution . . . . Process of Process Modeling Behavior Tests for normal distribution . . . . Styles in business process modeling . Tests for normal distribution . . . . Tests for cluster validation . . . . . .
. . . . . . . . . . . . Patterns . . . . . . . . . . . . . . . . . . . . . . . .
. . . . . . .
. . . . . . .
. . . . . . .
. . . . . . .
. . . . . .
. . . . . . .
. . . . . .
. . . . . . .
. . . . . .
. . . . . . .
181 184 185
. . . . . .
191 191 192 192 194 194 194
. . . . . . .
197 197 197 198 198 200 200 208
C Appendix 215 C.1 Publications . . . . . . . . . . . . . . . . . . . . . . . . . . . . . . . . 215 C.2 Abbreviations . . . . . . . . . . . . . . . . . . . . . . . . . . . . . . . 216 C.3 Process of thesis writing . . . . . . . . . . . . . . . . . . . . . . . . . 217 Bibliography
221
Chapter 1 Introduction Business Process Management (BPM) has been widely adopted in industry within the last decades and advanced to one of the most sustainable management approaches [7, 224]. This leaves hardly any room for doubt regarding the practical relevance of BPM [273]. For instance, [7] reports that more than 80% of the leading organizations worldwide have been concerned with some kind of BPM program. The strengthened interest in BPM has triggered substantial research efforts [211], while the increasing demand in BPM professionals [7, 108], has facilitated the adoption of BPM in many of today’s university curricula [209]. Business process modeling, which can be considered an area of conceptual modeling, constitutes a pre–requisite for organizations that wish to engage in BPM initiatives [116]. Therefore, it is not surprising that business process interests are the driving force behind four of the top six reasons to engage in conceptual modeling [45]. Business processes can be described as a set of connected activities that collectively realize a certain business goal [213, 295]. In order to capture business processes, business process models, or process models for short, are used, describing the activities, events, and control flow logic of a business process [42, 211] in a graphical way [116, 311]. Additional information regarding goals, data, and performance metrics might also be included in the process model [116, 211]. In general, business process models can be found in a variety of different entrepreneurial domains including insurance, refunding of travel expenses, but also more flexible domains like healthcare [311]. Further, process models can help to obtain a common understanding of a company’s business processes [12, 221], facilitate inter–organizational business processes [309], and support the development of different types of information systems including process–aware information systems [59], service–oriented architectures [66, 203], and web services [162]. Due to their widespread use, process models need to be easy to understand, especially when utilized for requirements documentation and communication [269]. This is underlined by the findings of [116], who report that an improved and consistent understanding of business processes is one of the core benefits of business process
1
modeling. Similarly, [130] identified a direct and measurable impact of a good understanding of process models on the success of any process modeling initiative. Still, process models display a wide range of quality issues impeding their comprehensibility and hampering their maintainability [160, 289, 290]. In this context, several reports on quality issues in process model collections exist. For instance, [131] describes a catalog of typical process modeling errors collected from hundreds of process models. In a similar vein, errors in the SAP reference model are analyzed in [153] and errors in a collection of industrial process models are described in [227]. Further, [160] reports on error rates between 10% and 20% in industrial process model collections. Clearly, a detailed investigation on quality problems in process models is in demand. Quality issues of process models fall into the dimensions of syntactic, semantic, and pragmatic quality [136, 149]. Syntactic quality refers to the correct usage of the modeling language. For instance, syntactic errors include violations of the soundness property, e.g., deadlocks1 . Semantic quality refers to the extent a process model represents real world behavior. This includes validity, i.e., statements in the model are correct, and completeness, i.e., the model contains all relevant statements. Typical errors at this level are missing or superfluous activities. Pragmatic quality can be described as the correspondence of the model with the people’s interpretation of the model. This is typically operationalized by assessing the process model’s understandability [136, 138]. In this context, considerable research has been conducted. For instance, [215] investigates the influence of model complexity on understandability. Similarly, [214] analyzes the effect of modularity. The influence of grammatical styles of activity labels, is presented in [156], and [238] describes an experiment on the impact of secondary notation on process model understandability. Further, [163] presents a framework to assess the perceptual properties of notations. Moreover, [2] provides prediction models regarding usability and maintainability of process models. The gained insights were cumulated to form empirically grounded guidelines for process models [157], describing process model smells that hamper process model understandability. Examples of process model smells found in process model collections (cf. [289]) are non–intention revealing names of activities [156, 289], redundant process fragments [58, 103, 289], overly large or unnecessary complex process models [51, 58, 157, 254], and edge crossings [201]. Most research regarding the quality of process models can be attributed to two major streams of research. On the one hand, strong emphasis is put on the product 1
2
In this thesis, soundness is attributed to the syntactic layer [145, 206]. It should be noted that alternative views exist, assigning soundness to the semantic layer or the pragmatic layer (cf. [140, 250]).
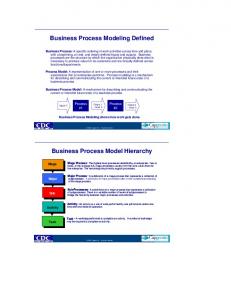
Elicitation
Formalization Product of process modeling Process of Process Modeling (PPM)
Figure 1.1: Process development lifecycle
or outcome of the process modeling act, e.g., [91, 153, 156, 157, 249, 271]. For this category of research, the resulting model is the object of analysis. On the other hand, works—instead of dealing with the quality of individual models—focus on the characteristics of modeling languages, e.g., [137, 138, 163, 170, 210, 245]. However, these studies hardly consider that process model quality is presumably dependent on the process followed for creating the process model. This is underlined by findings of [30], identifying a connection between a structured style of modeling and the process model’s quality. When investigating the processes followed for creating process models, several different actions on different levels of abstraction can be identified. For instance, in [111] the lifecycle of process model development is defined as an iterative and collaborative process. The lifecycle comprises the two phases of elicitation and formalization, typically involving several stakeholders, i.e., domain experts and system analysts. Figure 1.1 illustrates the process development lifecycle. During elicitation, information is extracted by domain experts. Thereby, domain experts usually generate and validate statements about the domain, resulting in the conceptualization of the requirements [251]. Existing research regarding elicitation considers good communication between stakeholders, i.e., avoiding misunderstandings, and effective negotiation processes, i.e., for resolving conflicts between stakeholders, to be of uttermost importance [44, 60, 71, 86, 135, 169, 218, 222]. The information extracted during elicitation is then used during formalization for creating the formal process model and validating it [112]. This is usually done by systems analysts (or process modelers in our context). The formalization of process models, in turn, can be considered a process by itself —the Process of Process Mod-
3
eling (PPM). While several works regarding the elicitation of process models exist, e.g., [44, 60, 71, 86, 135, 169, 222], little research has been conducted explicitly focussing on the formalization of process models [251].
1.1 Problem statement This thesis tries to address this gap by developing an understanding of the formalization of process models. For this, the PPM is investigated in an explorative manner. In this context, two aspects of the PPM are of interest. On the one hand, an understanding on how process models are created needs to be developed. This might include the identification of different activities within the PPM, but also the observation and categorization of modeling behavior. On the other hand, having established an understanding of the PPM, the question arises why certain modeling behavior can be observed. Put differently, which factors influence the creation of process models. For instance, the modeler’s prior modeling experience can be assumed to have an impact on how the process model unfolds on the modeling canvas. Ultimately, the long–term goal of this stream of research is to obtain a comprehensive understanding of the PPM, which can be exploited to support modelers during the creation of process models. For instance, personalized modeling environments adapting to the current task might be envisioned. Therefore, the central research statement for this thesis can be formulated as follows. How are process models created during the Process of Process Modeling and which factors influence the Process of Process Modeling? Subsequently, this research statement is refined to form the main research questions of this thesis. In contrast to research on the quality of process models, i.e., the product of the PPM, this research cannot rely on existing process model collections, since these collections contain only models without the corresponding formalization phases—called PPM instances in the sequel. Put differently, in order to be able to analyze the PPM, all intermediary versions of a process model need to be available for data analysis. Therefore, means for recording PPM instances in a fine–grained manner constitute a pre–requisite for analyzing the PPM. Consequently, the first step of this thesis is to develop means for recording PPM instances, constituting the foundation for research on the PPM. Second, a series of intermediary versions of a process models is tedious to analyze, since difficulties in gaining an overview of PPM instances make comparisons between PPM instances challenging. Consequently, gaining insights into the modelers’ behavior remains difficult. This hurdle
4
might be cleared by developing a graphical representation for PPM instances, since diagrams are known to support perceptual inferences [144] and are well suited for exploring data [68]. Such a visualization could therefore be useful to gain insights into the creation of process models, supporting data exploration and generating hypotheses. Consequently, the first research question for this thesis can be formulated as follows. RQ1 : How can the Process of Process Modeling be investigated? The developed visualization builds the basis for analyzing modeling behavior, allowing to investigate similarities and differences between PPM instances. In an attempt to develop an understanding on how process models are created, such variations in modeling behavior might be documented and categorized. For this purpose, a catalog of reoccurring patterns of behavior can be developed, documenting similarities in PPM instances of individual modelers. For this purpose, qualitative and quantitative research methods might be combined to triangulate toward a comprehensive understanding of the PPM. For instance, think aloud techniques might be useful to gain initial insights, while quantitatively analyzing PPM instances using inferential statistics might help to generalize initial findings. Further, the question arises whether differences in modeling behavior can be combined to detect distinct modeling styles. Therefore, the second research question can be defined as follows. RQ2 : How do modelers create process models? Having established differences regarding the modeler’s behavior, the question arises why certain behavior occurs. The modeler’s behavior might be influenced by several factors. For instance, it seems reasonable to assume that the modeling task influences how the process model is created, e.g., a more difficult task might cause an increase in the number of deleted elements. Further, modeler–specific factors, e.g., modeling experience, might affect the creation of process models. For example, prior modeling experience could influence how fast modelers can create the process model. This aspect is addressed in the final research question of this thesis. RQ3 : How do modeler–specific and task–specific factors influence the Process of Process Modeling?
5
Before outlining how these research questions are addressed in this thesis, a framework for categorizing PPM research is sketched. Using this framework, the research conducted in this thesis can be put into perspective by specifying the aspects under investigation.
1.2 A framework for Process of Process Modeling research As indicated in RQ3 , several factors might influence the creation of process models. Subsequently, we2 present three categories of factors that might influence the PPM, i.e., circumstantial factors, modeler–specific factors, and task–specific factors. Based on this classification, Section 1.3 describes the factors investigated in this thesis. Circumstantial factors can be considered to be independent of the individual modeler or the modeling task, but are nevertheless important for the success of a modeling initiative, e.g., management support, team orientation, or project championship (cf. [225, 281]). In this thesis, the focus is put on circumstantial factors that can be expected to have a direct effect on the formalization of process models. For instance, management support is essential for success of a modeling initiative, but the influence on a specific PPM instance might be limited. Subsequently, circumstantial factors that might influence the PPM are presented. (1) Setting The formalization of the process model can be done in different settings. For instance, a process model might be created by a single modeler or as a collaborative effort including several people, e.g., [218]. (2) Purpose Modeling might be conducted for a variety of purposes, including documentation, execution, or discussion. For each modeling purpose, different demands in terms of process model quality might be considered [15]. For instance, while syntactic quality issues are critical for process execution, they might be neglected for process models that are primarily used for discussion. Consequently, the modeling purpose might influence the PPM. Naturally, the individual modeler executing the modeling task influences how the process model unfolds on the modeling canvas. In this context, the following three modeler–specific factors might be considered. 2
6
During the creation of the publications building the foundation of this thesis and the thesis itself, the author is indebted to continuous feedback, suggestions and discussions guiding this work (cf. Appendix C.1). To express the author’s gratitude, we instead of I is used for the remainder of the thesis.
(1) Modeling experience Experience with business process modeling is known to influence the understanding of process models, e.g., [155, 159, 214, 238]. Therefore, it seems reasonable to assume that prior experience regarding the modeling language and process modeling in general might influence the PPM. In this context, it seems notable that research on the understanding of process models established that modeling knowledge for a specific modeling notation can be transferred to other modeling notations using the same modeling paradigm, e.g., imperative modeling languages [208]. (2) Domain knowledge Similarly, domain knowledge is known to influence the understanding of conceptual models [125, 126]. Consequently, we might expect an influence of prior knowledge regarding the modeling task’s domain on the PPM. (3) Cognitive characteristics Cognitive characteristics of the modeler might impact process model creation. For example, modelers with higher working memory capacity might be able to exploit this advantage during the PPM [234], creating process models of higher quality (cf. Chapter 4). Finally, task–specific factors should influence the creation of process models. This includes properties of the notational system, i.e., the notation utilized for creating the process model and the modeling environment, and the modeling task itself.
(1) Notation The modeling notation used for creating the process model might influence the PPM. For instance, creating a process model using Declare [182] might differ from modeling the same process using BPMN [174]. (2) Modeling environment Research on programming languages suggests that notations need to be evaluated in combination with the programming environment [89]. Similarly, the features of the modeling environment should be considered [207]. For instance, when creating a process model, the existence of automated layout support might influence the PPM, since modelers using the automated layout support are relieved from the burden of laying out the process model manually. (3) Modeling task Naturally, the factual properties of the modeling task, e.g., the complexity of the modeling task, should impact the creation of the process model. Additionally, the presentation of the task, e.g., in form a textual description, might influence how the PPM unfolds (cf. [178]).
7
1.3 Contribution This section describes the contribution of this thesis. For this purpose, a classification of this work in terms of the framework introduced in Section 1.2 is presented. Then, the research performed in this thesis is outlined. Further, limitations regarding the generalization of the results and future research directions are briefly discussed. Finally, the structure of the thesis is sketched.
Classification In the context of understanding the PPM, several different scenarios might be envisioned. For instance, understanding the formalization of a process model by a single modeler differs significantly compared to the same task executed in a collaborative setting. This results in different demands on how the PPM is investigated. For instance, in the context of a collaborative setting, conversations protocols need to be analyzed, which is not the case for a single modeler setting. In order to be able to perform a detailed analysis, we limit the scope of this thesis to a setting, where individual modelers create process models with the purpose of documenting the respective process. In total, four modeling sessions are described in this thesis, labeled M S1 to M S4 . Since modelers in practice are often not expert modelers [195], no special demands in terms of domain knowledge or modeling experience are imposed on the participants in these modeling sessions. The participants are only required to be moderately familiar with process modeling. While this might limit the generalizability of the results to expert modelers, the use of a convenience sample [61] allows to conduct modeling sessions with large numbers of subjects, i.e., students. By using larger sample sizes during the modeling session, it seems reasonable to assume that the participating subjects are representative for the modeling community in terms of cognitive characteristics, e.g., working memory capacity. The modeling tasks are taken from different domains to allow the investigation of task–characteristics while the complexity of the modeling task is balanced with the demands of the specific modeling session. The modeling tasks are presented to the participants in form of a textual description, allowing us to compare the PPM instances of several modeler. Regarding the notational system used throughout this thesis, we utilize a subset of BPMN for process modeling and a modeling environment providing a basic feature set. This is reasonable since practitioners frequently rely on a small subset of BPMN [322]. Further, modelers who are not experts in BPMN might benefit from using a subset of BPMN as they should be capable of creating process models without being overwhelmed by the complexity of the notational system.
8
Method In order to address RQ1 , means for recording PPM instances need to be developed. For this purpose, different approaches might be envisioned. For instance, videotaping the modeling sessions and manually analyzing the video recordings could be applied. Unfortunately, this approach is not practicable for analyzing larger number of PPM instances. Further, on a long–term basis, we envision to support modelers during the creation of process models by means of tools adapting to specific situations during the PPM. Such tools, in turn, require the possibility of analyzing the PPM during the creation of the process models, which is not possible when using, e.g., video recordings. Therefore, we develop a specialized modeling environment named Cheetah Experimental Platform (CEP). CEP allows the efficient analysis of the PPM by recording all interactions with the modeling environment. This way, the recorded PPM instance can be replayed without interfering with the modeler, building the foundation for this research. Further, CEP allows to configure the modeling environment in order to control the influence of the notational system on the PPM. In order to support data exploration, we build upon insights from cognitive psychology and the process of programming—a process arguably sharing similarities with the PPM—to identify and visualize different activities within the PPM. For this purpose, a description of the PPM is derived, which is used to develop an algorithm to generate a visualization of PPM instances based on the modelers’ interactions with the modeling environment, i.e., Modeling Phase Diagrams (MPDs). The description of the PPM and MPDs are validated in two modeling sessions utilizing think aloud (cf. [65]) and eye movement analysis. The MPDs are used to support the identification of reoccurring PPM Behavior Patterns (PBPs). For this purpose, M S3 is conducted with more than 100 participants. The resulting catalog of PBPs describes differences between modelers in terms of how process models are created, contributing to answering RQ2 . Additionally, connections of PBPs to the modelers’ demographic data are established to investigate the influence of modeler–specific factors, i.e., modeling experience and domain knowledge, on the PPM. This way, we contribute to answering RQ3 . Finally, M S4 is conducted to investigate task–specific factors influencing the PPM. In contrast to M S3 , each modeler performs two modeling tasks to be able to investigate task–specific factors, addressing RQ3 . This is complementary to the previous analysis, which focuses on modeler–specific factors. Additionally, we investigate whether difference between modelers can be aggregated to modeling styles. For this purpose, cluster analysis is utilized, resulting in the identification of three clusters, representing distinct modeling styles. By using cluster analysis, we complement the identification of PBPs by approaching the analysis of modeling behavior from a different perspective, allowing us to triangulate toward a more comprehensive understanding on how process models are created. This way, the identification of
9
modeling styles contributes to RQ2 . Contribution This thesis constitutes a first step toward gaining a comprehensive understanding of the PPM. For this purpose, we present CEP, a specialized modeling environment for analyzing the PPM. Building on this foundation, a description of the PPM is presented and MPDs, a visualization for PPM instances, are proposed. Using this visualization, we are able to identify differences in modeler behavior and trace those differences to factors influencing the PPM. More specifically, similarities in the modelers’ behavior are documented by presenting a catalog of PBPs. The occurrence of PBPs are connected to modeler–specific factors, i.e., domain knowledge and modeling experience. Further, we identify three distinct modeling styles using cluster analysis. By using two different modeling tasks, task–specific factors are investigated. The findings are condensed to a model, which can guide future research directions regarding the PPM. At this point, it should be noted that several parts of this thesis have been published in a more condensed form in the past. In these publications, the author had the pleasure to work with several colleagues. It should be noted that the author was leading all publications that were used as a basis for this thesis. Details on the contributions of other authors to these papers and a list of all publications are presented in Appendix C.1. Limitations As for every empirical study, several limitations regarding the generalization of the results apply. First, this thesis focuses on developing an understanding regarding the formalization of process models in a single modeler setting. In this context, elicitation is not investigated. Differences regarding the formalization of process models might exist when requirements are developed in dedicated elicitation sessions. Similarly, a textual description is used throughout the modeling sessions to convey domain information to the participants, who develop a formal process model to document the given domain description. This cannot be considered representative for a modeling task in practice, where a textual description might not be available. Further, the notational system used in all modeling sessions consists of a modeling environment with a basic feature set using a subset of BPMN. This might not be representative for real–world modeling sessions where a sophisticated feature set might be available to modelers. Finally, the participants in the modeling sessions were not expert modelers. Even though [113, 199, 228] argue that software engineering students might be considered to be an adequate model for the professional population in the domain of software engineering, other works have identified considerable differences, e.g., [8]. Therefore, the results should not be blindly generalized
10
to expert software engineers [259]. Similarly, the results of this work should not be generalized to the modeling community at large due to the expected differences in terms of domain knowledge and modeling experience. Future work Future work could extend this research into various directions. For example, cognitive characteristics are not examined in this thesis. For instance, [234] identified a connection between working memory capacity and modeling performance. Similarly, other cognitive constructs might be related to the creation of process models. Further, additional perspectives on the PPM should be explored. For instances, the cognitive load, i.e., the mental load for performing a task, during the creation of the process model could be exploited for identifying challenging aspects during the creation of process models. Thesis structure The remainder of this thesis is structured as follows. Chapter 2 describes the research methods used in this thesis. Then, Chapter 3 presents related work and Chapter 4 introduces cognitive backgrounds including the process of programming. CEP is presented in Chapter 5. In Chapter 6, a description of the PPM and a visualization supporting data analysis, i.e., MPDs, are introduced. Chapter 7 presents a catalog of PBPs and investigates the connection to modeler–specific factors. Task–specific factors influencing the PPM are investigated in Chapter 8 and distinct modeling styles are presented. Chapter 9 discusses the findings of this thesis and outlines future research directions. Finally, this thesis is concluded with a brief summary in Chapter 10.
11
Chapter 2 Research Method When deciding on a research method, the most basic question to answer is whether the research should be deductive or inductive. Deductive approaches start with an existing theory, which is utilized to form research questions and derive hypotheses. These hypotheses are tested in empirical studies, e.g., controlled experiments [41]. Inductive approaches, in turn, aim at extracting information from the world to develop an understanding that explains the underlying phenomena [14]. Therefore, inductive research starts by gathering information in terms of interviews or observations, which are formed into categories or themes. The developed themes and categories are then utilized to develop theories or patterns [41]. In this context, patterns can be understood as interconnected thoughts or parts, which are linked to a whole [41]. As indicated in Chapter 1, this thesis focuses on gaining an understanding of the PPM and investigating factors that influence how the PPM unfolds. Consequently, this thesis is clearly of explorative nature. By conducting modeling sessions, the modelers’ behavior can be observed, which can then be aggregated to PBPs describing the modelers’ behavior. Therefore, this thesis can be considered as inductive research. Depending on how the problem is approached, theory can play different roles. In the context of deductive research, theory is usually the starting point which is put to the test in experiments [41]. In inductive research, developing a theory could be the goal of the research efforts, or theory could be used for guiding the research efforts [41]. In this context, theory might provide a theoretical lens for analyzing the collected data [41]. In this thesis, theory can be considered to guide the investigations. In particular, insights from cognitive psychology and the process of programming are utilized to derive a description of the PPM. Based on this description of the PPM, MPDs are developed to support the data analysis. This way, the data can be investigated using the theoretical insights derived from the process of programming. This thesis puts a strong emphasis on empirical investigations conducted to develop an understanding of the PPM, which are intended to explore a new domain [14].
13
For this purpose, this thesis builds upon a series of modeling sessions, which can be described as observational studies, i.e., no treatment is applied [14]. The modeling sessions described in this thesis are all conducted in vitro, i.e., in a laboratory under controlled conditions [14]. M S1 describes a modeling session using think aloud [65] intended to identify the cognitive phases of the PPM. M S2 complements M S1 by analyzing the modelers’ interactions with the modeling environment using eye movement analysis. This way, M S1 and M S2 contribute to the validation of the means for analyzing the PPM, which are developed in this thesis (cf. Chapter 6). According to the classification in [14], M S1 and M S2 are of descriptive nature, describing observations made during the modeling sessions. M S3 builds upon the findings of M S1 to identify different PBPs and investigates modeler–specific factors influencing the occurrence of PBPs (cf. Chapter 7). Finally, distinct modeling styles are discovered in M S4 using cluster analysis and the influence of task–specific factors on the PPM is investigated (cf. Chapter 8). Therefore, M S3 and M S4 can be considered as correlational, i.e., investigating the connection between independent variables and dependent variables. In this thesis, we apply a mixed–method approach [41], combining qualitative and quantitative research methods. Details on qualitative, quantitative, and mixed– method approaches are presented subsequently. Qualitative methods Qualitative research methods have been introduced in social sciences in order to understand the complexities of humans, including communication and understanding [261]. In this context, open–ended questions are asked, since qualitative research methods are well suited for understanding phenomenon where little prior research has been conducted [41]. Applying qualitative research methods results in detailed data [41, 239], which is often represented using images or text instead of numbers [41, 83]. Consequently, qualitative research methods are well suited to investigate how and why the phenomenon under investigation occurs. In the context of this thesis, we apply think aloud [65] to investigate the PPM in M S1 . In particular, we record the verbal utterances of participants, which are then coded against the description of the PPM. This way, we are able to gain deep insights into the problem solving processes of the participating subjects [248]. Quantitative methods In contrast to qualitative research methods, quantitative research methods put a strong focus on quantifying relationships [41]. For this purpose, empirical investiga-
14
tions with larger number of subjects are conducted [41]. In this context, observations are made by relying on numerical measures [41]. This way, statistical analysis procedures can be applied [41, 301, 302] to, e.g., perform group comparisons [301, 302]. It should be noted that qualitative and quantitative approaches do not exist in isolation but rather on a spectrum of research approaches [41]. Further, quantitative and qualitative approaches can be combined to form mixed–method approaches [41]. In the context of this thesis, quantitative approaches are used, for example, in M S3 for identifying factors that influence the modelers’ behavior, addressing RQ3 (cf. Chapter 7). Additionally, quantitative group comparisons are conducted in the context of M S4 (cf. Chapter 8). Mixed–method approaches As indicated previously, mixed–method approaches combine quantitative and qualitative research methods in order to combine the best of both approaches [41]. This way, method triangulation can be achieved [282], allowing to improve the accuracy of judgments by collecting different kinds of data on the same phenomenon [120]. As a result, the weaknesses of one approach are compensated by the strengths of the other approach [61, 120]. This type of method triangulation has been labeled between (or across) methods triangulation [48, 120]. Different types of mixed–method approaches exist. Concurrent procedures apply quantitative and qualitative approaches in the same empirical investigation to gain a more comprehensive understanding of the problem [41]. In contrast, sequential procedures combine the results obtained in several empirical investigations using quantitative and qualitative approaches. For instance, initial findings might be obtained in a qualitative study. In a second, quantitative study, the findings might be confirmed with a higher number of subjects [41]. Several possibilities exist on how the obtained findings are combined to determine congruence or validity [120]. In this context, researchers can be considered builders, piecing together a puzzle [120]. In this thesis, qualitative data is collected in M S1 to identify PBPs (cf. Chapter 6). In M S3 , quantitative data is collected with a higher number of subjects, building upon the findings of M S1 (cf. Chapter 7). Additionally, method triangulation is used in the context of M S1 and M S2 . M S1 focuses on the cognitive aspects of the PPM, while M S2 investigate the actual interactions with the modeling environment. By using this sequential mixed–method approach, the weaknesses of each approach are compensated by the other approach. Summarized, this thesis inductively investigates the creation of process models. For this purpose, a mixed–method approach is applied. This way, we hope to obtain different perspectives on the formalization of process models. The different perspec-
15
tives can then be pieced together in order to form a comprehensive understanding of the PPM.
16
Chapter 3 Related work This thesis aims at gaining an understanding on how process models are created. Since, process modeling can be considered a discipline of conceptual modeling, we also consider works on conceptual modeling in the sequel. In this context, this work is related to quality of process models and the creation of process models. More specifically, works on the process development lifecycle in general and works on the formalization of process models are of interest. Throughout this thesis, different techniques for investigating the PPM are used. Therefore, we present other works in the area of business process management applying similar research techniques, i.e., think aloud, eye movement analysis, and cluster analysis. This section is structured as follows. First, we present works regarding process model quality in Section 3.1. Next, related work in the context of the process model development lifecycle is presented in Section 3.2, before focusing on research closer related to the PPM in Section 3.3. Section 3.4 presents different approaches to support modelers when creating process models. Finally, Section 3.5 presents other works using similar techniques as utilized in this thesis.
3.1 Quality frameworks and process model quality There are different frameworks and guidelines available that define quality for process models. Among others, the SEQUAL framework uses semiotic theory for identifying various aspects of process model quality [136, 138]. As indicated in Chapter 1, the SEQUAL frameworks considers the three quality dimensions of syntactical, semantical, and pragmatic quality. In the context of syntactic quality, [131] investigates a set of process models to derive a catalog of typical process modeling errors. Similarly, errors in a collection of industrial process models are described in [227] and the SAP reference model is analyzed in [153]. While considerable research on syntactic quality issues has been conducted, few works for assessing semantic quality of process models exist [251]. As a result, semantic quality is usually measured as perceived semantic quality [221]. Pragmatic quality, which is typically operationalized
17
as understandability of a process model [136, 138], has sparked significant research efforts. For example, [154] investigates the effect of combining icons and labels for representing graphical constructs in process models. Further, the influence of the participants’ prior knowledge and properties of the process model on understandability are assessed in [158]. Additionally, pragmatic quality has been investigated considering insights from cognitive psychology, e.g., [311, 314, 316, 321] (references to more works on pragmatic quality can be found in Chapter 1). In this context, guidelines for creating process models have been derived. For instances, the Guidelines of Process Modeling framework describes quality considerations for process models [15]. Similarly, Seven Process Modeling Guidelines (7PMG) define desirable characteristics of a process model [157], which have been derived by accumulating insights from various studies on the quality of process models, e.g., [128, 156, 160]. Other studies have proposed, applied and validated alternative, yet similar metrics to assess the quality of the modeling artifact, e.g., [1, 22, 91, 223]. While each of these frameworks has been validated empirically, they rather take a static view by analyzing or reflecting on the quality of the process model itself. Through the focus on both desirable and actual properties of the process model, prescriptive measures for modelers are derived. In our work, we aim to extend this perspective by including the viewpoint of the modeling act itself, i.e., the PPM. The idea is that by understanding the PPM, it might be possible to gain insights why process models lack the desired level of quality.
3.2 Process model development lifecycle Research into the creation of process models typically focuses on the interaction between different parties. In a classical setting, a system analyst interacts with a domain expert through a structured discussion, covering the stages of elicitation, modeling, verification, and validation [76, 112]. Related to this thesis are the works of Rittgen, investigating the collaborative creation of process models [218, 220]. In this context, the mental models of participants and the conversations between participants in a collaborative modeling session are investigated with the goal to understand the activities of modeling teams and to develop a tool to support collaborative modeling [219]. A set of experience reports utilizing participative enterprise modeling in organizations is presented in [257]. From these reports, generic principles for participative enterprise modeling are derived [257]. These works build on the observation of modeling practice and distill normative procedures for steering the process of modeling toward a good completion. The focus is on the effective interaction between the involved stakeholders. Our work is complimentary to this perspective
18
through its focus on the formalization phase of the process model development lifecycle. In other words, we are interested in analyzing the modeler’s interactions with the modeling environment when creating the formal business process model. Further, several studies investigate cognitive mechanisms during the process development lifecycle. [299] presents an exploratory think aloud modeling session with novices and expert modelers. The participants created two concept maps using a basic syntax. For example, the participants were instructed to “create a conceptual domain model of a library” and to stop when they believed that all relevant aspects of a library were represented in the model [299]. The authors found that novices had problems with identifying concepts, level of abstraction, and reflection of the model. In turn, [298] reports on a case study which investigates abstract reasoning in a collaborative modeling setting and [297] investigates the relation between the formation of abstractions and aspects of executive control in the context of process modeling. A discussion of cognitive mechanisms that might influence the creation of process models is presented in [300]. In contrast to this thesis, the presented works focus on open modeling tasks, which might include several stakeholders, i.e., domain experts and system analysts. In contrast to these works, this thesis focuses on the formalization of process models in a single modeler setting, asking the participants to create a formal process model based on a complete description of a process. Therefore, compared to this thesis, these works investigate the creation of process models in a broader sense, since collaboration and elicitation of requirements are examined. This thesis, aims at gaining a more detailed understanding of the formalization of process models, which is not explicitly done in the presented works.
3.3 Process of Process Modeling Similar to this thesis, other works focus on the formalization of process models by analyzing the modeler’s interactions with the modeling environment. In this context, [28, 29] propose a visualization of the PPM based on Dotted Charts [253]. This visualization is used in [30] for identifying a connection between structured modeling and the quality of the resulting process model. This direction is further pursued as described in [27]. The visualization in [28, 29] displays all interactions with the modeling environment. In contrast, this thesis aims at aggregating the interactions to high level phases of the PPM and proposes a visualization for these phases (cf. Chapter 6). As detailed in Chapter 1, the notational system available to the modeler might influence the PPM. In this context, features of the modeling environment are of interest. This is investigated in [283, 284, 292] by considering change patterns [290]
19
instead of change primitives for process modeling. For this, the interactions with the modeling environment are analyzed in order to find deviations from the optimal problem solving path. In contrast, the work presented in this thesis focuses on change primitives. Further, no activities within the PPM are identified in [283, 284, 292] and no visualizations for the PPM are developed. Finally, in [73, 74], the PPM within a collaborative setting is investigated. For this purpose, a collaborative modeling environment is developed allowing spatially separated participants to collaboratively create process models. Similar to this work, each modeler’s interactions with the modeling environment are recorded in order to identify different phases within the collaborative PPM (cPPM). For this purpose, visualizations based on the logged data are developed. Connecting each modelers’ interactions with the modeling environment to, e.g., chat protocols, allows the identification of roles when collaboratively creating a process model [74]. In a setting of two modelers, one might drive the creation of the process model, while the other modeler validates the created artifact against the modeling domain [74]. The work presented in this thesis focuses on a single modeler setting, while [73, 74] investigate settings with several modelers and different team compositions.
3.4 Tool support for process modeling Several works have been published suggesting new tool features for supporting modelers. For example, [134] intends to support modelers by extracting Domain Process Patterns from a large set of process models collected in the order management and manufacturing domain. Domain Process Pattern can then be used for creating new process models. In [69], an add–in for Microsoft Visio is presented, which suggests activity names based on an underlying ontology. Similarly, [31] proposes an auto–suggest component for process modeling, which automatically suggests the next modeling elements. In [94] an algorithm for automatically laying out BPMN process models is presented and evaluated using a group of modelers. [132, 133] investigate process modeling using multi–touch devices, proposing a set of gestures to manipulate process models on such devices. The actual tool usage in practice considering ease of use, usefulness, and satisfaction as perceived by the users is examined in [207]. The presented works can be characterized by their strong design focus. Evaluations are conducted in the context of the applied design science method (cf. [106]). These evaluations focus on basic characteristics, e.g., modeling speed, or user perception (cf. [46]). The impact on the PPM is usually not investigated. In contrast, this thesis focuses explicitly on the PPM while keeping the features of the modeling environment constant throughout our investigations.
20
3.5 Related research techniques in conceptual modeling This thesis applies several research techniques to complement the analysis of the modelers’ interactions with the modeling environment. More specifically, think aloud, eye movement analysis and cluster analysis are utilized. Subsequently, works using the same techniques in conceptual modeling are presented. Think aloud Recently, several studies utilizing think aloud in conceptual modeling have been published. In this context, several works mentioned previously rely on think aloud protocols [133, 218, 220, 299]. For differences compared to this thesis we refer to the respective sections. Further, think aloud has been used for investigating the understandability of declarative process models [101]. Similarly, the influence of modularity on the understandability of declarative process models has been examined in [320]. These works focus on the understanding of process models, while this thesis investigates the creation of process models. Eye movement analysis Eye movement analysis has been applied in a variety of domains (for an overview see [57]). In the context of conceptual modeling, several studies have been conducted investigating the comprehension of UML models using eye movement analysis, e.g., [24, 304]. Further, the interpretation of data models using eye movement analysis has been investigated, e.g., [168]. In business process management, a research agenda has been proposed in [109] for investigating user satisfaction. Process model comprehension has been examined using eye movement analysis in [185]. [313] assesses how low–cost eye–trackers can be utilized for research in conceptual modeling. In this thesis, eye movement analysis is used for analyzing the creation of process models instead of investigating the comprehension of existing models. Further, we combine eye movement analysis with other techniques, e.g., analyzing the interactions with the modeling environment. Cluster analysis Cluster analysis attempts to solve the basic problem of creating groups of similar objects to form a classification [67]. Due to the general nature of cluster analysis, it has be applied in a variety of disciplines, e.g., biology, medicine, marketing, and astronomy [67]. In the context of business process management, cluster analysis has been extensively used for process mining. For example, [47] presents a clustering algorithm to cluster event logs into coherent sets of classes, which can be mined adequately. A similar approach is followed in [252] for process mining in flexible environments. Similarly, [205] devises a methodology for mining healthcare processes and presents a case study conducted in an hospital in Portugal.
21
[87] proposes a framework considering global constraints when mining execution logs of business processes using sequence clustering. In [88], an algorithm to identify process variants using cluster analysis is presented. The overall process is derived by combining the identified variants. In a different context, cluster analysis is used in [322] to investigate the actual usage of elements provided by BPMN. In contrast to the presented works on process mining, which mostly use cluster analysis to facilitate the subsequent identification of process models from event logs, we use cluster analysis to investigate the creation of process models by humans with the goal of gaining an understanding of the PPM.
22
Chapter 4 Background
In the context of RQ1 , we intend to develop means for analyzing the PPM. Due to the lack of existing knowledge on the formalization of process models, we rely on backgrounds from cognitive psychology to develop an understanding of the PPM. In this context, problem solving has been an area of vivid research for decades. According to [167], a problem has four characteristics: an initial state, a goal state, operators for transforming the initial state to the goal state and restrictions applying to these operators. In the context of this thesis, the initial state represents an empty modeling canvas and an informal textual description of the process to be captured. The goal state is the formal process model representing the textual description of the process. Operators are defined by the process modeling language as well as the cognitive abilities of the problem solver. Therefore, the creation of process models can be considered a problem solving task, making cognitive psychology a reasonable theoretical foundation for addressing RQ1 . Further, we are considering research in domains sharing similarities with the PPM. In this context, the process of programming appears to be of interest, since several similarities between computer programs and process models have been identified [95, 277, 278, 288, 289]. Besides the factual similarities of process models and computer programs, it has been stated that the development of a computer program can be considered a problem solving task [177], making the process of programming comparable to the PPM. Therefore, the process of programming seems to be a viable starting point for the investigations regarding RQ1 . The remainder of this chapter is structured as follows. Section 4.1 presents cognitive backgrounds, while research on the process of programming is outlined in Section 4.2. The chapter is concluded with a brief summary in Section 4.3.
23
4.1 Cognitive foundations of the Process of Process Modeling This section focuses on backgrounds from cognitive psychology, which are of interest for understanding the process of programming and the PPM. In this context, we first present limitations of the human mind, which make problem solving a challenging task, in Section 4.1.1. Next, mechanism aiding problem solving are discussed in Section 4.1.2, i.e., the use of chunking, schemata, plan schemata, and external representations.
4.1.1 Limitations of the human mind Abilities like thinking, planning and problem solving are fundamental aspects in human cognition and play an important role for the PPM. One cognitive system essential for effective everyday functioning is working memory. Working memory represents a system in which information is temporarily maintained, integrated, and processed in the service of cognition [10, 39, 171, 266]. Working memory represents the work place which provides a set of functions for generating a process model. More specifically, during the PPM, goal relevant information is integrated and visuo–spatially translated into logically, efficient action and decision points. In contrast to working memory, long–term memory represents a theoretically unlimited information store that contains the complete knowledge base of a person, e.g., knowledge about facts, events, rules, and procedures. Working memory strongly interacts with long–term memory. When reading a text, preexisting knowledge about speech is required for text understanding. Similarly, for developing a process model, knowledge about the modeling notation is required. In this context, working memory is the work place where information is integrated, manipulated, and related. However, the working memory’s capacity is limited, i.e., only a limited amount of information can actively be processed. [161] proposed a working memory capacity of 7 items. Newer works report on a smaller working memory capacity of 3–5 items [38]. While the actual working memory capacity is less important for this work, it has to be emphasized that the amount of information that can be maintained in working memory is limited. Hence, when asked to repeat the sequence “U–N–O–C–B–S– N–F–L”, most people miss a few characters as the number of characters exceeds the working memory’s capacity. This capacity limitation makes working memory a central predictor for interindividual differences in complex cognitive tasks, e.g., language comprehension [122], logic learning [141], fluid intelligence [34], integration of preexisting domain knowledge [104], and even process modeling [234].
24
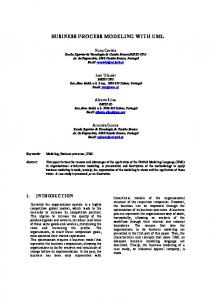
4.1.2 Overcoming the limitations of the human mind When considering the limitations of working memory, the question arises how large amounts of information required for performing complex tasks can be processed by humans. For overcoming the working memory’s limitation several mechanisms exist. Subsequently, chunking of information, using schemata and plan schemata are discussed. Further, we present how external representations can be used to aid problem solving. Chunking of information Chunking allows to increase the amount of information that can be maintained in working memory. Chunks are units of multiple items that are grouped or bound together to form a unified whole [82]. For example, consider the previous example of repeating the sequence “U–N–O–C–B–S–N–F–L”. People familiar with the acronyms “UNO”, “CBS” and “NFL” can bind letters into three chunks based on knowledge stored in long–term memory. Therefore, chunking requires preexisting knowledge integrated in long–term memory, which is often referred to as schemata [11, 13, 85]. Superior performance through chunking is most obvious in expert–novice investigations. [25, 26] found that experts were much better in recalling chess positions compared to beginners and novices. These results have been replicated for several domains, e.g., football coaches’ memory of diagrams of football plays [80] and physicians’ memories for information gained in diagnostic interviews [37]. [63] explained the superior performance of experts and skilled individuals by their long–term working memory. They assume that rapid encoding and retrieving of information is facilitated in experts because their knowledge is organized in chunks and superchunks within long–term memory which are immediately available through few access cues represented in working memory. Extensive deliberate practice is needed to develop these long–term working memory mechanisms [64]. This basic principle is also applied in, e.g., text comprehension. When reading a paragraph, letters are bound together to form words, and words to meaningful sentences. At the end, the content of the paragraph is hierarchically represented in few superchunks [62]. Only one cue can be sufficient to activate content knowledge maintained in the chunks to reproduce the most important parts of the paragraph. The basic capacity limit does not change, but the organization of the knowledge does. Put differently, chunking helps to reorganize information in a meaningful way. A simple example illustrating the importance of chunking of information for process modeling is depicted in Figure 4.1 (cf. [316]). The process fragment consists of an optional activity A modeled in BPMN [174]. In BPMN, optional activities are
25
A A
A
A
A
memory workingworking memory (a) Without chunking
A
A
A
memory workingworking memory (b) With chunking
Figure 4.1: Chunking in process modeling [316]
modeled using two exclusive gateways before and after the activity. Inexperienced process modelers might use up to three slots of their working memory to store the activity and the corresponding exclusive gateways as illustrated in Figure 4.1 (a) (we assume no additional cost for edges in this example). More experienced process modelers, in turn, should be familiar with this pattern and therefore possess schemata for constructing higher level chunks. Consequently, experienced process modelers can store the same amount of information in a single slot in working memory as indicated in Figure 4.1 (b). Plan schemata Additionally, schemata can be integrated into the problem solving process. When novices are confronted with an unfamiliar problem, they cannot rely on specialized problem solving strategies for this specific task. Therefore, novices have to find a way of solving the problem. For this purpose, they come up with an initial skeletal plan [217]. Then, novices utilize general problem solving strategies, like means–ends analysis, because of the lack of more specific strategies for the task at hand [123]. Means–ends analysis can be described as the continual comparison of the current state of the problem with the desired end product. Based on this comparison, the next steps to be executed are selected until a satisfying solution for the problem is found [123]. After applying the constructed plan, it can be stored in long–term memory as a plan schema [217]. For this purpose, task specific details are compiled out of the plan schema resulting in plan schemata that can be automatically applied in similar situations [4]. When confronted with a problem solving task in the future, the appropriate plan schema is selected using a case–based reasoning approach [98], i.e., plan schemata similar to the current situation are selected. The retrieved plan
26
schema provides the user with large chunks of structured knowledge [98] that drive the process of solving the problem at hand [98, 118]. Summarized, plan schemata allow experts to immediately decide what steps have to be applied to reach the desired solution [260]. If the plan schema is well developed, an expert would never reach a dead end when solving the problem and therefore never has to backtrack to a previous state of the problem solving process [20]. This is also called problem solving by analogy [118]. When asked to create a process model containing an optional activity in BPMN for the first time modelers have to develop a way of representing optional activities (see Figure 4.1 for an illustration of optional activities in BPMN). Since no problem solving strategy is available, modelers have to apply general strategies, i.e., means– ends analysis. First, the modeler might create the desired activity. When comparing the current situation to the goal state by mentally executing the process model, the modeler is not satisfied, as the activity is always executed. In a next iteration, the modeler might come up with control flow to make the activity’s execution optional. A comparison with the goal state satisfies the modeler, since the execution is now optional. The modeler has developed a plan for modeling optional activities in BPMN. Task specific characteristics, e.g., the activity’s name are removed from the plan to form an abstract plan schema that can be stored in long–term memory. The next time, the modeler has to create a process model containing optional activities, the plan schema will be retrieved from long–term memory and applied to the current situation. Therefore, the modeler does not have to develop the solution again. Internal and external representations Another basic strategy to overcome working memory capacity limitations is to externalize information. Literature suggests the separation between internal representations and external representations [17, 232, 235, 236, 264, 265]. Internal representations are constructed in memory, containing a human’s knowledge and schemata. Whenever a human is solving a problem, an internal representation of the problem is created in memory, which is then used for reasoning. External representations utilize physical symbols, e.g., symbols of a modeling language, dimensions of graphs, rules, constraints, or relations among symbols, e.g., spatial relations of written digits, visual and spacial layout of diagrams, to represent knowledge [307]. Examples for external representations can be simple like shopping lists or small drawings created when facing a complex problem, e.g., [233], but can also become more complex like business process models. Internal representations can be transformed to external representations by externalization. External representations can be transformed to internal representations using memorization, a process limited to relatively simple
27
external representations [307]. Additionally, there exists a lightweight process interpreting the external representation using perceptual mechanisms without creating a complete internal representation. This lightweight process allows to quickly access information encoded in the external representation. This requires the external representation to be constantly available and, even though perceptual processes generally require less working memory resources than higher cognitive processes, it does not mean that external representation can be utilized without an increase in cognitive load [307]. The increase in cognitive load is caused by higher cognitive processes, which are still necessary for directing attention to the relevant features of the external representation based on the current task at hand [307]. The created product of the perceptual process is therefore merely the “situational information in working memory”, only containing the crucial parts of the external representation for the current task [307]. Still, the cognitive load of using an external representation is considerably lower compared to storing all information in working memory. External representations are of special interest for investigating the PPM, since the external representation is not only an aid for helping the modeler’s understanding, but rather constitutes the central artifact of the modeling endeavor. In other words, the goal of the PPM is the creation of an external representation of the business process, i.e., the process model. Literature describes several effects of external representations lowering cognitive load and working memory respectively (cf. [235, 264, 308]). Graphical constraining For instance, graphical constraining describes an effect where graphical elements in an external representation constrain the inferences made about the underlying world [235]. For example, a process modeler might move a group of activities closer together to express their close connection in the real world. When someone else is interpreting the process model, connections based on the arrangement of the elements can be inferred. Additionally, by moving related elements closer together, a modeler can lower the cognitive load of interpreting the process model, since the area on the modeling canvas to be considered for interpretation is smaller. Computational offloading Computational offloading is highly dependent on the exact external representation that might allow the problem solver to “read–off ” the answer to a specific question. Consequently, computational offloading “refers the extent to which differential external representations reduce the amount of cognitive effort required to solve information equivalent problems” [235]. A written shopping list can be considered a simple example for computational offloading, alleviating a
28
human being from remembering all items [307]. For a discussion on how cognitive offloading might work in the context of business processes we refer to [316]. Re–representation Re–representation describes how different external representations of the same abstract structure influence the difficulty of a problem solving task [235]. This is illustrated by an example introduced in [308], comparing the multiplication of Arabic numerals and Roman numerals, e.g., 73 × 27 is easier than LXXIII × XXV II for people used to working with the decimal system [235, 308].
4.2 Process of programming As indicated previously, we consider research in the area of computer programming due to the similarities with process models [95, 277, 278, 288, 289]. In this context, research on the process of programming might be used as a starting point for developing means for analyzing the PPM, i.e., addressing RQ1 . Subsequently, an overview on research regarding the process of programming is presented, including the most important activities involved during the creation of computer programs. Research on the cognitive processes involved in programming and regarding the design of software has started as early as in the 1970s [99], e.g., [20, 244, 246, 263, 303]. Among those early works, first models describing various activities involved in the development of software can be identified, e.g., [20]. In the 1980s, research on the process of programming continued, e.g., [98, 118, 123, 151]. In this context, refined versions of the models of the process of programming were proposed, e.g., [118, 123, 151]. At the same time, researchers started to focus on more specific aspects of programming instead of defining complete theories for the process of programming. For instance, [217] suggested a theory on how schemata are essential for programming. Similar directions were pursued by [97] and [177] at the beginning of the 1990s. With the emergence of object–oriented development, the focus of research shifted toward investigating this paradigm [99]. Especially the benefits claimed for object– oriented development raised the researchers’ interest. For instance, correspondence between real–world objects and objects of the system was considered to facilitate the adoption of object–oriented technologies [226]. An overview of potential benefits of object–oriented development can be found in [50]. Interestingly, studies indicate that object–oriented programming is more difficult than envisioned [262], leading to research on differences regarding strategies of programmers, e.g., [21, 49, 96, 179], specific difficulties with object–oriented technologies, e.g., [99, 100], and on how to learn object–oriented programming, e.g., [148, 152, 176, 241, 242, 296]. In this
29
context, the difficulties of experienced programmers switching to object–oriented programming have been of special interest, e.g., [9, 165, 166]. Research on the process of programming constitutes an enormous amount of knowledge accumulated within the last 40 years. Since investigations regarding the PPM are far less developed, this work is based on the different models describing the cognitive activities proposed over the years, e.g., [20, 123, 151, 226, 243]. The specifics of the individual models are not detailed here, but the focus is put on the well–established aspects of the process of programming.1 Common to all models is that programming is considered a problem solving task (cf. [167]), asking programmers to move from a problem state to a desired goal state [151]. In this context, the problem state constitutes a programming assignment, i.e., a description of the program and a programming environment that is presented to the participants. The goal state is a program fulfilling the desired functionality. Further, the process of programming has been characterized as highly iterative, interleaved and loosely ordered [98]. Within this process, the different models agree on three major cognitive activities: problem understanding, method finding / problem decomposition, and solution specification [226, 243, 262]. Subsequently, the three phases are described briefly.
4.2.1 Problem understanding Problem understanding describes a cognitive activity performed by programmers to understand the presented requirements. For this purpose, programmers form an internal representation of the problem by extracting information from external sources [20, 226]. External sources include descriptions of the domain, instructions, and features of the environment available to the programmer [20, 243]. The understanding process is guided by schemata stored in long–term memory [118]. The availability of schemata allows programmers to form chunks of knowledge that can be processed more efficiently [21]. [243] concluded that understanding seems to be broadly defined including the business problem, the development environment, and aspects of project management.
4.2.2 Method finding / problem decomposition The importance of method finding has early been identified for the process of programming [20]. Method finding describes the search for a plan or an outline of the program prior to the actual coding [20]. Therefore, method finding should be similar for programming languages following the same paradigm [20]. Later, the term 1
The interested reader might examine the discussion on the different models in [243].
30
problem decomposition emerged, replacing the term method finding. This change in terminology might have been triggered by research on object–oriented development, where programmers are required to partition the problem to form classes and develop their interaction. [243] identified several activities of object–oriented development including “activities related to logical design”, “cohesion and coupling issues”, “relationships between objects”, “idea expansion”, and “stepwise refinement”. In this context, plan schemata are essential, since they provide programmers with information obtained in similar situations in the past. Using plan schemata, programmers can decide on how to approach the problem, e.g., how to structure the program for procedural programming [20], or which classes to create in the context of object oriented design [262]. Therefore, plan schemata steer the problem solving process [20, 263]. If no plan schemata are available to the programmer, general problem solving strategies, e.g., means–ends analysis, have to be utilized [123]. The importance of method finding / problem decomposition is underlined by the success of design patterns in software engineering, which provide developers with structured knowledge on how to approach reoccurring problems (cf. [79]).
4.2.3 Solution specification [243] describes solution specification to contain activities related to physical design and implementation, evaluation and debugging, and consistency checking, which is consistent with earlier descriptions of the process of programming (cf. [20, 123, 151, 226]). Therefore, solution specification describes the actual creation of the source code [262]. For this purpose, the plan developed in the method finding / problem decomposition phase is transformed into a formal external representation, i.e., the source code [20]. Additionally, solution specification contains verification and evaluation steps [123, 127, 262]. In verification steps, programmers mentally execute the developed solution while in evaluation steps the quality of the developed solution is assessed [262].
4.3 Summary Research on the process of programming seems to be a viable starting point for our investigations on the PPM, due to the similarities shared between computer programs and process models [95, 277, 278, 288, 289]. Further, the observation that both, the process of programming and the PPM, constitute problem solving tasks supports this proposition. Regarding the activities identified within the process of programming, some might also be present within the PPM. For instance, problem understanding can be assumed to be present within the process of programming
31
and the PPM. Based on the activities identified for the process of programming we derive a description of the PPM, which supports the analysis of the PPM and therefore addresses RQ1 (cf. Chapter 6).
32
Chapter 5 Recording the Process of Process Modeling As indicated in Chapter 1, traditional empirical research regarding the quality of process models mostly focuses on the product or outcome of the PPM, i.e, the process model. In contrast, we intend to investigate how process models are created in a systematic manner. More specifically, the focus is put on the formalization of process models. For instance, Figure 5.1 illustrates how a process model might unfold on the modeling canvas in a series of interactions with the modeling environment applied by the modeler. The PPM instance in Figure 5.1 shows several intermediary versions of the process model, until reaching the final process model. In order to systematically investigate the PPM in terms of the research questions presented in Chapter 1, two requirements need to be fulfilled. On the one hand, an environment allowing to control factors that potentially influence the PPM needs to be developed, i.e., Section 1.2 suggests an influence of the notational system on the creation of process models. On the other hand, the modeling environment needs to support the detailed analysis of the PPM, i.e., all intermediary versions of the process model need to be available. Process of Process Modeling research with Cheetah Experimental Platform
A
A
...
traditional empirical BPM research, e.g., model quality
B
B
B A
A C
C
A C final process model
Figure 5.1: PPM research with CEP
In order to control factors potentially influencing the PPM, the modeling environment for investigating the PPM should allow researchers to control the notational
33
system. Usually, modern modeling environments provide modelers with sophisticated features supporting the creation of process models (cf. Chapter 3). While this is desirable in practice, it makes controlling the environment for investigations regarding the PPM difficult, i.e., researchers should be capable of enabling or disabling features of the modeling environment. Further, we observed reoccurring problems with the execution of empirical studies during a series of empirical investigations we conducted in the past, e.g., [187, 237, 285, 287, 310]. Especially with higher number of participants, data loss due to participants accidentally disobeying the study’s setup occurred, e.g., forgetting to execute a task during the empirical study. Therefore, it should be ensured that all tasks are executed by all participants, e.g., modeling tasks and surveys. At the same time, potential data loss should be minimized by providing automated support for collecting the recorded data. Consequently, the first research question can be formulated as follows. RQ1.1 : How can modeling sessions be conducted in a controlled manner? The second research objective is to record PPM instances as illustrated in Figure 5.1. Basically, the PPM can be examined by videotaping the creation of the process model and manually analyzing how the process model unfolds on the modeling canvas. This approach has the disadvantage of being a time consuming activity due to the required manual effort, i.e., for analyzing the video recordings. Further, the long–term goal of our research on the PPM is to develop modeling environments helping modelers during the PPM, e.g., by analyzing the modelers’ behavior and pointing toward potential problems in the process model. Consequently, we follow the general idea of process mining to record all activities, i.e., interactions with the modeling environment, in an event log. This way, the process model’s creation can be replayed at any point in time, supporting a detailed analysis. Therefore, the second research question can be formulated as follows. RQ1.2 : How can Process of Process Modeling instances be recorded? The remainder of this chapter is structured as follows. Section 5.1 outlines how the presented research questions are addressed. Then, Section 5.2 focuses on RQ1.1 and Section 5.3 describes how PPM instances are recorded, i.e., RQ1.2 . Then, we sketch several modeling sessions, demonstrating the usefulness of the developed tool in Section 5.4. Finally, this chapter is concluded with a brief summary in Section 5.5.
34
5.1 Research outline This section outlines the process followed to address the presented research questions. State of the art modeling environments usually provide a plethora of features [207], typically not storing intermediary versions of the process model on a fine–grained level. As a result, performing a detailed analysis regarding the creation of process models is difficult. Therefore, we decided to develop a specialized tool for investigating the PPM—Cheetah Experimental Platform (CEP) 1 . Subsequently, we outline how CEP addresses RQ1.1 and RQ1.2 . In order to address RQ1.1 , CEP has been designed to facilitate the execution of empirical studies while incorporating the strength of its predecessor Alaska [193, 285, 286, 293]2 . In order to determine the features required for CEP, we consider the systematic literature review conducted in [198]. Three basic components used in modeling sessions were identified: the modeling environment, components for training participants, and questionnaires to collect additional information, e.g., demographic data of modelers might be recorded for addressing RQ3 . Therefore, CEP should provide such components to support the execution of modeling sessions. Further, CEP should provide a mechanism for orchestrating the required components. These requirements are addressed by the so called experimental workflow in CEP, which assures that participants are presented with the tasks of the study, e.g., filling out a survey or performing the modeling task, in the correct order. The entered data is validated and continuously stored on the local hard drive to minimize the danger of data loss. Once the experimental workflow is completed, the data is automatically transferred to a central database server. Further, in order to address RQ1.1 , the modeling environment should be configurable, allowing to execute modeling sessions with differing feature sets. This way, researchers can control the notational system for each modeling task individually. To address RQ1.2 , the modeling environment records all interactions with the modeling environment in an event log. This way, PPM instances can be replayed at any point in time without interfering with the modelers’ efforts. This approach allows a more efficient analysis of the PPM compared to creating, e.g., video recordings, since the recorded data can be automatically processed (cf. Chapter 6). On a long–term basis, the interactions with modeling environment might be exploited for developing modeling environments that support modelers during the PPM by analyzing the modelers’ behavior. 1
Cheetah Experimental Platform is a joint effort with Stefan Zugal and is freely available from: http://www.cheetahplatform.org 2 Alaska is freely available from http://alaskasimulator.org
35
Modeling session
Component
name description
name
Questionnaire
Modeling environment modeling notation features of the modeling environment
Tutorial tutorial steps
Question question text
Open question
Likert question possible answers
Figure 5.2: Components of CEP as identified in [198]
Finally, we demonstrate the usefulness of CEP by briefly discussing how the features provided by CEP are used in this thesis, but also in the context of related research. More specifically, we present empirical studies making use of the configurable modeling environment and the experimental workflow to address RQ1.1 and outline several modeling sessions investigating the PPM, i.e., addressing RQ1.2 .
5.2 RQ1.1 : How can modeling sessions be conducted in a controlled manner? This section details on the components developed for addressing RQ1.1 . In this context, [198] identifies three components that should be provided by CEP in order to conduct modeling sessions. More specifically, the modeling environment, components for training participants, and questionnaires to collect additional information need to be available [198]. Figure 5.2 sketches the components provided by CEP in form of an UML class diagram. A modeling session consists of a series of components, which can be questionnaires, modeling tasks, or tutorials. Each component can be tailored to the specific needs of the respective modeling session.
36
Enter code
Demographic survey
Tutorial
Modeling task
Post modeling survey
Feedback
Figure 5.3: Experimental workflow for M S3
In order to support the execution of modeling sessions, a mechanism responsible for presenting components to subjects should be available. For this, the experimental workflow is developed, combining the components presented in Figure 5.2 to form an executable plan for conducting the modeling session. This way, components can be combined in arbitrary order for efficient data collection. Figure 5.3 displays the experimental workflow of M S3 (cf. Chapter 7), illustrating how the components identified in [198] can be combined. M S3 starts with a mandatory activity for entering the code that ensures that all participants start the modeling sessions at the same time. This way, CEP can be distributed prior to the modeling session, but the participants are not able to start the modeling session until they are provided with the appropriate numerical code. By providing different codes to the participants of the modeling session, participants can be partitioned into groups, which are presented with different tasks. For details we refer to [311]. Once the participants have entered the code, the participants fill out a demographic survey and complete an interactive tutorial explaining the features of the modeling environment. Then, the appropriate modeling task is displayed. The modeling session is concluded with another survey and a feedback form. The data is then automatically transferred to a central database server assuring data security. Subsequently, we revisit the components of CEP providing more detailed information. First, the focus is put on the configuration of the modeling environment in Section 5.2.1, before describing questionnaires and tutorials in Section 5.2.2. Finally, the logging of the experimental workflow is described in Section 5.2.3.
5.2.1 A configurable modeling environment In order to answer RQ1.1 , a modeling environment within CEP is developed. In this context, two demands in terms of configuring the modeling environment can be identified: (1) configuring the notation and (2) configuring the features provided by the modeling environment. Subsequently, we present details on how the notation and the modeling environment can be configured in CEP.
37
(a) CEP without textual description
(b) CEP with textual description
Figure 5.4: Presentation of the task description in CEP
Configuring the notation CEP was designed to mimic a pen and paper modeling environment by providing a basic user interface instead of providing a full–fledged modeling suite. In this context, the modeling environment in CEP is based on the assumption that graphical notations consist of different types of nodes that are connected by different types of edges. This way, different modeling notations can be supported by providing the graphical appearance for each type of node and each edge type. Additionally, CEP allows researchers to enable or disable single constructs of a modeling notation, e.g., OR gateways. This way, subsets of a notation can be used in modeling sessions. In the context of this thesis, we focus on imperative modeling notations by utilizing Business Process Model and Notation (BPMN) [174]. Additionally, CEP provides support for other modeling notations, e.g., ConDec [182]. Configuring the features of the modeling environment In order to address RQ1.1 , the modeling environment can be configured for specific modeling tasks. By conducting modeling tasks with different features, investigations regarding the influence of the respective feature can be conducted. In the context of this thesis, a configurable feature for displaying the task description on the screen is utilized (cf. Figure 5.4). Basically, when asking participants to create a formal process model from an informal textual description, two possibilities
38
Figure 5.5: CEP with change patterns support
to distribute the textual description among the participants exist: (1) the task is distributed on paper or (2) the task is juxtaposed with the modeling environment. While distributing the task on paper has the advantage of increasing the size of the modeling canvas on the screen and allowing participants to highlight important parts on paper, it makes the exact timing of PPM instances more difficult, e.g., participants might start reading the task description prior to starting the modeling task. Further, in some situations, it might be necessary to display the task on screen. For instance, when performing eye movement analysis, some eye trackers can only track eye fixations on the computer screen, e.g., table mounted eye trackers (cf. M S2 in Chapter 6). In a similar vein, the notational system can be configured to allow for more complex approaches to process modeling (not part of this thesis). For instance, modeling using change pattern has been investigated using CEP, e.g., [283, 284, 292]. In this context, modelers apply change patterns, i.e., high–level change operations, for adapting the process model, instead of specifying a set of change primitives. Change patterns cover, for example, inserting and deleting process fragment (a complete catalog of change pattern is presented in [43, 290, 291] while change pattern semantics are described in [216]). In contrast to modeling with change primitives, where soundness has to be checked explicitly, change patterns guarantee correctness of the model after each change pattern application [23, 212]. For this, only change patterns that ensure soundness after transforming the process model are available, i.e., following the correctness–by–construction principle. Figure 5.5 shows the modeling environ-
39
ment using change pattern, providing a basic set of change patterns. As required by correctness–by–construction, the process model is always syntactically correct and block structured. Further, only change patterns applicable for the current selection in the process model, i.e., activity calculate required funds, are enabled. Following the general idea of CEP, only a limited set of change pattern is available, which, nevertheless, allows the creation of the desired process model. Additional change patterns can be enabled to investigate their influence on the creation of process models (cf. [292]).
5.2.2 Components supporting the execution of modeling sessions In order to support the execution of modeling sessions, i.e., RQ1.1 , CEP provides a set of configurable components as illustrated in Figure 5.2. In this context, surveys for different types of questions, i.e., Likert scales and open questions, are available. Further, a set of predefined surveys is available, e.g., perceived ease of use [46], perceived usefulness [46], and perceived mental effort [178]. Additionally, a feedback questionnaire can be utilized. Further, in order to minimize the impact of modelers being unfamiliar with the modeling environment, interactive tutorials are available (cf. Figure 5.6). In these tutorials, participants are presented with a video of the operation to be conducted, which is juxtaposed with the actual modeling environment. After completing the model interaction displayed in the video themselves, the next step is automatically presented until the tutorial is completed. This way, it can be ensured that modelers are familiar with the notation and the features of the modeling environment.
5.2.3 Logging the experimental workflow This section describes the data format that is used for recording the experimental workflow. As indicated previously, one of the goals of CEP was to minimize the danger of data loss. Therefore, a logging format is used, which allows to continuously store the intermediate results of components on the local hard drive. Once the experimental workflow is successfully completed, the data is transferred to a database server. This way, partial data can be collected manually from the local hard drive in case the computer crashes and the experimental workflow can be restored. Further, we strived for using an extensible format that can be used in future versions of CEP without interfering with existing data. Due to the similarities of research on the PPM with process mining, the data format used for logging in CEP is inspired by the MXML (Mining XML) format developed for process mining [270, 274, 275]. The logging format distinguishes be-
40
Figure 5.6: BPMN tutorial in CEP
tween process and process instance. A process represents the definition of a business process, while process instances represent the actual executions of processes. In the context of this thesis, the process represents the PPM for a specific modeling task, while a process instance is created for the experimental workflow and every PPM instance. The example in Figure 5.7 illustrates the logging format used in CEP. The list of processes on the top right contains two processes, i.e., the experimental workflow and the modeling process representing the modeling task as defined in the experimental workflow (cf. Figure 5.3). The actual definition of the processes is not contained in the log file, but stored within CEP. The definition can be obtained using the process’ id. On the left hand side, Figure 5.7 illustrates an example instance of the experimental workflow in Figure 5.3. The process instance on the left contains basic attributes, e.g., a numerical id, and a reference to the defining process, i.e., attribute process. Additional information can be stored in the data attribute, which can be used to store key–value pairs. For example, the data attribute is used to store a timestamp for the process instance and the code that was entered by the user at the beginning of the experimental workflow. By using the data attribute for storing additional information the log file can be extended in newer versions of CEP without interfering with existing data. The central part of the log file is a series of audittrail entries. Audittrail entries represent logged events during the execu-
41
Process Id Name 1 Experimental workflow 2 Modeling task
Process instance
Process instance
Id 1 Process 1 Data Code 1 Code Timestamp 1317194250788 Timestamp Audittrail entries Audittrail Entry Audittrail entry Type SURVEY Timestamp 1317194261861 Data Data Age 28 ... Audittrail Entry Audittrail entry Type TUTORIAL Timestamp 1317194418620 Data Data Duration 301240 ... Audittrail Entry Audittrail entry Type MODELING Timestamp 1317194724541 Data Data 2 Process instance ... Audittrail Entry Audittrail entry Type SURVEY Timestamp 1317197148863 Data Data Mental effort 5 ...
Id 2 Process 2 Data Screen resolution 1280 x1024 Timestamp 1317194725620 Audittrail entries Audittrail entry Type CREATE NODE Timestamp 1317194798194 Data Type Start event X 122 Y 74 ... Audittrail entry Type CREATE NODE Timestamp 1317194815847 Data Type Activity X 122 Y 74 Name Enter request ... ...
Figure 5.7: Logging of CEP
tion of a experimental workflow, i.e., each audittrail entry represents one activity of the experimental workflow. For instance, the first audittrail entry represents the demographic survey3 . The corresponding time is stored in the timestamp attribute. The attribute type defines the activity that was executed. Additional information is stored in the data attribute of the audittrail entry. In case of a survey, the given answers are stored in the data attribute. Additionally, timings for all questions are stored in separate data attributes (not shown in Figure 5.7). Similar to the process instance, each audittrail entry contains a timestamp representing the time when the execution started. The next audittrail entry shown in Figure 5.7 represents the interactive tutorial. Then then actual modeling process was executed. The type of 3
Entering the code is not logged explicitly as it defines the process for the current process instance
42
the audittrail entry is MODELING and the data attribute contains a reference to a process instance representing the PPM instance (cf. Section 5.3.1). The list of audittrail entries continues with the post–modeling survey including a question on mental effort.
5.3 RQ1.2 : How can Process of Process Modeling instances be recorded? This section describes how RQ1.2 is addressed. For this, we focus on the modeling environment component (cf. Figure 5.2) in Section 5.3.1, explaining the logging mechanism for PPM instances. Further, we outline features supporting the analysis of the recorded PPM instances in Section 5.3.2.
5.3.1 Logging interactions with the modeling environment In order to record PPM instances, we use a similar mechanism to logging the experimental workflow (cf. Section 5.2.3). On the right hand side of Figure 5.7 an example for a PPM instance is illustrated. When focusing on the process modeling environment, the development of process models using BPMN consists of adding activities, events, gateways, and edges to the process model or deleting them, naming or renaming these activities, and adding conditions to edges. In addition to these interactions, the process model’s secondary notation can be adapted. For this, the modeler might layout the process model using move interactions for nodes or by utilizing bend points to change the routing of edges. Further, CEP stores all scrolling interactions of the modeler. This allows researchers to identify the part of the model the modeler was looking at in a certain situation. A complete overview of interactions is provided in Table 5.1. Interactions can also be combined to compound interactions. This is the case when, e.g., several elements are selected and moved at the same time or when using change pattern for process modeling. Change pattern are realized in CEP by combining a series of interactions to a single compound interaction, e.g., inserting an activity and adapting the corresponding edges. The list of audittrail entries describes the creation of the process model step by step allowing a detailed analysis of PPM instances.
5.3.2 Supporting the analysis of Process of Process Modeling instances This section presents the central analysis features in CEP, which are used in this thesis. In the context of the PPM, the most important analysis feature is CEP’s replay. By capturing all of the described interactions with the modeling environment,
43
Interaction
Description
CREATE NODE DELETE NODE CREATE EDGE DELETE EDGE RECONNECT EDGE CREATE CONDITION DELETE CONDITION UPDATE CONDITION RENAME MOVE NODE MOVE EDGE LABEL CREATE/DELETE/MOVE EDGE BEND POINT VSCROLL HSCROLL
Create an activity, gateway, or event Delete an activity, gateway, or event Create an edge connecting two nodes Delete an edge Reconnect an edge from one node to another Create an edge condition Delete an edge condition Update an edge condition Rename an activity Move an activity, gateway, or event Move the label of an edge condition Update the routing of an edge Scroll vertically Scroll horizontally
Table 5.1: Interactions recorded by CEP
researchers are able to replay a recorded PPM instance at any point in time without interfering with the modeler. Figure 5.8 illustrates CEP’s replay. The standard modeling environment is enhanced with the possibility to step through the creation of the process model. Researchers can advance one interaction at a time, jump forward by executing five interactions or replay the complete PPM instance. The replay speed can be adjusted. Additionally, a list of all interactions can be displayed, allowing researchers to jump to the desired position within a PPM instance. This allows for observing how the process model unfolds on the modeling canvas4 . The final process model can be exported as Portable Network Graphics (PNG). In addition to replaying PPM instances, CEP can generate MPDs of PPM instances based on the interactions with the modeling environment (cf. Chapter 6). Further, CEP provides interfaces to other tools. For instance, CEP allows for exporting the interactions with the modeling environment and the data collected in surveys as Comma–separated Values (CSV). This way, several tools for performing statistical analysis can be addressed, e.g., SPSS, Excel. Further, CEP supports the data format used by WEKA [102], an open–source tool for data mining, e.g., clustering. Additionally, researchers can export PPM instances using the Mining XML (MXML) format, which is used by ProM, a tool for process mining [270, 274, 279]. 4
An animated demonstration of the replay feature is available at http://cheetahplatform.org.
44
Figure 5.8: Replay of a PPM instance in CEP
5.4 Evaluation This section illustrates how CEP has been used in a variety of empirical studies, illustrating the usefulness of CEP for conducting empirical studies. In this context, we outline research on the PPM, but also sketch other empirical works relying on CEP, which do not investigate the PPM specifically. This way, we demonstrate how RQ1.1 and RQ1.2 were addressed. Regarding RQ1.1 , the following empirical studies can be mentioned. The configurable modeling environment has been used in several modeling sessions investigating the influence of the notational system. For instance, modeling using change patterns has been investigated using CEP, e.g., [283, 284]. Similarly, the influence of an advanced change patterns set is investigated in [292, 306]. In these studies, the subjects were provided with differing sets of change patterns in order to assess their influence on problem solving. In a similar vein, automated layout support was integrated in CEP [92–94]. In this context, perceived ease of use and perceived usefulness [46] of the automated layout support were evaluated. Further, the configurable modeling environment has be used when developing several extensions to CEP. For instance, ConDec [182] has been utilized in the context of Test Driven Modeling, e.g., [311, 312, 317, 318]. Further, an extension of CEP to incorporate concurrent task trees was developed in [90].
45
In the context of RQ1.2 , all modeling sessions described in this thesis for investigating the PPM should be mentioned. M S1 describes a modeling session using think aloud and M S2 constitutes a modeling session utilizing eye movement analysis (cf. Chapter 6). M S3 describes a modeling session conducted for identifying PBPs (cf. Chapter 7). In M S4 , each participant was asked to work on two modeling tasks, orchestrated by the experimental workflow. Therefore, two PPM instances were recorded per participant. In this context, the export feature for using WEKA was utilized (cf. Chapter 8). Further, the data analysis features of CEP have been used for different studies. For instance, data can be exported using the Mining XML format, allowing the usage of ProM, which has been the case in [28–30] for analyzing the PPM. More specifically, a visualization for the PPM integrated in ProM has been proposed in [28, 29]. This visualization was then used for investigating the connection between modeling style and process model quality [30]. Finally, CEP was extended for investigating the PPM in a collaborative setting [72–74, 305]. Summarized, we conclude that RQ1.1 and RQ1.2 were addressed, since CEP allows the efficient execution of modeling sessions and the systematic investigation of the PPM. This is underlined by the following numbers. Only in the context of this thesis 267 modelers utilized CEP to create process models. For each modeler, demographic data and, at least, one PPM instance was recorded, resulting in 383 PPM instances.
5.5 Summary This chapter presents the main features of CEP, intended to support a systematic investigation of the PPM. For this, we define two research questions that should be achieved for efficiently analyzing the PPM, and, on a long–term basis, allow the development of modeling environments that support modelers during the PPM. In this context, CEP supports the execution of modeling sessions by providing a configurable modeling environment and frequently used components. For this purpose, survey components and interactive tutorials can be orchestrated in an experimental workflow. The collected data is automatically transferred to a database server. This way, the recorded PPM instances and the data collected in surveys, e.g., demographics, can be efficiently managed, addressing RQ1.1 . RQ1.2 states that CEP should record all interactions with the modeling environment, allowing to analyze the PPM. This is achieved by developing a configurable modeling environment, which records all interactions with the modeling environ-
46
ment in an event log. This way, the PPM instances can be replayed at any point in time, allowing for a detailed analysis. Finally, we demonstrated the feasibility of using CEP by outlining several empirical studies, which relied on CEP. Summarized, CEP contributes to RQ1 by providing means for systematically investigating the PPM by recording PPM instances. Further, analysis features building the foundation for subsequent investigations regarding the PPM were presented.
47
Chapter 6 Analyzing the Process of Process Modeling This chapter builds upon the capabilities of CEP for recording interactions with the modeling environment by developing means for supporting the data analysis and the generation of hypotheses. More specifically, the interactions with the modeling environment recorded by CEP are categorized to form phases representing different activities within the PPM. This analysis constitutes the foundation for later investigations on the modelers’ behavior, e.g., developing a catalog of PBPs (cf. Chapter 7). This way, this chapter contributes to RQ1 , i.e., how can the PPM be investigated? Modeler 1 (PPM instance 1) ...
A
A
B
C
C
A
C
A C
final process model
Modeler 2 (PPM instance 2) ...
B
B A
A
A
A C
A C
B C
B A
B A
C
C
final process model
Figure 6.1: Two different PPM instances resulting in the same process model
In order to motivate the data analysis technique presented in this chapter, Figure 6.1 illustrates how two PPM instances might be recorded by CEP. In each PPM instance, a modeler interacts with the modeling environment to create a process model by inserting activities, gateways and edges. In this example, both modelers end up with exactly the same process model. Still, when inspecting the various intermediary models of their PPM instances, it can be observed that the process models evolve differently. Modeler 1 creates the model in a straight–forward series
49
of modeling interactions. For this, modeler 1 starts with adding a start event, followed by an activity. Then the control flow is added in several intermediary steps (not depicted in Figure 6.1). Modeler 2, on the contrary, creates two activities A and C, which are connected to the start and end event in a sequence. Now, modeler 2 realizes that an activity B should be mutual exclusive to activity C. To realize this behavior, modeler 2 removes parts from of the process model to add the missing control flow constructs. Then, several model elements are placed on the modeling canvas. Finally, the process model is laid out to complete the process model. By using CEP, all intermediary process models can be accessed by replaying the creation of the process model. When comparing two PPM instances, this approach requires replaying both PPM instances and comparing the intermediary version of the process model manually. This constitutes a cumbersome task, especially when analyzing a higher number of PPM instances. Further, gaining an overview of PPM instances is difficult since all intermediary versions of a process model need to be considered. To facilitate data exploration, this chapter focuses on developing means for making PPM instances more accessible for researchers. This way, supporting data exploration and hypotheses generation. The interactions with the modeling environment recorded by CEP describe the creation of a process model on a fine–grained level. This constitutes a challenge for analysis since mining based on the interactions might result in complicated models of the PPM, which might not represent the actual intention of a modeler, i.e., adding a edge or a gateway might belong to the same high–level activity for the modeler (an alternative approach to visualize individual interactions is presented in [28, 29]). Consequently, we intend to abstract from the individual interactions by aggregating events to phases of the PPM. For this purpose, we rely on insights from the process of programming to form comparable activities for the PPM. Therefore, the first research question of this chapter is to develop a description for the PPM, which can be used in later stages for detecting the different phases of the PPM based on the modelers’ interaction with the modeling environment. RQ1.3 Which activities do modelers perform during the Process of Process Modeling? The description of the PPM can be considered a viable starting point for supporting the analysis of the recorded data. Based on this foundation, a technique to facilitate data analysis should be developed, which allows to (1) gain an overview of PPM instances on a more abstract level and (2) allow the analysis of PPM instances in a semi–automated manner. Gaining an overview of a specific PPM instance
50
supports data exploration by making PPM instances more accessible, allowing researchers to compare several PPM instances. This, in turn, allows the generation of hypotheses that can be investigated in the future. For this purpose, a visualization for PPM instances might be developed, since diagrams are known to support perceptual inferences [144] and are therefore well suited for exploring data [68]. Second, in order to be able to conduct modeling sessions with larger numbers of participants, the technique should support researchers by providing means for executing the data analysis in semi–automated manner. More specifically, the visualizations of PPM instances should be generated automatically. This way, several PPM instances can be compared by generating and analyzing the corresponding visualizations. For this, the recorded interactions might be aggregated to phases identified in RQ1.3 , which can then be visualized. Therefore, the second research question of this chapter can be formulated as follows. RQ1.4 How can Process of Process Modeling instances be analyzed and visualized? The remainder of this chapter is structured as follows. First, Section 6.1 outlines the approach followed to answer RQ1.3 and RQ1.4 . Then, a description of the PPM is derived in Section 6.2. Next, the description of the PPM is used to develop a technique for automatically analyzing PPM instances (cf. Section 6.3). Then, the description of the PPM and the technique for analyzing PPM instances are validated in Section 6.4. A discussion of the findings and the limitations of the technique are presented in Section 6.5. The chapter is concluded with a brief summary in Section 6.6.
6.1 Research outline This section outlines the approach followed to answer the presented research questions. A description of the PPM In order to address RQ1.3 an existing theory, which shares considerable similarities with the PPM, needs to be identified. For this purpose, we rely on insights from the process of programming (cf. Chapter 4), since similarities between process models and computer programs have been noted by various authors [95, 277, 278, 288, 289]. From a cognitive point of view, either task constitutes a problems solving task. According to [167], a problem has four characteristics: an initial state, a goal state, operators for transforming the initial state
51
to the goal state, and restrictions applying to these operators. The modeling or programming task starts with some kind of information on the functionality to be realized and the empty modeling canvas or the modeling environment respectively. Alternatively, an initial process model to be adapted or a program to be altered could be presented to the modeler/programmer. This constitutes the initial state of the problem solving task. Within the boundaries of the available notational system, i.e., for programming or modeling, the developer continually adapts the artifact to reach the goal state. In the context of the PPM, the goal state is a process model representing the desired functionality. Further, [278] identified several similarities between process models and computer programs, including procedural view, compositional structure and script for enactment. Procedural view describes the processing of information within the steps of a computer program or the activities of a process model. In either case, one or more input parameters are transformed to form the desired output. Compositional structure details how higher level constructs can be decomposed into simpler parts, e.g., a structured loop might contain several other workflow patterns. Finally, script of enactment describes the fact that instances of the program or process model can unfold differently depending on the current situation, e.g., due to conditional execution of certain steps of activities. Summarized, several similarities between process models and computer programs exist [95, 277, 278, 288, 289], making the process of programming a viable starting point for investigating the PPM. The similarities between the process of programming and the PPM might be exploited by including similar activities in the description of the PPM. Differences between the process of programming and the PPM might be acknowledged by adapting the description accordingly. For instance, more emphasis might be put on utilizing the secondary notation of a process model, e.g., the process model’s layout, which is hardly considered during the process of programming due to the textual nature of most programming languages. As a result, we derive a description of the different phases of the PPM.
Visualizing the PPM In order to address RQ1.4 , we develop a visualization of PPM instances named Modeling Phase Diagrams (MPDs). For this purpose, the interactions with the modeling environment recorded by CEP are mapped to the different activities of the PPM. This way, the description of the PPM provides a theoretical lens on the data. Next, an algorithm for aggregating the individual interactions with the modeling environment to phases of the PPM is developed. For instance, a series of interactions for laying out the process model might be aggregated to a phase, which is intended to improve the process model’s understandability.
52
Finally, the different phases of the PPM are visualized in a two dimensional chart. By considering phases of the PPM instead of individual interactions, a higher level of abstraction is achieved. This allows to gain an overview of PPM instances, which, in turn, supports data exploration and hypothesis generation. Validation Finally, we perform a validation of RQ1.3 and RQ1.4 , which consists of two modeling sessions, i.e., M S1 and M S2 , making use of CEP. Both modeling sessions conducted for this validation contribute to RQ1.3 by investigating the existence of the derived phases of the PPM. For this purpose, each modeling session focuses on a different aspect of the PPM. In M S1 the cognitive activities are investigated using think aloud, while in M S2 the actual interactions with the modeling environment are of special interest. For this, eye movement analysis is utilized to complement the analysis of the modelers’ interactions with the modeling environment. Additionally, the validation using M S2 considers the algorithm for automatically detecting the phases of the PPM to address RQ1.4 . Further, we demonstrate the usefulness of MPDs by presenting two PPM instances collected in M S2 and outline how MPDs can be utilized for data exploration. This way, the demonstration also contributes to RQ1.4 .
6.2 A description of the Process of Process Modeling As indicated in Chapter 1, this thesis focuses on a setting comparable to the investigations conducted in the realm of the process of programming, asking programmers to develop a computer program based on a textual description. Similarly, the participants of the modeling sessions presented in this thesis are asked to translate an informal textual description into a formal process model using BPMN. In order to address RQ1.3 , a description of the different phases during the PPM is derived from the process of programming. When creating process models, modelers need to create an internal representation of the problem that can be used for reasoning. Then, the internal representation is translated to an external representation. Subsequently, the phases of the PPM based on the cognitive activities suggested for the process of programming are presented. The mapping of the process of programming to the PPM is depicted in Figure 6.2. Problem understanding and method finding are borrowed from the process of programming and adapted for the PPM.1 Solution specification, on the contrary, contains a variety of activities, e.g., writing the sources code or validating the source code [243], leading to the conclusion of 1
While decomposition is an important aspect of the PPM, the more general term method finding is used.
53
Problem understanding
Problem understanding
Problem decomposition / method finding
Method finding
Modeling
Solution specification
Reconciliation
Validation
Figure 6.2: Mapping of the process of programming to the PPM
[243] that solution specification might be refined. For this purpose, [243] suggest the inclusion of a specific validation activity. This line of thought is followed by including validation in the PPM. Further, modelers might be interacting differently with the modeling environment when performing different activities during solution specification, e.g., adding new features to the process model versus improving the process model’s understandability. To differentiate between different types of interactions, the PPM is based on insights on refactoring from software engineering. Refactoring can be defined as a transformation of a software system without altering key aspects of the system’s behavior [56]. Traditionally, the work of [175] is considered to be the first work on refactoring in software engineering, but mainstream adoption has been triggered by Fowler’s catalog of refactorings [56]. [75] suggests the following purposes of refactoring: “improve design of software” and “make software easier to understand”. The improvements regarding software design and understandability should consequently “help to find bugs” and therefore make “programming faster” [75]. Similarly, modelers might interact with the modeling environment in different ways. In modeling phases, modelers are interested in incorporating requirements in the process model. For this purpose, the internal representation, built from requirements, is translated to modeling constructs to include the new functionality in the process model. In reconciliation phases, on the contrary, modelers work on improving the process model without altering the process model’s external behavior. Similar to refactoring in software engineering, modelers are interested in improving the process model’s internal structure and the
54
understandability of the process model. For this purpose, requirements can largely be neglected causing the focus to shift to the process model itself. Similar to the process of programming, modelers are not able to understand the requirements in a single problem understanding phase or create the process model in a single modeling phase. Rather, the process model is created in several iterations of the various phases of the PPM, i.e., the process model is created chunk by chunk. Consequently, the PPM can be expected to be iterative, interleaved, and loosely ordered. Subsequently, the proposed phases of the PPM are described in detail.
6.2.1 Problem understanding In order to develop a process model the requirements have to be understood. During problem understanding, modelers try to understand the textual description of the problem to be modeled. If the modeler is presented with an initial model to be altered, the initial model has to be understood as well. Put differently, modelers extract information from external sources, i.e., the textual description of the modeling task and the existing process model, to build an internal representation of the process to be modeled in working memory [251]. Additionally, the modeler might need to devote resources for understanding the notational system, e.g., to assess which features are available. Due to the limitations of working memory, the full process cannot be understood at once. Therefore, the problem is understood in smaller chunks. Initial problem understanding phases focus on building a rough understanding of the process to be modeled, which is refined in subsequent problem understanding phases of the PPM instance. Prior existence of schemata of the same domain, i.e., integrated chunks of knowledge in long–term memory [85], might influence problem understanding. These schemata support the modeler in organizing the knowledge acquired from external sources, allowing a more efficient usage of working memory. Once an understanding of the problem is established, the modeler can continue translating the requirements to an actual process model.
6.2.2 Method finding After gaining an understanding of the problem, modelers needs to map the acquired knowledge to the modeling constructs provided by the modeling notation [251]. For instance, when the modeler needs to create an optional activity using BPMN, two XOR gateways and the activity have to be used (cf. Figure 4.1). This can be compared to method finding / problem decomposition in the context of the process of programming. Depending on whether the process modeler has prior experience using the notational system, e.g., a plan schema on how to combine the available modeling
55
constructs to solve the problem is stored in long–term memory, the modeler can either directly start creating the process model without devoting any further attention on planning the next steps or has to develop a plan on how to solve the problem. For instance, an experienced modeler does not need to devote any further attention to mapping an optional activity to the corresponding construct used in BPMN. For a beginner, the same task might require substantial effort since the modeler might need to develop the construct used for optional activities in BPMN from scratch. Therefore, creating a plan from scratch puts an additional burden on the modeler, occupying cognitive resources. Similar to the process of programming, prior knowledge regarding other modeling languages of the same modeling paradigm might be exploited (cf. [165]). For instance, exclusive branches are similar when using EPC or BPMN for process modeling. Therefore, knowledge can be transferred from one language to the other. Similar observations have been made for the understanding of process models [208].
6.2.3 Modeling Once the modeler has decided on how to represent the acquired domain knowledge using the modeling constructs, the modeler starts with the actual creation of the process model. More specifically, in order to create an external representation, i.e., the process model, which matches the modeler’s internal representation of the problem, the modeler edits the process model. For this, the modeler externalizes the internal representation of the problem acquired and stored in working memory. For instance, when modeling the control flow using BPMN, modelers add activities to the process model and connect those using gateways, events and edges for describing the process’ control flow. Similarly, when modeling the data flow of the process, data objects are added to the process model. The process modeler’s utilization of working memory influences the number of modeling interactions executed during the modeling phase before forcing the modeler to revisit the textual description for acquiring more information. If schemata for organizing the acquired knowledge are available and plan schemata are guiding the PPM, more information can be stored in working memory, allowing the modeler to make more changes to the process model in this phase. When all information stored in working memory is used for creating the process model, the modeler can either gather additional information by thinking about the task or continue to focus on improving the process model’s understandability.
56
A
B
B Reconciliation
A
C
C
Figure 6.3: Reconciliation
6.2.4 Reconciliation
After putting the desired model elements on the modeling canvas in modeling phases, the modeler might focus on improving the process model’s understandability. Similar to refactoring in software engineering, reconciliation is intended to improve the process model without altering the process model’s behavior. In this context, refactoring techniques for process models have been proposed [288, 289], targeting a better understandability, e.g., Rename Activity for fixing non–intention revealing naming of activities, but also improvements regarding the structure of the process model, e.g., Extract Process Fragment. Additionally, the process model’s secondary notation constitutes a powerful means for improving the understandability of process models [155, 183, 215, 280]. Secondary notation includes the process model’s layout allowing the introduction of typographic cues. For instance, modelers can move activities and gateways and utilize edge bend points to create an appealing layout as illustrated in Figure 6.3. This way, modelers can support subsequent comprehension phases by constraining the inferences made from the model. For example, moving semantically related elements closer together supports loading the model’s content back into working memory, since attention can be focused on a smaller part of the process model. Therefore, the perceptual processes for refreshing information in working memory can be used more efficiently (cf. Section 4.1.2), making the process model more comprehensible for the modeler when coming back to it [183]. In addition, a well laid–out process model, e.g., a process model following the constraints in [94], can help the process modeler to reduce the required cognitive load. However, the modeler’s ability to place elements at the correct position on their creation influences the number of reconciliation phases as this might alleviate the modeler from the need for additional layout changes [197]. Furthermore, the factual use of secondary notation is subject to the modeler’s personal style [183].
57
6.2.5 Validation Finally, modelers might devote time to validate the process model by searching for quality issues in the process model. This has also been observed for the process of programming, leading to the suggestion of [243] to include a specific validation activity. In this thesis, we refine solution specification by including modeling and reconciliation. Additionally, the suggestion of [243] is followed to include a specific phase for validating the process model in the description of the PPM (cf. Figure 6.2). In validation phases, modelers compare the current state of the external representation to their internal representation to identify necessary changes and potential problems. Modelers might perform checks for identifying syntactical, semantical, and pragmatic quality issues in the process model. Syntactic quality issues can be identified by checking the process model for the incorrect usage of modeling constructs. Semantic quality issues can be detected by comparing the process model to the textual description of the process model. Finally, pragmatic quality includes, e.g., the consistent labeling of activities. Validation phases might be interwoven with modeling and reconciliation phases to address the identified quality issues.
6.3 Modeling Phase Diagrams This section addresses RQ1.4 , by presenting an algorithm to map interactions with the modeling environment to high–level phases of the PPM. Further, a visualization for PPM instances, intended to support data exploration and the generation of hypotheses, is presented. The visualization is automatically generated, allowing to conduct the data analysis semi–automatically without interfering with the modeler’s efforts. Section 6.3.1 presents how the different phases of the PPM are detected. Section 6.3.2 describes how the PPM is visualized using MPDs.
6.3.1 Detecting phases of the Process of Process Modeling The development of process models consists of a series of interactions with the modeling environment, e.g., adding activities and edges or moving elements for laying out the process model. Figure 6.4 demonstrates a series of interactions with the modeling environment for a specific PPM instance. The modeler starts with two long phases of inactivity, which are interrupted by a single CREATE NODE interaction. Then, the modeler adds several nodes and edges to the process model, interrupted by a single MOVE NODE interaction. At the end, the modeler moves several nodes and creates bend points for influencing the routing of edges. Now using the theoretical lens on the data presented in Section 6.2, we map the modeler’s interactions
58
Phase
Identification criteria
Comprehension Modeling
No interaction with the system for longer than a predefined threshold Creating model elements (activities, gateways, edges), deleting model elements, reconnecting edges, adding/deleting edge conditions Laying out edges, moving of model elements, renaming activities, updating edge conditions
Reconciliation
Table 6.1: Identification of phases of the PPM with the modeling environment to the phases of the PPM. More specifically, the user interactions are categorized into modeling and reconciliation interactions (cf. Table 6.1). Mapping interactions to high–level phases of the PPM results in two distinct categories of interactions, i.e., modeling and reconciliation. Still, the interactions need to be aggregated to phases to represent different activities of a modeler. Therefore, the following considerations are taken into account to obtain modeling and reconciliation phases from the categorized interactions. Further, we measure the inactivity of modelers to represent cognitive activities of the PPM, i.e., activities where modelers do not interact with the modeling environment. Subsequently, details on how interactions are aggregated to phases are presented. Modeling Based on the description in Section 6.2, modeling phases are intended to alter the behavior of the process model, e.g., new functionality is added to the process model. Therefore, modeling manifests in the creation and deletion of model elements. Hence, a modeling phase consists of a sequence of interactions to create or delete model elements such as activities or edges. In Figure 6.4, one modeling phase can be observed, which is interrupted by a single reconciliation interaction, i.e., MOVE NODE. A single reconciliation interaction following several modeling interactions raises the question whether the single reconciliation interaction should be considered a separate reconciliation phase. Based on our observations, we argue that a single reconciliation interaction following several modeling interactions does not necessarily constitute a reconciliation phase. For instance, a modeler might move a recently created element to compensate for the poor placement of the model element. Therefore, the single intermediary reconciliation interaction in Figure 6.4 should remain part of the modeling phase. This should be considered when developing an algorithm for detecting modeling phases. Reconciliation Reconciliation, on the contrary, is intended to improve the process model’s understandability (cf. Section 6.2). In this context, the usage of secondary
59
MOVE NODE MOVE NODE MOVE NODE CREATE EDGE BEND POINT CREATE EDGE BEND POINT CREATE EDGE BEND POINT CREATE EDGE BEND POINT
CREATE EDGE CREATE EDGE CREATE EDGE
CREATE NODE MOVE NODE
CREATE NODE
CREATE NODE
time Comprehension
Modeling
Reconciliation
Figure 6.4: Interactions with the modeling environment
notation constitutes an important aspect for improving the process model’s understandability. Therefore, interactions for moving elements of the process model or adapting the routing of edges are categorized to reconciliation. Additionally, model elements might be renamed to improve their understandability, e.g., to improve non–intention revealing naming of activities. Therefore, renaming interactions are categorized as reconciliation. Similar to modeling, single modeling interactions following a series of reconciliation interactions should not be considered, e.g., a modeler adds a missing edge while laying out the process model. Phases of inactivity Analyzing the interactions with the modeling environment is well suited for detecting modeling and reconciliation phases. Unfortunately, the cognitive phases of the PPM, i.e., problem understanding, method finding, and validation, are more difficult to distinguish. Either cognitive phase might manifest itself through inactivity with the modeling environment. For instance, in problem understanding the modeler might be focused on the textual description to understand the requirements to be modeled. In an attempt to quantify the inactivity with the modeling environment, comprehension phases are included in modeling phase diagrams, subsuming problem understanding, method finding, and validation.2 Subsuming the cognitive phases to comprehension constitutes a trade–off between the simplicity of measuring, i.e., not requiring additional techniques like think aloud, and the accuracy of the data. Complementing CEP with think aloud would increase the accuracy 2
While comprehension might not be the most accurate term, it is still used to remain compatibility with earlier works.
60
of the phase detection, but would also increase the required effort to analyze the data. Therefore, we decided to subsume cognitive activities to comprehension, which allows to analyze a larger number of PPM instances semi–automatically. Comprehension phases are detected using thresholds, which define the minimum duration of a comprehension phase. Figure 6.4 shows two long phases of inactivity at the beginning of the PPM instance. Therefore, phases of inactivity should be detected as comprehension phases. The two long phases of inactivity depicted in Figure 6.4 are interrupted by the creation of a single node. Similar to modeling and reconciliation, the creation of a single model element is not considered a separate modeling phase, since users sometimes move single elements of the process model or add single elements, e.g., a start event, while making sense of the textual description and the process model. Therefore, the two phases of inactivity in Figure 6.4 should be detected as a single comprehension phase. Phase detection Algorithm 1 shows the procedure for extracting the phases of the PPM from the modeler’s interactions with the modeling environment logged by CEP. Comprehension phases are identified in lines 3–4 of the algorithm by evaluating the time between interactions and comparing it to the minimal duration of a comprehension phase defined by thresholdc . A threshold for the minimum duration of a comprehension phase is necessary to avoid identifying comprehension phases between interactions that are part of usual modeling activity. Next, it has to be identified whether interactions of a different type compared to the current phase actually constitute a different phase or whether they should be added to the previous phase (cf. the single reconciliation interaction in the modeling phase in Figure 6.4). For this purpose, a look ahead is implemented that identifies the number of interactions of the same type in the upcoming phase (line 6). In case the upcoming phase is of the same type as the previous phase, e.g., a CREATE NODE interaction followed by a CREATE EDGE interaction, the interaction is added to the previous phase (line 8). Otherwise, the duration of the upcoming phase is assessed by computing the time between the first interaction and the last interaction of the upcoming phase (line 10). If the duration is longer than thresholdd a new phase is created and added to the list of identified phases (line 11). If the duration is smaller than thresholdd , the interaction is added to the previous phase. This is necessary to avoid creating additional phases for brief interactions of a different phase following the current phase (cf. Figure 6.4). This results in a smoother MPDs, representing the PPM instance on a more abstract level. Whenever time periods between modeling and reconciliation phases shorter than thresholdc occur, gaps in the MPD can be identified. This indicates that the
61
time period is too short to be detected as a comprehension phase. Therefore, the time period is not added to the previous phase or the next phase since it cannot be determined in which phase the modeler is (cf. the gap between modeling and reconciliation in Figure 6.4). Algorithm 1 Extracting phases of the PPM Require: interactions [I1 , I2 , . . . In ] Require: thresholdc , thresholdd 1: phases ← [new comprehension phase] 2: for all i such that 1 ≤ i ≤ n do 3: if i > 1 and durationBetween(Ii−1 , Ii ) > thresholdc then 4: add new comprehension phase to phases 5: previousP hase ← last(phases) 6: upcomingP hase ← identif yU pcomingP hase(interactions, Ii ) 7: if upcomingP hase = previousP hase then 8: add Ii to previousP hase 9: else 10: if duration(upcomingP hase) > thresholdd then 11: add upcomingP hase to phases 12: else 13: add Ii to previousP hase Figure 6.4 illustrates two comprehension phases that are separated by a single modeling interaction. As comprehension phases interrupted by brief interactions should be merged, Algorithm 2 processes the output, i.e., a list of phases, of Algorithm 1 for merging comprehension phases. For this purpose, situations comprising two comprehension phases being separated by an intermediary modeling or reconciliation phase are identified (line 2). If the duration of the intermediary phase is smaller than the thresholda the two comprehension phases and the intermediary phase are merged to a single comprehension phase (line 3). Next, the three phases, which have been merged, are removed from the list of phases (line 4) and the newly created phase is inserted (line 5). The counter i is reduced in a next step to ensure that the merged phase is also considered for merging with subsequent phases (line 6).
6.3.2 Visualizing the Process of Process Modeling In order to support data exploration and hypotheses generation, MPDs are presented to visualize PPM instances. Such a diagram quantitatively highlights the detected
62
Algorithm 2 Merging of comprehension phases Require: phases [P1 , P2 , . . . Pn ] Require: thresholda 1: for all i such that 2 ≤ i ≤ size(phases) − 1 do 2: if Pi−1 and Pi+1 are comprehension phases and duration(Pi ) < thresholda then 3: temp ← merge(Pi−1 , Pi , Pi+1 ) 4: remove(Pi−1 , Pi , Pi+1 ) f rom phases 5: insert temp into phases at position i − 1 6: i←i−1
phases of the PPM, i.e., modeling, reconciliation, and comprehension, in a two dimensional chart. The MPDs for Figure 6.1 are sketched in Figure 6.5 (b) and Figure 6.5 (d). The horizontal axis represents the time needed by the modeler to create the process model. Timing starts when the modeling environment is opened. The size of the process model is denoted on the vertical axis. The size is measured by counting the number of elements in the process model. Whenever a node or edge is added, the size of the process model increases. Whenever an element is removed, the size decreases. The three different phases, i.e., comprehension, modeling and reconciliation, are represented by three different line types. Dotted black lines represent comprehension phases, solid black lines denote modeling phases and solid gray lines are utilized to represent reconciliation phases. Based on the intermediary models in Figure 6.5 (a), we argue that PPM instance 1 shows a straight–forward creation of the model. Unfortunately, information on phases of inactivity is missing when considering the intermediary process models. This shortcoming is addressed in MPDs. Figure 6.5 (b) illustrates the MPD for PPM instance 1. The modeler creates the model in a series of modeling phases interrupted by periods of comprehension. No elements are removed from the process model and no dedicated reconciliation phases can be observed. The intermediary models of PPM instance 2 (cf. Figure 6.5 (c)) indicate phases where modeling elements are removed from the process model. Additionally, we would expect additional phases of reconciliation since activities were moved. The MPD in Figure 6.5 (d), i.e., the MPD for PPM instance 2, shows a modeling phase where the number of elements in the process model decreases. Further, two reconciliation phases can be identified. Note that the resulting models are identical. Yet, the MPDs indicate differences between both PPM instances. This illustrates the value of analyzing PPM instances in the described manner beyond the inspection of the process models themselves.
63
Modeler 1 (PPM instance 1) a)
...
A
A
B
B
B A
A
A
C
C
C
# elements
b)
time
Modeler 2 (PPM instance 2) c) ... A C
A
A C
A
B C
C
B
B
A
A C
C
# elements
d)
time
comprehension (no modeling actions)
modeling
reconciliation
Figure 6.5: MPDs for the PPM instances in Figure 6.1
This way, MPDs can support data analysis and the generation of hypotheses, i.e., RQ1.4 .
6.4 Validation As outlined in Section 6.1, this section validates the contributions made to RQ1 by conducting two modeling sessions. RQ1.3 is investigated in M S1 and M S2 . For this purpose, we utilize think aloud and eye movement analysis to perform method triangulation. This way, the weaknesses of one approach can be compensated by the strengths of the other approach [61, 120]. RQ1.4 is validated in M S2 by utilizing the presented phase detection algorithm and demonstrating how MPDs can be utilized for data exploration. Subsequently, details for each modeling session and the demonstration of MPDs are presented. M S1 : Cognitive activities of the PPM M S1 is conducted to validate the description of the PPM proposed in Section 6.2 by investigating whether the description adapted from the process of programming is appropriate, i.e., can the proposed phases of the PPM be identified. In order to investigate the cognitive activities of the PPM, i.e., problem understanding, method finding, and validation, the interactions with the modeling environment have to be complemented with a different
64
technique to gain insights into cognitive processes. For this purpose, think aloud is utilized (cf. [65]). Think aloud allows researchers to gain insights into the cognitive processes during problem solving, capture patterns of information use, and gain insights into intentions [36]. For this purpose, the modelers participating in M S1 are asked to verbalize their thoughts while creating the process model. To collect the modelers verbalizations, the modeling sessions are videotaped. This way, we intend to validate whether the cognitive phases of the PPM can be identified. Further, the process of programming did not include separate phases comparable to modeling and reconciliation. Therefore, we intend to generate insights regarding the intentions of modelers during modeling and reconciliation to validate whether this distinction exists for the PPM. By investigating the existence of phases, M S1 contributes to validating RQ1.3 . M S2 : Modeling and reconciliation In M S1 we observed that investigating modeling and reconciliation is sometimes difficult using think aloud as modelers often just commented about the interactions. This was also observed during research on the process or programming, stating that verbal utterances are often not explicitly linked to the created artifact [217]. Therefore, M S2 is complementary to M S1 by focusing on modeling and reconciliation and by utilizing the presented phase detection algorithm. Further, the analysis of the interactions with the modeling environment is complemented with eye movement analysis to have a different perspective on the PPM. Eye movement analysis allows to quantify the modeler’s visual attention by recording the number of times the modeler looks at specific areas on the screen in certain timeframes. We postulate that modeling phases are intended to add or remove content to the process models, while reconciliation is intended improve the process models’ understandability. Based on this assumption, we assume a different way of interacting with the modeling environment. In modeling phases, modelers access the task description to incorporate new knowledge in the process model. In contrast, we would expect only a limited amount of interest in the task description during reconciliation, since improving the process model’s understandability can often be performed without accessing the task description, e.g., by laying out the process model. This assumption is put to the test in M S2 . This way, M S2 contributes to RQ1.3 by investigating differences between modeling and reconciliation. Additionally, M S2 supports the validation of RQ1.4 by making use of the phase detection algorithm to detect the phases of the PPM. Demonstration: MPDs Finally, we demonstrate the usefulness of MPDs for data exploration by presenting two PPM instances collected in M S2 . For this purpose, the
65
MPDs for two PPM instances are generated and used to identify differences between the two modelers. Chapter 7 follows this approach in order to identify reoccurring behavior of modelers by developing a catalog of PBPs. The demonstration of MPDs contributes to RQ1.4 , by demonstrating their usefulness for data exploration. The remainder of this Section is structured as follows. Section 6.4.1 presents M S1 and the data analysis using think aloud. Section 6.4.2 details on M S2 and Section 6.4.3 demonstrates the use of MPDs for data exploration.
6.4.1 M S1 : Problem understanding, method finding, and validation In order to deepen our understanding on the cognitive activities involved in creating process models, a think aloud study with students of computer science and information systems was conducted. The verbal utterances in the obtained protocols are coded using a coding scheme based on the phases of the PPM described in Section 6.2. This way, insights on the existence of respective phases within the PPM can be established, addressing the validation of RQ1.3 . Subsequently, data collection, data validation, and the results are presented. Finally, the findings including the study’s limitations are discussed. Data collection To address RQ1.3 , a modeling session with students of computer science and information systems is performed. The participants are asked to verbalize their thoughts during the problem solving task. The modeling session analyzed in this work is part of a larger investigation on the influence of change patterns [290] on the PPM. In this context, modelers were asked to perform modeling tasks using change patterns and BPMN. Since this work is not intended to investigate the influence of using change patterns for modeling specifically, the modeling task using change patterns is not considered for further analysis. Subjects M S1 is designed to investigate the cognitive activities of the PPM, i.e., problem understanding, method finding, and validation. Expert modelers are not required in order to observe the understanding of the problem, the mapping to modeling constructs, and the validation of the process model. Still, a certain modeling competence of the participating subjects is required to avoid an abundance of method finding, which would be caused by a lack of knowledge on how to utilize the constructs of the modeling language. Similarly, no special demands in terms of prior domain knowledge were imposed, since all information was present in the textual description of the modeling task. Further, by drawing the sample from students on
66
business process management, we assume that the participants are representative for the modeling community in terms of cognitive characteristics. Objects The modeling session is designed to collect PPM instances of students creating a formal process model in BPMN from an informal description. Selecting a modeling task of the right complexity is difficult since it has been observed that very difficult tasks reduce verbalizing [5, 16, 65]. On the contrary, the same has been observed for very easy tasks [19]. Therefore, we decided to use a smaller modeling task, which consists of 11 activities. The modeling task includes the basic control flow patterns: sequence, parallel split, synchronization, exclusive choice, and simple merge [272]. Further, the task description was presented in a sequential, unambiguous manner to facilitate the creation of the process model [263]. The object that was to be modeled is a process describing the handling of a mortgage request by a bank (cf. Appendix A.3). Instrumentation and data collection The modeling session was structured as illustrated in Figure 6.6. First, the participants completed a demographic survey. Then, the participants completed a modeling task using change patterns [290]. Next, a different modeling task was executed without change patterns. For this, a subset of BPMN focusing on control flow was used. Last, the participants completed a concluding survey. Each modeling task was preceded by an interactive tutorial explaining the features of the modeling environment. For both modeling tasks, the modelers were asked to verbalize their thoughts, i.e., to think aloud [65]. The modeling sessions were videotaped in order to collect the verbal utterance of the participants. The video camera was positioned to record the computer screen to enrich the verbal protocols with information on the interactions with the modeling environment. This facilitated the coding of verbal protocols as described in Section 6.4.1. Whenever participants stopped talking, they were reminded to keep verbalizing their thoughts. No restrictions were imposed on the language used for verbalizing their thoughts. The participants were allowed to use as much time as desired on the modeling task. Enter code
Demographic survey
Change patterns tutorial
Change patterns modeling task
BPMN tutorial
BPMN modeling task
Post modeling survey
Feedback
Figure 6.6: Experimental workflow of M S1
CEP was used for executing the modeling session (cf. Chapter 5), providing a configurable modeling environment that can be tailored to the needs of the specific
67
1. Familiarity mortgage processes 2. 3. 4. 5. 6. 7. 8.
Process modeling expert Process modeling experience Formal training last year Self–education last year Models read last year Models created last year Avg. size of models
9. Familiarity BPMN 10. Understanding BPMN 11. Modeling BPMN 12. BPMN usage
Scale
Min
Max
M
SD
1–7
1
4
2.00
1.10
1–7 years days days models models activities
2 0 0 0 3 0 7
6 5 22 12 30 50 15
4.00 2.33 7.17 4.83 17.17 20.00 11.17
1.41 2.16 7.99 5.15 9.39 17.89 3.43
1–7 1–7 1–7 months
4 4 4 1
6 6 6 24
5.00 5.33 4.67 13.50
0.89 0.82 0.82 7.71
Table 6.2: Demographic data of M S1 modeling session. To avoid overstraining the participants, the influence of the notational system was limited. More specifically, language constructs the participants might not be aware of were avoided [40]. Instead a subset of BPMN focusing on basic control flow structures was used. Modeling session execution Each modeler was recorded individually. 6 students of computer science or information systems who have taken classes on business process management participated in the study. The modeling sessions were conducted in summer 2011 at the University of Innsbruck. The experiment was guided by CEP’s experimental workflow engine (cf. Chapter 5), leading students through an initial survey, a tutorial for change patterns, the change patterns modeling task, a BPMN modeling tutorial, the BPMN modeling task, and a feedback questionnaire. The participation was voluntary. Data validation The data collected in the demographic survey is considered for checking whether the participants of the modeling session match the profile in terms of prior modeling experience. In Table 6.2 the demographic data is presented. Answers using rating scales were given on a Likert scale with values ranging from Strongly disagree (1) over Neutral (4) to Strongly agree (7). Open questions, e.g., question 3, were answered using text input boxes. The questionnaire was designed to screen the participants for prior domain knowledge, prior knowledge regarding pro-
68
cess modeling in general and BPMN specifically. For this purpose, the questionnaire used in [155] was utilized. The participants of the study reported an average process modeling experience of 2.33 years (SD = 2.16). Further, the modelers reported an average familiarity with BPMN of 5.00 (SD = 0.89), i.e., somewhat agree. Similar values were reported for the competence in understanding BPMN and using BPMN for process modeling. Additionally, the transcripts of the participants were checked whether they are usable for further analysis, since substantial differences can be observed in terms of how well people verbalize their thoughts, even after a period of training [276]. For instance, people might forget to verbalize their thoughts [18]. Further, [35] noted that some people might not be “especially proficient at verbalizing their thoughts”, even if the participants were trained in thinking aloud. [19] speculated that this might be caused by the limited working memory capacity of the participants. In M S1 , one participant merely described the interactions with the modeling environment, hardly articulating thoughts that were not directly connected to creating the process model, e.g., “connecting the elements. . . add another XOR. . . connecting ok”. Analyzing this transcript would result in a high number of modeling phases, while insights on the cognitive processes would remain limited. To avoid blurring the results of the modeling session by shifting the focus toward modeling and reconciliation, the participant was removed for further analysis. Data Analysis In order to analyze the verbal utterances, the procedure suggested in [65] is followed, consisting of the following activities. (1) (2) (3) (4) (5) (6) (7) (8)
Devise encoding schema Record the verbalizations Transcribe the verbalizations Segment the verbalizations Aggregate segments into episodes Encode the episodes Check reliability of coding Analyze code patterns
In the context of this work, the coding schema is derived from the PPM as described in Section 6.2. Therefore, the codes problem understanding, method finding, modeling, reconciliation, and validation were used. Additionally, a category other is used for verbal utterances that do not fit the coding scheme (1). As described, the modeling sessions were videotaped to obtain the verbal protocols (2).
69
Coding
Example
Problem understanding
“then the reason for being negative is registered and closed (reading) the question is it easier eee. . . ” “the checks are parallel so AND” “let’s model this (add activity) and aaa reject and close mortgage em (add sequence flow)” “ok (layouting) this should be here” “ok, looks good, let’s check it more thoroughly. . . ”
Method finding Modeling Reconciliation Validation
Table 6.3: Coding examples Then, the videos were transcribed for further analysis (3). Several possibilities exist for segmenting the verbalizations, e.g., pause bounded utterance or completed thoughts [115]. In this modeling session, the verbalizations were segmented based on thoughts. Switches between segments were mostly indicated by pauses. Further, certain words frequently indicated the beginning of new segments, e.g., “ok” (4). The segments were then aggregated to episodes, e.g., a modeler creating several model elements divided by short pauses (5). Aggregating the segments to episodes already requires a certain degree of judgment by the encoder [115]. For this purpose, the video recordings proved valuable since the recorded modeling environment often supported the aggregation of segments. Then, the episodes were encoded using the encoding schema based on the description of the PPM. Table 6.3 displays examples from the modeling session for each episode type. As done before, the video recordings were utilized to support the interpretation of verbal utterances (6). In order to ensure the reliability of the coding, the coding was performed by two researchers independently. Differences regarding codings were discussed to obtain the final coding (7). The results of the analysis are presented subsequently (8). Results In order to address the validation of RQ1.3 , it is investigated whether the phases derived from the process of programming can be identified for the PPM. For this, characteristics for each PPM phase as identified in the verbal protocols are presented. Further, example verbal utterances and the number of identified episodes are described. Problem understanding Problem understanding was indicated by verbal utterances on the understanding of the textual description. More specifically, verbal utterances in problem understanding phases are independent of the modeling con-
70
structs to be used for realizing the process model. Therefore, problem understanding involved reading the textual description and reasoning on the acquired knowledge. For instance, one participant uttered “. . . ok what happens next. . . (reading) if blabla . . . ok obviously there are only two scenarios, quasi if one check fails something happens. . . ”.3 Understanding issues regarding the modeling environment were rarely observed. Only in one occasion, a modeler wondered why edge bend points were removed after reconnecting the corresponding edge (the default behavior in CEP): “why did this happen?”. In total, 47 of 254 (18.50%) episodes were coded to problem understanding. Method finding Method finding included episodes indicating the mapping of acquired knowledge to the available modeling constructs. For instance, utterances similar to the following were frequently encountered: “ok there is a distinction this or that, meaning we need an XOR”. Similar verbal utterances were observed when modelers needed to use AND gateways: “obviously those activities are in parallel, meaning we need AND”. Method finding was observed to be the second most frequent type of episodes, i.e., 65 of 254 (25.59%). The high importance of method finding is consistent with findings on the process of programming (cf. Section 4.2). Modeling Modeling episodes were identified by considering the interactions with the modeling environment, which could be observed using the video recordings. Further, the verbal utterances accompanying the changes to the process model were considered. A typical utterance in a modeling phase was the following: “we add a join, an XOR join. . . again sequences flows”. [217] noted for the process of programming that verbal utterances cannot always be explicitly linked to the program code. In this modeling session similar observations were made. Sometimes modelers did not talk about the interactions with the modeling environment, or uttered only single words. For instance one participant uttered “connect” to describe the creation of an AND gateway and several sequence flows. In such situations the video recordings proved valuable. Additionally, it was observed that modelers accessed the textual description in modeling phases. In several cases this was done for looking up names of activities. For instance, one participant uttered: “let’s model this (add activity) and aaa reject and close mortgage [. . . ]”. After adding the activity to the canvas, the modeler had to decide on the name of the activity. For this, the modeler accessed the textual description. This can be done using lightweight perceptual processes (cf. Section 4.1.2). Modeling constituted the most common episode type with 87 of 254 (34.25%) episodes. 3
Quotations are translated to English
71
Reconciliation For identifying reconciliation episodes the same procedure as for modeling episodes was followed, considering the interactions with the modeling environment and the verbal utterances. Similarly, modelers sometimes did not talk about moving elements of the process model. Others explained the rational of moving some elements of the process model: “let’s move that part to make it more clear. . . ok” or “we can save some space here”. In total, 39 of 254 (15.35%) reconciliation episodes were observed. Validation 5 of 254 (1.97%) episodes related to validating the process model were identified. Validation was indicated by verbal utterances similar to the following: “ok, let’s check the activities again. . . I just realized that the end event is missing”. Interestingly, only 3 of the 5 transcripts contained verbal utterances related to validation. Further, all validation episodes were toward the end of the respective PPM instances. Other Additionally, 11 of 254 (4.33%) episodes were identified that did not fit the coding schema. One participant uttered: “then we scroll to the right”, which could not be assigned to any of the phases. The remaining 10 of 254 (3.94%) episodes were related to planning the PPM instance. For example, one participant uttered: “I’ll just read the first two sentences quickly to get an overview” or “I think I am finished”. Similar to [20], planning episodes were not considered as method finding, but rather a process by itself on a different level of abstraction. Discussion Summarized, it was possible to identify verbal utterances indicating the existence of the phases of the PPM as derived from the process of programming, i.e., RQ1.3 . More specifically, problem understanding and method finding could be distinguished. Further, specific validation phases were observed, which were intended for checking the process model. Additionally, two phases of actual interactions with the modeling environment were observed, i.e., modeling and reconciliation. The interactions with the modeling environment in modeling and reconciliation were accompanied with verbal utterances pointing toward different intentions of the respective phases. While modeling was intended to add functionality to the process model, e.g., “we add a join, an XOR join. . . again sequences flows”, reconciliation phases were accompanied by verbal utterances indicating the improvement of the process model’s understandability without altering the process model’s behavior, e.g., “let’s move that part to make it more clear. . . ok”. Still, modeling and reconciliation phases
72
turned out to be challenging to investigate using think aloud—an observation already made for the process of programming [217]. This seems reasonable since literature reports on difficulties when investigating easy tasks using think aloud [19]. Once the modeler has decided on how to create the intended modeling construct during method finding, the actual interactions to create the desired construct are not challenging. This might explain why verbal utterances were sometimes hardly related to the actual process model, or modelers did not talk at all while interacting with the modeling environment. Therefore, this aspect will be further investigated in Section 6.4.2 using eye movement analysis. Limitations of M S1 The presented study has a series of limitations that should be considered. This section presents only limitations for M S1 . Limitations that apply to all modeling sessions presented in this thesis are discussed in Section 9.4. First, the small sample size certainly constitutes a limitation. While small sample sizes can be attributed to higher amount of time required to collect and analyze verbal protocols [115] and [255] points out that verbal protocol analysis is often carried out with ten or fewer subjects, the results of this study cannot be generalized to the modeling community at large. Further modeling sessions will be required to deepen the understanding on the cognitive activities involved in the PPM. Second, the occurrence of certain phases is influenced by the properties of the modeling task and the provided features of the modeling environment. For instance, the modeling task used in this modeling session was rather small, focusing on control flow structures. Adding more elements of the BPMN notation would probably further increase the number and/or the duration of method finding phases. Similarly, a more complex task could trigger more, and longer reconciliation episodes as it gets more complicated to maintain an appealing layout throughout the PPM instance. In this context, different layout strategies might be identified, e.g., laying out the process model once at the end versus continuous layout changes throughout the PPM. Validation was mostly observed at the end of PPM instances. With an increase in model size, more and longer validation phases might be observed. Modelers might also add intermediary validation phases instead of validating the whole process model at the end. Therefore, the relatively simple modeling task cannot be considered representative for process modeling at large. For this purpose, further investigations on the characteristics of modeling tasks are in demand. Finally, verbal protocol analysis is necessarily a subjective form of analysis, due to the required judgment for segmentation, aggregation of episodes and coding [115]. In order to counter a potential bias, coding was performed by two researchers inde-
73
pendently. The resulting codings were discussed until a final coding was established both researchers agreed on. Still, a potential bias when coding the verbal utterances cannot be ruled out entirely.
6.4.2 M S2 : Modeling and reconciliation In M S1 , the focus was put on the cognitive phases of the PPM, which do not necessarily involve interacting with the modeling environment, i.e., problem understanding, method finding, and validation. M S2 is intended to complement M S1 by inspecting the phases involving actual interactions with the modeling environment, i.e., modeling and reconciliation. In M S1 , modeling and reconciliation could be observed, but a detailed analysis was difficult since the interactions with the modeling environment were often only accompanied by short and vague verbal utterances. Therefore, a more thorough investigation is in demand as we adapted the process of programming to distinguish between modeling and reconciliation. As a consequence, M S2 focuses on whether modelers interact differently with the modeling environment during modeling and reconciliation. For this purpose, the qualitative analysis of M S1 is complemented with a quantitative analysis of the modeler’s eye movements to triangulate toward a better understanding of the PPM. This way, M S2 contributes to the validation of RQ1.3 . Eye movement analysis allows to quantify the modeler’s visual attention by recording the number of times the modeler looks at specific areas on the screen in certain timeframes. For analyzing eye movements, the technique relies on the assumption that eye tracking data is related to visual attention and consequently to internal processing [121]. It has been argued that tasks like reading are difficult to assess using verbal protocols [258]. Further, [84] argue that eye tracking is well suited for investigating problems solving since the influence on the decision process is limited. Therefore, eye movement analysis seems appropriate to investigate how modelers interact with the modeling environment during modeling and reconciliation. In M S1 it was observed that modelers focused on the process model in modeling phases, but still interacted with the textual description to refresh their internal representation, e.g., “another activity, which is called e. . . check applicant employment status”. On the contrary, the textual description was only accessed to a limited extent during reconciliation. This seems reasonable since the textual description is often not necessary to improve the process models understandability, e.g., by laying out the process model. Therefore, M S2 investigates whether modelers focus on different aspects of the modeling environment in modeling and reconciliation phases. For this purpose, we utilize the phases extracted by the presented algorithm
74
to compare modeling and reconciliation. This way, the analysis relies on the phase detection algorithm, contributing to the validation of RQ1.4 . Subsequently, the modeling session using eye movement analysis is described. First, the data analysis procedure is outlined. Then, the results are presented. Finally, the findings are discussed and limitations of M S2 are presented. Data collection M S2 is conducted with students of computer science and information systems. The participants were recorded using an eye tracker when creating a formal process model from an informal task description. Subjects In this modeling session, the interactions with the modeling environment are investigated. In order to observe how modelers interact with the modeling environment during modeling and reconciliation, the participants are not required to be experts in modeling business processes. Still, the targeted subjects should have some prior experience with business process management and imperative process modeling notations. More specifically, they should have prior experience in creating process models using BPMN. Modelers who are not familiar with BPMN are not targeted, since major difficulties with the modeling notation might impact modeling and reconciliation. Similar to M S1 , no special demands in terms of domain knowledge are imposed and we assume that the participants are representative for modelers in terms of cognitive characteristics, e.g., working memory capacity. Objects The modeling session was designed to collect PPM instances of students creating a formal process model in BPMN from an informal description. The informal description was formulated in German since participants were native German speakers, avoiding potential translation problems. Since it has been shown that the task description influences the outcome of the modeling endeavor [195] and presumably the PPM, the guideline of [263] to present the task description in a sequential, unambiguous manner was followed. The object to be modeled is slightly larger compared to M S1 and describes the handling of a mortgage request by a bank (cf. Appendix A.3). The process model consists of 19 activities and contains the basic control flow patterns: sequence, parallel split, synchronization, exclusive choice, simple merge and structured loop [272]. Instrumentation and data collection The same BPMN subset focusing on control flow as in M S1 was used to make the results comparable. CEP was utilized as a modeling environment embedded in CEP’s experimental workflow (cf. Chapter 5).
75
Enter code
Demographic survey
Tutorial
Eye‐tracker calibration
Modeling task
Post modeling survey
Feedback
Figure 6.7: Experimental workflow of M S2
Figure 6.8: The BPMN modeling environment
The experimental workflow of M S2 is illustrated in Figure 6.7. The modeling session started with a demographic survey and a tutorial explaining the features of the modeling environment. Then, the eye tracker was calibrated. Next, the modeling task was executed. Finally, the modeling sessions was concluded with a survey and a feedback questionnaire. For performing the eye movement analysis, a table mounted eye tracker, i.e., Eyegaze Analysis System4 , was used, recording eye movements using two binocular cameras positioned beneath a 17” computer display with a frequency of 60 Hz each. Data recording was carried out with the pupil center corneal reflection method [173]. Data collection and analysis was performed using NYAN 2.05 . The eye tracker was calibrated for each participant individually; calibrations were accepted if the fixation accuracy shows an average drifting error of at most 6.35 mm. Two observation monitors allow watching both eyes separately while in the process of eye–tracking to correct the sitting posture of participants to recalibrate during recording if necessary. In order to analyze whether modelers focus on the modeling canvas or on the textual description of the modeling task, the textual description is placed next to the modeling canvas as illustrated in Figure 6.8. This is necessary since a table 4 5
http://www.eyegaze.com http://www.interactive-minds.com
76
1. 2. 3. 4.
Age Gender Computer usage Modeling tool usage
5. Familiarity mortgage processes 6. Process modeling expert 7. Process modeling experiencea 8. Formal training last year 9. Self–education last year 10. Models read last year 11. Models created last year 12. Avg. size of models 13. 14. 15. 16.
Familiarity BPMN Understanding BPMN Modeling BPMN BPMN usage
Scale
Min
Max
M
SD
years m/f 1–7 1–7
21
36
27.08
6 3
7 7
2.87 76% male 6.92 0.28 5.92 0.95
1–7
1
7
3.04
1.88
1–7 years days days models models activities
1 0 0 0 0 2 5
6 10 10 14 60 30 50
4.00 2.88 1.84 2.88 19.52 10.56 16.80
1.47 2.35 2.48 3.81 19.11 9.18 11.55
1–7 1–7 1–7 months
2 4 4 1
7 7 7 50
4.84 5.76 5.40 20.46
1.28 0.97 1.04 14.74
a
One modeler reported an implausible value and was therefore not considered in this overview.
Table 6.4: Demographic data of M S2 mounted eye tracker was used, which detects only fixations on the screen. A pilot study was conducted to ensure the usability of the tool and the understandability of the task description. Modeling session execution Since only a single eye tracker is available, each modeler has to be recorded individually. 25 students of computer science or information systems participated in the study. Each participant had taken or was currently participating in classes on business process management including the creation of business process models in BPMN. The modeling sessions were conducted in spring 2012 at the University of Innsbruck. 76% of the participants were male. The average age of the participants was 27.08 years (SD = 2.87). Participation was voluntary and data collection was performed anonymously. Data validation Subsequently, the demographic data is considered for assessing whether the participants fit the intended profile in terms of prior modeling knowl-
77
edge. As indicated previously, participants were asked to provide us with their demographic data as part of the modeling session. Table 6.4 provides an overview of the participant’s demographics.6 Answers were given using a Likert scale with values ranging from Strongly disagree (1) over Neutral (4) to Strongly agree (7). Open questions, e.g., question 7, were answered using text input boxes. The questionnaire contained a series of general questions on computer usage and modeling tool usage (questions 3–4). Additionally, prior experience regarding the modeling domain (question 5) was assessed. Using the questionnaire of [155], subjects were screened for prior modeling experience and familiarity with BPMN (questions 6–16). Not surprisingly, the students reported excellent computer usage skills and a high familiarity with modeling tools (questions 3–4). More importantly, modelers reported familiarity with BPMN and prior process modeling knowledge (questions 6– 16). In a nutshell, the participants have created business process models in the past and have created some process models using BPMN, matching the targeted profile for this modeling session. Unfortunately, difficulties occurred with one participant when performing the eye tracking. The modeling session had to be aborted in order to re–calibrate the eye tracker. Afterwards, the modeling session was restarted and completed successfully. This participant was removed for further analysis, leaving a total of 24 modelers. Data analysis When creating a formal process model from an informal specification, a modeler relies on the visual perception for reading the task description and creating the process model using the modeling environment. In this context, high–resolution visual information input is of special interest, which is necessary for reading a word or seeing an element of the process model. High–resolution visual information input can only occur during so–called fixations, i.e., the modeler fixates the area of interest on the screen with the fovea, the central point of highest visual acuity [200]. Fixations can be detected when the velocity of eye movements is below a certain threshold for a predefined duration [117]. Using eye fixations, areas on the screen the modeler is focusing attention on can be identified [78], e.g., the task description, features of the modeling environment, or modeling constructs. In order to perform a detailed analysis, the modeler’s eye movements need to be quantified. For this purpose, several different parameters exist [204]. In this study, the focus is put on the number of fixations, which is one of the most widely used eye movement parameters [117]. Fixations are analyzed by counting the number of fixations in a prespecified timeframe on a certain area on the screen. This allows researchers to compare the number of fixations on certain areas on the computer screen, i.e., 6
Questions and answers are translated to English.
78
the task description versus the modeling canvas. Comparisons are conducted using SPSS (version 21.0). Subsequently, it is described how PPM phases are detected and how the fixations are calculated. PPM phases In order to analyze the fixations on certain parts of the modeling environment, pre–processing of the data is required. First, the phases that should be used for comparison have to be determined. More specifically, modeling and reconciliation phases have to be detected to make them usable for data analysis. For this purpose, the algorithm described in Section 6.3 is used, which detects the phases of the PPM by categorizing the interactions with the modeling environment and aggregating them according to the phases of the PPM. For this the following thresholds are used: thresholdc = 15s; thresholdd = 2s; thresholda = 4s. Fixations A list of comprehension, modeling and reconciliation phases is generated for each participant. For each phase, the start and end time within the PPM instance is available. The identified phases are then used to cut the video files recorded by the eye tracker using the start time and end time of the respective phase. For each phase, i.e., comprehension, modeling and reconciliation, a video file representing the phase is available. Then, so called areas of interest are defined using NYAN 2.0. One area of interest represents the modeling canvas, the other area of interest represents the textual description. For each phase, the number of fixations for each area of interest is calculated. Quality of the analysis is maximized by taking random samples and verifying their results and by performing plausibility checks on the obtained results. In order to obtain an accurate picture of the distribution of fixations on the textual description and the process model for each participant, the percentage of fixations on the textual description out of all fixations for each phase type is calculated. This is accomplished by summing up each participants’ fixations on the textual description for each PPM phase. Similarly, the fixations on the process model are summed up for each phase of the PPM. Then, the percentage of fixations on the textual description out of all fixations for each PPM phase is calculated for each participant. Summarized, the number of fixations on the modeling canvas and the number of fixations on the textual description and the percentage of fixations on the textual description for each PPM phase type, i.e., modeling, reconciliation, but also comprehension, are obtained. Comprehension phases include problem understanding, method finding, and validation. Consequently, it is difficult to identify the usage of external representations for each phase specifically. Still, comprehension phases are included in the subsequent analysis in order to put the numbers of fixations obtained in modeling and reconciliation phases into perspective.
79
Phase Comprehension Modeling Reconciliation
Textual description Min Max M SD 161 181 0
1873 780 177
809.50 470.88 62.17
348.46 171.46 49.68
Min 208 919 20
Modeling canvas Max M 2063 3431 2092
911.46 1585.54 629.58
SD 512.48 717.11 492.86
Table 6.5: Fixations on textual description and modeling canvas per participant Results This section describes the results of M S2 . First, results regarding the number of fixations are presented. Then, the fixations are aggregated to a measure representing the main focus of the modeler during the respective phase. The section is concluded with a statistical analysis of differences between comprehension, modeling, and reconciliation. Number of fixations A total of 1078 phases, i.e., 386 comprehension, 426 modeling, and 266 reconciliation, in 24 PPM instances were identified. For each participant of the modeling session, the number of fixations on the modeling canvas and the number of fixations on the textual description were calculated (cf. Figure 6.8) for each phase type of the PPM. Table 6.5 provides an overview of average number of fixations on the textual description and the modeling canvas per participant. In the following, the number of fixations on the textual description is compared to the number of fixations on the modeling canvas (cf. Table 6.5). In case of comprehension phases, the average number of fixations on the modeling canvas and the average number of fixations on the textual description is fairly similar. In terms of modeling phases, an increase in the number of fixations on the modeling canvas compared to comprehension phases can be identified, while the number of fixations on the textual description is considerably lower. Thereby, the lowest number of fixations on the textual description could be observed for reconciliation phases, indicating that modelers focused on the process model instead of the textual description in reconciliation phases. Percentage of fixations on the textual description For each participant the percentage of fixations on the textual description out of all fixations is calculated. Table 6.6 provides an overview of the percentages of fixations on the textual description and Figure 6.9 shows the corresponding boxplot. The data supports the observations made previously. In the comprehension phase, roughly half of the fixations
80
Avg. percentage of fixations on textual description
[DatenSet2]
100
80
60
40
20
0
Comprehension
Modeling
Reconciliation
Figure 6.9: Boxplot of the average percentage of fixations on the textual description
Phase Comprehension Modeling Reconciliation
Min
Max
M
SD
26.22% 12.87% 0.00%
70.15% 39.94% 51.88%
48.42% 23.87% 12.04%
12.12 7.89 13.99
Table 6.6: Average percentage of fixations on textual description per participant were on the textual description. In modeling phases, the percentage of fixations on the textual descriptions decreases to about 25% and in reconciliation phases only 12% of the fixations are on the textual description. Statistical analysis For performing the statistical analysis, the data on the percentage of fixations on the textual description described in the previous section is used. For each modeler, the percentage of fixations on the textual description for comprehension, modeling, and reconciliation is available. The Kolmogorov–Smirnov test did not indicate significant differences from a normal distribution (cf. Appendix B.1). Therefore, repeated measures ANOVA can be used for the statistical analysis. Mauchly’s test of sphericity did not indicate a violation of the sphericity assumpSeite 2 tion (χ2 (2) = 0.59, p = 0.746). Therefore, no additional corrections have to be
81
Phase (I)
Phase (J)
Comprehension Comprehension Modeling
Modeling Reconciliation Reconciliation
a
Mean difference (I–J)
Standard error
0.246 0.364 0.118
0.023 0.026 0.024
p 0.000a 0.000a 0.000a
significant at the 0.05 level
Table 6.7: Bonferroni post–hoc tests for pairwise comparisons applied. The result of the repeated measures ANOVA indicates significant differences in the percentage of fixations on the textual description between the three phase types, i.e., comprehension, modeling and reconciliation (F (2, 46) = 113.39, p < 0.001, η 2 = 0.831). The Bonferroni post–hoc tests for pairwise comparisons reveal significant differences (cf. Table 6.7). The difference between modeling and reconciliation phases is statistically significant, indicating that modelers were focusing their attention on different parts of the modeling environment. Not surprisingly, comprehension phases showed significantly more fixations on the textual description compared to modeling phases and compared to reconciliation phases. Discussion M S2 was designed to complement M S1 by providing a different perspective on the PPM. More specifically, the actual interactions with the modeling environment seem to be more challenging to investigate using verbal protocol analysis since the verbal utterances are partly not related to the interactions with the modeling environment or modelers who are not commenting on their interactions (cf. Section 6.4.1). Therefore, eye movement analysis seems to be an interesting approach since it is difficult for modelers to influence their eye movements during modeling, i.e., modelers have to look at the modeling environment to create a process model. In this modeling session, the focus was put on the interactions with the modeling environment by considering how external representations are utilized in modeling, reconciliation, and comprehension phases, i.e., problem understanding, method finding, and validation. More specifically, gaining corroborating evidence for the distinction between modeling and reconciliation was the main aim of this modeling session, i.e., supporting the validation of RQ1.3 . While some evidence on this distinction could be gathered using think aloud, eye movement analysis could further support this distinction. For this purpose, the percentage of fixations on the different areas of the modeling environment, i.e., textual description and modeling canvas, are investigated.
82
In modeling phases, the modelers’ focus on the modeling canvas, i.e., 23.87% of the fixations are on the textual description. Still, modelers consult the textual description from time to time. This could be necessary whenever modelers need to refresh the internal representation in order to be able to continue working on the process model, e.g., modelers need to look up the exact name of an activity. An observation that was made in the think aloud session (cf. Section 6.4.1). The information in working memory can be refreshed using lightweight perceptual mechanisms (cf. Section 4.1.2). In reconciliation phases, the focus shifts toward the modeling canvas, i.e., only 12.04% of the fixations are on the textual description. This is reasonable, since modelers are concerned with improving the process model’s understandability. In several cases it is not necessary to consider the task description for this task, e.g., when laying out the process model the task description can mostly be neglected. Additionally, the fixations in comprehension phases were analyzed. While detailed conclusions are difficult on this fine grained level since comprehension includes different aspects, i.e., problem understanding, method finding, and validation, it is useful to put the numbers for modeling and reconciliation into perspective. The percentage of fixations on the textual description in comprehension phases is significantly higher compared to modeling and reconciliation phases, i.e., 48.44% of the fixation are on the textual description. This indicates that both external representations, i.e., textual description and process model, are utilized. Due to the limited amount of validation observed in M S1 , it is reasonable to assume that the process model also plays an important role in understanding the problem and mapping the acquired understanding to modeling constructs. Summarized, this modeling session contributes to the validation of RQ1.3 by providing evidence supporting the distinction between modeling and reconciliation. Further, by using the phase detection algorithm for identifying the different phases of the PPM, this modeling sessions also contributes to the validation of RQ1.4 . The significant differences between modeling and reconciliation indicate that the detected phases of the PPM represent different behavior.
Limitations of M S2 The interpretation of our findings is presented with the explicit acknowledgment of a number of limitations to M S2 . This section focuses on limitations specific to M S2 . Limitations of MPDs are discussed in Section 6.5.3 and a discussion of limitations applying to the whole thesis can be found in Section 9.4. First, errors during the manual processing of the data after the modeling session cannot be ruled out. For instance, inaccurate cutting of the collected video files could lead to changes in the number of fixations on the respective areas. This risk
83
100 90 80 70
# elements
60 50 40 30
Comprehension
20
Modeling
10 0 00:00
Reconciliation 06:00
12:00
18:00
24:00
30:00
36:00
42:00
48:00
time [mm:ss]
Figure 6.10: Example MPD for PPM instance 1
was minimized by checking random samples of the data and checking the results for plausibility. Still, problems during data analysis cannot be ruled out entirely. Second, the modeling task executed in this study cannot be considered representative for modeling in practice. More specifically, eye movement analysis imposes certain restrictions on the modeler, i.e., the modeler cannot move as much as desired as the eye tracker might loose the modeler’s eyes otherwise. Further, similar to think aloud, the amount of effort for analyzing the data is rather high since the recorded data has to be processed manually. Therefore, the model created in this modeling task was rather small, focusing on control flow to avoid extensive modeling sessions. In a similar vein, CEP might have an impact on the PPM. More specifically, by juxtaposing the textual description with the modeling environment, the size of the modeling canvas is reduced, which might have an impact on the creation of process models.
6.4.3 Demonstration This section illustrates the MPDs of two PPM instances collected in M S2 to demonstrate the usefulness of MPDs for data exploration, i.e., supporting the validation regarding RQ1.4 . Figure 6.10 shows one of the PPM instances collected in M S2 . When looking at the MPD, we can identify a series of fairly steep modeling phases, i.e., solid black lines, interrupted by shorter comprehension phases, i.e., dotted black lines. Additionally, one reconciliation phase, i.e., solid gray line, can be identified at the end of the PPM instance. Based on the MPD and the corresponding replay of the PPM instance, we might argue that the modeler has a good understanding of the
84
100
Comprehension 90 80
Modeling Reconciliation
70
# elements
60 50 40 30 20 10 0 00:00
06:00
12:00
18:00
24:00
30:00
36:00
42:00
48:00
time [mm:ss]
Figure 6.11: Example MPD for PPM instance 2
process model. The activities were placed on the process model rather quickly and at strategic places. This way, the modeler was able to avoid additional reconciliation. Figure 6.11 shows a different PPM instance collected in M S2 . Both modelers obtained the same task description. The MPD of this modeler starts with a comprehension phase, which might be devoted to problem understanding. Next, a longer modeling phase can be observed. After a short break, the modeler continues to add elements to the process model at a slower pace. Then we can observe a longer comprehension phase where elements are removed.7 CEP’s replay reveals that the modeler seems to struggle with introducing a loop in the process model. After resolving this issues, the modeler returns to a fast modeling style before experiencing problems toward the end of the PPM instance. The modeler adds elements to the process model just to remove them immediately afterwards. Once the highest number of elements in the process model is reached, several longer comprehension phases can be observed. At this point, the process model is completed for the first time. The remaining time is spent on checking the process model and resolving inconsistencies. Arguably, the comprehension phases toward the end of the PPM instance might have been devoted to validation. Summarized, the MPDs of the PPM instance presented in this section show considerable differences. One modeler was able to create the process model in a rather short amount of time with few additional phases of reconciliation. The MPD of the other PPM instance, on the contrary, was considerably longer with alternations of modeling and reconciliation. The MPDs allowed us to gain a coarse grained overview of the PPM, which can be complemented with CEP’s replay. This way, it was pos7
The number of elements in the process model can also change during a comprehension phase due to the merging of comprehension phases which are interrupted by brief modeling actions.
85
sible to gain insights into the creation of the process models, i.e., addressing RQ1.4 . MPDs are used in Chapter 7 for developing a catalog of PBPs.
6.5 Discussion This chapter constitutes the foundation for analyzing the modeler’s behavior by providing means for data exploration. This way, this chapter contributes to addressing RQ1 . In this context, two research questions were addressed. This section is structured accordingly. First, the contributions to RQ1.3 are discussed in Section 6.5.1. Then, RQ1.4 is addressed in Section 6.5.2. Finally, limitations of the presented technique are discussed in Section 6.5.3.
6.5.1 RQ1.3 Which activities do modelers perform during the Process of Process Modeling? In order to answer RQ1.3 , we derived a description of the PPM from the process of programming. For this, we borrowed problem understanding and method finding and refined solution specification to form the three phases of modeling, reconciliation, and validation. The description of the PPM was validated in two modeling sessions. In M S1 evidence for all phases of the PPM could be identified. More specifically, it was possible to distinguish between phases intended for obtaining an understanding of the modeling task, i.e., problem understanding, and phases for mapping the acquired knowledge to modeling constructs, i.e., method finding. This finding is consistent with the process of programming (cf. Section 4.2) and the distinction suggested in [251]. Here, the authors suggest two phases: (1) forming a mental model and (2) mapping the mental model to modeling constructs. Forming a mental model is accomplished in problem understanding, while mapping is done in method finding. Additionally, the proposed description of the PPM contains a dedicated validation phase. In M S1 , several verbal utterances were found, indicating the existence of dedicated validation phases within the PPM. Further, the existence of modeling and reconciliation phases was investigated. In M S1 , verbal utterances supporting the distinction between modeling and reconciliation were observed. The verbal utterances indicate that modelers are interested in improving the process model’s understandability during reconciliation. On the contrary, modeling is intended to add functionality to the process model, which is acquired during problem understanding and method finding. Further, modeling phases include modelers accessing the task description for refreshing their internal representation of the problem. Something that rarely happens during reconciliation.
86
To further investigate how modelers interact with the modeling environment in modeling and reconciliation phases, M S2 was conducted using eye movement analysis. In this modeling session, the analysis of the modeler’s fixations on the modeling environment indicates that modelers accessed the textual description in modeling phases, i.e., 23.87% of the fixations were on the task description, while the number of fixations on the task description is considerably lower in reconciliation phases, i.e., 12.04%. This seems reasonable in connection with the verbal utterances of M S1 since modelers mostly work on improving the process model’s understandability by laying out the process model. This constitutes a task focusing on the process model, mostly neglecting the task description. Summarized, we identified considerable evidence supporting the distinction between the different phases of the PPM, since we observed the cognitive activities of the PPM using think aloud, and established significant differences in terms of eye fixations between modeling and reconciliation. The description of the PPM constitutes the foundation for MPDs, providing a theoretical lens for analyzing the data recorded by CEP.
6.5.2 RQ1.4 How can Process of Process Modeling instances be analyzed and visualized? The description of the PPM is used as a theoretical lens on the data to develop an algorithm for extracting the different phases of the PPM from the data recorded by CEP. This way, we abstract from the individual interactions with the modeling environment to form phases on a higher level of abstraction. The extracted phases are then visualized in a two dimensional chart. This way, data exploration and the generation of hypotheses can be supported, since diagrams are known to support perceptual inferences [144] and are well suited for exploring data [68]. The phase extraction algorithm was used in M S2 to define the timeframes that were used for cutting the video recordings to apply eye movement analysis, validating the phase detection algorithm. Additionally, two PPM instances recorded in M S2 were presented in Section 6.4.3 to demonstrate the usefulness of MPDs for data exploration. Summarized, MPDs provide a technique for gaining an overview of PPM instances to support data analysis. By focusing on the modeler’s interactions with the modeling environment, several limitations of the technique need to be considered. For instance, the focus on interactions with the modeling environment limits the insights that can be gained regarding the cognitive phases of the PPM. Therefore, the three cognitive phases, i.e., problem understanding, method finding, and validation, are summarized by a single phase, i.e., comprehension, which is detected by measuring the modeler’s inactivity (cf. Section 6.5.3 for a discussion of limitations). On
87
the contrary, the focus on the modeler’s interactions has several advantages. First, larger numbers of PPM instances can be investigated since MPDs can be generated automatically. This supports a quantitative data analysis as conducted in this thesis in the context of a mixed–method approach. Further, an automated analysis might be beneficial on the long–term, since modeling environments intended to support modelers during the PPM might only rely on the modeler’s interactions to adapt to the current situation.
6.5.3 Limitations of Modeling Phase Diagrams When using MPDs for analyzing the PPM a series of limitations of the technique should be kept in mind. First, problem understanding, method finding, and validation are difficult to distinguish when analyzing the modelers’ interactions with the modeling environment. Consequently, the phase detection algorithm records only phases of inactivity—denoted as comprehension—subsuming problem understanding, method finding, and validation. This is a trade–off between the accuracy of the detected phases and the demand for additional data. The phase detection could be considerably improved by collecting think aloud data for all modeling sessions. This would allow to distinguish between problem understanding, method finding, and validation. On the downside, collecting and analyzing think aloud data constitutes a time–consuming task, making an efficient analysis for larger sample sizes difficult. Therefore, we decided to subsume problem understanding, method finding, and validation as comprehension. Second, the automated detection of phases is based on thresholds, which might present an inaccurate picture of the PPM. In this thesis, thresholds were chosen based on previous experiences with the PPM. Still, the possibility of using inaccurate thresholds for detecting the various phases of the PPM has to be acknowledged. For instance, by lowering thresholdc , the number of comprehension phases, but also the number of modeling and reconciliation phases might increase, since several phases are split and interrupted by short comprehension phases. A very short comprehension threshold would then result in a comprehension phase after nearly every interaction with the modeling environment. In the future, adapting the detection thresholds based on the individual modeler might be considered. For instance, thresholdc might be reduced for modelers who work very quickly. This might lead to a more accurate detection of PPM phases. Third, the presented algorithm tries to smoothen the phases of the PPM by aggregating interactions to phases. In this context, brief interactions following a series of interactions of a different phase type, e.g., a single reconciliation interaction following several modeling interactions, are added to the previous phase. This is only
88
done if the brief interactions are shorter than thresholdd . By applying this strategy, very short phases of single interactions are mostly avoided. Still, phases containing only a single interaction can occur. For instance, when a longer phase of inactivity is followed by a single reconciliation interaction and then several modeling interactions. In this case, a comprehension phase is added to the list of detected phases for the duration of inactivity. The single reconciliation interaction triggers the detection of a reconciliation phase and the longer series of modeling interactions results in a modeling phase. This way, three phases, i.e., comprehension, reconciliation, and modeling, are detected. Adding the single reconciliation interaction to the modeling phase might be feasible, but the situation is less clear compared to intermediary interactions as described in Section 6.3.1 as the modeler might have devoted the phase of inactivity to think about improving the process model’s understandability. Therefore, we decided to add a reconciliation phase of a single interaction to the list of detected phases. We might consider improving this behavior in the future. Further, the automated phase detection relies on the assumption that interactions with the modeling environment can be mapped to the respective phases of the PPM. It has to be acknowledged that modelers might utilize modeling constructs differently than intended. For instance, a gateway that became obsolete during modeling can be reused by moving it to a different part of the process model. This certainly constitutes modeling behavior which might be misclassified as reconciliation. Similarly, a modeler might change the structure of the process model to improve the understandability without adding additional functionality, i.e., refactoring the structure of the process model. This behavior might be misclassified as modeling. This risk might be mitigated in future versions of the detection algorithm by considering context information for each interaction. For example, if a gateway is moved to a distant place on the modeling canvas without being connected to any elements in the previous region, it might be considered modeling instead of reconciliation. In a similar vein, the algorithm assumes that all interactions with the modeling environment are of equal importance. In fact, some interactions might be less important than others. For example, moving an activity slightly might be a minor adjustment to improve the visual appearance. Moving a model element further away might precede a major change to the process model. An improved version of the detection algorithm might consider context information to distinguish between minor adaptations and major changes to the process model. This could then be exploited to decide on whether a certain reconciliation interaction should be added to a surrounding modeling phase.
89
6.6 Summary This chapter can be attributed to answering RQ1 . For this purpose, a description of the PPM is derived from research on the process of programming to provide a theoretical lens on the data recorded by CEP (cf. Chapter 5). Based on this description, MPDs are presented to support the data analysis and facilitate the generation of hypotheses for future investigations. A validation with two modeling sessions is conducted to investigate the existence of the different phases of the PPM and the usefulness of the presented technique. This way, MPDs provide the foundation for the identification PBPs pursued in Chapter 7, i.e., addressing RQ2 .
90
Chapter 7 Process of Process Modeling Behavior Patterns Chapter 6 presented a technique to visualize interactions with the modeling environment, presumably allowing to observe inter–individual differences in terms of how process models are created. For instance, the MPDs in Figure 6.10 and Figure 6.11 indicate considerable differences. While some modelers create the process model in large chunks of modeling, others create the model in short modeling phases interrupted by frequent phases of inactivity. We observed several modelers behaving similar to Figure 6.10 and Figure 6.11 when inspecting other MPDs of M S2 , raising the question whether reoccurring behavior can be documented and categorized. As detailed in Chapter 6, the creation of process models can be considered a problem solving task, i.e., the modeler starts from an initial state by adapting the process model to reach the desired goal state. In the context of problem solving, patterns have emerged in a variety of domains. First, [3] presented patterns in architecture to describe solutions to frequently occurring problems. Similarly, design patterns have been applied in software engineering to describe the architecture of computer programs [79]. In business process management, patterns have been used to describe typical constructs used in business process models, e.g., control flow structures [272], exception handling [230], the usage of data [229] and resources [231], and temporal aspects of business processes [142, 143]. In this chapter, we intend to exploratively find reoccurring patterns of behavior, i.e., PPM Behavior Patterns (PBPs), to describe how modelers solve problems during the PPM. Unlike workflow patterns, the focus of the PBPs is not on the control flow structures that are typically used to create a process model, but rather on the behavior of modelers creating process models. Therefore, we define the first research question as follows. RQ2.1 : Which Process of Process Modeling Behavior Patterns can be identified based on the modelers’ interactions with the modeling environment?
91
As indicated in Chapter 1, the question arises whether the occurrence of PBPs can be traced back to specific factors, i.e., why can certain behavior be observed? In this context, three different types of factors might be considered, i.e., circumstantial factors, modeler–specific factors, and task–specific factors (cf. Chapter 1.2). Assuming that circumstantial factors are controlled in our modeling sessions, i.e., a single modeler creating a process model for the purpose of documentation, two factors influencing the creation of process models remain. On the one hand, the notational system and the modeling task, i.e., task–specific factors, and, on the other hand, the modeler who is creating the process model. This chapter focuses on investigating modeler–specific factors and controls task–specific factors, i.e., the same notational system and one modeling task is used for all participants. For investigating modeler– specific factors, we try to connect the identified PBPs to the demographic data of the participants, thereby considering prior domain knowledge and prior modeling experience. Task–specific factors, in turn, are investigated in Chapter 8. Consequently, the second research question can be formulated as follows. RQ3.1 : Which modeler–specific factors influence the occurrence of Process of Process Modeling Behavior Patterns? This chapter is structured as follows. First, Section 7.1 outlines how the research questions are approached. Then, initial insights are generated by revisiting the think aloud data collected in M S1 in Section 7.2. Next, data collection for M S3 is presented in Section 7.3. Section 7.4 explores the data of M S3 to obtain an overview of the collected PPM instances. Then a catalog of PBPs is identified based on the modelers’ interactions with the modeling environment and the PBPs are connected to modeler–specific factors (cf. Section 7.5). The findings are discussed in Section 7.6 and limitations of M S3 are presented. The chapter is concluded with a brief summary in Section 7.7.
7.1 Research outline This section describes how RQ2.1 and RQ3.1 are addressed. For this purpose, we apply a sequential mixed–method approach where initial insights are generated using a qualitative technique. The generalizability of the initial findings is improved by collecting additional data and performing a quantitative analysis. Exploration In order to gain initial insights regarding the modelers’ behavior, we revisit the data collected in M S1 , using the coded think aloud protocols to perform a
92
detailed analysis of the modelers’ behavior. More specifically, we extend the findings regarding the occurrence of PPM phases presented in Section 6.4.1 by considering the respective transitions between those phases. This way, initial insights into the modelers’ behavior can be obtained. Data collection In a second step, this chapter focuses on extending the initial insights by considering a larger modeling task with a higher number of subjects. For this purpose, M S3 is conducted with 120 students following classes on business process management, who individually create a formal process model from a textual description to document the process, i.e., circumstantial factors are controlled. Since M S3 intends to investigate the influence of modeler–specific factors, we make use of a single modeling task. This way, a larger modeling task can be executed within the available time, i.e., during class. Further, we utilize a subset of BPMN within CEP, making use of a basic feature set. This way, the influence of the notational system is minimized and the same for all participants, i.e., controlling task–specific factors. Identification of PBPs In order to gain an overview of the PPM instances recorded in M S3 , we start by exploring variations in the modelers’ behavior. Such variations might point to different approaches to problem solving, which can be considered PBPs. For this purpose, we investigate durations of PPM instances and the corresponding MPDs. The generated insights are then used in combination with the initial insights from M S1 as a starting point for developing the catalog of PBPs. In order to identify PBPs, we strive for quantifying the modelers’ behavior, allowing to statistically analyze the recorded PPM instances. For this, we define a set of PPM measures to quantify different aspects of the PPM based on the modelers’ interactions. As a result, we obtain a catalog of PBPs describing different aspects of modeling behavior with associated measures to operationalize the observed PBPs. Each PBP describes a specific aspect of PPM instances, allowing several PBPs to co–occur within a single PPM instance. This way, RQ2.1 is addressed. Investigating modeler–specific factors In order to identify modeler–specific factors influencing the PPM, we complement the modeling task with a demographic survey including questions regarding domain knowledge and prior modeling experience. This way, we are able to perform correlational analysis for identifying connections between these modeler–specific factors and the PBPs. By investigating the influence of domain knowledge and prior modeling experience on the PPM, this chapter contributes to answering RQ3.1 . Additionally, we indicated in Section 1.2 that cognitive characteristics of the modeler might influence the PPM. In this context, a plethora
93
of psychological factors exist, e.g., working memory capacity, self–leadership [6, 114], each requiring dedicated questionnaires or even more complex tests. Since this chapter constitutes the first systematic categorization of the modelers’ behavior, we did not have any specific hypotheses on cognitive characteristics influencing the occurrence of PBPs. Therefore, we decided to focus on modeling experience and domain knowledge in M S3 . The PBPs observed in this chapter might allow us to derive hypotheses regarding cognitive characteristics, which can be investigated in the future (cf. Section 9.5).
7.2 Gaining initial insights into the modeler’s behavior In order to gain initial insights into PBPs, we revisit the think aloud data collected in M S1 . For this purpose, we extend the previous findings of Section 6.4.1 by considering transitions between the different phases of the PPM. For details regarding the execution of M S1 and the coding of think aloud protocols we refer to Section 6.4.1. The remainder of this section is structured as follows. Section 7.2.1 presents initial findings constituting the foundation for a systematic investigation of PBPs in M S3 . The findings are briefly discussed in Section 7.2.2.
7.2.1 Transitions between Process of Process Modeling phases In order to gain initial insights for the identification of PBPs, i.e., RQ2.1 , we consider the data collected in M S1 . In order to investigate how episodes relate to each other, all transitions between episodes are identified and aggregated to the model depicted in Figure 7.1. Each box represents one of the possible codings, including their absolute and relative frequency that was observed in M S1 . The arrows indicate transitions between the respective codings and are annotated with the frequency of the respective transition. Each arrow displays the absolute number of the transition and a percentage indicating how often this transition was observed relative to all transitions of the transition’s source. For example, the arrow from problem understanding to method finding is annotated with 30 (63.83%), indicating that 30 transitions from problem understanding to method finding were observed, which is the equivalent of 63.83% of all transitions starting from problem understanding. Note that in Figure 7.1, the 11 episodes categorized to other are not considered. Therefore, the outgoing arrows of problem understanding, modeling, validation, and reconciliation do not sum up to 100%.
94
Problem Understanding 47 (18.50%)
9 (13.85%)
Method Finding 65 (25.59%)
30 (63.83%)
27 (31.03%) 54 (83.08%)
23 (26.44%) 12 (25.53%)
Modeling 87 (34.25%)
9 (23.08%) 3 (6.38%)
2 (40.00%) 2 (2.30%) 17 (43.59%) 32 (36.78%)
Validation 5 (1.97%)
2 (2.30%) 2 (40.00%)
Reconciliation 39 (15.35%)
7 (17.95%) 2 (3.08%)
Figure 7.1: Coding patterns
Problem understanding—method finding—modeling Considering Figure 7.1, only two transitions with a relative frequency of more than 50.00% can be observed. On the one hand, the transition from problem understanding to method finding, i.e., 63.83% of problem understanding phases were followed by method finding. On the other hand, the transition from method finding to modeling, i.e., 83.08% of the method finding phases were followed by modeling. This is consistent with our observations during coding, where we frequently observed combinations of episodes similar to the following example: “yes. . . it depends. . . below one million we do something different. . . emmm. . . (reading)”. In this episode the modeler was trying to understand the task description, reasoning about two alternative branches. After understanding the task description, the modeler uttered: “first, we need another XOR”, indicating that the modeler mapped the domain knowledge to BPMN constructs. Finally, the modeler added an XOR gateway and an activity to the process model, accompanied by the following verbal utterance: “XOR node
95
once, again [. . . ]”.
Validation—modeling/reconciliation As mentioned in Section 6.4.1, only a limited number of validation episodes were observed. Validation episodes were frequently interwoven with modeling and reconciliation episodes. More specifically, two validation episodes were followed by modeling episodes and two validation episodes were followed by reconciliation episodes. In modeling episodes, problems in the process model were resolved, while reconciliation was devoted to improving the process model’s understandability. For instance, the following verbal utterances describe a validation phase followed by reconciliation phase: “[. . . ] this is correct since it happens always and optionally, depending on the amount of the mortgage. . . emm a supervisor has to approve” and “ok we move everything a little to make is easier to read”. Similarly, in a validation phase one participant uttered: “ok, let’s check the activities, I just realized that the end event is missing”, followed by modeling: “let’s add them (add end event and sequence flow)”.
Problem understanding—method finding At the beginning of the PPM instances longer phases of problem understanding were observed. More specifically, two PPM instances started with problem understanding. The other three PPM instances started with brief episodes of planning which were categorized to other, e.g., “I read the description first and underline the activities”, before switching to problem understanding. Still, all PPM instances started with longer phases of problem understanding. This is hardly surprising as the modelers needed to gain an understanding of the modeling task. Later in the PPM instance, problem understanding episodes became shorter and less frequent while more method finding could be identified. In order to visualize this effect, the PPM instances were partitioned in time slots, each time slot containing five codings. Five codings per time slot were selected as it provided a meaningful level of granularity. Figure 7.2 illustrates the PPM instance of one participant. The horizontal axis shows 8 time slots, each containing five codings. The vertical axis represents the number of occurrences for each coding. For the sake of clarity, Figure 7.2 illustrates only problem understanding and method finding. For example, time slot three contains no problem understanding and one method finding episode. The four episodes not illustrated in this time slot in Figure 7.2 are three modeling episodes and one reconciliation episode.
96
Problem understanding
Method finding
4
Codes
3
2
1
0 1
2
3
4
5
6
7
8
Time slot
Figure 7.2: Problem understanding and method finding
Figure 7.2 indicates that the initial time slot contains problem understanding and method finding. While the amount of problem understanding decreases toward the end of the PPM instance, the frequency of method finding remains constant. Thereby method finding overtakes problem understanding after the first time slot. This finding is underpinned by the high number of method finding episodes, i.e., 65 (25.59%), compared to only 47 (18.50%) problem understanding episodes. Therefore, understanding the domain seems to be more important in the initial phases of the PPM, while mapping domain knowledge to modeling constructs becomes more important later in the PPM.
7.2.2 Conclusion In this section initial insights regarding the modelers’ behavior were presented. In this context, combinations of phases that occurred more frequently were observed. For instance, problem understanding was followed by method finding, which was followed by modeling. In this context, it was observed that problem understanding was more important at the beginning of PPM instances, while method finding became more frequent as the PPM instance progressed. Further, it was observed that validation phases were typically toward the end of the PPM instances and frequently interwoven with modeling and reconciliation phases to address quality issues identified during validation. In comparison to problem understanding or method finding, fewer validation phases were observed. One might hypothesize about additional in-
97
termediary validation phases when increasing the size of the process model, which was not the case in the rather small modeling task. The initial insights developed in M S1 point toward reoccurring behavior within PPM instances. For example, validation phases were frequently toward the end of the PPM instances. In order to systematically identify and document reoccurring behavior, M S3 is conducted. This way, we apply a sequential mixed–method approach by combining the qualitative insights developed in M S1 with quantitative investigations conducted in the context of M S3 to improve the generalizability of the results.
7.3 Data Collection In order to complement M S1 , we attempt to discover PBPs by quantitatively analyzing PPM instances. For this, we conduct a modeling session with students participating in classes on business process management. In this section, M S3 is outlined, giving information on the targeted subjects and the objects to be utilized, i.e., the modeling task. Additionally, details on the data collection procedure are given. Further, the execution of M S3 is described and data validation is performed.
7.3.1 Subjects In order to quantitatively identify PBPs, a certain number of PPM instances creating the same process model is required. While process modelers from practice are certainly desirable for investigating PBPs, this imposes serious demands in terms of budget and personnel resources. Therefore, students were selected for participating in the modeling session since recruiting students constitutes a common practice for obtaining larger groups of subjects [61]. While results obtained using students as subjects should not be blindly generalized [259], it has been established for software engineering that students might provide an adequate model for professionals [113, 199, 228]. The targeted subjects should be familiar with business process management in general and imperative process modeling notations specifically. While knowledge in using BPMN is desirable, knowledge in other imperative modeling languages should be sufficient since it can be expected that knowledge can be transferred between modeling languages of the same paradigm [208]. We are not targeting modelers, who are not familiar with imperative process modeling languages to avoid measuring their learning experience instead of investigating their modeling behavior. We do not require prior knowledge regarding the domain of the modeling task, i.e., mortgage approval processes, since all information required for completing the modeling task is included in the task description. By conducting the
98
modeling session with a higher number of participants a certain degree of variation in term so domain knowledge and modeling experience can be expected. In terms of cognitive characteristics, we assume that the subjects are representative for the modeling community.
7.3.2 Objects M S3 is intended to identify PBPs and investigate modeler–specific factors. In contrast to M S1 , a larger modeling task is executed to improve the generalizability of the results. Consequently, only a single modeling task can be executed within the available time, i.e., in class. The modeling session is designed to collect PPM instances of students creating a formal process model in BPMN from an informal description. To mitigate the risk that PPM instances are impacted by complicated tools or notations [40], a same subset of BPMN as in M S1 and M S2 , including basic control flow structures, is utilized. The informal description is formulated in English since participants from various different countries were expected to participate in the modeling session. Since we intend to control the influence of the modeling task on the PPM, the task description was presented in a sequential, unambiguous manner [263]. The object that was to be modeled is a process describing the handling of a mortgage request by a bank (cf. Appendix A.3). The process model that should be created by the participants consists of 24 activities and contains the basic control flow patterns: sequence, parallel split, synchronization, exclusive choice, simple merge, and structured loop [272].
7.3.3 Instrumentation and data collection An overview of the modeling session’s design is illustrated in Figure 7.3. At the beginning, the participants obtain a description of the modeling session and an example process model in BPMN, illustrating the usage of the modeling notation. Additionally, the material handed out contains the numerical code to start CEP’s experimental workflow engine. After entering the code, participants are presented with a demographic survey. Next, the interactive tutorial is presented to the modelers, explaining the basic features of the modeling environment. Then, the actual modeling task is performed. Since the participants are using their own laptops for process modeling, we decided to hand out the textual description on paper to not further restrain the potentially small modeling canvas. After the modeling session a second survey collecting data on potential problems during the modeling session is presented. The modeling session is concluded with a feedback questionnaire. The
99
material was refined in several iterations to ensure the understandability of the task description. Enter code
Demographic survey
Tutorial
Modeling task
Post modeling survey
Feedback
Figure 7.3: Experimental workflow of M S3
7.3.4 Execution of the modeling session The modeling session was conducted in December 2012 at Eindhoven University of Technology with 120 students following programs on operations management and logistics, business information systems, innovation management, and human– technology interaction. Each participant was participating in classes on business process management including the creation of imperative business process models. 79.2% of the participants were male. The average age of the participants was 23.01 years (SD = 1.24). The modeling session was guided by CEP’s experimental workflow engine (cf. Chapter 5), leading students through the modeling task, surveys and the feedback questionnaire. Participation was voluntary and data collection was performed anonymously.
7.3.5 Data validation This sections describes how data validation was performed. For this purpose, outliers were identified and the participants’ demographic data was considered. Detection of outliers Since the identification of PBPs consists of a detailed analysis of the collected data, we test for potential outliers in the data. The modeling session is conducted with 120 participants, who are simultaneously working on the process model. Therefore, we cannot neglect the possibility of participants not obeying the modeling session’s setup. For instance, modelers might access the Internet during the modeling session to, e.g., write an e–mail. Similarly, participants might have been distracted during the modeling session by other participants. To counter this threat, the data is checked for outliers, ensuring the validity of the collected data. More specifically, we test for outliers regarding the duration of the modeling endeavor. Additionally, we check the number of modeling interactions and the number of reconciliation interactions for outliers. This way, we are able to remove data
100
of participants who did not perform as expected, e.g., modelers who did not take the task seriously. We utilize the Median Absolute Deviation (MAD) [81] to detect outliers, since outliers should not be removed unjustified [247]. More specifically, we apply a rather conservative criterion for removing outliers by considering values differing at least 3 times the MAD from the median as outliers [147]. Since SPSS does not support the calculation of MAD, we are using R for this purpose [202]. If a subject is considered an outlier in one of the three categories, i.e., duration, number of modeling interactions, or number of reconciliation interactions, the subject is removed for further data analysis. As a consequence, the PPM instances of 14 participants were removed as they showed at least one outlier in the respective categories. Subsequently, only the data of the 106 remaining participants is considered.
Demographic survey As indicated previously, the participants were asked to provide us with demographic data as part of M S3 . Table 7.1 shows an overview of the participant’s demographics in order to assess whether the participants fit the targeted profile. Answers were given on a 7 point Likert scale with values ranging from Strongly disagree (1) over Neutral (4) to Strongly agree (7). Open questions, e.g., question 10, were answered using text input boxes. The first set of questions was designed to obtain general information like gender (78.30% male) and age (M = 22.92, SD = 1.22). Additionally, we asked the participants for their knowledge regarding reading and understanding English texts (questions 3–4). Not surprisingly the participants indicated hardly any problems reading English texts (M = 1.91, SD = 0.86), i.e., between strongly disagree and disagree, and understanding English texts (M = 2.00, SD = 0.87), i.e., disagree. Therefore, we conclude that the participants of M S3 are capable of understanding the English description of the modeling task. The second set of questions was designed to assess domain knowledge of the participants regarding the financial domain and mortgage processes specifically. Since the influence of prior domain knowledge on model comprehension task has been shown in the past [125, 126], domain knowledge was assessed even though all domain information required for completing the modeling assignment was included in the task description. Questions 5–8 measure the participants domain knowledge. Participants reported slightly below neutral familiarity with financial processes (M = 3.58, SD = 1.43) and limited familiarity with mortgage approval processes (M = 2.83, SD = 1.45). Similarly, modelers reported that they created models in the financial before (M = 3.02, SD = 1.76), i.e., close to somewhat disagree. Fur-
101
ther, previous modeling experience regarding mortgage processes was even lower (M = 2.57, SD = 1.72). Scale
Min
Max
years m/f 1–7 1–7
20
28
1 1
5 5
M
1. 2. 3. 4.
Age Gender Problems reading English Problems understanding English
5. 6. 7. 8.
Familiarity financial processes Familiarity mortgage processes Financial models created Mortgage models created
1–7 1–7 1–7 1–7
1 1 1 1
7 6 7 7
3.58 2.83 3.02 2.57
1.43 1.45 1.76 1.72
9. Process modeling expert 10. Process modeling experiencea 11. Formal training last year 12. Self–education last yeara 13. Models read last year 14. Models created last year 15. Avg. size of modelsa
1–7 years days days models models activities
1 0 1 0 2 0 0
6 6 90 90 300 125 50
3.41 2.90 5.59 6.59 42.60 20.33 14.77
1.41 1.39 10.35 10.86 52.54 19.03 7.20
1–7 1–7 1–7 months
1 1 1 0
7 7 7 60
2.96 4.00 3.44 5.39
1.64 1.76 1.68 11.80
16. 17. 18. 19.
Familiarity BPMN Understanding BPMN Modeling BPMN BPMN usage
22.92 78.30% 1.91 2.00
SD 1.22 male 0.86 0.87
a
One modeler reported an implausible value and was therefore not considered in this overview.
Table 7.1: Demographic data of M S3 In order to test for the influence of prior modeling experience we apply a questionnaire similar to [155]. For this purpose, we screened the subjects for prior modeling experience (questions 9–15) and familiarity with BPMN (questions 16–19). The participants reported an average of almost three years of modeling experience (M = 2.90, SD = 1.39), including more than 5 days of formal training within the last 12 months (M = 5.59, SD = 10.35) and almost 7 days of self–education within the same timeframe (M = 6.59, SD = 10.86). We observed a fairly large variance regarding the number of models read (M = 42.60, SD = 52.54) and the number of models created (M = 20.33, SD = 19.03). The average size of the models the participants have been working with was 14 activities (M = 14.77, SD = 7.20), which is a little smaller compared to the process model in this study. When asked for prior
102
Scale 1. 2. 3. 4. 5. 6.
Disturbances during modeling session Difficulties understanding modeling task Modeling task difficult to follow Modeling task easy to understand Ambiguous modeling task description Clear modeling task description
yes/no 1–7 1–7 1–7 1–7 1–7
Min
Max
84.90% 1 1 2 1 3
M
SD
no disturbances 6 2.21 1.39 6 2.41 1.06 7 5.66 1.04 6 2.92 1.26 7 5.74 0.73
Table 7.2: Post–modeling survey use of modeling languages, 97.17% of the participants reported Petri Nets [184, 268] or Colored Petri Nets [119]. Further, 72.64% have been working with Workflow Nets [267] and 17.92% have used BPMN in the past. The participants reported familiarity with BPMN close to somewhat disagree (M = 2.96, SD = 1.64) and an average BPMN usage of 5 months (M = 5.39, SD = 11.80). Further, the modelers indicated a neutral confidence in understanding BPMN (M = 4.00, SD = 1.76). For competence in modeling using BPMN, the participants reported an average value of 3.44 (SD = 1.68). Summarized, the participant reported a certain degree of knowledge on imperative modeling languages, i.e., mostly on Petri–Nets. Since knowledge can be transferred between modeling languages of the same paradigm [208], the impact of the lack of profound BPMN knowledge might be compensated. Further, the transition should be supported by focusing on a subset of BPMN modeling constructs, the example BPMN process model on the assignment sheet, and the interactive tutorial explaining the basic language and tool features required for completing the modeling task. Further, we identified a certain degree of variance terms of modeling experience and domain knowledge, allowing to test for the influence of respective factors on the PPM. Post–modeling survey After the modeling session, the participants were asked whether they experienced disturbances (cf. Table 7.2). 84.90% reported that they did not experience any disturbances. The remaining 15.10% indicated disturbances due to noise (5.66%), confusion due to the modeling notation or task description (5.66%), technical problems (3.77%), or the lack of coffee (0.94%). Multiple problems could be indicated. Further, we asked the participants whether they had difficulties to understand the modeling task (M = 2.21, SD = 1.39), whether they perceived the modeling task to be difficult to follow (M = 2.41, SD = 1.06) and whether the modeling task was easy to understand (M = 5.66, SD = 1.04). Further, we
103
asked them whether the task description was ambiguous (M = 2.92, SD = 1.26) and whether the modeling task description was clear (M = 5.74, SD = 0.73). The results indicate that the modeling task was mostly clear to the students and that the participants did not have any major problems understanding the task description.
7.3.6 Data analysis CEP automatically records all interactions with the modeling environment. Using the recorded interactions, CEP can be utilized to generate a MPD for each PPM instance using the algorithm presented in Section 6.3.1. For this purpose, the same thresholds as in M S2 are used, i.e, thresholdc = 15s; thresholdd = 2s; thresholda = 4s. Further, the interactions with the modeling environment and the detected phases can be exported from CEP for further analysis. Similarly, the data recorded in the demographic survey and in the post modeling survey is exported. The data is then analyzed using SPSS (version 21.0).
7.4 Data exploration This section constitutes the second step toward identifying PBPs by analyzing the data recorded in M S3 . In M S1 we gained initial insights regarding the different phases of the PPM. To follow up on this aspect, we investigate situations where a considerable variation between modelers can be observed. Such situations are of special interest, as we might be able to identify different classes of reoccurring behavior, i.e., PBPs, within the variation of the modelers’ behavior. For this purpose, we start by generating the MPDs for all PPM instances collected in M S3 . Subsequently, we illustrate an example consisting of two MPDs differing in various aspects. From this starting point, we attempt to get an overview of different aspects of the PPM. Figure 7.4 illustrates two MPDs generated from the data collected in M S3 . When comparing the two MPDs only minor differences regarding the number of elements in the process model can be observed, i.e., illustrated on the vertical axis. The remaining differences regarding the number of elements can be attributed to different usage of modeling constructs and superfluous/missing activities. This was to be expected since both modelers were creating the same process model from the same textual description. Still, the PPM instances show considerable differences. For instance, the MPDs differ regarding the duration of the respective PPM instances. While the MPD in Figure 7.4 (a) shows a fairly long PPM instance, the MPD in Figure 7.4 (b) is considerably shorter. Additionally, the number of phases detected are different. Figure 7.4 (a) shows a high number of short phases, while Figure 7.4 (b) contains less and longer phases.
104
100 90 80
Comprehension Modeling Reconciliation
70
# elements
60 50 40 30 20 10 0 00:00
06:00
12:00
18:00
24:00
30:00
36:00
42:00
48:00
42:00
48:00
time [mm:ss]
(a) Longer PPM instances with a higher number of short phases 100 90 80
Comprehension Modeling Reconciliation
70
# elements
60 50 40 30 20 10 0 00:00
06:00
12:00
18:00
24:00
30:00
36:00
time [mm:ss]
(b) Shorter PPM instances with a smaller number of long phases
Figure 7.4: Two examples illustrating differences in MPDs
These observations are used as a starting point for a deeper data exploration. First, the durations of the PPM instances collected in M S3 are investigated. Then, we turn to differences regarding the detected phases. Differences between modelers might indicate different approaches to solving the problem. Therefore, investigating situations where a considerable variation can be observed might result in the identification of reoccurring behavior. This way, the findings regarding differences in duration and the number of phases guide the discovery of PBPs in Section 7.5.
7.4.1 Process of Process Modeling instance duration Considering the MPDs in Figure 7.4 differences regarding the duration of PPM instances can be observed. The PPM instance visualized in Figure 7.4 (a) indicates a total modeling duration of 45 minutes and 7 seconds while the modeling endeavor
105
70 min 60 min
Duration
50 min 40 min 30 min 20 min 10 min 0 min
PPM instance
Comprehension
Modeling
Reconciliation
Figure 7.5: PPM instance durations and total durations per PPM phase
displayed in Figure 7.4 (b) lasted only for 34 minutes and 1 second. Figure 7.5 displays the boxplot illustrating the durations of all PPM instances collected in M S3 . Additionally, Figure 7.5 illustrates the total durations aggregated by PPM phase type as obtained for the MPDs. While the exact values are influenced by the thresholds for detecting the PPM phases, it still provides some insights into the distribution of the different phases. The durations of PPM instances follow a normal distribution (M = 41:39, SD = 8:11). The data is summarized in Table 7.3 (normally distributed data is reported using mean and standard deviation, otherwise the median is reported; the Kolmogorov–Smirnov Test with Lilliefors significance correction is used for testing for normal distribution; results are listed in Appendix B.2). We observe a fairly large variance regarding the duration of the collected PPM instances. While the fastest modeler finished in 21 minutes and 2 seconds, it took the slowest modeler 61 minutes and 11 seconds. When revisiting the total durations for the different PPM phases (cf. Figure 7.5), we notice that the amount of time spent on comprehension (M = 18:07, SD = 6:12) is fairly similar to the time spent on modeling (M dn = 14:43). Only the total duration of reconciliation phases is considerably smaller (M = 6:01, SD = 3:34). Interestingly, the variance for the total duration of comprehension phases is larger compared to the other two PPM phases, i.e., ranging from 3:39 to 35:50. We might speculate about the reasons for these observations. The relatively small variation regarding
106
Seite 1
PPM Total Total Total
instance time comprehension time modeling time reconciliation time
Scale
N
Min
Max
mm:ss mm:ss mm:ss mm:ss
106 106 106 106
21:02 3:39 9:59 0:08
61:11 35:50 21:17 17:06
M
SD
41:39 8:11 18:07 6:12 M dn = 14:43 6:01 3:34
Table 7.3: PPM instances durations and total durations per phase type
the time spent on modeling, i.e., ranging from 9:59 to 21:17, might be explained by the fact that all participants created roughly the same amount of elements. The observed variation regarding time of modeling might be caused by quicker or faster adding of elements and by removing and re–modeling parts of the process model. The variance regarding reconciliation might be influenced by the modeler’s intent to improve the secondary notation. After all, the factual use of secondary notation is subject to personal preferences [183]. The large variance regarding the amount of time spent without interacting with the modeling environment might be attributed to prior knowledge on the domain, i.e., facilitating problem understanding, or prior modeling knowledge, i.e., supporting method finding. Subsequently, the different phases are investigated in more detail.
50
Number of phases
40
30
20
10
0
Comprehension
Modeling
Reconciliation
Figure 7.6: Number of phases in PPM instances
107
7.4.2 Process of Process Modeling phases The MPDs displayed in Figure 7.4 further indicate differences regarding the number of detected phases of the PPM. While Figure 7.4 (b) shows several longer phases, e.g., larger phases of modeling, Figure 7.4 (a) indicates a higher number of shorter phases. In M S3 , a total of 7035 PPM phases distributed over the PPM instances of the participants were detected; 2491 (35.41%) comprehension phases; 2762 (39.26%) modeling phases, and 1782 (25.33%) reconciliation phases. Figure 7.6 illustrates boxplots for the different types of PPM phases, the corresponding statistics are presented in Table 7.4. The collected data indicates fairly large differences regarding the phases in PPM instances. For example, the number of reconciliation phases ranges from 3 to 38 detected phases within a PPM instance. In an attempt to quantify differences regarding the existence of phases within PPM instances, we divide PPM instances into PPM iterations. One PPM iteration is assumed to comprise a comprehension (C), modeling (M), and reconciliation (R) phase in this order. The PPM iterations of a PPM instance are identified by aligning its phases to the CMR–pattern. If a phase of this pattern is not present, the respective phase is skipped and the process is considered to continue with the next phase of the pattern. An overview of the number of PPM iterations in M S3 is listed in Table 7.4. The lowest number of PPM iterations is 11, going up to 50 PPM iterations within one PPM instance. Further, the number of PPM iterations is not significantly different form a normal distribution with M = 31.39, SD = 8.27 (cf. Appendix B.2). The differences in the number of PPM iterations indicate that modelers not only differ in terms of modeling speed, i.e., modelers who work faster, but also utilize different PBPs by switching between the different phases of the PPM. For instance, modelers might apply different strategies for laying out the process model. Some might continuously layout the process models, i.e., switching between modeling and reconciliation, others might improve the secondary notation at the end of the PPM instance. Conclusion Summarized, we identified three aspects indicating considerable differences between modelers. First, we observed differences in terms of durations of PPM instances. Second, the number of detected PPM phases differs considerably between the PPM instances. Third, by aggregating PPM phases to PPM iterations, we were able to observe considerable differences in how phases are combined. Differences in behavior are of special interest for the discovery of PBPs as such differences might indicate different approaches to solving a problem. Therefore, these insights are used in Section 7.5 to develop a catalog of PBPs, describing reoccuring behavior that can be frequently observed. For this, we investigate the different phases of the
108
PPM iterations Comprehension phases Modeling phases Reconciliation phases
Scale
N
Min
Max
iterations phases phases phases
106 106 106 106
11 3 11 3
50 46 42 38
M
SD
31.39 8.27 M dn = 24.00 26.06 6.59 M dn = 16.50
Table 7.4: Number of PPM iterations and number of PPM phases PPM, e.g., problem understanding, with respect to the differences identified in this section. In this context, insights from M S1 guide the identification of PBPs, e.g., we observed that initial phases of the PPM are associated with problem understanding (cf. Section 7.5.1).
7.5 A catalog of Process of Process Modeling Behavior Patterns and the influence of modeler–specific factors This section addresses RQ2.1 by developing a catalog of PBPs. The identification of PBPs is guided by the initial insights gained in M S1 (cf. Section 7.2) and the differences identified during data exploration (cf. Section 7.4). Additionally, we strive for answering RQ3.1 by investigating the connection of PBPs to modeler– specific factors, i.e., domain knowledge and modeling experience.
7.5.1 Problem understanding First, we start with the initial part of a PPM instance, i.e., we start with investigating problem understanding. In M S1 it was observed that PPM instances started with longer phases of problem understanding to develop an understanding of the problem to be solved (cf. Section 7.2.1). In M S3 no think aloud data is available to distinguish between problem understanding and method finding. Therefore, we exploit the insight of M S1 that PPM instances started with problem understanding phases, i.e., we assume that the initial comprehension phase of a PPM instance can be primarily attributed to problem understanding. Figure 7.7 illustrates the initial comprehension phases of two PPM instances collected in M S3 . When comparing the two PPM instances, significant differences regarding the duration between the start of the PPM instance and the first modeling phase can be observed. For instance, Figure 7.7 (a) displays a MPD with a short initial comprehension phase of less than 2 minutes while the PPM instance displayed in Figure 7.7 (b) shows an
109
Comprehension phases Initial comprehension duration Avg. comprehension duration Share of comprehension
Scale
N
Min
Max
phases mm:ss mm:ss %
106 105 106 106
3 0:42 0:21 21.35
46 16:52 1:02 57.01
M
SD
M dn = 24.00 4:34 2:23 M dn = 00:34 38.38 8.08
Table 7.5: Comprehension measures initial comprehension phase of more than 8 minutes. This variation regarding the initial comprehension phase might indicate different classes of behavior. 100
100
Comprehension
90
90
Modeling
80
80
Reconciliation
70
Comprehension Modeling Reconciliation
70
# elements
# elements
60 50 40
60 50 40
30
30
20
20
10
10
0 00:00
06:00
time [mm:ss]
12:00
0 00:00
18:00
06:00
24:00
12:00
time [mm:ss]
(a) Short initial comprehension phase (PBP1.a) (b) Long initial comprehension phase (PBP1.b)
Figure 7.7: Differences regarding the initial comprehension phase
Table 7.5 outlines how PPM instances of M S3 differ in terms of initial comprehension duration (M = 4:34, SD = 2:23). The data follows a normal distribution (cf. Appendix B.2). Notably, for one PPM instance, the time to the first modeling phase was extremely short, i.e., less than 7 seconds. As this is shorter than the threshold defined for recognizing comprehension phase, the PPM instance starts with a modeling phase, lacking an initial comprehension phase. Therefore, 105 PPM
110
30:00
18
instances are considered in Table 7.5. The variation regarding initial comprehension duration corroborates our impression gained from analyzing the MPDs that different approaches to solving the problem in terms of the initial comprehension phase exist. Some modelers started after few seconds, e.g., the minimum initial comprehension duration was 42 seconds, while others invested a considerable amount of time before starting with the creation of the process model, e.g., a maximum initial comprehension duration of 16:52. Based on these insights, we define the following PBP. PBP1 “Problem understanding” Differences exist regarding the time it takes modelers to start working on the process model. While some modelers start right away with adding content to the process model (PBP1.a), others invest more time for gaining an understanding of the modeling task (PBP1.b). In order to let sunlight fall on how modeler–specific factors influence the duration of initial comprehension phases, we consider the participants’ demographic data. The importance of domain knowledge for the understanding of conceptual models has been demonstrated in the past [125, 126]. Arguably, similar effects might be observed for process modeling tasks. In [251], the authors argue that forming an internal representation is affected by pre–existing knowledge on the domain, since the participant can integrate the modeling task in pre–existing schemata. Prior domain knowledge can affect the creation of an internal representation even before mapping the internal representation to modeling constructs [251], i.e., during method finding. Hence, we start by investigating prior knowledge regarding the domain of the modeling task, which might result in shorter initial comprehension phases. For this purpose, we identify correlations between the duration of the initial comprehension phase and the four questions on domain knowledge as listed in Table 7.1. Table 7.6 provides and overview of the identified correlations. Significant correlations can be observed for familiarity with mortgage processes (rs (105) = −0.32, p = 0.001), whether modelers created process models in the financial domain before (rs (105) = −0.32, p = 0.001) and whether modelers created mortgage process models before (rs (105) = −0.34, p < 0.001). No significant correlation between familiarity with financial process and initial comprehension duration could be identified. According to [32, 33], effect sizes between 0.3 and 0.5 can be considered as medium effects. Therefore, we conclude that an interaction between prior knowledge and PBP1 exists. More specifically, as suggested by [251], the presence of prior domain knowledge facilitates the creation of an internal representation of domain knowledge. In terms of prior modeling knowledge no significant correlations
111
Initial comprehension duration Cor. Sig. Familiarity financial processes Familiarity mortgage processes Financial models created Mortgage models created
−0.32 −0.32 −0.34
0.001 0.001 0.001
Familiarity BPMN Understanding BPMN Modeling BPMN BPMN usage
Table 7.6: Influence of modeler–specific factors on PBP1
could be identified with initial comprehension duration. Further, we might speculate about additional aspects influencing problem understanding. For instance, working memory is essential for maintaining and manipulating a limited amount of information for goal directed behavior [10, 39]. More specifically, during the PPM, working memory is responsible for the representation and integration of information for an iterative construction of an internal representation (cf. Section 6.2). This is supported by empirical evidence indicating that working memory capacity predicts performance in tasks like, e.g., language comprehension [122], reasoning [172], fluid intelligence [34], and the integration of preexisting domain knowledge [104]. Therefore, working memory capacity might influence problem understanding. Additionally, the modeler’s personality might influence how the modeling task is approached. For instance, [139] assumes that self–regulation consists of two basic modes: locomotion and assessment. Locomotion is characterized by movement and refers to direct action (“Just doing it”). Assessment refers to cognitive evaluation of a situation, i.e., thinking about a situation and its interpretation (“Doing the right things”). For this, different alternatives are evaluated in terms of strengths and weaknesses as well as quality. A person with high locomotion and low assessment acts like a “headless chicken” (trial and error). A person with low locomotion and high assessment will put only little into action. Therefore, for high achievement performance, balancing locomotion and assessment is necessary [107]. These strategies might be reflected by PBP1. Modelers scoring high on assessment might have longer initial comprehension phases (PBP1.b) as they spend a significant amount of their time to understand every detail of the task description. Modelers scoring high on
112
locomotion, on the contrary, might start adding content to the process model right away (PBP1.a), without spending significant time on building a complete internal representation of the domain.
7.5.2 Method finding In M S1 we observed that the focus of intermediary comprehension phases shifted toward method finding. Initial phases of inactivity were concerned with understanding the problem, while the translation to modeling constructs became more dominant in later phases of inactivity (cf. Section 7.2.1). Therefore, we consider the remaining comprehension phases, not including initial comprehension phases, to represent predominantly method finding. Figure 7.4 illustrates two MPDs differing regarding the number of comprehension phases that interrupt the modeling endeavor. The MPD in Figure 7.8 (a) shows a PPM instance where the modeler interrupted the modeling endeavor only rarely for additional comprehension. More specifically, Figure 7.8 (a) displays a 12 minutes interval of a PPM instance, which contains only 3 short comprehension phases. On the contrary, the MPD in Figure 7.8 (b), which also depicts a 12 minute interval, contains 9 comprehension phases. The boxplot illustrating the number of comprehension phases for all PPM instances of M S3 is shown in Figure 7.6. The corresponding data is listed in Table 7.5. The number of comprehension phases does not follow a normal distribution (cf. Appendix B.2). The median number of comprehension phases is 24.00. The lowest number of comprehension phases within one PPM instance is 3, while the highest number of comprehension phases is 46. Based on these insights, we might argue that different approaches in terms of comprehension can be observed. Some modelers rarely need to interrupt their modeling endeavor for phases of comprehension, while other modelers frequently stop their modeling endeavor, resulting in a high number of comprehension phases. In an attempt to better understand the differences in the occurrence of comprehension phases, we calculate the average duration of comprehension phases. In order to limit the influence of problem understanding, we neglect the initial comprehension phase. The resulting data is presented in Table 7.5. Interestingly, we observe a small to medium positive correlation between the number of comprehension phases and the average duration of comprehension phases (rs (106) = 0.31, p = 0.001). This indicates that modelers who interrupted their modeling endeavor more frequently, also spent more time on comprehension compared to modelers who rarely interrupted modeling for explicit phases of comprehension.
113
100 100 90 90 80 80 70 70
# elements # elements
60 60
50 50 40 40 30 30 20 20 10 10
00 00:00 00:00
Comprehension Modeling Reconciliation
Comprehension Modeling Reconciliation 06:00 06:00
12:00 12:00
time [mm:ss] (a) Few comprehension phases (PBP2.a)
18:00 18:00
24:00 24:00
30:00 30:00
time [mm:ss] (b) Several comprehension phases (PBP2.b)
Figure 7.8: Differences regarding the number of comprehension phases In order to combine the number of comprehension phases with their respective durations, we define share of comprehension. Share of comprehension assesses how often modelers interrupt their modeling endeavor for additional comprehension and grasps the influence of the duration of those comprehension phases. For this purpose, we quantify this aspect as the ratio of the average length of a comprehension phase in a process to the average length of a PPM iteration. In order to focus on the intermediary comprehension phases, the initial comprehension phase is ignored for share of comprehension. Share of comprehension for M S3 follows a normal distribution with M = 38.38% and SD = 8.08% (cf. Table 7.5). Based on these observations, we define PBP2 as follows. PBP2 “Method finding” Differences exist regarding the number and duration of comprehension phases within PPM instances. While some modelers only rarely interrupt modeling for phases of comprehension (PBP2.a), others stop their modeling endeavor more frequently for longer phases of comprehension (PBP2.b).
114
Comprehension phases Cor. Sig. Familiarity financial processes Familiarity mortgage processes Financial models created Mortgage models created Familiarity BPMN Understanding BPMN Modeling BPMN BPMN usage
−0.22
0.026
−0.21 −0.26 −0.21
0.030 0.007 0.035
Table 7.7: Influence of modeler–specific factors on PBP2
Interestingly, we did not observe a significant correlation between the number of comprehension phases and the initial comprehension duration (rs (105) = 0.10, p = 0.320), the average duration of comprehension phases and the initial comprehension duration (rs (105) = −0.01, p = 0.914), and share of comprehension with the initial comprehension duration (rs (105) = −0.41, p = 0.677). This indicates that modelers, who spent more time on comprehension at the beginning of the PPM instance, still need to interrupt their modeling endeavor for further phases of comprehension. This supports the distinction between problem understanding and method finding. Similar to PBP1 prior domain knowledge might influence the number of comprehension phases as illustrated in Table 7.7. The influence seems to be lower though, as we could only identify a small correlation between the number of comprehension phases and whether modelers created mortgage models before (rs (106) = −0.22, p = 0.026). This is consistent with our previous observation made in M S1 that the importance of problem understanding—and therefore the influence of domain knowledge—diminishes as the PPM instance progresses. No significant correlations between domain knowledge and the other measures were observed. In contrast to PBP1, a significant small correlation of the number of comprehension phases with the reported understanding of BPMN was observed (rs (106) = −0.26, p = 0.007). Significant correlations with similar effect sizes could be identified for familiarity with BPMN (rs (106) = −0.21, p = 0.030) and the confidence in using BPMN (rs (106) = −0.21, p = 0.035). An overview of the significant correlations is presented in Table 7.7. No significant correlations with the average duration of comprehension phases or share of comprehension with prior modeling experience were observed.
115
Modeling phases Avg. modeling phase size Adding rate Iteration chunk size
Scale
N
Min
Max
phases interactions interactions interactions
106 106 106 106
11 2.55 0.070 2.06
42 11.50 0.170 9.18
M
SD
26.06 6.59 M dn = 5.09 M dn = 0.110 M dn = 4.12
Table 7.8: Modeling measures These findings indicate that modelers who are familiar with BPMN require less phases of explicit comprehension to map the internal representation to the modeling constructs. This finding is consistent with the distinction between problem understanding and method finding. Similarly, the authors of [251] argue that mapping the internal representation to modeling constructs is of a more technical nature, influenced by knowledge on the modeling language. Additionally, the number of comprehension phases interrupting the modeling endeavor might be influenced by working memory capacity. Working memory capacity is essential for the storage of information in working memory while perform a different task [10, 39]. This is similar to performing the modeling task, where modelers need to maintain the internal representation of the problem while working on the process model. Modelers with high working memory capacity might therefore be able to work continuously on the process model without the need for interrupting for phases of comprehension. Similarly, working memory capacity might be connected to the average duration of method finding phases, also resulting in a lower share of comprehension. Similar to PBP1, assessment might influence method finding. Modelers scoring high on assessment might interrupt their modeling endeavor for longer phases of comprehension to evaluate their current situation and think about potential alternatives. Modelers scoring high on locomotion, on the contrary, might not exhibit this behavior.
7.5.3 Modeling In this section we investigate differences regarding modeling phases within PPM instances. For this purpose, we visually inspect the MPDs collected in M S3 , indicating differences between modelers regarding the number and size of modeling phases. For instance, Figure 7.9 illustrates two MPDs differing in terms of modeling phases. Figure 7.9 (a) shows several larger modeling phases, increasing the number of elements in the process model fairly quickly. The MPD illustrated in Figure 7.9 (b), on the contrary, displays several small modeling phases, interrupted
116
by frequent phases of comprehension and reconciliation. Consequently, the number of elements in the process model increases slower compared to Figure 7.9 (a).
Comprehension Modeling Reconciliation
Comprehension Modeling Reconciliation 12:00 06:00
18:00 12:00
time [mm:ss] (a) Large modeling phases (PBP3.a)
24:00 18:00
30:00 24:00
36:00 30:00
time [mm:ss] (b) Small modeling phases (PBP3.b)
Figure 7.9: Differences regarding the size of modeling phase Similar to method finding, we consider the number of modeling phases. In total, 2762 modeling phases were detected in the PPM instances collected in M S3 . On average, each PPM instance contained 26.06 modeling phases (SD = 6.59), following a normal distribution (cf. Appendix B.2). When considering the average size of modeling phases, i.e., the number of interactions with the modeling environment in a modeling phase, a certain degree of variation between modelers can be observed. While the modeling phases of one modeler contained 11.50 interactions on average, a different modeler had only an average of 2.55 interactions with the modeling environment in modeling phases (M dn = 5.09). Further, we intend to grasp the actual speed of modeling. This way, differences between modelers in terms of how quickly elements are added to the canvas are considered. Adding rate is calculated by counting the number of adding interactions
117
42:00 36:00
within modeling phases, i.e., CREATE NODE, CREATE EDGE, and dividing it by the total duration of modeling phases in seconds within a PPM instance. We observed a adding rate ranging from 0.070 to 0.170, not following a normal distribution (M dn = 0.110, cf. Appendix B.2). Finally, the measures presented previously do not grasp pauses between modeling phases, e.g., PPM iterations containing only comprehension and reconciliation phases. In order to address this aspect, we analyze the PPM instances from the perspective of PPM iterations. For this purpose, iterations chunk size considers PPM iterations without dedicated modeling phases. For this purpose, the average number of modeling interactions per PPM iteration is calculated. Further, all modeling interactions per PPM iteration are considered, e.g., modeling interactions that might be part of reconciliation phases. This way, iteration chunk size reflects the ability to model large parts of a model without the need for phases of problem understanding or method finding. Naturally, the obtained values are slightly lower compared to the average modeling phase size. Iteration chunk size does not follow a normal distribution (cf. Appendix B.2) with M dn = 4.12. We observe a variance comparable to the average size of modeling phases, ranging from 2.06 to 9.18. Summarized, we observed considerable differences regarding the number of modeling phases, their size, the speed of modeling and the distribution of modeling interactions over PPM iterations. Some modelers had fewer, large modeling phases, while the modeling phases of others were frequently interrupted by additional phases of comprehension or reconciliation. Therefore, we propose the following PBP. PBP3 “Chunks of modeling” Differences exist regarding the number of interactions in modeling phases. While some modelers add modeling elements quickly in large chunks of modeling (PBP3.a), others show smaller modeling phases (PBP3.b). Table 7.9 presents an overview of the correlations with the participants’ demographic data. In terms of domain knowledge, we could only identify a small correlation of the number of modeling phases with whether modelers created mortgage models in the past (rs (106) = −0.21, p = 0.035). The other measures regarding modeling did not correlate significantly with domain knowledge. We conclude that only a limited influence of domain knowledge on modeling exists. The number of modeling phases shows a small negative correlation with the reported familiarity with BPMN (rs (106) = −0.25, p = 0.009). Similarly, we could identify significant correlations of the number of modeling phases with confidence in understanding BPMN (rs (106) = −0.21, p = 0.031) and competence in using BPMN (rs (106) = −0.21, p = 0.034). We did not observe significant correlations in terms
118
Modeling phases Cor. Sig. Familiarity financial processes Familiarity mortgage processes Financial models created Mortgage models created Familiarity BPMN Understanding BPMN Modeling BPMN BPMN usage
−0.21 0.035 −0.25 0.009 −0.21 0.031 −0.21 0.034
Table 7.9: Influence of modeler–specific factors on PBP3 of modeling experience for the remaining measures. The correlations indicate that prior knowledge in BPMN was related to the number of modeling phases. Therefore, we conclude that prior BPMN knowledge is beneficial for the usage of modeling constructs, i.e., the models are created in less modeling phases. The effect was not strong enough to manifest in the size of modeling phases or the speed for adding elements. Therefore, we might speculate about other factors influencing modeling, e.g., working memory capacity. Similar to the existence of schemata supporting the organization of knowledge in working memory, the size of modeling phases might be impacted by the modeler’s working memory capacity. Working memory capacity might influence the number of interactions in modeling phases since modelers with a higher working memory capacity might be able to develop the process model in larger chunks compared to modelers who are forced to revisit the textual description of the modeling task more frequently. Further, the influence of personal characteristics might be of interest. Modelers scoring high on assessment, might stop their modeling endeavor frequently to inspect their result, while others might continue to work quickly in large chunks on the process model, rarely reconsidering the created elements.
7.5.4 Reconciliation In this section, we try to identify PBPs regarding the modelers’ reconciliation behavior. The most prominent type of reconciliation in M S3 can be considered improving the process model’s secondary notation, i.e., the process model’s layout. Additionally, reconciliation also considers refactoring of the process model, e.g., renaming of activities.
119
As a first step, we categorize the interactions with the modeling environment to modeling and reconciliation as described in Section 6.3.1. The boxplot in Figure 7.10 illustrates the number of modeling interactions and the number of reconciliation interactions. The median number of modeling and reconciliation interactions is fairly similar (medians are used for comparing data that is not normally distributed, cf. Appendix B.2). When comparing the number of modeling interactions (M dn = 126.00) and the number of reconciliation interactions (M dn = 103.00) we observe slightly more modeling interactions (Z = 3.38, p = 0.001, r = 0.33). Interestingly, the distribution of the number of interactions is considerably wider for reconciliation. More specifically, the interquartile range for modeling interactions is 21, while the interquartile range for reconciliation interactions is 83.
Number of interactions
300
200
100
0
Modeling
Reconciliation
Figure 7.10: Number of modeling and reconciliation interactions
When aggregating reconciliation interactions to reconciliation phases, it can be observed that the number of reconciliation phases (M dn = 16.50) is considerably smaller compared to the number of modeling phases (M dn = 26.00; Z = 8.66, p < 0.001, r = 0.84), indicated by a large effect size. Consequently, the average reconciliation phase (M dn = 5.57) tends to be significantly larger than the average modeling phase (M dn = 5.09; Z = 2.59, p = 0.010, r = 0.25). This indicates that not all PPM iterations contain a reconciliation phase. Whenever modelers stop
120
Seite 1
Reconciliation interactions Reconciliation phases Avg. reconciliation phase size Max. reconciliation phase size Avg. number of moves per node
Scale
N
Min
Max
interactions phases interactions interactions interactions
106 106 106 106 106
11 3 1.33 2 0.13
269 38 13.60 68 4.81
M
SD
M dn = 103.00 M dn = 16.50 M dn = 5.57 M dn = 17.50 1.47 0.89
Table 7.10: Reconciliation measures their modeling endeavor for reconciliation phases, the reconciliation phases tend to be larger compared to the modeling phases in the PPM instance. In order to quantify this observation, we consider the maximum reconciliation phase size, i.e., the largest reconciliation phase in the PPM instances, which range from 2 to 68 interactions (M dn = 17.50). Further, in order to grasp whether modelers frequently touch model elements, we calculate the average number of moves per node. We derive this measure by counting the number of move interactions, i.e., MOVE NODE, for each node within the process model, calculating the average number of move interactions per node. The average number of move interactions follows a normal distribution (M = 1.47, SD = 0.89, cf. Appendix B.2). Subsequently, we try to identify different PBPs regarding the reconciliation behavior of modelers. To accommodate for the large difference between modelers, we assign the modelers to two groups. First, we start by focusing on modelers with a low number of reconciliation interactions. For this purpose, we investigate PPM instances with a smaller than median number of reconciliation interactions, i.e., modeler who are avoiding reconciliation. Second, we investigate PPM instances with a greater or equal than median number of reconciliation interactions, i.e., modelers who are embracing reconciliation. Avoiding reconciliation In an attempt to better understand the reconciliation behavior of modelers who avoid reconciliation, we first focus on modelers with a low number of reconciliation interactions. For this purpose, we investigate PPM instances with a smaller than median number of reconciliation interactions. Consequently, we consider 51 PPM instances with less than 103.00 reconciliation interactions. Table 7.11 shows the reconciliation measures for modelers avoiding reconciliation. Due to the low number of reconciliation interactions, differentiating between modelers based on the number of interactions is difficult. Therefore, we also consider
121
Reconciliation interactions Reconciliation phases Avg. reconciliation phase size Max. reconciliation phase size Avg. number of moves per node
Scale
N
Min
Max
interactions phases interactions interactions interactions
51 51 51 51 51
11 3 1.33 2 0.13
101 29 8.60 31 1.78
M
SD
63.31 23.38 M dn = 12.00 4.53 1.47 M dn = 13.00 0.79 0.40
Table 7.11: Reconciliation measures for modelers avoiding reconciliation
the visual appearance of the final process model, i.e., did the modeler care about the visual appearance of the process model. Figure 7.11 (a) illustrates a MPD taken from this group of modelers. The number of reconciliation phases is relatively small, i.e., 8 reconciliation phases are detected. Figure 7.11 (b) displays the corresponding process model. Considering the process model it strikes the eye that the modeler hardly cared about the visual appearance of the process model. Activities and the corresponding gateways are only roughly aligned, e.g., the gateways of the optional activity on the top right. Further, the modeler did not avoid edge crossings, e.g., by switching the two branches of the exclusive construct on the bottom right and by introducing one bend point, two edge crossing could have been avoided. Consequently, we argue that the modeler did not invest into improving the process model’s secondary notation. This behavior is subsequently categorized as careless reconciliation. In order to further investigate careless reconciliation, we perform a manual classification of the created process models. For this purpose, the question arises how careless reconciliation can be identified, as the reconciliation behavior of modelers is influenced by their personal preferences [183]. Literature on the layout of process models, e.g., [93, 129, 201, 238], and trees, e.g., [256], derives desirable properties of process models. For instance, [201, 238] report that not only edge crossings but also the number of bend points should be minimized. Unfortunately, such guidelines might work in opposite directions as edge bend points can be used to reduce the number of edge crossings. Similarly, [201, 238] argue that edges should be drawn in the direction of the process’ flow, while [129] argue that the process model should consume as less space as possible. By making the process model as compact as possible, edges against the direction of the process’ flow might be necessary. As a consequence, modelers decide for each situation which layout constraints are applied, reflecting the modeler’s personal preferences [183]. For quantifying layout performance we define two sub–criteria. First, we focus on the routing of edges, e.g., how modelers utilized bend points in the process model. Second, we consider the
122
100 90 80
Comprehension Modeling Reconciliation
70
# elements
60 50 40 30 20 10 0 00:00
06:00
12:00
18:00
24:00
30:00
36:00
42:00
48:00
time [mm:ss]
(a) Modeling Phase Diagram
(b) Final process model
Figure 7.11: Careless reconciliation (PBP4.a)
placement of activities. For instance, modelers might group elements of the process model to make their identification easier. If modelers fail to fulfill any of the two sub–criteria, we consider it careless reconciliation. For instance, the process model depicted in Figure 7.11 (b) did not fulfill the edge criterion as two edge crossings could be avoided by adding one bend point to route the edge on the right around the end event. Further, the node sub–criterion was not fulfilled as the modeler placed model elements careless on the modeling canvas. For instance, the parallel gateways on the bottom left are not aligned. By applying this categorization, we identified 12 (23.53%) process models applying a careless reconciliation strategy among the 51 process models with less than median reconciliation interactions.
123
100 90 80
Comprehension Modeling Reconciliation
70
# elements
60 50 40 30 20 10 0 00:00
06:00
12:00
18:00
24:00
30:00
36:00
42:00
48:00
time [mm:ss]
(a) Modeling Phase Diagram
(b) Final process model
Figure 7.12: Strategic Reconciliation (PBP4.b)
Interestingly, some of the modelers performing only a limited amount of reconciliation interactions created process models that cannot be considered careless, as either the node placement and/or the edge routing was performed carefully. For instance, Figure 7.12 (a) shows the MPD of a different modeler, exhibiting similar characteristics compared to the MPD in Figure 7.11 (a). Both PPM instances are of similar duration and do not show any major decreases in the number of model elements. Further, both MPDs show only a small number of brief reconciliation phases. The PPM instance in Figure 7.12 contains 38 reconciliation interactions while the PPM instance illustrated in Figure 7.11 contains 63 reconciliation interactions. Still, the process model in Figure 7.12 (b) looks more structured compared to Figure 7.11 (b). The modeler grouped elements to visualize the structure of the process model and (mostly) avoided edge crossings. The only edge crossing in the process model is caused the modelers intend to arrange all end gateways at the bottom of the process model. It seems like this was more important to the modeler compared to the avoidance of the single remaining edge crossing. Based on these observations, we derive the next PBP as follows.
124
PBP4 “Avoiding reconciliation” When investigating the layout behavior of modelers, we identify several modelers avoiding reconciliation. These modelers differ regarding the use of secondary notation in the resulting process model. Some modelers do not care about the appearance of the process models (PBP4.a). Others place elements at strategic places right from the beginning, making subsequent reconciliation unnecessary, still making use of the process model’s secondary notation (PBP4.b). In order to test for connections between the modelers’ demographic data and the reconciliation behavior in the group of modelers with a smaller than median number of reconciliation interactions, we calculate Spearman’s correlation coefficient for the presented measures. We did not succeed in identifying any significant correlations regarding domain knowledge or modeling experience. Additionally, we calculated the point–biserial correlation between the demographic data and the manual classification of careless layout behavior. Similarly, we did not identify any significant correlations. Therefore, we conclude that the reconciliation behavior of modelers with a below median number of reconciliation interactions was not determined by the modelers prior knowledge regarding the domain or prior modeling experience. For explaining differences regarding the reconciliation behavior, we might speculate about the influence of the modeler’s personality. For instances, modelers scoring high on locomotion might put model elements careless on the modeling canvas to speed up the modeling endeavor, potentially neglecting secondary notation. In this context, the concept of self–leadership might be of interest. Self–leadership integrates a broad spectrum of self–influencing strategies. In addition to behavior– focused strategies, it includes regulatory components and intrinsic motivation. To efficiently and effectively achieve goals, thoughts and behavior are strategically adjusted. The goal–oriented, strategic, and self–influencing processes of self–leadership show positive influence on task performance [77, 164] and complex problem solving [52]. Modelers scoring high on self–leadership might place elements at strategic positions right from the beginning allowing them to efficiently create a well laid out process model without the need for excessive reconciliation later on. Embracing reconciliation In this section, we investigate all PPM instances with a higher than median number of reconciliation interactions, i.e., more or equal than 103.00 reconciliation interactions. Table 7.12 shows reconciliation measures for modelers embracing reconciliation. This group shows a considerably lower number of process models with poor
125
Reconciliation interactions Reconciliation phases Avg. reconciliation phase size Max. reconciliation phase size Avg. number of moves per node
Scale
N
Min
Max
interactions phases interactions interactions interactions
55 55 55 55 55
103 8 3.30 10 1.00
269 38 13.60 68 4.81
M
SD
154.95 41.47 20.95 6.42 7.40 2.23 M dn = 28.00 M dn = 1.88
Table 7.12: Reconciliation measures for modelers embracing reconciliation
layout, i.e., only 6 process models (10.91%) violated the placement of model elements and edge routing criteria. Still, we observe a considerable variation in terms of average reconciliation phase size and maximum reconciliation phase size. Therefore, we focus on the distribution of reconciliation interactions within the recorded PPM instances in order to identify PBPs for modelers embracing reconciliation, instead of investigating the visual appearance of the final process models. When investigating the MPDs with more or equal than 103.00 reconciliation interactions, several PPM instances similar to Figure 7.13 can be observed. The MPD in Figure 7.13 shows only a limited amount of reconciliation during the creation of the PPM instances, but contains a larger reconciliation phase toward the end of the modeling endeavor. The MPD in Figure 7.13 indicates that the modeler placed the model elements on the modeling canvas, deferring the reconciliation toward the end of the modeling endeavor. In a dedicated reconciliation phase, the process model is cleaned up and the final layout is established. 120 110
Comprehension Modeling
100
Reconciliation
90 80
# elements
70 60 50 40 30 20 10 0 00:00
06:00
12:00
18:00
24:00
30:00
36:00
time [mm:ss]
Figure 7.13: Deferred reconciliation to the end (PBP5.b)
126
42:00
48:00
Reconciliation interactions Reconciliation phases Avg. reconciliation phase size Max. reconciliation phase size Avg. number of moves per node
Scale
N
Min
Max
interactions phases interactions interactions interactions
21 21 21 21 21
103 8 5.05 17 1.32
269 32 13.60 66 3.63
M
SD
155.76 49.67 18.86 7.22 8.39 2.44 33.38 12.52 M dn = 1.82
Table 7.13: Modelers with explicit reconciliation at the end (PBP5.b) To further investigate this behavior, we identify the number of PPM instances with a high number of reconciliation interactions toward the end of the PPM instances. This is done by manually inspecting all PPM instances, resulting in the identification of 21 PPM instances out of 55 PPM instances (38.18%) with a higher number of reconciliation interactions toward the end. An overview of the data is presented in Table 7.13; tests for normal distribution are presented in Appendix B.2. The PPM instances with reconciliation phases at the end contain an average of 155.76 reconciliation interactions with the modeling environment (SD = 49.67), distributed on 18.86 reconciliation phases (SD = 7.22). An average reconciliation phase consisted of 8.39 interactions (SD = 2.44). The average for maximum reconciliation phase size is 33.38 interactions (SD = 12.52) and the average number of moves per node has a median of 1.82. 120 110
Comprehension
100
Modeling
90
Reconciliation
80
# elements
70 60 50 40 30 20 10 0 00:00
06:00
12:00
18:00
24:00
30:00
36:00
42:00
48:00
time [mm:ss]
Figure 7.14: Continuous reconciliation (PBP5.a)
Figure 7.14 shows one of the 34 PPM instance with an above median number of reconciliation interactions, not containing longer phases of reconciliation toward the
127
Reconciliation interactions Reconciliation phases Avg. reconciliation phase size Max. reconciliation phase size Avg. number of moves per node
Scale
N
Min
Max
interactions phases interactions interactions interactions
34 34 34 34 34
103 9 3.30 10 1.00
258 38 11.29 68 4.81
M
SD
154.44 36.31 22.24 5.59 6.79 1.88 M dn = 27.00 2.12 0.77
Table 7.14: Modelers without explicit reconciliation at the end (PBP5.a)
end. The MPD in Figure 7.14 shows several reconciliation phases distributed over the PPM instance. The modeler stops frequently to reconcile the process model. Therefore, no reconciliation phase dedicated to cleaning up the process model at the end of the PPM instance is required. The PPM instances without specific reconciliation phases at the end have an average of 154.44 reconciliation interactions (SD = 36.31). These interactions are distributed over 22.24 reconciliation phases (SD = 5.59). The average reconciliation phase size is 6.79 interactions (SD = 1.88). The median for maximum reconciliation phase size is 27.00 interactions and the average number of moves per node is 2.12 (SD = 0.77). An overview of the data is provided in Table 7.14. Tests for normal distribution are presented in Appendix B.2.
15
30
20
10
Max. reconciliation phase size
Avg. reconciliation phase size
Number of reconciliation phases
40
10
5
0
0
No rec. at the Rec. at the end end
(a) Number of rec. phases
60
40
20
0
No rec. at the Rec. at the end end
(b) Avg. rec. phase size
No rec. at the Rec. at the end end
(c) Max. rec. phase size
Figure 7.15: Comparison of PPM instances with explicit reconciliation
128
Seite 1
Seite 1
In order to assess whether the manual classification resulted in different strategies for laying out the process model, we statistically test the differences between the two groups. We identify only slight differences regarding the number of reconciliation interactions. Similarly, the average number of moves per node is similar for both groups. The number of reconciliation phases, the average reconciliation phase size, and the maximum reconciliation phase size, on the contrary, indicate slight differences between the two groups (cf. Figure 7.15). To test whether the differences are significant, we use a t–test for data where both groups are normally distributed and the Mann–Whitney U–test for data where significant differences to a normal distribution can be identified (cf. Appendix B.2). The t–test indicates a close to being significant difference in terms of number of reconciliation phases between the groups with a small to medium effect size (t(53) = 1.95, p = 0.057, r = 0.253). The average size of reconciliation phases is higher for PPM instances with explicit reconciliation phases at the end (t(53) = −2.74, p = 0.008, r = 0.345). The difference for maximum reconciliation phase size is also close to being significant (U = 256.00, p = 0.080, r = 0.236). We conclude, that different strategies in terms of when reconciliation is performed within the group of modelers with a greater or equal than median number of reconciliation interactions exists. Therefore, we define the following PBP. PBP5 “Embracing reconciliation” Modelers put nodes on the canvas and perform reconciliation later on. Reconciliation is either performed continuously (leading to a high number of reconciliation phases with a small number of reconciliation interactions each) (PBP5.a) or toward the end of the PPM instance all at once (smaller number of reconciliation phases with a higher number of reconciliation interactions) (PBP5.b). We did not identify significant correlations between domain knowledge or modeling experience with the presented measures. Additionally, we calculated the point– biserial correlation between the demographic data and the existence of long reconciliation at the end as described before. Similarly, we did not identify any significant correlations. As a consequence, we might argue that other factors influence the reconciliation behavior of modelers. More specifically, literature suggests that the modelers personal style might influence reconciliation behavior [183]. The question arises whether personal style can be measured in terms of the modeler’s personal characteristics. For instance, modelers scoring high on assessment might tend toward constantly improving the process model’s secondary notation. On the contrary, modelers scoring
129
high on self–regulation might rather quickly create the process model, potentially neglecting the process model’s secondary notation, before cleaning up the process model at the end.
7.5.5 Validation In M S1 it was observed that validation was often interwoven with modeling and reconciliation phases (cf. Section 7.2.1). In order to quantify this behavior for M S3 , the generated MPDs are inspected. For instance, Figure 7.16 illustrates such a MPD. At the end of the PPM instance, additional phases of comprehension can be identified. These comprehension phases co–occur with reconciliation phases, forming a plateau within the MPD. Occasionally, the comprehension phases are interrupted by modeling phases. These modeling phases are frequently horizontal, i.e., the number of elements in the process model does not change. This happens, when modelers remove elements from the process model and add new elements within the same modeling phase. Therefore, validation might be quantified by inspecting the MPDs and assessing whether such a plateau exists. When replaying the PPM instance illustrated in Figure 7.16 using CEP, it seems that the modeler was validating the process model. More specifically, the plateau starts with a reconciliation phase where the modeler completes the edge routing of the process model. The reconciliation phase is followed by the first comprehension phase on the plateau. After this comprehension phase, the modeler moves a few elements of the process model and renames one activity. More specifically, the modeler changes the activity’s name from “Enter in System” to “Enter data in System”. Next, we observe a comprehension phase followed by a brief reconciliation phase where a few model elements are moved. After the next comprehension phase we observe a horizontal modeling phase. In this modeling phase, the modeler removes two XOR gateways including the adjacent edges and re–creates the XOR gateways with a different edge routing. The modeling phase is followed by a comprehension phase and a brief reconciliation phase where the two XOR gateways are slightly moved to their final position. In these phases, the modeler touches various parts of the process model that have been created earlier. Consequently, we argue that the modeler validated the process model and conducted the required changes to the process model in the phases forming the plateau in the MPD. In this context, modeling phases might be used to resolve syntactic and semantic quality issues, while reconciliation might be intended to resolve pragmatic quality issues (cf. Section 7.2.1). Arguably, there exists an overlap between the validation pattern described in this section and the deferred reconciliation described in PBP5.b. In order to be considered a validation PBP, the reconciliation phase at the end has to be interrupted by
130
100 90 80
Comprehension Modeling Reconciliation
70
# elements
60 50 40 30 20 10 0 00:00
06:00
12:00
18:00
24:00
30:00
36:00
42:00
48:00
time [mm:ss]
Figure 7.16: Validation before completing the PPM instance (PBP6)
comprehension phases, indicating that the modeler spent time evaluating the created process model. Therefore, not all PPM instances considered for PBP5.b are also considered for PBP6. Based on this classification, we manually identify PPM instances with validation phases at the end. This results in 30 PPM instances (28.30%) with a validation phase at the end of the modeling endeavor comparable to Figure 7.16. 41 PPM instances (38.70%) do not contain a combination of comprehension and modeling/reconciliation phases at the end of the modeling endeavor. The remaining 35 PPM instances (33.00%) contain only a limited amount of comprehension and modeling/reconciliation phases at the end. Based on these observations, we define the following PBP. PBP6 “Clean–up” Before completing the PPM instance, modelers might validate the process model. This is indicated by phases of comprehension, i.e., validation, co–occurring with modeling and reconciliation phases. In modeling and reconciliation phases, the necessary changes identified in the validation phases are conducted. We are using the point–biserial correlation to identify connections between the modelers’ demographics and the existence of validation phases (cf. Table 7.15). When testing the influence of domain knowledge on the existence of validation phases, we identify correlations between the familiarity with mortgage processes (rpb (106) = 0.25, p = 0.010), whether modelers already created process models in the financial domain before (rpb (106) = 0.27, p = 0.005), and whether modelers created mortgage process models in the past (rpb (106) = 0.32, p = 0.001). Further, we test for the influence of modeling experience on the existence of validation phases (cf. Table 7.15). We observe significant correlations for the famil-
131
Validation phases Cor. Sig. Familiarity financial processes Familiarity mortgage processes Financial models created Mortgage models created
0.25 0.27 0.32
0.010 0.005 0.001
Familiarity BPMN Understanding BPMN Modeling BPMN BPMN usage
0.26 0.27 0.26
0.008 0.006 0.007
Years of modeling experience Models read last year
0.23 0.25
0.020 0.011
Table 7.15: Influence of modeler–specific factors on PBP6
iarity with BPMN (rpb (106) = 0.26, p = 0.008), the confidence in understanding BPMN (rpb (106) = 0.27, p = 0.006), and the competence in using BPMN (rpb (106) = 0.26, p = 0.007). Additionally, significant correlations for years of modeling (rpb (105) = 0.23, p = 0.020) and the number of models read (rpb (106) = 0.25, p = 0.011) were identified. It seems that more experienced modelers put a stronger emphasis on validating and improving the process model. Further, we might speculate about other factors influencing the existence of validation phases within PPM instances. For instance, self–regulation comprises two aspects, i.e., assessment and locomotion. Persons scoring high on assessment tend to evaluate their situation. In the context of the PPM, modelers scoring high on assessment might be more likely to include specific quality assurance phases, i.e., validation, in their PPM instances.
7.5.6 Error resolution In addition to the different phases of the PPM, we frequently observe situations where elements are removed from the process model, e.g, the number of elements in the MPD decreases. In such phases, modelers might be resolving problems in the process model. Therefore, we consider such situations specifically. As argued in Section 6.2 the PPM can be considered a problem solving task, i.e., the modeler moves from an initial state to the goal state by interacting with the modeling environment. When creating the process model, modelers might execute
132
interactions that increase the distance to the goal state. If this happens, modelers might need to remove elements from the process model to track back to a previous state, which was closer to the desired goal state, and then continue their modeling endeavor. The MPDs generated using the data collected in M S3 frequently show phases where the number of model elements decreases. For example, the MPD illustrated in Figure 7.17 shows two decreases in the number of model elements. First, a minor decrease after 18 minutes. The replay of the PPM instance using CEP reveals that in the modeling phase, the modeler removes a superfluous activity that was created in an earlier modeling phase and the corresponding edges from the process model. Arguably, the modeler identified the incorrect activity in the comprehension phase prior to the modeling phase. Second, after 30 minutes a major decrease in the number of model elements can be observed. In the steep modeling phase prior to the decrease, the modeler recreates an existing part of the process model with a slightly different control flow. In the subsequent modeling phase, the old model elements are deleted and the newly created part is linked to the rest of the process model. In the first case, the modeler added an unnecessary element to the process model that was removed later on, i.e., the modeler removed the element to get closer to the goal state. The second case is similar as unnecessary elements are created, which are removed later on. 100 90 80
Comprehension Modeling Reconciliation
70
# elements
60 50 40 30 20 10 0 00:00
06:00
12:00
18:00
24:00
30:00
36:00
42:00
48:00
time [mm:ss]
Figure 7.17: Decreasing number of model elements (PBP7)
After manually investigating the MPDs collected in M S3 , we identify a total of 18 PPM instances (17.00%) containing phases with major decreases in the number of model elements. Additionally, 47 PPM instances (44.30%) show minor decreases regarding the number of model elements that can be detected based on the MPDs.
133
Modeling interactions Delete interactions Delete iterations
Scale
N
Min
Max
interactions interactions %
106 106 106
85 0 0.00
171 41 30.00
M
SD
128.34 17.38 M dn = 6.50 11.26 7.37
Table 7.16: Error resolution measures
The deletion of model elements can be quantified by considering, on the one hand, the number of delete interactions. On the other hand, the number of modeling interactions might be considered, as deleting and adding elements results in an increased number of modeling interactions. Table 7.16 provides an overview of the measures attributed to error resolution. The data collected in M S3 contains PPM instances without any delete interactions, i.e., DELETE NODE or DELETE EDGE, but also one PPM instance with up to 41 delete interactions (M dn = 6.50), not following a normal distribution (cf. Appendix B.2). The number of modeling interactions follows a normal distribution (cf. Appendix B.2), with an average number of modeling interactions per PPM instance of 128.34 (SD = 17.38). We observe a considerable variance as the minimum number of model interactions is 85, while the maximum number of model interactions is 171. In order to put the number of delete interactions into perspective with respect to PPM iterations, delete iterations describe the relative number of PPM iterations in a PPM instance that contain delete interactions to the total number of PPM iterations. This should indicate whether a modeler deletes a larger part of the model at a certain point in time, or whether the delete interactions are distributed over several PPM iterations. We observed a maximum of 30.00% for delete iterations, following a normal distribution (M = 11.26, SD = 7.37, cf. Appendix B.2). Based on these observations, we derive the following PBP. PBP7 “Error resolution” When creating a process model, modelers sometimes increase the distance to the goal state. This is resolved by removing elements from the process model, i.e., the modeler tracks back to a previous state, which the modeler believes to be closer to the goal state. We did not identify a connection of domain knowledge with any of the presented measures (cf. Table 7.17). When investigating the influence of prior BPMN knowledge, the number of modeling interactions correlates negatively with familiarity with BPMN (rs (106) = −0.28, p = 0.003), confidence in understanding BPMN (rs (106) =
134
Modeling interactions Cor. Sig.
Delete interactions Cor. Sig.
−0.28 0.003 −0.20 0.040 −0.24 0.016
−0.20 0.040
Familiarity financial processes Familiarity mortgage processes Financial models created Mortgage models created Familiarity BPMN Understanding BPMN Modeling BPMN BPMN usage
Table 7.17: Influence of modeler–specific factors on PBP7
−0.20, p = 0.040), and competence in using BPMN (rs (106) = −0.24, p = 0.016). Regarding delete interactions, we identify a significant correlation between familiarity with BPMN and the number of delete interactions (rs (106) = −0.20, p = 0.040). No significant correlations with delete iterations were observed. Further, we might speculate about modeler characteristics that influence error resolution. For instance, modelers with higher working memory capacity might be able to create the solution, i.e., the process model, more efficiently, resulting in fewer interactions increasing the distance to the goal state. For instance, [234] describes a negative correlation between the number of deleted elements and working memory capacity. Similar effects might occur for locomotion and assessment. For instance, high locomotion in combination with low assessment could result in a higher number of deviations as modelers might be running into dead ends, i.e., they need to back– track to a previous state to continue their modeling endeavor.
7.6 Discussion In a first step, this chapter strived for developing a catalog of PBPs, which contributes to answering RQ2.1 . Second, factors influencing the occurrence of PBPs were investigated, contributing to the investigations on RQ3.1 . Subsequently, the contributions to RQ2.1 are discussed in Section 7.6.1 and the contributions to RQ3.1 are presented in Section 7.6.2. Finally, limitations of M S3 are discussed in Section 7.6.3.
135
7.6.1 RQ2.1 : Which Process of Process Modeling Behavior Patterns can be identified based on the modelers’ interactions with the modeling environment? RQ2.1 focuses on the identification of PBPs, covering different aspects of the PPM. For this purpose, the data collected in M S1 was revisited in order to gain initial insights guiding the identification of PBPs in M S3 . For instance, we observed the combination of phases of inactivity with modeling and reconciliation when validating the process model. Using the initial insights, an exploratory approach was used to investigate the interactions with the modeling environment collected in M S3 . For this purpose, a series of measures was developed to quantify the modelers’ behavior, resulting in a catalog of 7 PBPs. PBP
Name
Measures
PBP1
Problem understanding
Initial comprehension duration
PBP2
Method finding
Comprehension phases, avg. share of comprehension
PBP3
Chunks of modeling
Modeling phases, avg. modeling phase size, adding rate, iteration chunk size
PBP4
Avoiding reconciliation
Manual assessment, reconciliation interactions, reconciliation phases, avg. reconciliation phase size, max. reconciliation phase size, avg. number of moves per node
PBP5
Embracing reconciliation
Manual assessment, reconciliation interactions, reconciliation phases, avg. reconciliation phase size, max. reconciliation phase size, avg. number of moves per node
PBP6
Clean–up
Manual assessment
PBP7
Error resolution
Manual assessment, modeling interactions, delete interactions, delete iterations
comprehension duration,
Table 7.18: Overview of PBPs and associated measures The catalog of PBPs describes differences between individual modelers as well as reoccurring behavior observed in M S3 . Table 7.18 lists the identified PBPs and the associated measures. We observed differences regarding the understanding of the problem in terms of the duration it took modelers to start working on the process model (cf. PBP1), and the differences in the number and durations of intermediary phases of inactivity, which are presumably connected to method finding (cf. PBP2).
136
In terms of modeling, we observed differences regarding the number of interactions in modeling phases, but also in the speed of adding elements to the process model, i.e., adding rate. While some modelers made only few changes to the model before interrupting their modeling endeavor for phases of inactivity, others created the process model in larger chunks of modeling (cf. PBP3). Regarding the reconciliation behavior of modelers, we observed different approaches. For some modelers only a limited number of reconciliation operations could be observed. Interestingly, some of the modelers with a low number of reconciliation interactions created visually appealing process models, while others seemed to ignore the possibilities of using the process model’s secondary notation (cf. PBP4). On the contrary, several modelers made extensive use of the process model’s secondary notation. In this context, two strategies could be observed. Some modelers continuously adapted the process model’s layout, while others bundled their reconciliation interactions toward the end of the PPM instance (cf. PBP5). Additionally, we manually identified the validation of process models in terms of inactivity combined with phases of modeling and reconciliation. In modeling phases, problems were resolved while the understandability of the process model was improved in reconciliation phases, e.g., by laying out the process model (cf. PBP6). Finally, we specifically investigated situations where elements were removed from the process model, as this might indicate problems during the creation of the process model (cf. PBP7). Analyzing the interactions with the modeling environment constitutes an interesting aspect for analyzing the PPM since it requires no additional means of analysis, e.g., think aloud or eye movement analysis. This way, it might be exploited for analyzing larger sample sizes and, in the long–term, for building modeling environments adapting to the individual modeler. In future research we intend to combine the interactions with the modeling environment with, e.g., eye movement analysis, to discover additional PBPs (cf. Section 9.5).
7.6.2 RQ3.1 : Which modeler–specific factors influence the occurrence of Process of Process Modeling Behavior Patterns? In M S3 , a first attempt to understand modeler–specific factors influencing the occurrence of PBPs was made. For this purpose, circumstantial factors, the influence of the modeling task and the notational system were controlled by providing all participants with the same notational system and the same modeling task. Therefore, the observed differences might be attributed to modeler–specific factors, i.e., domain knowledge and modeling experience. For instance, we observed that modelers with prior domain knowledge had shorter initial comprehension phases. Further, modelers with more experience using BPMN had less method finding phases. Additionally,
137
PBP
Measure
PBP1 PBP2 PBP3 PBP6 PBP7
Initial comprehension duration Number of comprehension phases Number of modeling phases Manually identified validation phases Number of delete interactions Number of modeling interactions
Modeling experience ◦ ◦ ◦ ◦ ◦
Domain knowledge + ◦ ◦ +
Table 7.19: Influence of modeler–specific factors on PPM measures (◦ small correlation; + medium correlation)
several factors potentially influencing the occurrence of PBPs were suggested. For instance, working memory capacity might influence the number of interactions within a modeling phase. Subsequently, the modeler–specific factors are discussed in more detail. Table 7.19 illustrates the identified influence of modeling experience and domain knowledge on measures associated with PBPs (+ indicates a significant medium correlation, ◦ indicates a significant small correlation; if several significant correlations for the same measure were identified, the strongest correlation is reported). For PBP1, we observed an influence of existing domain knowledge on the duration of the initial comprehension phase. For PBP2 and PBP3 negative correlations with BPMN knowledge in terms of the number of comprehension/modeling phases was observed. The influence of domain knowledge on PBP2 and PBP3 was limited since only one question indicated a significant correlation. We observed a tight connection between PBP2 and PBP3 since similar correlations with domain knowledge and modeling experience were observed. This is consistent with the findings in M S1 , where most method finding phases were followed by the corresponding modeling phase. Interestingly, we noted positive correlations of PBP6 with domain knowledge and modeling experience. We might speculate that the better knowledge allowed them to identify quality issues in the process model. For the number of delete interactions a small negative correlation with modeling experience was identified (cf. PBP7). While such a correlation was to be expected, we anticipated a stronger effect. Therefore, more investigations are in demand to gain a comprehensive understanding of problems arising during the creation of process models (cf. Section 9.5). Regarding reconciliation, no influence of domain knowledge or modeling experience on the respective PBPs was observed. In this context, distinct preferences of modelers on how to create a model in terms of layout and tool usage might play a
138
role. For instance, in PBP5 two different approaches to laying out the process model were observed. Some modelers continuously invested in the process model’s layout, while others improved the process model’s layout toward the end of the PPM instance in larger reconciliation phases. Presumably, this behavior can be traced back to other personal characteristics of modelers. In this chapter, several factors potentially influencing the occurrence of PBPs were mentioned, requiring additional tests. For instance, the influence of working memory capacity, self–regulation, and self–leadership cannot be assessed with the data collected in M S3 . The capacity of working memory can be measured via complex span tasks (cf. [146]). Self–regulation can be measured with the Locomotion–Assessment–Questionnaire [139, 240]. Self– leadership can be measured with the Revised Self–Leadership–Questionnaire [6, 114]. Since developing a cognitive profile of modelers exceeds the focus of this thesis, we refer to future work (cf. Section 9.5). Further, M S3 focused on a single modeling task, controlling task–specific factors. In order to complement the findings of this chapter, M S4 consists of two modeling tasks, which are analyzed using cluster analysis. This way, the influence of task– specific factors can be investigated (cf. Chapter 8).
7.6.3 Limitations of M S3 The results of M S3 have to be interpreted considering a series of limitations (limitations applying to the entire thesis can be found in Section 9.4). First, the investigations in this section rely on the phase detection presented in Section 6.3.1. Therefore, the limitations of the underlying technique have to be considered for M S3 . For instance, the detection of phases is determined by the selected thresholds. The use of different thresholds might result in the identification of different comprehension, modeling, and reconciliation phases. As a result, this might lead to the modelers being assigned to different PBPs. For instance, by increasing the threshold for the detection of comprehension phases, less comprehension phases are identified. For further limitations regarding MPDs, we refer to Section 6.5.3. Second, the influence of the notational system on the existence of PBPs cannot be neglected, i.e., the utilized subset of BPMN and the modeling environment. PBPs might be influenced by providing a specific feature for the modeling environment. For instance, modelers using CEP are required to manually adjust the routing of edges, which might turn into a cumbersome task. A more intelligent algorithm for the routing of edges—or even fully automated layout support—certainly influences the occurrence of PBPs. Further, due to organizational reasons, the participants in M S3 utilized their own laptops for modeling. Therefore, a certain amount of variability regarding the modeling environment exists, e.g., different screen resolutions.
139
Third, some of the analyses presented in this section are subjective. For instance, the identification of combinations of phases of inactivity with modeling and reconciliation phases to identify the validation of the process model (cf. PBP6) was performed manually. While the analysis was performed in several iterations to obtain consistent results, the possibility of errors during the manual analysis remains. Finally, we do not claim that the catalog of PBPs is complete. By considering different phases of the PPM for the discovery of PBPs, we believe that we have been capable of identifying a comprehensive set of PBPs. Still, future investigations should build upon this catalog by contributing additional PBPs. Such PBPs might utilize additional perspectives on the PPM, e.g., using eye movement analysis (cf. Section 9.5).
7.7 Summary This chapter focused on the identification of PBPs within the data collected in M S3 . For this purpose, the think aloud data obtained in M S1 was revisited to gain initial insights into the modelers’ behavior. Then, the data recorded in M S3 was investigated by defining a series of measures to quantify the modelers’ behavior. As a result of this chapter, a catalog of PBPs was obtained, contributing to answer RQ3.1 . Additionally, we considered factors determining the occurrence of PBPs by drawing a connection to the modelers’ demographics, contributing to RQ3.2 . Chapter 8 builds upon the findings of this chapter by investigating distinct modeling styles using cluster analysis. In contrast to this chapter, two modeling tasks are conducted, allowing the investigation of task–specific factors.
140
Chapter 8 Styles in business process modeling The catalog of PBPs described in Chapter 7 constitutes a starting point for understanding the modeler’s behavior when creating process models. Given the fact that we were able to observe different PBPs, i.e., differences in terms of how modelers create process models, the question arises whether this finding can be extended to identify distinct modeling styles. Before beginning the analysis, modeling styles or the term style in general need to be defined. Merriam–Webster defines style as “a particular way in which something is done, created, or performed” 1 . Using the general assumption of this thesis that particular ways of creating a process model manifest in differences regarding the interactions with the modeling environment, we define modeling styles as observable differences regarding the interactions with the modeling environment. In contrast to PBPs, which can be considered a fine–grained analysis of the modeler’s behavior, we assume that a modeling style includes several aspects. For instance, a modeling style might combine different behavior observed during the identification of PBPs (cf. Chapter 7). More specifically, a fast start, i.e., short initial comprehension phase, might be observed together with larger modeling phases, i.e., larger chunk size. Therefore, we define the first research question as follows. RQ2.2 : Can distinct modeling styles be identified? As indicated in Section 1.2, several factors can be expected to influence the PPM, i.e., circumstantial factors, modeler–specific factors, and task–specific factors. In M S3 the influence of modeler–specific factors on the PPM was investigated by correlating the modelers’ demographic data with the PPM measures underlying PBPs and suggesting potential factors that might influence the occurrence of PBPs. The influence of task–specific factors was not considered in M S3 as all participants worked on the same modeling task using the identical modeling environment. To complement 1
http://www.merriam-webster.com
141
the findings of Chapter 7, we intend to investigate the influence of task–specific factors on the PPM by conducting multiple modeling tasks in M S4 . Therefore, the second research question can be formulated as follows. RQ3.2 : How is the Process of Process Modeling influenced by task–specific factors? The remainder of this chapter is structured as follows. Section 8.1 outlines how the research questions are approached. Section 8.2 describes the data collection procedure for M S4 . Section 8.3 presents the identified modeling styles. The influence of the modeling task on the PPM is investigated in Section 8.4. The chapter is concluded with a discussion of the findings and their limitations in Section 8.5 and a brief summary in Section 8.6.
8.1 Research outline Given the lack of an in–depth understanding regarding modeling styles, we follow an explorative approach for RQ2.2 . Rather than addressing a defined set of hypotheses, our aim is to investigate whether distinct modeling styles exist, to explore what distinguishes them from one another, and to discover relations between them. For this purpose, we adopt cluster analysis as it constitutes a viable means for data exploration that can be used for uncovering the structure of data [67]. For conducting the cluster analysis, the modelers’ interactions with the modeling environment are transformed to form a profile for each PPM instance (cf. Section 8.2.6). Then, the obtained PPM profiles are fed to the clusterer in order to derive clusters of distinct modeling styles. This way, we intend to complement the analysis in Chapter 7 by looking at the data from a different angle, since the phase detection algorithm (cf. Section 6.3.1) is not utilized as input for the cluster analysis. This approach allows us to perform method triangulation for answering RQ2 . Next, we compare the identified clusters using the PPM measures developed in Chapter 7 for two purposes: (1) validating whether the identified clusters represent statistically different modeling styles (2) bridging the gap to the catalog of PBPs by characterizing the identified modeling styles in terms of the PPM measures that operationalize PBPs (cf. Chapter 7). As a result, we obtain distinct modeling styles, which are significantly different of each other and can be characterized using PPM measures. In order to address the influence of task–specific factors on the PPM, we approach RQ3.2 from a theoretical perspective. In this context, the influence of the problem– solving task itself should be considered. This influence is described by Cognitive
142
Load Theory (CLT) [260] as cognitive load on the person solving the task. The cognitive load of a task is determined by its intrinsic load, i.e., the inherent difficulty associated with a task and its extraneous load, i.e., the load generated by the task’s representation [178]. Cognitive load is typically operationalized as mental effort [178]. As soon as a mental task, e.g., creating a process model, overstrains the capacity of the modeler’s working memory, errors are likely to occur [260] and may affect how process models are created. Building on CLT, important aspects regarding task–specific factors influencing process model creation can be summarized as follows. (1) Task–intrinsic characteristics the factual properties of the process, which should be represented in a process model (2) Task–extraneous characteristics the presentation of the factual properties of the process, including properties of the modeling environment and the modeling notation In the context of the PPM, the intrinsic load of a modeling task is determined by the model to be created. For this, the model might be characterized by size, e.g., control flow constructs or number of activities, and complexity of the model structure and constructs [70]. Yet, it is independent of the presentation of the modeling task to the modeler. Extraneous load, by contrast, concerns the presentation of the task to the modeler. For instance, in [195], the modeler’s performance was significantly influenced when restructuring the informal task description, even though no changes were made to the intrinsic load of the modeling assignment. Similarly, extraneous load concerns properties of the notational system, i.e., the modeling environment and the notation. This chapter focuses on task–intrinsic factors by asking the participants to complete two modeling tasks, while task extraneous factors, i.e., the notational system, are kept constant for both modeling tasks. This way, conclusions regarding the influence of task–intrinsic factors on the PPM can be drawn. More specifically, we investigate whether modelers are assigned to different clusters for the second modeling task, and try to gain insights into the rationale underlying changes in modeling style. Further, we investigate which PPM measures remain constant over both modeling tasks. If comparable values for PPM measures of an individual modeler can be observed for both modeling tasks, this might indicate that only a limited influence of the modeling task on the respective PPM measure exists. This way, we intend to complement the analysis in Chapter 7 by gaining insights regarding the influence of task–specific factors by performing method triangulation. In particular, we use the PPM measures developed in Chapter 7—where the influence of domain knowledge
143
and modeling experience was investigated—and assess the influence of the modeling task on the respective measures. This way, this chapter contributes to answering RQ3 .
8.2 Data collection In order to perform the cluster analysis on the modelers’ interactions with the modeling environment, M S4 is conducted with 116 students following classes on business process modeling. Subsequently, the modeling session is outlined. More specifically, the targeted subjects and the modeling tasks are described. Further, the execution of M S4 is presented and data validation is performed. Additionally, the data analysis procedure is outlined.
8.2.1 Subjects M S4 intends to investigate the influence of the modeling task on the PPM. For this, the influence of modeler–specific factors should be limited. Further, is desirable that the subjects of M S4 are comparable to the participants of M S3 to support method triangulation regarding RQ3 . Therefore, similar to M S3 , no demands in terms of domain knowledge are imposed since all information required to complete the modeling task is included in the textual description. Cognitive characteristics of modelers are addressed by conducting the modeling session with a large number of participants, assuming that this group represents process modelers in terms of their cognitive abilities, e.g., working memory capacity. Since the modeling tasks are of limited complexity (cf. Section 8.2.2), the targeted subjects need to be only moderately familiar with business process management and imperative process modeling notations. This way, we hope to avoid major problems with the modeling notation, but still encounter challenges during the creation of the process models.
8.2.2 Objects The study was designed to collect PPM instances of students with moderate process modeling skills. One of the key challenges in this context is to balance the difficulty of the modeling task with the knowledge of the participants. If the modeling task is too difficult, drawing conclusions regarding the modelers’ style might be difficult since modelers might be overwhelmed by the complexity of the task. By contrast, if the task is too easy, challenging situations, which constitute a key ingredient of problem solving, cannot be observed.
144
In M S4 , the participants are asked to create a formal process model in BPMN from an informal description with the purpose of documenting the respective processes, i.e., circumstantial factors are the same as for M S3 . The modeling tasks are administered in form of two different textual descriptions, given in the same style with respect to the process to be modeled. In order to assess the influence of task– specific factors, the modeling tasks need to be sufficiently distinct to ensure that the influence of the modeling task materializes. We accommodated for this aspect by considering processes of different domains, sizes, and structures. The notational system, in turn, is kept constant by providing all participants with the identical modeling environment, featuring a limited BPMN syntax and modeling features, i.e., task–extraneous load is minimized. Since M S4 was conducted in class, certain limitations regarding the maximum size of the modeling tasks had to be considered. Both modeling tasks and the associated surveys had to be completed by all participants in a reasonable amount of time. Subsequently, the two modeling tasks are briefly sketched. Task 1: Pre–Flight The first modeling task is a process describing the activities a pilot has to execute prior to taking off an aircraft. The process model consists of 12 activities and contains basic control flow patterns, such as sequence, parallel split, synchronization, exclusive choice, and simple merge [272] (cf. Appendix A.4). Task 2: NFL Draft The second process model describes the process followed by the scouting department of a National Football League (NFL) team to acquire new players through the so–called NFL Draft. The process model was considerably smaller, consisting of 8 activities, still incorporating the basic control flow patterns of sequence, parallel split, synchronization, exclusive choice, simple merge, and structured loop [272] (cf. Appendix A.4).
8.2.3 Instrumentation and data collection CEP’s experimental workflow engine is utilized for handling the data collection in M S4 . An overview of the modeling session’s design is illustrated in Figure 8.1. After entering the code, M S4 starts with a demographic survey, followed by an interactive tutorial explaining the features of the modeling environment. For recording the participants’ demographic data a questionnaire similar to [155] is utilized. This questionnaire includes questions regarding prior modeling experience in general, prior BPMN knowledge, and knowledge on the domains of the modeling tasks. Next, the participants are asked to work on the modeling tasks. Each modeling task is followed by a survey to record the perceived mental effort for the respective modeling task. Mental effort provides a fine–grained measure for the modeler’s performance [315], which can be measured in form of self–rating scales using a seven
145
point Likert scale ranging from Very Low over Medium to Very High. Self–rating scales for mental effort, have been shown to reliably measure mental effort and are thus widely adopted [178]. The modeling session is concluded with a feedback form where participants could suggest potential improvements. Based on a pilot at the University of Innsbruck, minor updates have been applied to CEP’s functionality and the task descriptions. Enter code
Demographic survey
Tutorial
Pre‐Flight modeling task
Mental effort survey
NFL Draft modeling task
Mental effort survey
Feedback
Figure 8.1: Experimental workflow of M S4
8.2.4 Execution of the modeling session Two modeling sessions were conducted in November 2010 with students of a graduate course on Business Process Management at Eindhoven University of Technology and in January 2011 with students from Humboldt–Universit¨at zu Berlin following a similar course. This was done by 103 students in Eindhoven and 13 students in Berlin. By conducting the modeling sessions during class and closely monitoring the students, we mitigated the risk of external distractions. The participating students were not instructed about the research questions to be answered in the exploratory study prior to performing the modeling tasks. No specific time restrictions were imposed on the students even though the duration of the class constituted an upper limit for the duration of M S4 . The participation was voluntary and data collection was performed anonymously.
8.2.5 Data validation First, the recorded data was checked for completeness. Unfortunately, one participant did not complete both modeling tasks and was therefore removed. This resulted in a total of 115 students for data analysis. Next, the demographic data was considered to identify whether the participants fit the targeted profile. Table 8.1 provides an overview of the demographic data. Regarding BPMN knowledge, the participants where asked whether they would consider themselves to be very familiar with BPMN, using a Likert scale with values ranging from Strongly disagree (1) over Neutral (4) to Strongly agree (7). The familiarity with BPMN was slightly below Neutral (M = 3.47, SD = 1.45). For confidence in understanding BPMN models,
146
1. Familiarity Pre–Flight 2. Familiarity NFL Draft 3. 4. 5. 6. 7. 8. 9.
Process modeling expert Process modeling experience Formal training last year Self–education last year Models read last year Models created last year Avg. size of modelsa
10. 11. 12. 13.
Familiarity BPMN Understanding BPMN Modeling BPMN BPMN usagea
Scale
Min
Max
M
SD
1–7 1–7
1 1
7 7
2.41 3.45
1.30 1.91
1–7 years days days models models activities
1 0 0 0 0 0 0
6 6 120 120 250 60 100
3.44 1.89 9.27 8.35 23.46 12.36 14.64
1.34 1.46 19.30 17.12 28.95 12.07 11.32
1–7 1–7 1–7 months
1 1 1 0
6 6 6 72
3.47 4.05 3.65 5.62
1.45 1.49 1.41 10.50
a
One modeler reported an implausible value and was therefore not considered in this overview.
Table 8.1: Demographic data of M S4
the students reported a mean value slightly above Neutral (M = 4.05, SD = 1.49). Finally, for perceived competence in creating BPMN models, a mean value slightly below Neutral was reported (M = 3.65, SD = 1.41). The prior modeling experience is comparable to the participants of M S3 . This way, supporting method triangulation for RQ3 . Summarized, the demographic data regarding modeling experiences suggests that the participants match the targeted profile. Similarly, participants were indicating their familiarity with Pre–Flight processes and the NFL on the same Likert scale (Pre–Flight: M = 2.41, SD = 1.30; NFL Draft: M = 3.45, SD = 1.91). For the NFL Draft modeling task, modelers indicated a slightly higher domain knowledge. Still, for both tasks, the average familiarity is below Neutral, indicating that modelers could hardly rely on prior domain knowledge for performing the task. Similar to modeling experience, the reported familiarity is comparable to M S3 . Finally, we checked the perceived mental effort to see whether notable difference between the two groups can be observed. We observed a lower mental effort for the second modeling task (Pre–Flight: M = 4.01, SD = 1.05; NFL Draft: M = 3.77, SD = 0.97). The differences turned out to be statistically significant (Wilcoxon Signed–Rank Test, Z = −2.54, p = 0.011, r = −0.24), indicating that modelers perceived the second modeling task to be easier than the first one. This is consistent
147
with the smaller size of the second modeling task and probably the higher domain knowledge for the NFL Draft task. This indicates that the two tasks were perceived to be different and, thus, allow for observing the influence of task–intrinsic load.
8.2.6 Data analysis In order to analyze the modelers’ PPM instances, we record all interactions with the modeling environment using CEP (cf. Chapter 5). This way, the interactions with the modeling environment can be utilized for cluster analysis and CEP can be used for replaying PPM instances to gain additional insights. Subsequently, we describe how the recorded interactions with the modeling environment are pre–processed for clustering. Then, the clustering procedure applied in this chapter is described.
Process of Process Modeling profiles for clustering First, a representation of the collected PPM instances suitable for clustering has to be developed. In Chapter 7, we observed considerable differences regarding the addition of content, the removal of content, the reconciliation of the model, and the time of inactivity, i.e., the time when the modeler does not work on the process model. For this, we separate modeling interactions into interactions for adding elements and deleting elements to accommodate for our observation regarding PBP7 that problems during the PPM where frequently indicated by the removal of elements. To reflect that creation of a process model is a time–dependent process, we do not consider the total amount of interactions and the time of inactivity, but rather their distribution over time. Therefore, every PPM instance is sampled into segments of 10 seconds length. For each segment, we compute its profile (a, d, r, c), i.e., the numbers a, d, and r for adding, deleting, and reconciliation interactions, and the time i of inactivity. The PPM profile of a PPM instance is the sequence (a1 , d1 , r1 , i1 )(a2 , d2 , r2 , i2 ) . . . of its segments’ profiles. The values for a, d, and r are obtained per segment by classifying each interaction according to Table 8.2. Adding a condition to an edge was considered being part of creating an edge. The time of inactivity i was computed as follows. First, interactions were grouped to intervals, i.e., sequence of interactions where two consecutive interactions are ≤ 1 second apart. Second, the interval duration was calculated as the time difference between its first and its last interaction (intervals of 1 activity got a duration of 1s). Time of inactivity i is calculated as the length of the segment (10s) minus the duration of all intervals in the segment. For example, if the modeler moved activity A after 3s, activity B after 3.5s and activity C after 4.2s the time of inactivity would be 8.8s.
148
Interaction
Classification
Interaction
Classification
CREATE NODE DELETE NODE CREATE EDGE DELETE EDGE RECONNECT EDGE
Adding Deleting Adding Deleting Adding/Deleting
RENAME ACTIVITY UPDATE CONDITION MOVE NODE MOVE EDGE LABEL MODIFY EDGE BEND POINT
Reconciliation Reconciliation Reconciliation Reconciliation Reconciliation
Table 8.2: Classification of interactions with the modeling environment To give all PPM profiles equal length, we normalized profiles by extending them with segments of no interaction. Performing the cluster analysis The PPM profiles are exported from CEP and subsequently clustered using Weka2 . The KMeans algorithm [150] utilizing an Euclidean distance measure is chosen for clustering as it constitutes a well–known means for cluster analysis. The KMeans algorithm requires the number of clusters to be known a priori. Since this is not the case for our analysis, we start with two expected clusters, gradually increasing the number of expected clusters. Similarly, different values for the seed of the clustering are investigated to minimize the risk of converging in a local minimum [105]. The increase regarding the number of clusters is stopped if no additional clusters of significant size are generated. Since cluster analysis always results in a set of clusters [67], the obtained results need to be validated to ensure the feasibility of the obtained clustering. For this purpose, we use a set of basic measures to describe the identified cluster, i.e., number of adding interactions, number of delete interactions, and the number of reconciliation interactions. In contrast to the PPM profiles, which are used as input for clustering, these basic measures do not include the timing of the respective interactions. Therefore, the basic measures are different from the clustering variables, making them feasible for validating the clustering [67]. Additionally, the PPM measures developed in Chapter 7 are utilized for validating the clustering. These measures rely on the algorithm described in Section 6.3.1. Therefore, the PPM measures are different from the PPM profiles, making them feasible for validating the clustering [67]. As indicated, the validity of the obtained clustering is assessed using a statistical analysis of the differences regarding the basic measures and the PPM measures. For 2
http://www.cs.waikato.ac.nz/ml/weka
149
this purpose, the following procedure is used. If the data is normally distributed and homogeneity of variances is given, oneway ANOVA is used to test for differences among the clusters. If significant differences between the clusters can be identified, tests for pairwise comparisons between the clusters are conducted. When using oneway ANOVA, the pairwise comparisons are conducted using the Tukey HSD post–hoc test. Note that the Tukey HSD post–hoc test uses an adapted significance level. Therefore, p < 0.05 is considered significant, i.e., there is no need to divide the significance level by the number of groups. In case normal distribution or homogeneity of variance is not given, a non–parametric alternative to ANOVA, i.e., Kruskall–Wallis, is utilized to test for differences among the clusters. If normal distribution can be identified, pairwise comparisons are conducted using the t–test for (un)equal variances (depending on the data). If the data is not normally distributed, the Mann–Whitney U–test is used for pairwise comparisons. In either case, i.e., t–test or Mann–Whitney U–test, the Bonferroni correction is applied, i.e., the significance level is divided by the number of clusters. This results in a p–value of, e.g., p < 0.05/3 for pairwise comparisons when assuming the existence of three clusters. The statistical analysis of the data is conducted using SPSS (version 21.0).
8.3 Clustering In order to address RQ2.2 , we investigate the collected PPM instances to identify distinct modeling styles. For this purpose, we apply cluster analysis and analyze whether groups of PPM instances exhibiting similar characteristics can be identified. The identified clusters are visualized and analyzed to determine whether they represent distinct modeling styles. To check whether the identified modeling styles persist over tasks with different characteristics, the cluster analysis is applied to two tasks with different characteristics, i.e., Pre–Flight and NFL Draft. Results of clustering the Pre–Flight task are discussed in Section 8.3.1, while results of clustering the NFL Draft task are presented in Section 8.3.2.
8.3.1 Clustering of the Pre–Flight task For the first modeling task, the result of the cluster analysis are presented. For this, we illustrate the clusters visually, conduct a statistical validation of the clustering, interpret their differences, and report on findings from replaying representative PPM instances using CEP.
150
Clustering result Setting the number of expected clusters to two resulted in one major cluster. For a value of three, we obtained two major clusters and one cluster of two PPM instances. Most promising results were achieved with a number of expected clusters of four and a seed of 10, returning three major clusters and one small cluster of two PPM instances. We considered these three major clusters for further analysis; increasing the number of expected clusters only generated additional small clusters. The three major clusters comprise 42, 22 and 49 instances, called C1, C2, and C3 in the sequel. Cluster visualization In order to visualize the obtained clusters we calculate the average number of adding interactions, the average number of delete interactions, and the average number of reconciliation interactions per segment for each cluster. To obtain a smoother representation, the moving average of six segments is calculated. The results are presented in Figure 8.2 for C1, Figure 8.3 for C2, and Figure 8.4 for C3. The horizontal axis denotes the segments derived by sampling the PPM instances. The vertical axis indicates the average number of interactions that were performed per segment. For example, a value of 0.8 for segment 9 (cf. Figure 8.3) indicates that modelers in C2 averaged 0.8 adding interactions within this 10 second segment. ADDING
DELETING
RECONCILIATION
1.2
Number of interactions
1
0.8
0.6
0.4
0.2
1 5 9 13 17 21 25 29 33 37 41 45 49 53 57 61 65 69 73 77 81 85 89 93 97 101 105 109 113 117 121 125 129 133 137 141 145 149 153 157 161 165 169 173 177 181 185 189 193 197 201 205 209 213 217 221 225 229 233 237 241 245 249 253 257 261
0
Segment
Figure 8.2: Cluster C1 Pre–Flight
C1, as illustrated in Figure 8.2, is characterized by fairly long PPM instances. The first time the adding series reaches 0 is after about 205 segments. Additionally,
151
the delete series indicates a higher number of delete interactions compared to C2 and C3. Further, several larger spikes of reconciliation can be observed, the most prominent one after about 117 segments. ADDING
DELETING
RECONCILIATION
1.2
Number of interactions
1
0.8
0.6
0.4
0.2
1 5 9 13 17 21 25 29 33 37 41 45 49 53 57 61 65 69 73 77 81 85 89 93 97 101 105 109 113 117 121 125 129 133 137 141 145 149 153 157 161 165 169 173 177 181 185 189 193 197 201 205 209 213 217 221 225 229 233 237 241 245 249 253 257 261
0
Segment
Figure 8.3: Cluster C2 Pre–Flight
C2, as illustrated in Figure 8.3, is characterized by a fast start as a peak in adding activity of more than 0.8 is reached after 13 segments. In general, the adding series is mostly between 0.5 and 0.9 interactions, numbers which are rarely reached by C1 and C3. The delete series is considerable lower compared to C1. The reconciliation series is characterized by spikes of reconciliation, which are smaller compared to C1. The fast modeling results in short PPM instances as the adding series is 0 for the first timer after about 110 segments. At first sight, C3 (cf. Figure 8.4) seems to be situated between C1 and C2. The adding series is mostly between 0.4 and 0.7, lower compared to C2, but still higher compared to C1. Similar values can be observed for the reconciliation series, which does not show major spikes in reconciliation behavior. The delete series remains below 0.1. The duration of the PPM instances is also between the duration of C1 and C2 as the adding series is 0 for the first time after about 137 segments.
Cluster validation This section focuses on investigating the differences between the clusters in terms of the basic measures, e.g., number of adding interactions, and the PPM measures
152
ADDING
DELETING
RECONCILIATION
1.2
Number of interactions
1
0.8
0.6
0.4
0.2
1 5 9 13 17 21 25 29 33 37 41 45 49 53 57 61 65 69 73 77 81 85 89 93 97 101 105 109 113 117 121 125 129 133 137 141 145 149 153 157 161 165 169 173 177 181 185 189 193 197 201 205 209 213 217 221 225 229 233 237 241 245 249 253 257 261
0
Segment
Figure 8.4: Cluster C3 Pre–Flight
described in Chapter 7. This way, the obtained clustering is validated and insights into the characteristics of the modeling styles are generated. Basic measures Table 8.3 presents the basic measures, i.e., the number of adding interactions, the number of delete interactions, and the number of reconciliation interactions for each cluster. In case the data is normally distributed, mean and standard deviation are reported; otherwise the median is reported. Tests for normal distribution can be found in Appendix B.3.1. Modelers in C1 carried out more adding and deleting interactions and, most notable, almost twice as many reconciliation interactions compared to C2 and C3. The numbers for C2 and C3 appear to be similar. As shown in Table 8.4, we observe significant differences between C1 and C2 and C1 and C3, but not between C2 and C3. The tables for statistical tests in this chapter include only p–values of tests indicating significant differences. Details regarding the statistical tests to distinguish between clusters can be obtained from Appendix B.3.2. PPM measures Further, we investigate differences between the clusters in terms of the PPM measures described in Chapter 7. Table 8.5 and Table 8.6 provide an overview of the obtained values. As indicated in Figure 8.2, C1 constitutes the highest number of PPM iterations.
153
Measure
Scale
Cluster
N
Min
Max
M
SD
Adding
interactions
C1 C2 C3
42 22 49
41 43 33
97 70 81
61.36 52.91 52.57
11.22 7.05 8.77
Deleting
interactions
C1 C2 C3
42 22 49
0 0 0
31 12 17
10.81 7.39 M dn = 3.50 M dn = 3.00
Reconciliation
interactions
C1 C2 C3
42 22 49
13 10 7
252 88 88
M dn = 66.00 42.00 25.06 39.27 17.12
Table 8.3: Basic measures Pre–Flight
When considering the measures to quantify the inactivity of modelers, the lowest number of comprehension phases can be observed for C2. The highest number of comprehension phases can be observed for C1, while C3 is situated in between. Interestingly, C2 has also the shortest average comprehension duration. This indicates that modelers in C2 did not only stop their modeling endeavor less frequently, but also for shorter phases of inactivity. C1 has the highest average comprehension duration, while C3 is in between. As a result, share of comprehension is larger for C1 compared to C2, which has the lowest share of comprehension, but also larger compared to C3. Further, the initial comprehension duration is considerably lower for C2. This underlines the fast start that was observed in Figure 8.3. Tightly connected to the lower number of PPM iterations of C2 are measures associated with modeling, i.e., number of modeling phases, average modeling phase size, and iteration chunk size. Modelers in C2 have the lowest number of modeling phases with the highest number of elements added per modeling phase. Similarly, iteration chunk size posts the highest value for C2. C1 and C3 draw a similar picture as for comprehension statistics as C1 is on the opposite end of the spectrum compared to C2, whereas C3 is situated in between. Similarly, C2 sets itself apart in terms of adding rate, indicating that modelers in C2 were faster in adding elements to the process model. This indicates that modelers in C2 added more content faster to the process model. In terms of reconciliation measures, i.e., number of reconciliation phases, average reconciliation phase size, maximum reconciliation phase size, and average number of moves per node, C1 sets itself apart. We observe almost twice as many reconciliation phases for C1 compared to the other clusters. Similarly, the largest reconciliation
154
Measure
All groups
Pairwise comparison 1–2
Adding interactions
Delete interactions
Reconciliation interactions
a
p < 0.05
b
a
1–3 a
Sig. 0.000
0.003
test Oneway ANOVA
Tukey HSD
Sig. 0.000a
0.000b
test Kruskall–Wallis
Mann–Whitney
a
0.000
2–3 a
0.000b
Sig. 0.000
0.001b
0.000b
test Kruskall–Wallis
Mann–Whitney
p < 0.05/3
Table 8.4: Significant differences for basic measures Pre–Flight
phases are observed for C1. This is consistent with the previous observations using the cluster visualizations and the basic measures in Table 8.4. Finally, we investigate the removal of elements. Therefore, the number of iterations containing delete interactions is considered, which is higher for C1 than for the other clusters showing similar values. This was also observed in the cluster visualization of Figure 8.2. The results of the statistical analysis of the differences between the groups are presented in Table 8.7. In contrast to the statistics presented in Table 8.4, significant differences between C2 and C3 can be identified. The differences in terms of PPM iterations, number of comprehension phases, average comprehension duration, share of comprehension, number of modeling phases, and iteration chunk size are significant for all pairwise comparisons. C2 is indeed significantly different compared to C1 and C3 in terms of initial comprehension duration, average modeling phase size, and adding rate. In terms of reconciliation measures, i.e., number of reconciliation phases, maximum reconciliation phase size, and average number of moves per node, the statistical analysis confirms the observation that C1 sets itself apart compared to the C2 and C3. No differences were observed in terms of reconciliation behavior between C2 and C3. No significant differences could be identified in terms of average reconciliation phase size. Finally, the difference between C1 and C3 for delete iterations is significant. The difference between C1 and C2 for delete iterations is barely not significant (U = 294.00, p = 0.017, r = −0.30) due to the Bonferroni correction.
155
Measure
Scale
Cluster
N
Min
Max
M
SD
PPM iterations
iterations
C1 C2 C3
42 22 49
12 7 10
34 17 19
20.95 12.23 14.51
4.78 3.18 2.43
Initial comprehension duration
mm:ss
C1 C2 C3
42 22 49
00:35 00:27 00:33
08:49 02:25 08:36
Comprehension phases
phases
C1 C2 C3
42 22 49
10 4 7
24 15 15
Avg. comprehension duration
mm:ss
C1 C2 C3
42 22 49
00:24 00:22 00:22
01:42 00:58 01:36
M dn = 00:45 00:33 00:09 M dn = 00:39
Share of comprehension
%
C1 C2 C3
42 22 49
27.19 23.68 25.52
68.43 49.89 73.98
49.83 39.12 45.14
Modeling phases
phases
C1 C2 C3
42 22 49
10 6 9
26 14 18
17.43 4.13 M dn = 11.00 M dn = 13.00
Avg. modeling phase size
interactions
C1 C2 C3
42 22 49
3.23 4.36 3.44
8.79 12.83 9.10
4.93 1.14 M dn = 6.16 M dn = 5.08
Iteration chunk size
interactions
C1 C2 C3
42 22 49
2.74 3.12 2.84
5.30 10.14 6.31
3.76 0.65 M dn = 5.05 M dn = 4.27
Adding rate
interactions
C1 C2 C3
42 22 49
0.080 0.080 0.060
0.150 0.240 0.180
M dn = 0.110 0.148 0.034 0.119 0.025
M dn = 01:51 01:13 00:32 M dn = 02:15 15.83 8.64 11.45
3.87 3.00 2.37
10.24 7.60 8.90
Table 8.5: Comprehension and modeling PPM measures Pre–Flight Interpretation of clusters Our results indicate that C1 can be distinguished from C2 and C3. Modelers in C1 had rather long PPM instances, e.g., number of PPM iterations, spent more time on comprehension, and showed a high amount of delete interactions and reconciliation interactions. Interestingly, the high number of reconciliation interactions cannot be traced back to the average size of reconciliation phases since no significant differences
156
Measure
Scale
Cluster
N
Min
Max
M
SD
Reconciliation phases
phases
C1 C2 C3
42 22 49
3 3 2
20 14 12
10.38 4.14 6.55 2.91 M dn = 6.00
Avg. reconciliation phase size
interactions
C1 C2 C3
42 22 49
3.00 1.40 1.33
26.40 12.00 14.17
M dn = 5.63 5.79 2.31 M dn = 4.71
Max. reconciliation phase size
interactions
C1 C2 C3
42 22 49
4 2 2
103 47 42
M dn = 15.00 M dn = 13.00 M dn = 11.00
Avg. number of moves per node
interactions
C1 C2 C3
42 22 49
0.24 0.35 0.25
6.81 3.95 3.71
M dn = 1.99 1.44 0.97 1.20 0.71
Delete iterations
%
C1 C2 C3
42 22 49
0.00 0.00 0.00
36.36 30.00 31.58
17.49 10.52 M dn = 9.17 M dn = 8.33
Table 8.6: Reconciliation and delete PPM measures Pre–Flight
could be identified. On the contrary, modelers in C1 had at least one significantly larger reconciliation phase compared to C3. This indicates phases of extensive layouting in the PPM instances, which might have been caused by difficulties when creating the process model. The high number of reconciliation interactions in C1 seems to be caused by a combination of longer PPM instances and phases of extensive layouting. This finding might be related to PBP5.b, where PPM instances contained larger phases of reconciliation toward the end of the PPM instances. Summarizing the findings, the data suggests that modelers who were assigned to C1 were less goal–oriented compared to their colleagues in other clusters, since more time was spent without interacting with the modeling environment. Further, they added more modeling elements, which were subsequently removed, and more effort was put into improving the process model’s visual appearance. Focusing on C2, we observe a very steep start regarding the adding series in Figure 8.3, indicating that modelers started creating the process model right away. This is supported by initial comprehension duration, indicating significant differences compared to C1 and C3. The PPM measures further indicate a low number of modeling phases associated with a high average modeling phase size, high chunk sizes, and high adding rate, a low number of PPM iterations, and little time of
157
Measure
All groups
Pairwise comparison 1–2
PPM iterations
Sig. 0.000
a
0.000
1–3 b
2–3 b
0.000
0.001b
test Kruskall–Wallis
(un)equal variances t–test
Initial comprehension
Sig. 0.000a
0.001b
duration
test Kruskall–Wallis
Mann–Whitney
Comprehension phases
Sig. 0.000
a
test Kruskall–Wallis a
0.000b
0.000b 0.000b
(un)equal variances t–test 0.000b
0.015b
Avg. comprehension
Sig. 0.000
duration
test Kruskall–Wallis
Mann–Whitney
Share of comprehension
Sig. 0.000a
0.000a
test Oneway ANOVA
Tukey HSD
Modeling phases
Sig. 0.000
a
test Kruskall–Wallis Avg. modeling phase size
Iteration chunk size
Adding rate
Reconciliation phases
Sig. 0.000
a
0.000b
0.044a 0.000b
0.000b
Sig. 0.000a
0.000b
test Kruskall–Wallis
Mann–Whitney
Sig. 0.000a
0.000b
test Kruskall–Wallis
Mann–Whitney
test Kruskall–Wallis
0.000b
0.001b
Mann–Whitney
phase size
test Kruskall–Wallis
Mann–Whitney
Avg. number of moves
Sig. 0.000a
0.008b
per node
test Kruskall–Wallis
Mann–Whitney
Sig. 0.007
test Kruskall–Wallis a
p < 0.05
b
0.002b
0.000b
Sig. 0.014a
Delete iterations
0.001b
0.001b
Max. reconciliation
a
0.032a
0.001b
Mann–Whitney
Sig. 0.000
0.002b
Mann–Whitney
test Kruskall–Wallis
a
0.001b
0.005b
0.017
0.000b 0.004b
Mann–Whitney
p < 0.05/3
Table 8.7: Significant differences for PPM measures Pre–Flight
158
inactivity. Thus, modelers of C2 appear to be focused and goal–oriented when creating the process model. They are quick in making decisions about how to proceed and only slow down from time to time for some reconciliation. The PPM instances of C3 are shorter compared to C1 and longer compared to C2. The reconciliation series in Figure 8.4 is close to the adding series. Notably, there is no reconciliation spike once the adding series decreases. Albeit close to C2, C3 is characterized by slower and more balanced model creation, e.g., smaller chunk size, higher number of PPM iterations, more inactivity. Thus, C3 follows a rather structured approach to modeling, working slower compared to C2, e.g., initial comprehension duration, average comprehension duration, and adding rate.
Analysis of cluster representatives In order to gain further insights regarding the differences between the three clusters, we manually compare representative PPM instances. Clustering with K–Means yields cluster centroids, the mean for adding interactions, delete interactions, reconciliation interactions, and the time of inactivity over all PPM profiles inside a cluster. For each cluster, we have chosen the PPM instance with the smallest distance to this centroid as a representative and compared them using the replay feature of CEP (cf. Chapter 5). Then, we repeat the procedure with the PPM instances showing the second–smallest distance to the cluster centroids. The representative for C1 is very volatile in terms of speed and locality of modeling. Adding elements is done in an unsteady way with intermediate layouting, conducted in short phases. This might be compared to PBP5.a. The aspect of locality relates primarily to reconciliation. The modeler frequently touched not only the last elements added, but also distant parts of the process model. These observations are largely confirmed by the second representative for C1, which further shows long reconciliation phases to gain space on the canvas. The representative for C2 follows a rather straight, steady, and quick modeling approach. A group of elements is placed first and only later connected by edges. There is little reconciliation since the layout appears to be considered when adding elements, similar to PBP4.b (cf. Chapter 7). If applied, reconciliation refers to the last added elements only. The second representative follows the same approach until two thirds of the model have been created. Then, it deviates by re–layouting the model to gain space on the canvas. For C3, the representative PPM instance is also steady, but slower than those investigated for C2. At most two elements are added at a time before they get connected. Reconciliation is done continuously, but restricted locally, comparable
159
to PBP5.a. Model parts that are distant from the last added elements are not changed. These observations are confirmed by the second representative. In essence, the representatives of the clusters appear to be distinguished by two aspects in particular, the steadiness of the PPM instance in terms of adding elements and the characteristics of the reconciliation phases. The latter are characterized by their length and their locality.
8.3.2 Clustering of the NFL Draft task To test whether the identified clusters persist over different modeling task, we repeat the cluster analysis procedure for the second modeling task.
Clustering results Again, we conduct the cluster analysis by gradually increasing the number of expected clusters and investigating different seeds. The most promising results are obtained with a seed of 30 and 5 expected clusters, resulting in three major cluster of 30, 31 and 42 PPM instances. Two smaller clusters, consisting of 4 and 8 PPM instances, are not further considered. Adding
Deleting
Reconciliation
1.2
Number of interactions
1
0.8
0.6
0.4
0.2
Segment
Figure 8.5: Cluster C1 NFL Draft
160
217 221
209 213
201 205
193 197
185 189
177 181
169 173
161 165
157
149 153
141 145
133 137
125 129
117 121
109 113
93 97
101 105
89
81 85
73 77
65 69
57 61
49 53
41 45
33 37
29
21 25
5 9
13 17
1
0
Adding
Deleting
Reconciliation
1.2
Number of interactions
1
0.8
0.6
0.4
0.2
217 221
213
205 209
197 201
189 193
181 185
173 177
165 169
157 161
149 153
145
137 141
129 133
121 125
113 117
105 109
97 101
89 93
85
77 81
69 73
61 65
53 57
45 49
37 41
29 33
21 25
17
9 13
1 5
0
Segment
Figure 8.6: Cluster C2 NFL Draft
Cluster visualization Figure 8.5 pictures Cluster C1, which is characterized by long PPM instances, exhibiting a slow start. Further elements are added to the process model at a rather low rate. The adding series is closely followed by the reconciliation series. The reconciliation series shows several spikes of reconciliation and much reconciliation after the adding series starts to decrease. The deleting series is generally higher compared to the other clusters. Cluster C2, as illustrated in Figure 8.6, contains short PPM instances where elements are quickly added to the process model. The adding series in C2 starts to decrease after 60 segments before reaching 0 after 77 segments. The PPM instances in C2 start with a steep increase in the adding series. The reconciliation series follows the adding series with some additional reconciliation at the end. The deleting series seems to be rather low. Cluster C3 (cf. Figure 8.7) seems to be situated between C1 and C2. C3 does not exhibit the fast start of cluster C2, but shares similarities in terms of the deleting series. The PPM instances in C3 are considerably shorter than those in C1, but not as short as in C2. Modelers in C3 show a rather slow start. After 10 segments, the adding series is close to 0.2, which is similar to C1, but not to C2. Afterwards, C3 outperforms C1 in terms adding elements to the process model. The reconciliation series follows the adding series without any major spikes in reconciliation activity.
161
Adding
Deleting
Reconciliation
1.2
Number of interactions
1
0.8
0.6
0.4
0.2
217 221
209 213
201 205
197
189 193
181 185
173 177
165 169
157 161
149 153
141 145
137
129 133
121 125
113 117
105 109
97 101
89 93
81 85
73 77
69
61 65
53 57
45 49
37 41
29 33
21 25
5 9
13 17
1
0
Segment
Figure 8.7: Cluster C3 NFL Draft
Cluster validation In order to validate the clustering and for gaining insights into the characteristics of the modeling styles, we investigate differences in terms of the basic measures and the PPM measures. Basic measures The number of adding interactions, the number of delete interactions, and the number of reconciliation interactions are presented in Table 8.8. As for the first modeling task, C2 and C3 exhibit similar values while C1 sets itself apart in terms of adding interactions, delete interactions, and reconciliation interactions. The statistical analysis illustrated in Table 8.9 supports this observation by indicating significant differences between C1 and C2 and C1 and C3, but not between C2 and C3. PPM measures The result of applying the PPM measures are presented in Table 8.10 and Table 8.11. The three clusters seem to be different when it comes to the number of PPM iterations. In this context, C2 has the lowest number of PPM iterations. C1 is on the opposite side of the spectrum posting the highest number of PPM iterations. In terms of comprehension measures, C2 has the shortest initial comprehension phase. When considering the differences between C1 and C3, we also observe a considerable gap in terms of initial comprehension duration. Regarding the number
162
Measure
Scale
Cluster
N
Min
Max
M
Adding
interactions
C1 C2 C3
31 30 42
28 30 27
62 55 61
45.39 8.22 M dn = 37.00 M dn = 37.50
Deleting
interactions
C1 C2 C3
31 30 42
1 0 0
17 8 16
M dn = 4.00 M dn = 2.00 M dn = 2.00
Reconciliation
interactions
C1 C2 C3
31 30 42
10 1 2
103 64 71
49.94 25.73 27.17
SD
24.16 15.68 16.59
Table 8.8: Basic measures NFL Draft
of comprehension phases a similar picture to the Pre–Flight task is drawn as C2 has the lowest number of comprehension phases. In contrast to the Pre–Flight task, the average comprehension duration is similar for all three clusters. Still, C2 has the lowest average duration of comprehension phases. This also affects share of comprehension, which is similar for all clusters, even though C2 still shows the lowest share of comprehension. When considering the measures quantifying modeling, we observe a familiar picture as the number of modeling phases for C2 is lower compared to the other two clusters. In this context, C1 has the highest number of modeling phases. The values for average modeling phase size and iteration chunk size are slightly higher compared to the Pre–Flight task for clusters C1 and C2. For C3 only iteration chunks size is slightly increased. This might be connected to the lower perceived mental effort of the modelers. The differences between the clusters in terms of iterations chunk size are comparable to the Pre–Flight task, i.e., C2 has the highest value. For average modeling phase size C2 has the highest value while C3 posts a slightly lower value compared to C1. In terms of adding rate similar values compared to the Pre–Flight task are observed, i.e., C2 has the highest adding rate. C3 seems to be between C1 and C2, a familiar picture throughout the data analysis. In terms of the reconciliation measures, similarities can be identified to the Pre– Flight task, even though the differences between clusters are smaller, which might be caused by the smaller modeling task. Still, C1 posts the highest values for most reconciliation statistics. Finally, the values for delete iterations do not indicate any major differences between the clusters. The corresponding statistical analysis is illustrated in Table 8.12, revealing signifi-
163
Statistic
All groups
Pairwise comparison 1–2
Adding interactions
Delete interactions
Reconciliation interactions
a
p < 0.05
b
a
1–3 b
Sig. 0.000
0.000
test Kruskall–Wallis
Mann–Whitney
Sig. 0.003a
0.002b
test Kruskall–Wallis
Mann–Whitney
a
0.000
2–3 b
0.005b
Sig. 0.000
0.000a
0.000a
test Oneway ANOVA
Tukey HSD
p < 0.05/3
Table 8.9: Significant differences for basic measures NFL Draft
cant differences among all clusters in terms of the number of PPM iterations, number of comprehension phases, number of modeling phases, and adding rate. Similarly, chunk size is significantly different when comparing C1 and C2 and when comparing C2 and C3. For initial comprehension duration, the results for the first modeling task are replicated. C2 is significantly different compared to C1 and C3. The difference observed for initial comprehension duration between C1 and C3 are not statistically significant. For average modeling phase size, the difference between C1 and C2 is significant. For average reconciliation phase size, maximum reconciliation phase size, and the number of reconciliation phases, the results of the Pre–Flight task are replicated. For average comprehension duration, the differences turned out to be not significant due to the Bonferroni correction. No statistical significant differences could be identified in terms of share of comprehension, the number of moves per node, and delete iterations.
Interpretation of clusters Similar to the clusters identified for the Pre–Flight task, C1 can be distinguished from C2 and C3 in terms of the number of adding interactions, the number of delete interactions, the number of reconciliation interactions, number of comprehension phases, number of modeling phases, adding rate, number of reconciliation phases, and the number of PPM iterations. However, other measures showed smaller differences compared to the Pre–Flight task, resulting in non–significant differences, e.g., share of comprehension. Summarized, modelers in C1 seem to be less goal–
164
Scale
Cluster
N
Min
Max
M
SD
PPM iterations
iterations
C1 C2 C3
31 30 42
7 4 5
28 14 16
Initial comprehension duration
mm:ss
C1 C2 C3
31 30 42
00:35 00:23 00:32
08:04 02:21 04:40
Comprehension phases
phases
C1 C2 C3
31 30 42
5 3 4
22 10 13
10.87 3.13 M dn = 6.00 8.60 2.40
Avg. comprehension duration
mm:ss
C1 C2 C3
31 30 42
00:17 00:18 00:19
00:57 00:42 01:00
M dn = 00:32 00:29 00:07 M dn = 00:32
Share of comprehension
%
C1 C2 C3
31 30 42
18.64 20.04 21.30
58.38 55.56 68.03
39.84 37.06 42.72
Modeling phases
phases
C1 C2 C3
31 30 42
5 4 3
22 12 14
10.87 3.13 7.50 2.13 M dn = 9.00
Avg. modeling phase size
interactions
C1 C2 C3
31 30 42
3.47 3.58 2.64
11.25 12.20 12.67
5.31 1.66 6.71 2.32 M dn = 5.05
Iteration chunk size
interactions
C1 C2 C3
31 30 42
2.56 3.18 2.45
6.00 10.25 9.00
4.10 5.51 4.51
Adding rate
interactions
C1 C2 C3
31 30 42
0.080 0.110 0.080
0.150 0.270 0.220
14.48 4.27 8.53 2.58 M dn = 10.00 02:40 01:12 02:08
01:59 00:34 01:09
10.06 8.12 10.59
0.96 1.81 1.42
0.111 0.021 M dn = 0.150 M dn = 0.130
Table 8.10: Comprehension and modeling PPM measures NFL Draft
oriented, applying a higher number of adding interactions and delete interactions and spending more time on reconciliation. As for cluster C2, we do obtain significant differences compared to C3 for the number of PPM iterations, initial comprehension duration, number of comprehension phases, number of modeling phases, iteration chunk size, and adding rate. The significant differences in terms of adding rate indicate that adding of elements is
165
Scale
Cluster
N
Min
Max
M
SD
Reconciliation phases
phases
C1 C2 C3
31 30 42
3 0 0
17 12 10
8.45 3.52 4.50 2.30 M dn = 4.00
Avg. reconciliation phase size
interactions
C1 C2 C3
31 29 41
2.30 2.00 1.00
16.67 11.67 26.67
M dn = 5.33 5.15 2.54 M dn = 3.89
Max. reconciliation phase size
interactions
C1 C2 C3
31 29 41
4 2 1
33 29 63
M dn = 11.00 M dn = 8.00 M dn = 7.00
Avg. number of moves per node
interactions
C1 C2 C3
31 30 42
0.11 0.00 0.12
4.00 2.87 3.93
1.45 1.02 0.97 0.69 M dn = 0.83
Delete iterations
%
C1 C2 C3
31 30 42
0.00 0.00 0.00
36.36 40.00 42.86
M dn = 11.11 M dn = 10.56 M dn = 8.01
Table 8.11: Reconciliation and delete PPM measures NFL Draft done differently not only in absolute terms, but also relative over time. Modelers in C2 seem to be faster in adding elements since they added more content in shorter modeling phases. Also, they started faster with adding content since the initial comprehension phases were significantly shorter compared to C1 and C3. This is in line with the first modeling task and suggests that modelers in C2 were focused on executing the modeling task in a quick and goal–oriented manner. The PPM instances in C3 are longer compared to C2, but not as long as the PPM instance in C1. In contrast to C2, modelers in C3 start slower, and add content in smaller chunks. Modelers in C3 do not share the high number of reconciliation interactions and the high number of delete interactions with C1. The overall picture drawn for C3 is similar to the Pre–Flight task. Thus, modelers in C3 can be seen as following a balanced modeling approach that is situated between the other two clusters. Analysis of cluster representatives Analyzing the representative PPM instance for C1 showed that PPM instance in C1 are structured by phases in which a certain model part is added and phases in which parts of a model are reconciled. We observed long phases of layouting that mainly
166
Measure
All groups
Pairwise comparison 1–2
PPM iterations
Sig. 0.000
a
0.000
1–3 b
2–3 b
0.000
0.003b
test Kruskall–Wallis
Mann–Whitney
Initial comprehension
Sig. 0.000a
0.000b
duration
test Kruskall–Wallis
(un)equal variances t–test
Comprehension phases
Sig. 0.030
a
test Kruskall–Wallis a
0.000b
0.000b 0.001b
Mann–Whitney
Avg. comprehension
Sig. 0.032
duration
test Kruskall–Wallis
Mann–Whitney
Modeling phases
Sig. 0.000a
0.000b
test Kruskall–Wallis
Mann–Whitney
Avg. modeling phase size
Sig. 0.030
a
test Kruskall–Wallis Iteration chunk size
Adding rate
Reconciliation phases
Sig. 0.003
a
0.002b
0.003b
0.010b Mann–Whitney 0.000b
0.011b
Sig. 0.000a
0.000b
test Kruskall–Wallis
Mann–Whitney
Sig. 0.000a
0.000b
test Kruskall–Wallis
Mann–Whitney
a
phase size
test Kruskall–Wallis b
0.019
(un)equal variances t–test
Sig. 0.004
p < 0.05
0.025
test Kruskall–Wallis
Max. reconciliation
a
0.000b
0.015b
0.016b
0.000b 0.001b
Mann–Whitney
p < 0.05/3
Table 8.12: Significant differences for PPM measures NFL Draft
relate to edges. Also, at the end, the model is refactored and the process model’s layout is improved, comparable to PBP5.b. Long adding and reconciliation phases are also visible in the second representative. The representative for C2 showed a very quick model creation. Also, the process was steady and the rate of adding elements appears to be constant. The PPM instance features only sparse reconciliation. Reconciliation seems to be avoided by
167
considering the model layout when adding an element. As for the Pre–Flight task, this seems to be comparable to PBP4.b. If applied, layouting focuses on the elements last added. It seems that the faster modeling of C2 is partly achieved by placing elements at strategic locations on the modeling canvas to alleviate them form the need for additional reconciliation. The second representative for C2 shows very similar characteristics. The only difference is that large sets of elements are added before they get connected. For C3, the representative PPM instance follows a steady approach, but slower than the one for cluster C2. Also, reconciliation is more prominent than for C2, whereas the reconciliation phases are shorter than observed for C1. Further, reconciliation relates to a rather large area of the modeling canvas. The second representative follows the same approach. The observations for the cluster representative for the NFL Draft task are largely in line with those obtained for cluster representatives for the Pre–Flight task. Conclusion In sum, we were able to identify three clusters representing distinct modeling styles for each modeling task. The differences between the clusters were validated using a statistical analysis on the basic measures, e.g., the number of delete interactions, but also by relying on the PPM measures introduced in Chapter 7. The cluster characteristics were similar in terms of number of adding interactions, the number of delete interactions, and the number of reconciliation interactions for the two modeling tasks. Differences between all clusters regarding the number of PPM iterations, the number of comprehension phases, and the number of modeling phases were identified and consistent over both modeling tasks. Summarized, we have been able to identify three distinct modeling styles exhibiting significantly different characteristics. This way, the identification of distinct modeling styles contributes to answering RQ2.2 .
8.4 Factors influencing modeling style In order to address RQ3.2 , i.e., to complement the analysis on modeler–specific factors (cf. Chapter 7) by understanding how the PPM is influenced by the modeling task, we first investigate the movement of modelers between different clusters over both modeling tasks (cf. Section 8.4.1). For this purpose, we investigate the described measures in connection with the cluster assignment over both modeling tasks. Second, we look at correlations of measures between the two modeling tasks to assess the influence of the task on the respective measures (cf. Section 8.4.2).
168
Modelers in cluster Pre–Flight Modelers in same cluster NFL Draft Modelers in same cluster [%]
C1
C2
C3
Overall
38 13 34.21%
20 10 50.00%
43 20 46.51%
101 43 42.57%
Table 8.13: Modelers in the same cluster If a measure correlates between two tasks, we conclude that the influence of the modeling task was limited, i.e., the modeler’s behavior can be observed irrespective of the modeling task.
8.4.1 Cluster movement When clustering the Pre–Flight task and the NFL Draft task, we obtained clusters with similar properties. Therefore, the question arises whether modelers in a specific cluster for the Pre–Flight task can be found in the corresponding cluster for the NFL Draft task. If the modeler’s style is entirely dependent on the modeler’s personal preferences without any influence of the modeling task at hand, all modelers would be assigned to the same cluster for both modeling tasks. Table 8.13 illustrates the number of modelers who stayed in the same cluster, e.g., 50.00% of the modelers who were in C2 for the Pre–Flight task were also in C2 for the NFL Draft task3 . Overall, 42.57% of the modelers remained in the same cluster. This points toward a combination of modeler–specific and task–specific factors influencing the modelers’ style. For instance, a modeler who experienced difficulties during the first modeling task might have been assigned to C1 due to an increased number of delete interactions and a longer PPM instance. For the second modeling task, the same modeler might not face similar difficulties, resulting in a shorter PPM instance with a lower number of delete interactions. Therefore, the modeler might be assigned to a different cluster. Figure 8.8 illustrates the movement of modelers among the clusters. Modelers tended to move toward C2 for the second modeling task, which gained 19 additional modelers and lost only 10. On the contrary, C1 lost 25 modelers and gained only 18 additional modelers. For C3, the number of gained and lost modelers is similar, i.e., 21 gained; 23 lost. This could indicate that less modelers had problems with the NFL Draft task, which would be consistent with the modelers’ perceived mental effort (Pre–Flight: M = 4.01, SD = 1.05; NFL Draft: M = 3.77, SD = 0.97) 3
Modelers who were assigned to a clusters that was ignored for further analysis were also ignored for analyzing cluster movements.
169
and with our finding that no significant differences between the clusters could be identified in terms of share of comprehension and delete iterations for the NFL Draft task. C1
15
4
10
14
C2
9 6
C3
Figure 8.8: Cluster movement
Going back to the PPM measures described in Chapter 7, we further investigate cluster movements. The individual groups for cluster movement are relatively small, e.g., only 4 modelers moved from C2 in the Pre–Flight task to C1 in the NFL Draft task, making a detailed analysis difficult. Hence, we aggregate modelers into groups described in the sequel for analyzing cluster movement. The analysis indicated the following characteristics for the clusters. • Cluster C1 more reconciliation / slower modeling • Cluster C2 less reconciliation / faster modeling • Cluster C3 less reconciliation / slower modeling We observed the largest differences in terms of PPM measures between C1 and C2. Therefore, it might be assumed that C1 and C2 are located toward the ends of a spectrum of modeling styles. C3, in turn, can be situated in between. Based on this assumption, the following aggregation of cluster movements can be performed. • Toward less reconciliation / faster modeling Modelers changing their modeling style toward faster modeling, i.e., C1 to C2, C1 to C3 and C3 to C2, were considered in this group. This group contains modelers who spent less time on reconciliation and might have experienced less difficulties in the second modeling task. • Toward more reconciliation / slower modeling This group contains modelers who slowed down their modeling endeavor during the second modeling task, i.e., C2 to C1, C2 to C3 and C3 to C1. Modelers in this group spent more
170
time on reconciliation. Some of them might have experienced more difficulties in the second task. • Same This groups contains modelers who were in the same cluster for both tasks. For each modeler, we calculate the difference between the Pre–Flight task and the NFL Draft task for each measure. Table 8.14 displays the average values for each measures. Negative values indicate that the results for this measure decreased compared to the first modeling task. For example, we have established significant differences for the number of PPM iterations among all three groups in Section 8.3 with C2 posting the lowest values and C1 the highest, creating a spectrum of modeling styles in terms of PPM iterations. The aggregated cluster movement supports this impression, since modelers who moved toward less reconciliation / faster modeling showed an average decrease of 9.91 PPM iterations. On the contrary, modelers moving toward more reconciliation / slower modeling had only a mild average decrease of 0.46 PPM iterations (the NFL Draft modeling task was considerably smaller making a decrease in the number of PPM iterations likely). Similar observations can be made for the number of comprehension phases, the number of modeling phases and the number of reconciliation phases. This way, the measures in Table 8.14 draw a consistent picture of cluster movement. Modelers who moved toward less reconciliation / faster modeling needed less adding interactions in a smaller number PPM iterations to create the process model in larger chunks. The number of reconciliation interactions is even higher when modelers moved toward more reconciliation / slower modeling compared to the first modeling task, even though the second task was smaller. Mental effort indicates that modelers moving toward less reconciliation / faster modeling perceived the second task to be easier compared to the first one. Modelers moving to more reconciliation / slower modeling perceived the second task to be as difficult as first modeling task, even though a significant difference between both tasks for the whole population can be observed (cf. Section 8.2). Summarized, we have observed a considerable number of modelers moving to different clusters when comparing the two modeling tasks. The PPM measures support our observation of placing the identified clusters on a spectrum of modeling styles. C1 represents more reconciliation and slower modeling while C2 represents faster modeling and less reconciliation. Modelers in C3 seem to work slower with less reconciliation interactions, representing a mixture of the characteristics of C1 and C2. The observed cluster movement points to the presence of task–specific factors influencing the modeler style. If the modeling style could be entirely attributed to the modeler’s preferences, no cluster movement would be present. However, a
171
Scale
More rec. / slower
Less rec. / faster
Same
Adding Deleting Reconciliation
interactions interactions interactions
−11.33 0.96 3.29
−22.41 −8.21 −40.41
−13.40 −1.72 −16.58
PPM iterations Initial comprehension duration Comprehension phases Avg. comprehension duration Share of comprehension Modeling phases Avg. modeling phase size Iteration chunk size Adding rate Reconciliation phases Avg. reconciliation phase size Max. reconciliation phase size Avg. number of moves per node Delete iterations
iterations mm:ss phases mm:ss % phases interactions interactions interactions phases interactions interactions interactions %
−0.46 00:20 −.17 00:01 1.48 −1.00 −0.35 −0.49 −0.007 1.17 −0.14 −1.17 0.05 2.38
−9.91 −00:30 −7.21 −00:14 −9.50 −8.21 1.06 1.18 0.018 −4.85 −1.33 −9.91 −0.98 −7.48
−4.23 −00:10 −3.33 −00:11 −6.11 −3.62 0.41 0.19 0.012 −1.63 −0.58 −4.88 −0.39 −0.57
Mental effort
1–7
0.04
−0.41
−0.30
Table 8.14: Average differences for cluster movement considerable amount of modelers remained in the same cluster for both modeling tasks, pointing to task independent factors.
8.4.2 Stability of measures To further investigate RQ3.2 , we introduce the notion of stability of measures among the two tasks. If a specific measure shows a high stability over the two tasks, it indicates that the influence of the modeling task was limited. Therefore, a measure showing a high stability indicates a modeler–specific factor influencing the modeling style. For assessing the stability of PPM measures, we use correlational analysis. More specifically, we correlate all measures of the Pre–Flight task with the corresponding measure for the NFL Draft task. The correlation between two measures represents the stability of the respective measure. The results are shown in Table 8.15. Depending on distribution of the data, the Pearson correlation coefficient or the Spearman’s rho correlation coefficient is used (tests for normal distribution can be found in Appendix B.3.1).
172
Measure
Test
Adding interactions Delete interactions Reconciliation interactions PPM iterations Initial comprehension duration Comprehension phases Avg. comprehension duration Share of comprehension Modeling phases Avg. modeling phase size Iteration chunk size Adding rate Reconciliation phases Avg. reconciliation phase size Max. reconciliation phase size Avg. number of moves per node Delete iterations a
N
Cor.
Sig.
Spearman’s rho Spearman’s rho Spearman’s rho
115 115 115
0.192 0.089 0.372
0.040a 0.345 0.000a
Spearman’s Spearman’s Spearman’s Spearman’s Pearson’s r Spearman’s Spearman’s Spearman’s Spearman’s Spearman’s Spearman’s Spearman’s Spearman’s Spearman’s
115 115 115 115 115 115 115 115 115 115 113 113 115 115
0.196 0.276 0.181 0.105 0.000 0.207 0.264 0.270 0.563 0.303 0.271 0.324 0.447 0.190
0.036a 0.003a 0.053 0.265 0.998 0.027a 0.004a 0.004a 0.000a 0.001a 0.004a 0.000a 0.000a 0.042a
rho rho rho rho rho rho rho rho rho rho rho rho rho
significant at the 0.05 level
Table 8.15: Measure correlations between Pre–Flight and NFL Draft
In terms of measures quantifying the modeler’s inactivity only the correlation for initial comprehension duration turned out to be significant. It seems that several factors influence the initial comprehension duration. For instance, we observed that domain knowledge was associated with initial comprehension duration for PBP1. The correlation between both modeling tasks of different domains for initial comprehension duration might point to additional factors influencing the PPM as suggested in Section 7.5.1, e.g., self–regulation. For the number comprehension phases, average comprehension duration, and share of comprehension no correlation could be observed. Similar to the initial comprehension duration, this might indicate that the actual time of inactivity during modeling is determined by a combination of modeler–specific and task–specific factors, i.e., we observed an influence of modeling experiences on the number of comprehension phases for PBP2. Additionally, working memory capacity might be associated with the number of comprehension phases and their respective durations. When considering the measures associated with the addition of elements to the process model, i.e., adding interactions, number of modeling phases, average modeling phase size, iterations chunk size, and adding rate, several significant correlations
173
can be observed. In this context, the correlation for adding rate is most notable as it can be considered strong and highly significant. This indicates that modelers who add elements quickly to the process model persist to do so irrespective of the actual modeling task. For the other measures concerned with modeling, weaker correlations were observed. For instance, we observed a weak correlation of the number of modeling phases. This is consistent with our previous findings where the number of modeling phases was correlated with prior modeling experience. Regarding the measures covering the modeler’s reconciliation behavior, several weak and medium correlations can be observed. Most notably, the correlation for average number of moves per node comes close to a strong correlation. This might describe the behavior of modelers who put elements carelessly on the modeling canvas and rearrange them in dedicated reconciliation phases. This might be related to PBP5 describing modelers who invest into the process model’s layout by conducting reconciliation interactions instead of placing the elements at strategic places. The correlations for measures regarding reconciliation and the findings of Chapter 7, which did not indicate an influence of domain knowledge or modeling behavior, point toward other factors determining the reconciliation behavior of modelers. This should be investigated in future research on the PPM. Regarding the removal of elements from the process model, no correlations were observed for delete interactions and only a weak correlation was observed for delete iterations. In the context of PBP7, it was observed that the number of delete interactions was correlated with prior modeling experience. In combination with the findings of this chapter, we might argue that the removal of elements from the process model is associated with the modeler, i.e., prior experience might support the creation of process models, but also the specific task at hand, i.e., the specific task, might impose difficulties. Based on insights from CLT, we would assume that mental effort might be connected to problems during the creation of process models, since problems are more likely to occur when working memory limits are exceeded [260]. Assuming that problems during the creation of a process model manifest in elements that are removed from the process model, a connection of the corresponding measures to mental effort might be identified. For the Pre–Flight modeling task, significant correlations between mental effort and the number of delete interactions (rs (115) = 0.27, p = 0.003) and between mental effort and delete iterations (rs (115) = 0.24, p = 0.009) can be observed. For the NFL Draft modeling task only delete iterations comes considerably close to being statistically significant (rs (115) = 0.18, p = 0.055). The lack of significant correlations for the NFL Draft task might be explained by difficulty of the task (the NFL Draft task was perceived to be significantly easier). If working memory limits are not exceeded, only a limited effect on the number of delete
174
interactions can be expected. Summarized, several significant correlations could be observed between the two modeling tasks. Most notably is the high number of significant correlations for measures covering reconciliation. It seems that this aspect of modeling is largely modeler–specific, while other aspects, e.g., delete interactions, are mostly influenced by the modeling task at hand.
8.5 Discussion This section discusses the findings regarding RQ2.2 in Section 8.5.1 and in terms of RQ3.2 in Section 8.5.2. Further, we reflect on limitations of M S4 in Section 8.5.3.
8.5.1 RQ2.2 : Can distinct modeling styles be identified? Considering RQ2.2 , cluster analysis was utilized to identify three distinct modeling styles for both modeling tasks. The identified modeling styles can be distinguished by three main aspects of the PPM. First, modelers in C1 showed extensive reconciliation, which resulted in considerably longer PPM instances. No such emphasis on reconciliation could be observed for modelers in C2 and C3. Second, the extent to which the adding of content was streamlined and undisturbed, which we refer to as the efficiency of the PPM. Modelers in C2 efficiently utilized their cognitive resources by creating the process model in large chunks, which resulted in focused and fast PPM instances. Finally, the clusters were also distinguished by evidence of difficulties encountered while modeling. These were mainly reflected when the modeler removed elements from the process model, i.e., delete interactions, and re– modeled them, i.e., additional adding interactions. Even though we observed delete interactions in all clusters, C1 had a significantly higher amount of delete interactions compared to C2 and C3, indicating that modelers in C1 experienced more difficulties. This is consistent with the observation that modelers who moved toward a slower cluster for the second modeling task reported a slight increase in mental effort. This is notable since it is against the general trend of perceiving the NFL Draft task to be easier compared to the Pre–Flight task. Similarly, troubles while modeling entail more time of inactivity, e.g., larger share of comprehension. Following this line of thought, the utilized measures are grouped to form three aspects • Reconciliation operationalized by reconciliation interactions, number of reconciliation phases, maximum reconciliation phase size, and average number of moves per node.
175
• Efficiency the associated measures include PPM iterations, initial comprehension duration, number of comprehension phases, average comprehension duration, share of comprehension, number of modeling phases, average modeling phase size, iteration chunk size, adding rate, number of reconciliation phases, and maximum reconciliation phase size. • Troubles reflected by the measures adding interactions, delete interactions, number of comprehension phases, average comprehension duration, share of comprehension, and delete iterations. Summarized, within the bounds of this exploratory study, we were able to observe three distinct modeling styles. We could distinguish (1) an efficient modeling style characterized by limited time needed to think about the modeling task, and a fast rate of adding elements to the model; (2) a reconciliation–driven modeling style which involves much time in creating a comprehensible layout while being less efficient in creating the model; and (3) an intermediate modeling style that is neither particularly efficient nor invests particularly into the process model’s visual appearance. Each of the presented modeling styles is connected to a set of PPM measures quantifying the PPM, characterizing the respective modeling style. This way, the modeling styles are connected to the PBPs described in Chapter 7. For instance, efficiency contains initial comprehension duration, which has been observed to be short for modelers assigned to C2, i.e., modelers applying an efficient modeling style.
8.5.2 RQ3.2 : How is the Process of Process Modeling influenced by task–specific factors? RQ3.2 is approached by investigating whether and how modelers move between clusters for different modeling tasks. In this context, considerable movement has taken place, implying that the modeling style of a modeler is not fully consistent for different tasks. The cluster movement analysis indicates a connection between the modeling style and the perceived mental effort. For instance, C1 for the Pre–Flight task, which had a higher perceived mental effort, consisted of 42 PPM instances, while C1 for the NFL Draft task consisted of 31 PPM instances. Additionally, we established a connection between mental effort and the number of delete interactions and delete iterations for the Pre–Flight task. Further, the cluster movement entailed consistent changes in measures of efficiency and troubles, as well as in reconciliation behavior. A better understanding of the consistency of specific aspects of the modeling style and the factors that might affect it is gained through the analysis of the stability of
176
measures. It was established that several of the measures attributed to reconciliation behavior indicate significant correlations between the two tasks. This included average reconciliation phase size, which could not be used for distinguishing the identified clusters. This might imply that reconciliation behavior is typical for an individual modeler, directly affected by reconciliation preferences and independent of the modeling task at hand. This is interesting since no connection of domain knowledge and modeling experience with reconciliation was found (cf. Chapter 7). This suggests that additional modeler–specific factors might exist, which determine reconciliation behavior (cf. Section 9.5). In contrast, the measures related to the efficiency aspect of the modeling style exhibit different levels of correlation if any, e.g., adding rate was strongly correlated, iteration chunk size correlated to a small to medium extent, while no significant correlation could be established for share of comprehension or delete interactions. Summarized, we observed a certain influence of task–intrinsic characteristics on the PPM. More specifically, it seems that changes in complexity of the modeling task might force modelers to change to a different modeling style, i.e., modelers who move toward a slower modeling style with an increase in the associated measures. In this context, the aspects of modeling style related to efficiency and troubles seem to be affected. This seems reasonable when considering CLT, since an increase in complexity can be expected to result in increased cognitive load. If the modeler’s working memory capacity is overstrained, problems are more likely to occur [260], i.e., affecting efficiency and troubles. The presented findings complement the findings of Chapter 7 by assessing the influence of task–specific factors on the developed set of PPM measures. This way, the identified influence of modeling experience and domain knowledge can be combined with the findings of this chapter. In Section 9.3 an initial model of factors influencing the PPM is developed, that can guide future research on the PPM.
8.5.3 Limitations of M S4 The interpretation of our findings is presented with the explicit acknowledgment of a number of limitations to M S4 . Limitations applying to the entire thesis are discussed in Section 9.4. First, cluster analysis constitutes an exploratory method for analyzing data. While this fits the purpose of the investigations reported in this chapter, generalizations need to be made with care [67]. In this context, we cannot rule out that KMeans identified local minima, resulting in a suboptimal clustering. To counter this threat we validated the clustering using a series of measures for quantifying the PPM and identified significant differences among the three clusters.
177
Second, our approach of using cluster analysis for identifying distinct modelings styles is based on the assumption that there exists one modeling style per PPM instance. Since it seems reasonable to assume that modelers may change their modeling style, e.g., when facing difficulties, this is a considerable limitation of our work. Still, the presented approach allowed us to gain initial insights into different modeling styles that can be extended toward including changes in modeling style during the PPM in the future. Third, insights on modeler–specific factors were not investigated explicitly in this chapter. For this purpose, we relied on observations made in the context of Chapter 7. By using the same set of PPM measures, we might expect a similar influence of prior modeling experience and domain knowledge on the PPM measures. Still, this limitation should be kept in mind when generalizing the results of this investigation. Finally, we cannot rule out that differences in mental effort regarding the two modeling task were caused by the modelers’ learning experience. By conducting the modeling tasks in a specific order, the two tasks might have been of equal difficulty, but the modelers were more experienced in creating process models using BPMN during the second modeling task. Future investigations should focus on a detailed analysis of properties of modeling tasks and their influence on the PPM (cf. Section 9.5).
8.6 Summary This chapter contributes to our understanding on how process models are created, as it constitutes a systematic attempt to identify distinct modeling styles. This way contributing to RQ2 . For this purpose, we recorded and analyzed 230 PPM instances of 115 students following classes on business process managements in an exploratory manner. Using cluster analysis, we were able to identify three distinct modeling styles that occurred independently of the concrete modeling task. Each modeling style has specific characteristics that can be measured in terms of how the modeler interacts with the modeling environment. Further, we investigated the influence of task–specific factors on the PPM, contributing to RQ3 . For this purpose, the movement between cluster and the stability of measures were investigated. The results indicate that factors related to the efficiency of problem solving and to troubles during the creation of the process model are influenced by the concrete modeling task. Reconciliation, on the contrary, seems to be independent of the modeling task at hand. The identified findings are aggregated to an initial model describing factors influencing the PPM in Section 9.3.
178
Chapter 9 Discussion and future research directions This section picks up the research questions defined in Chapter 1 and discusses the means applied for answering each research question. In this context, Section 9.1 discusses RQ1 , Section 9.2 focuses on RQ2 , and Section 9.3 describes the findings regarding RQ3 . Further, we discuss limitations applying to the entire thesis in Section 9.4. Finally, we outline future research directions in the context of the PPM in Section 9.5.
9.1 RQ1 : How can the Process of Process Modeling be investigated? In RQ1 , we focused on developing a modeling environment, allowing us to record larger numbers of PPM instances on a fine–grained level and supporting the analysis of the PPM. This way, RQ1 constitutes the foundation for work regarding the behavior of modelers and factors that influence the PPM. Subsequently, the contributions regarding RQ1 are briefly discussed. First, means for recording PPM instances needed to be developed. In this context, it was important to not only record the final process model, but also the whole process of creating the process model. For this purpose, we presented CEP, a tool specifically designed for analyzing the PPM. In particular, CEP provides a configurable modeling environment recording all interactions with the modeling environment. This way, the creation of the process model can be replayed at any point in time. Further, the modeling environment is complemented with components supporting data collection, e.g., surveys, that can be orchestrated in an experimental workflow. CEP was used in all four modeling sessions conducted in this thesis and in several publications investigating the PPM for recording and analyzing PPM instances, e.g., [28–30, 284, 292], demonstrating the usefulness of CEP for analyzing the PPM.
179
Second, the list of interactions with the modeling environment recorded by CEP should be processed to support data exploration and facilitate the generation of hypotheses. For this purpose, an initial description of the activities involved during the PPM was derived from the process of programming. This description was then used as a theoretical lens on the data collected by CEP. In this context, an algorithm for identifying the different phases of the PPM was developed and a visualization for the detected phases was devised, i.e., MPDs. The description of the PPM and algorithm for detecting the phases of the PPM were validated in two modeling sessions using think aloud and eye movement analysis. Further, the usefulness of MPDs for analyzing the PPM was demonstrated. We conclude that RQ1 has been addressed since means for analyzing the PPM have been developed and successfully applied. Further, the possibility to analyze PPM instances paves the way for new approaches to teaching business process modeling. For instance, tools for performing on–the–fly analysis of the students’ PPM instances might be envisioned. Imagine a group of students working on a modeling assignment in a lab. Whenever a student’s PPM instance deviates from the expected way of problem solving, the teacher is informed about the deviation. For instance, whenever a larger number of elements is removed from the process model, the teacher could be informed, who might assist the student by clarifying potential problems.
9.2 RQ2 : How do modelers create process models? RQ2 was intended to advance our understanding on how process models are created by investigating the behavior of modelers during the PPM. For this purpose, we utilized sequential method triangulation involving three modeling sessions. First, initial insights were generated in M S1 , which were further refined in M S3 to develop a catalog of PBPs. Additionally, the topic was approached from a different angle to complement and validate the findings of M S3 . For this, cluster analysis was applied to identify distinct modeling styles. This way, qualitative and quantitative research methods were combined using a mixed–method approach. Subsequently, the findings are briefly discussed. We exploratively investigated a set of PPM instances using think aloud in M S1 to gain initial insights on how process models are created. The preliminary findings were used to guide the identification of patterns of reoccurring behavior, i.e., PBPs. For this purpose, the data recorded in M S3 was analyzed using MPDs, allowing us to identify differences in modeling behavior covering several aspects of the PPM. For example, we identified different reconciliation strategies. While some modelers
180
considered the process models’ secondary notation when placing elements on the modeling canvas, alleviating them from the need for further reconciliation, others invested considerable efforts on reconciliation later in the PPM instance. In this context, some modelers continuously improved the secondary notation, while others concentrated their reconciliation efforts toward the end of the PPM instances. Each PBP was associated with a series of measures, which allow to quantify the modeler’s behavior. As a result, we obtained a catalog of PBPs describing differences in modeling behavior, which should be considered a starting point for future investigations on the PPM. Second, we tried to identify distinct modeling styles in M S4 by applying cluster analysis. Since the clusterer did not rely on the phase detection algorithm for identifying distinct modeling styles, the performed analysis can be considered complementary to the catalog of PBPs. Modeling styles combine several aspects of the modelers’ behavior to form a smaller amount of distinct modeling styles, e.g., a fast start was usually accompanied by a quicker adding of content. The analysis revealed three distinct modeling styles, which were characterized using the PPM measures developed in Chapter 7. This way, the gap between modeling styles and PBPs is bridged. In a nutshell, we identified an efficient modeling style characterized by a fast start and quick modeling. Further, we identified a style incorporating longer PPM instances with extensive reconciliation and a third style, which can be positioned between the other two modeling styles, characterized by less efficient modeling behavior without excessive reconciliation. Summarized, we have been able to observe considerable differences in how process models are created. More specifically, we presented a catalog of PBPs, documenting reoccurring behavior, relying on quantitative and qualitative insights. Further, the catalog of PBPs was complemented with the analysis of modeling styles, which investigates how observable differences regarding the modelers’ behavior relate to each other. For example, we observed that a fast start co–occurred with quick adding of content and limited reconciliation. This way, RQ2 has been investigated from three different perspectives, improving the generalizability of our findings.
9.3 RQ3 : How do modeler–specific and task–specific factors influence the Process of Process Modeling? RQ3 focused on the identification of factors that might influence the PPM. In this context, it would seem reasonable to expect that some modeler–specific factors consistently affect the modeler’s behavior, regardless of the task at hand, while task–specific factors would affect the modeler’s behavior in interaction with the
181
task characteristics. As before, we applied method triangulation to investigate the influence of different factors on the PPM. In M S3 , we considered the influence of modeler–specific factors, i.e., domain knowledge and modeling experience, on the PPM measures associated with PBPs. For this purpose, M S3 consisted of a single larger modeling task to amplify the influence of domain knowledge and modeling experience, i.e., the influence might be limited for small modeling tasks. In this context, we observed, among others, an influence of domain knowledge on the initial comprehension phase, and of modeling experience on measures associated with method finding, modeling, and, to a limited extend, on the number of delete interactions. Interestingly, we did not identify a connection of prior modeling experience or domain knowledge with the different reconciliation strategies. In the context of M S4 , the influence of the task on the identified aspects of modeling style, i.e., reconciliation, efficiency, and troubles was investigated. For this, two smaller modeling tasks were conducted. In this context, the movement between clusters and the stability of measures was investigated. For this purpose, the measures developed in Chapter 7 were utilized to assess the influence of the modeling task on the PPM. The findings suggest that efficiency is affected by both the properties of the modeler and the properties of the task. The interaction of the task and the modeler’s properties can be explained using CLT by considering the cognitive load imposed on the modeler by the specific task. Cognitive load can be operationalized by mental effort, which might explain some of the findings for cluster movement. Similarly, cognitive load should affect the trouble aspect of the modeling style. For the measures reflecting trouble no or rather weak correlations between the tasks could be identified. This seems reasonable, since troubles during the PPM are usually not consistently encountered. In contrast, high stabilities for measures representing the modelers’ reconciliation behavior were observed, pointing toward other modeler–specific factors, e.g., self–regulation, determining the modeler’s reconciliation behavior. Summarizing this discussion, the model that emerges from our findings is depicted in Figure 9.1. The model includes the three aspects of modeling style with their associated measures, which establish the connection to the catalog of PBPs. The modeler’s cognitive characteristics, the task–intrinsic characteristics and the task–extraneous characteristics influence cognitive load, which is operationalized by mental effort. Cognitive load, in turn, affects the efficiency and the trouble aspects of the modeling style, i.e., in case that cognitive load exceeds the modeler’s working memory capacity, errors are likely to occur [260]. In contrast, the modeler’s interface preferences directly affect both, reconciliation and efficiency. This reflects that no influence of domain knowledge and modeling experience on reconciliation could be
182
Modeling style reconciliation
Modeler interface preferences
Reconciliation interactions Reconciliation phases Avg. reconciliation phase size Max. reconciliation phase size Avg. number of moves per node
Layout preferences Tool usage preferences
Modeling style efficiency Modeler cognitive characteristics Working memory capacity Modeling expertise Domain knowledge Tool knowledge Intrinsic task characteristics Size Complexity of task (element interactivity) Extraneous task characteristics Task description Modeling notation Tool support
Cognitive load of the task Mental effort
PPM iterations Initial comprehension duration Comprehension phases Avg. comprehension duration Share of comprehension Modeling phases Avg. modeling phase size Iteration chunk size Adding rate Reconciliation phases Max. reconciliation phase size Modeling style troubles Adding interactions Delete interactions Comprehension phases Avg. comprehension duration Share of comprehension Delete iterations
Figure 9.1: A model of factors influencing the PPM observed. Using the presented model, we might explain several observations made in this thesis. For instance, we observed an influence of modeling experience on the number of modeling phases in the context of PBP3 and that the number of modeling phases correlated for both modeling tasks (cf. Section 8.4.2). This can be explained via cognitive load. More specifically, by utilizing schemata regarding modeling retrieved from long–term memory, the required mental effort is lowered. This, in turn, increases the efficiency of creating the process model. Regarding comprehension, the model provides an explanation for the fact that we did not observe correlations for PPM measures associated with comprehension (cf. Section 8.4.2), even though an influence of modeling experience on the number of comprehension phases was identified in the context of PBP2. Comprehension measures are not only associated with efficiency, but also with the troubles. As
183
the second modeling task in M S4 was easier compared to the first modeling task, less problems might have occurred. This, in turn, reduced the differences between individual modelers. Put differently, less prior experience was necessary to efficiently create the second process model of M S4 without running into troubles. Several notes should be made about the proposed model. First, we designed the modeling sessions in this thesis to keep extraneous task characteristics constant. Hence, the effect of this factor on the cognitive load is merely an assumption that seems reasonable considering insights from CLT [178], yet currently not supported by the findings in this thesis. Second, the effect of the interface preferences on efficiency is implied by the cluster analysis, since extensive reconciliation interactions reduce the efficiency of modeling. Third, the model does not include a relationship between interface preferences and cognitive load. Our findings suggest direct relationships between interface preferences and reconciliation and efficiency. Still, there might also be an indirect relationship through cognitive load. It is possible that emphasized interface preferences cause increased cognitive load and thus an additional effect on efficiency and troubles of the modeling style. However, establishing such an effect, as well as gaining a full understanding of the effects of the modeler interface preferences, requires additional research efforts. Finally, emerging from the exploratory findings in this thesis, the proposed model cannot be considered a fully established theory. Rather, it serves as a research agenda and a platform for the derivation of hypotheses for further studies. Such studies can address factors which were kept constant in this thesis such as the notational system, i.e., the modeling notation or specific features of the modeling environment. Summarized, RQ3 has been addressed by investigating the influence of modeler– specific factors and task–specific factors, which were combined to form an initial model of factors that influence the PPM.
9.4 Limitations The results of this thesis have to be considered with a series of limitations. First, the subjects in all modeling sessions were students having participated in classes on business process modeling. Even though the participants reported prior knowledge on process modeling this group can hardly be compared to professional modelers creating process models on a daily basis. While some studies have reported on students providing an adequate model for the professional population in software engineering [113, 199] and business process management [215], there exist studies that show significant differences between students and professionals, e.g., [8]. Hence,
184
the presented results can only be generalized to a limited extent to the business process management community. More specifically, even though differences between subjects were notable, the participants in our modeling sessions constituted a relatively homogeneous group. Modelers with more profound modeling experience might amplify the observed differences resulting in different findings in terms of modeling behavior, i.e., when comparing novices and experts. Further, the use of a textual description for conveying domain knowledge considers a limitation. In real–life modeling settings, the existence of a single, well–structured document describing the process cannot be assumed. Rather the information needs to be assembled from various external sources in order to form a coherent internal representation. Still we might argue that, while a textual description cannot be assumed in practice, the actual formalization of a process model constitutes a sub– part of every modeling initiative. Further, the usage of a textual description supports the investigations regarding modeling behavior since all participants are working on the same process model, allowing to compare PPM instances. Finally, throughout the modeling sessions conducted in this thesis, the influence of the notational system was minimized, i.e., minimal tool features and a subset of BPMN. This limits the generalization of our findings since more sophisticated tools and notations might be used in practice, even though it has been observed that frequently only subsets of BPMN are used in practice [322]. As a result, we specifically incorporated tool support and tool knowledge in the model of factors that influence the PPM as better tools might lower mental effort and therefore facilitate the creation of process models.
9.5 Future work Several potential directions for future work can be envisioned. For instance, the Modeling Mind1 project [192] intends to gain a more detailed picture by extending the current catalog of PBPs and investigating modeler–specific factors not considered in this thesis. Further, Modeling Mind intends to bridge the gap between PBPs and process model quality. Subsequently, we present selected aspects of Modeling Mind to illustrate future research directions extending the findings regarding RQ1 , RQ2 , and RQ3 . For a detailed description we refer to [192]. RQ1 : Future work regarding means for analyzing the PPM The model of factors influencing the PPM (cf. Section 9.3) indicates a high importance of cognitive load, which is typically operationalized as mental effort [178]. Similarly, we observed 1
The author will continue his work on the PPM as a post–doc researcher in Modeling Mind.
185
in M S4 that troubles during the creation of the process model were related to an increase in mental effort. In this context, mental effort was measured using a self– rating scale after completing the modeling task, which results in a single value for mental effort for the entire modeling task. Alternative techniques for assessing mental effort exist, e.g., the measurement of the diameter of the eyes’ pupils, i.e., pupillometry, or heart–rate variability [178]. These techniques allow to gain a fine–grained picture on how mental effort evolves during the PPM, providing an additional perspective on the creation of process models. In this context, we intend to apply a setup comparable to M S2 , which additionally collects information on mental effort using pupillometry, i.e., the current mental effort can be obtained for every point in time during a PPM instance.
A
B
C
D
sudden increase of mental effort
m e n t e a l l e m e e f n f t o s r t
E F G
significant decrease of mental effort
#
0 0
time
Figure 9.2: MPD including mental effort overlay
By utilizing the obtained mental effort over time, MPDs can be extended to combine mental effort with the different phases of the PPM as illustrated in Figure 9.2. Such a visualization allows to gain an overview of challenges faced during the PPM. For example, the PPM instance illustrated in Figure 9.2 indicates a sudden increase of mental effort in phase A. The corresponding visualization of phases of the PPM indicates that this increase occurs during a comprehension phase. Figure 9.2 further shows that mental effort remains high throughout the subsequent modeling phase B, suggesting that the increased mental effort might indicate troubles during modeling, resulting in an error. The deletion of model elements in phase E and respective corrections during phase G, i.e., the subsequent increase of the number of model elements. Further, it can be observed that mental effort starts to decrease in phase
186
35:35
C before corrections are made to the process model. Mental effort continues to decrease in phase D where reconciliation is performed. Similarly, the MPDs could be complemented with an overview of significant changes of mental effort within a predefined timeframe or with timeframes indicating particularly high mental effort.
RQ2 : Future work regarding PBPs CLT suggests a connection between mental effort and the occurrence of quality issues [260]. In this context, MPDs with mental effort overlay and CEP’s replay feature might allow us to analyze the interactions during periods of high mental effort. This way, we hope to gain a comprehensive understanding of quality issues in process models. In this context, we intend to specifically investigate the occurrence, (potential) discovery, and (potential) resolution of quality issues during the PPM. This way, we hope to extend the catalog of PBPs with PBPs specifically focusing on quality issues during the PPM.
RQ3 : Future work regarding factors influencing the PPM MPDs with mental effort allow for a detailed investigation regarding the influence of task–specific factors. In this thesis, task–specific factors were considered by using multiple modeling tasks and investigating their influence on mental effort. Using the visualization in Figure 9.2, a more detailed analysis regarding task– specific factors might be conducted. For instance, researchers can identify the parts of the process model, e.g., specific modeling constructs, causing an increase in mental effort. In this context, the influence of task–specific factors on process model quality can be investigated. More specifically, by monitoring the modeler’s mental effort, situations where errors occur might be identified. On the long term, this knowledge can be exploited by supporting the modeler in terms of modeling environments suggesting improvement opportunities. This way, the connection between process model quality and the PPM can be investigated. Further, the generated insights can be utilized for teaching. For example, we might be able to establish the perceived difficulty of various modeling constructs. These insights can then be exploited by focusing on the most challenging parts when instructing our students in the craft of modeling. In order to extend research on modeler–specific factors influencing the PPM, we plan to follow the suggestions made in Chapter 7. More specifically, we intend to measure the modelers’ cognitive characteristics, e.g., working memory capacity [146], but also the modelers’ personal characteristics, e.g., self–regulation [139, 240] and self–leadership [6, 114]. This way, we hope to gain additional insights into the factors
187
influencing the PPM. In particular factors influencing reconciliation strategies of modelers are not understood at this point. Conclusion Summarized, by adding an additional perspective to the PPM, i.e., by including data on mental effort, we hope to gain insights for the identification of new PBPs and for investigating the influence of the modeling task on the PPM. This is complemented with assessing additional cognitive characteristics and personal characteristics of modelers to develop an understanding on how other modeler– specific factors influence the PPM. Finally, by considering mental effort during the PPM, challenging parts can be identified and better supported in the future, e.g., in terms of better teaching materials or through improved modeling environments.
188
Chapter 10 Summary This thesis constitutes a first systematic investigation into the formalization of process models, i.e., the Process of Process Modeling. In this context, the central, rather broad research statement of investigating the PPM was refined to formulate three major research questions: RQ1 the development of means for analyzing the PPM, RQ2 observing the modeler’s behavior during the PPM, and RQ3 investigating the factors that influence the PPM. In order to address these research questions, four modeling sessions were conducted. Subsequently, the major findings for each research question are briefly outlined. RQ1 can further be partitioned into two major parts. On the hand, the development of Cheetah Experimental Platform—a tool dedicated for conducting empirical investigations in the realm of process modeling. For this, a configurable modeling environment is available that allows a detailed investigation of the PPM by recording all interactions with the modeling environment. Further, additional components are available that support the execution of modeling sessions. On the other hand, RQ1 consists of deriving a description of the PPM from the process of programming, which provides a theoretical lens on the data recorded by CEP. This way, the data can be analyzed by forming higher–level phases of the PPM, i.e., problem understanding, method finding, modeling, reconciliation, and validation. Additionally, an algorithm for extracting the phases based on the modelers’ interactions is presented. This way, the interactions can be visualized in so–called Modeling Phase Diagrams. The contributions to RQ1 constitute the foundation for all investigations in this stream of research, e.g., [27–30, 72–74, 188, 190–192, 197, 234, 283, 284, 292]. CEP was used in this thesis to investigate RQ2 , by developing a catalog of Process of Process Modeling Behavior Patterns. Each PBP describes an aspect of the modelers’ behavior that was observed during M S3 . Each PBP is accompanied by a set of PPM measures that quantify the modelers’ behavior. Complementary to the catalog of PBPs, distinct modeling styles could be identified using cluster analysis in M S4 and characterized using the afore–mentioned PPM measures. This way, we have been able to observe and categorize differences and similarities in modeling
189
behavior, which constitutes a first step toward understanding how the formalization of process models takes place. Finally, RQ3 was investigated by considering modeler–specific factors, i.e., domain knowledge and modeling experience, and task–specific factors. For this, we investigated the influence of the respective factor on the PPM measures that quantify the modelers’ behavior. The gained insights are condensed to form an initial model describing why certain modeling behavior can be observed. This model should guide future research by providing an outline for detailed investigations of the respective factors. Based on the presented research, we conclude that the research goal of this thesis was fulfilled as a we have been able to demonstrate how the PPM can be investigated. Further, the topic has the potential for promising research that can be conducted in the future. We have outlined how mental effort will be combined with MPDs in the context of Modeling Mind: Behavior Patterns in Process Modeling 1 [192]. Other potential directions could include quality issues of process models, which have only been briefly addressed in this thesis. Theoretically, for every quality issues we might identify the occurrence of the quality issue, and, potentially, the point in time when the quality issue is detected and resolved. Such a detailed analysis would bring us one step closer to efficiently assisting modelers during the creation of process models. This direction is further pursued in ModErARe—Modeling Error Analysis and Resolution 2 . We hope that following this line of research will ultimately enable us to improve the quality of process models by providing modelers with intelligent modeling environments and through improved teaching materials that help modelers on their way to professional modelers.
1 2
The Modeling Mind is funded by the Austrian Science Fund (FWF): P26609–N15 ModErARe is funded by the Austrian Science Fund (FWF): P26140–N15
190
Appendix A Task descriptions This section contains the task descriptions of the four modeling sessions conducted as part of this thesis.
A.1 M S1 : Problem understanding, method finding, and validation Short description In the following, the verification of the process of a bank handling a customer’s mortgage request is described. If you are finished with modeling, please use the “Finish Modeling” button on the top left to proceed. Please keep in mind that you should think aloud during the whole modeling session, speak out loud and clear whatever thoughts come to your mind while performing the modeling task. Process description As a first step, the bank checks whether the customer has already a mortgage. If the customer has no mortgage yet, the mortgage application is registered locally. Otherwise, if the customer already has a single mortgage, the headquarters need to be informed. Afterwards, the bank performs the following checks in parallel: • the mortgage must not exceed 80% of the property’s value • the applicant is currently employed • the applicant is not internally listed for low payment moral After all checks have been performed, the bank evaluates the results. If one of the checks turns out negative, the application is rejected and closed. Otherwise, general information about the application is registered. Subsequently, the bank analyzes the mortgage in detail: If the mortgage is below EUR 1.000.000, confirmation by a single person is sufficient. For mortgages equal or larger than EUR 1.000.000, supervisor approval is needed additionally.
191
A.2 M S2 : Modeling and reconciliation Zuerst wird die Kreditanfrage in das Computersystem der Bank eingetragen. Anschließend wird u ¨berpr¨ uft, ob alle n¨otigen Daten vorhanden sind. Sollten nicht alle Daten vorhanden sein, wird der Kunde kontaktiert. Anschließend werden die Daten wieder u ¨berpr¨ uft. Diese Schritte werden so lange wiederholt, bist die Daten vollst¨ andig sind. ¨ Nachdem dieser Vorgang abgeschlossen ist werden die folgenden Uberpr¨ ufungen unabh¨ angig voneinander ausgef¨ uhrt: Die Bank errechnet die verf¨ ugbaren finanziellen Mittel des Kunden; Die Bank errechnet das j¨ahrliche Einkommen des Kunden; Die Bank errechnet die ben¨ otigten finanziellen Mittel des Kunden. ¨ Nachdem alle Uberpr¨ ufungen abgeschlossen sind, wird eine Entscheidung, wie im Folgenden beschrieben, gef¨allt. Wenn der Kredit weniger als EUR 1.000.000 betr¨ agt, kann ein einzelner Mitarbeiter die Entscheidung treffen. F¨ ur Kredite u ¨ber EUR 1.000.000 oder mehr m¨ ussen zwei Mitarbeiter an der Entscheidung beteiligt sein. In diesem Fall evaluiert jeder der beiden Mitarbeiter unabh¨angig vom anderen das Kreditansuchen. Anschließend treffen die beiden Mitarbeiter gemeinsameine Entscheidung. Falls die Bank die Kreditanfrage positiv bewertet, wird dem Kunden ein Angebot vorgelegt. Andernfalls wird dem Kunden negativer Bescheid zugestellt. Anschließend wird die Kreditanfrage im Computersystem abgeschlossen und der Prozess beendet. Sollte der Kunde das Angebot akzeptieren, wird das Geld auf das Konto des Kunden transferiert. Anschließend wird die Kreditanfrage im Computersystem abgeschlossen und der Prozess beendet. Sollte der Kunde das Angebot nicht akzeptieren, wird evaluiert ob das Angebot u ¨berarbeitet werden soll. Sollte sich die Bank dazu entscheiden, dem Kunden ein neues Angebot zu machen, muss das Angebot u ¨berarbeitet werden. Anschließend muss u ¨ber die Kreditvergabe erneut entschieden werden (wie beim vorherigen Angebot). Sollte die Bank das Angebot nicht u ¨berarbeiten wollen, wird dem Kunden ein negativer Bescheid zugestellt. Anschließend wird die Kreditanfrage im Computersystem abgeschlossen und der Prozess beendet.
A.3 M S3 : Process of Process Modeling Behavior Patterns At the beginning, the initial mortgage request of the customer is entered in the bank’s system. Afterwards, the bank checks whether they have all the information necessary to process the mortgage request. If not, the bank contacts the customer
192
to ask for the missing information. This step is repeated until all information is complete. Once the information has been obtained, the bank calculates the available funds for the client, her annual income as well as the required funds, in order to buy the property. These computations are all independent of each other and can be done in parallel. Once all computations are completed the bank queries a central database for additional mortgages the customer might have. If the customer has more than one active mortgage, a rejection letter is sent and the application is closed. This ends the mortgage process. Otherwise, the mortgage application is registered locally. If the customer already has a single active mortgage, the headquarters need to be informed afterwards in addition to registering the mortgage application locally. In the next stage, the bank performs the following three checks/calculations independently of each other. The bank assesses the mortgage’s value compared to the property’s value, the applicant’s current employment status as well as the applicant’s payment history. After all checks are completed, the mortgage is inspected in detail as described subsequently. If the mortgage is below EUR 1.000.000, a single employee is sufficient for making a decision about the mortgage application. For mortgages equal or larger than EUR 1.000.000, a second employee is required for decision making. In the latter case two employees evaluate the mortgage request individually. This is done in parallel. Afterwards they meet to make a decision. If they cannot agree on approving the mortgage, a rejection letter is sent and the application is closed. This ends the mortgage process. If the mortgage request is approved, the bank prepares a mortgage offer for the customer. Then, the bank sends the offer to the customer. Afterwards, the bank evaluates the response forms returned by the customer. If the customer accepts the conditions presented to him in the mortgage offer, the money is made available through a deposit and the mortgage application is closed. This ends the mortgage process. If the customer does not accept the conditions, the bank contacts the customer to inquire for the reasons for not accepting the offer. Afterwards, the response is evaluated by the bank. If the bank decides to offer the customer different conditions for her mortgage request the mortgage request is updated. Then, the mortgage request needs to be evaluated and approved by the bank, as done with the previous request. Otherwise, a letter is sent to the customer and the mortgage application is closed. This ends the process.
193
A.4 M S4 : Styles in business process modeling A.4.1 Pre–Flight modeling task In the following, the pre–flight process for conducting a general aviation flight is described. First, the pilot has to check the weather. Optionally, the pilot can then file a flight plan. This is followed by a pre–flight inspection phase of the airplane, where the pilot checks the engine as well as the fuselage of the airplane. Both activities can be conducted independently of each other. For large airports, the pilot calls Clearance Delivery to get the engine start clearance. If an airport has a tower, the pilot has to contact Ground to get taxi clearance; otherwise the pilot has to announce taxiing himself/herself. This is followed by taxiing to the run– up area and performing the run–up checks to ensure that the airplane is ready for flight. If the airport has a tower, the tower is contacted to get take–off clearance, otherwise take–off intentions have to be announced. Finally, the pre–flight process is completed with the take–off of the airplane.
A.4.2 NFL Draft modeling task At the beginning of the process the scouting team watches tapes from college football games. Afterwards, the scouting team attends games of the player they are interested in live in the football stadium. If the scouting team is still interested in the player (after having attended his football games), they attend the NFL Scouting Combine. Otherwise, the scouting team goes back to watching tapes. After attending the NFL Scouting Combine, the scouting team talks to the player. If the scouting team is not interested in the player anymore, the process is ended. Otherwise, the scouting team performs a background check to identify possible issues concerning the player’s character. At the same time, the scouting team talks to the player’s coaches and also talks to the player’s family. If the scouting team is not interested in the player anymore the process is ended. Otherwise, if the player is still available, the scouting team drafts the player. Additional Information NFL Draft. The NFL Draft is an annual event in which the 32 National Football League teams select new eligible college football players. It is the NFL’s most common source of player recruitment. NFL Scouting Combine. The NFL Scouting Combine is a week–long showcase, occurring every February in Indianapolis, Indiana’s Lucas Oil Stadium, where college
194
football players perform physical and mental tests in front of National Football League coaches, general managers and scouts prior to the NFL Draft.
195
Appendix B Additional statistical tests This section presents details on the statistical tests conducted in this thesis, e.g., tests for normal distribution. For this, this section is organized to reflect the respective modeling sessions.
B.1 M S2 : Modeling and reconciliation B.1.1 Tests for normal distribution This section contains tests for normal distribution conducted during the analysis of M S2 . Variable
N
D
p
Comprehension Modeling Reconciliation
24 24 24
0.57 0.46 1.31
0.901 0.986 0.067
a
significant at the 0.05 level
Table B.1: Kolmogorov–Smirnov Tests for M S2
197
B.2 M S3 : Process of Process Modeling Behavior Patterns B.2.1 Tests for normal distribution This section presents tests for normal distribution conducted during the analysis of M S3 . Variable
N
D
instance time comprehension time modeling time reconciliation time iterations
106 106 106 106 106
0.047 0.066 0.113 0.082 0.061
0.200 0.200 0.002a 0.073 0.200
Initial comprehension duration
105
0.053
0.200
Comprehension phases Avg. comprehension duration Share of comprehension
106 106 106
0.095 0.098 0.047
0.020a 0.013a 0.200
Modeling phases Avg. modeling phase size Adding rate Iteration chunk size
106 106 106 106
0.075 0.147 0.096 0.171
0.168 0.000a 0.017a 0.000a
PPM Total Total Total PPM
a
p
significant at the 0.05 level
Table B.2: Kolmogorov–Smirnov Tests with Lilliefors significance correction for PBP1–PBP3 in M S3
198
Variable
N
D
106 106 106 106 106
0.088 0.123 0.088 0.140 0.082
0.042a 0.000a 0.040a 0.000a 0.080
Reconciliation interactions PBP4 Reconciliation phases PBP4 Avg. reconciliation phase size PBP4 Max. reconciliation phase size PBP4 Avg. number of moves per node PBP4
51 51 51 51 51
0.078 0.178 0.082 0.146 0.083
0.200 0.000a 0.200 0.009a 0.200
Reconciliation interactions PBP5 Reconciliation phases PBP5 Avg. reconciliation phase size PBP5 Max. reconciliation phase size PBP5 Avg. number of moves per node PBP5
55 55 55 55 55
0.105 0.069 0.098 0.129 0.156
0.195 0.200 0.200 0.022a 0.002a
Reconciliation interactions PBP5a Reconciliation phases PBP5a Avg. reconciliation phase size PBP5a Max. reconciliation phase size PBP5a Avg. number of moves per node PBP5a
34 34 34 34 34
0.089 0.093 0.087 0.175 0.143
0.200 0.200 0.200 0.010a 0.076
Reconciliation interactions PBP5b Reconciliation phases PBP5b Avg. reconciliation phase size PBP5b Max. reconciliation phase size PBP5b Avg. number of moves per node PBP5b
21 21 21 21 21
0.145 0.104 0.128 0.131 0.265
0.200 0.200 0.200 0.200 0.000a
106 106 106
0.085 0.148 0.066
0.059 0.000a 0.200
Reconciliation interactions Reconciliation phases Avg. reconciliation phase size Max. reconciliation phase size Avg. number of moves per node
Modeling interactions Delete interactions Delete iterations a
p
significant at the 0.05 level
Table B.3: Kolmogorov–Smirnov Tests with Lilliefors significance correction for PBP4–PBP7 in M S3
199
B.3 M S4 : Styles in business process modeling This section presents additional statistical tests conducted in M S4 . First, tests for normal distribution are presented. Then, details on the conducted tests for performing the cluster validation are presented.
B.3.1 Tests for normal distribution This section presents tests for normal distribution conducted during the analysis of M S4 . Pre–Flight This section presents tests for normal distribution for the Pre–Flight task. Variable
N
D
Adding interactions Delete interactions Reconciliation interactions
115 115 115
0.104 0.174 0.138
0.004a 0.000a 0.000a
PPM iterations Initial comprehension duration Comprehension phases Avg. comprehension duration Share of comprehension Modeling phases Avg. modeling phase size Iteration chunk size Adding rate Reconciliation phases Avg. reconciliation phase size Max. reconciliation phase size Avg. number of moves per node Delete iterations
115 115 115 115 115 115 115 115 115 115 115 115 115 115
0.126 0.163 0.106 0.135 0.056 0.140 0.176 0.153 0.118 0.147 0.151 0.182 0.140 0.122
0.000a 0.000a 0.003a 0.000a 0.200 0.000a 0.000a 0.000a 0.000a 0.000a 0.000a 0.000a 0.000a 0.000a
Mental effort
115
0.216
0.000a
a
p
significant at the 0.05 level
Table B.4: Kolmogorov–Smirnov tests with Lilliefors significance correction for the full Pre–Flight data set in M S4
200
Variable
N
D
Adding interactions Delete interactions Reconciliation interactions
42 42 42
0.111 0.085 0.199
0.200 0.200 0.000a
PPM iterations Initial comprehension duration Comprehension phases Avg. comprehension duration Share of comprehension Modeling phases Avg. modeling phase size Iteration chunk size Adding rate Reconciliation phases Avg. reconciliation phase size Max. reconciliation phase size Avg. number of moves per node Delete iterations
42 42 42 42 42 42 42 42 42 42 42 42 42 42
0.096 0.233 0.111 0.191 0.085 0.088 0.138 0.081 0.179 0.134 0.244 0.184 0.203 0.086
0.200 0.000a 0.200 0.001a 0.200 0.200 0.043 0.200 0.002a 0.057 0.000a 0.001a 0.000a 0.200
Mental effort
42
0.194
0.000a
a
p
significant at the 0.05 level
Table B.5: Kolmogorov–Smirnov tests with Lilliefors significance correction for Pre– Flight cluster C1 in M S4
201
Variable
N
D
Adding interactions Delete interactions Reconciliation interactions
22 22 22
0.166 0.218 0.160
0.119 0.008a 0.147
PPM iterations Initial comprehension duration Comprehension phases Avg. comprehension duration Share of comprehension Modeling phases Avg. modeling phase size Iteration chunk size Adding rate Reconciliation phases Avg. reconciliation phase size Max. reconciliation phase size Avg. number of moves per node Delete iterations
22 22 22 22 22 22 22 22 22 22 22 22 22 22
0.166 0.129 0.128 0.178 0.114 0.187 0.213 0.200 0.155 0.128 0.136 0.190 0.156 0.213
0.117 0.200 0.200 0.067 0.200 0.043a 0.010a 0.023a 0.184 0.200 0.200 0.037a 0.178 0.011a
Mental effort
22
0.276
0.000a
a
p
significant at the 0.05 level
Table B.6: Kolmogorov–Smirnov tests with Lilliefors significance correction for Pre– Flight cluster C2 in M S4
202
Variable
N
D
Adding interactions Delete interactions Reconciliation interactions
49 49 49
0.113 0.207 0.072
0.154 0.000a 0.200
PPM iterations Initial comprehension duration Comprehension phases Avg. comprehension duration Share of comprehension Modeling phases Avg. modeling phase size Iteration chunk size Adding rate Reconciliation phases Avg. reconciliation phase size Max. reconciliation phase size Avg. number of moves per node Delete iterations
49 49 49 49 49 49 49 49 49 49 49 49 49 49
0.114 0.138 0.111 0.157 0.088 0.132 0.135 0.140 0.112 0.147 0.153 0.252 0.098 0.172
0.135 0.021a 0.180 0.004a 0.200 0.032a 0.025a 0.017a 0.170 0.010a 0.006a 0.000a 0.200 0.001a
Mental effort
49
0.251
0.000a
a
p
significant at the 0.05 level
Table B.7: Kolmogorov–Smirnov tests with Lilliefors significance correction for Pre– Flight cluster C3 in M S4
203
NFL Draft This section presents tests for normal distribution for the NFL Draft task. Variable
N
D
Adding interactions Delete interactions Reconciliation interactions
115 115 115
0.146 0.215 0.118
0.000a 0.000a 0.000a
PPM iterations Initial comprehension duration Comprehension phases Avg. comprehension duration Modeling phases Avg. modeling phase size Iteration chunk size Share of comprehension Adding rate Reconciliation phases Avg. reconciliation phase size Max. reconciliation phase size Avg. number of moves per node Delete iterations
115 115 115 115 115 115 115 115 115 115 113 113 115 115
0.116 0.158 0.115 0.125 0.124 0.113 0.103 0.050 0.126 0.129 0.136 0.163 0.127 0.210
0.001a 0.000a 0.001a 0.000a 0.000a 0.001a 0.004a 0.200 0.000a 0.000a 0.000a 0.000a 0.000a 0.000a
Mental effort
115
0.227
0.000a
a
p
significant at the 0.05 level
Table B.8: Kolmogorov–Smirnov tests with Lilliefors significance correction for the full NFL Draft data set in M S4
204
Variable
N
D
Adding interactions Delete interactions Reconciliation interactions
31 31 31
0.130 0.207 0.119
0.192 0.002a 0.200
PPM iterations Initial comprehension duration Comprehension phases Avg. comprehension duration Share of comprehension Modeling phases Avg. modeling phase size Iteration chunk size Adding rate Reconciliation phases Avg. reconciliation phase size Max. reconciliation phase size Avg. number of moves per node Delete iterations
31 31 31 31 31 31 31 31 31 31 31 31 31 31
0.108 0.151 0.151 0.174 0.072 0.140 0.157 0.148 0.135 0.116 0.175 0.176 0.155 0.161
0.200 0.070 0.069 0.018a 0.200 0.124 0.050 0.081 0.159 0.200 0.016a 0.015a 0.056 0.039a
Mental effort
31
0.195
0.004a
a
p
significant at the 0.05 level
Table B.9: Kolmogorov–Smirnov tests with Lilliefors significance correction for NFL Draft cluster C1 in M S4
205
Variable
N
D
Adding interactions Delete interactions Reconciliation interactions
30 30 30
0.178 0.204 0.156
0.017a 0.003a 0.061
PPM iterations Initial comprehension duration Comprehension phases Avg. comprehension duration Share of comprehension Modeling phases Avg. modeling phase size Iteration chunk size Adding rate Reconciliation phases Avg. reconciliation phase size Max. reconciliation phase size Avg. number of moves per node Delete iterations
30 30 30 30 30 30 30 30 30 30 29 29 30 30
0.124 0.130 0.182 0.126 0.097 0.126 0.103 0.144 0.161 0.157 0.149 0.185 0.117 0.215
0.200 0.200 0.012a 0.200 0.200 0.200 0.200 0.116 0.047a 0.057 0.096 0.012a 0.200 0.001a
Mental effort
30
0.204
0.003a
a
p
significant at the 0.05 level
Table B.10: Kolmogorov–Smirnov tests with Lilliefors significance correction for NFL Draft cluster C2 in M S4
206
Variable
N
D
Adding interactions Delete interactions Reconciliation interactions
42 42 42
0.224 0.216 0.126
0.000a 0.000a 0.092
PPM iterations Initial comprehension duration Comprehension phases Avg. comprehension duration Share of comprehension Modeling phases Avg. modeling phase size Iteration chunk size Adding rate Reconciliation phases Avg. reconciliation phase size Max. reconciliation phase size Avg. number of moves per node Delete iterations
42 42 42 42 42 42 42 42 42 42 41 41 42 42
0.143 0.093 0.122 0.149 0.084 0.167 0.153 0.110 0.152 0.197 0.189 0.215 0.195 0.245
0.030a 0.200 0.200 0.020a 0.200 0.005a 0.015a 0.200 0.016a 0.000a 0.001a 0.000a 0.000a 0.000a
Mental effort
42
0.250
0.000a
a
p
significant at the 0.05 level
Table B.11: Kolmogorov–Smirnov tests with Lilliefors significance correction for NFL Draft cluster C3 in M S4
207
B.3.2 Tests for cluster validation This section presents details on the statistical test for comparing the individual clusters. Pairwise comparisons are only conducted if the group comparisons indicate significant differences. Pre–Flight This section presents details on the statistical tests conducted for cluster validation for the Pre–Flight task. df between groups
df within groups
F
2 2
110 110
11.07 9.95
Adding interactions Share of comprehension a
p
ηp2
0.000a 0.167 0.000a 0.153
significant at the 0.05 level Table B.12: Oneway ANOVA for group comparisons
Cluster I J
Mean difference (I–J)
Standard error
Adding interactions
C1 C1 C2
C2 C3 C3
8.45 8.79 0.34
2.50 1.99 2.43
0.003a 0.000a 0.989
Share of comprehension
C1 C1 C2
C2 C3 C3
10.71 4.69 -6.02
2.42 1.93 2.36
0.000a 0.044a 0.032a
a
significant at the 0.05 level Table B.13: Tukey HSD post–hoc tests for pairwise comparisons
208
p
χ2
df
Delete interactions Reconciliation interaction
23.63 27.54
2 2
0.000a 0.000a
PPM iterations Initial comprehension duration Comprehension phases Avg. comprehension duration Modeling phases Avg. modeling phase size Iteration chunk size Adding rate Reconciliation phases Avg. reconciliation phase size Max. reconciliation phase size Avg. number of moves per node Delete iterations
55.88 21.56 48.30 21.29 47.99 17.52 26.71 20.68 27.63 2.25 8.55 20.31 10.04
2 2 2 2 2 2 2 2 2 2 2 2 2
0.000a 0.000a 0.000a 0.000a 0.000a 0.000a 0.000a 0.000a 0.000a 0.325 0.014a 0.000a 0.007a
a
p
significant at the 0.05 level
Table B.14: Kruskall–Wallis tests for group comparisons
Clusters
T
df
p
r
PPM iterations
C1 C1 C2
C2 C3 C3
7.71 7.90 -3.32
62.00 58.78 69.00
0.000a 0.70 0.000a 0.72 0.001a 0.37
Comprehension phases
C1 C1 C2
C2 C3 C3
7.60 6.39 -3.89
62.00 65.84 69.00
0.000a 0.69 0.000a 0.62 0.001a 0.46
a
significant at the 0.05/3 level Table B.15: T–tests for pairwise comparisons
209
Clusters Delete interactions
U
p 0.000a
r
C1 C1 C2
C2 C3 C3
192.50 486.00 509.50
0.000a
Reconciliation interactions
C1 C1 C2
C2 C3 C3
226.00 382.50 524.50
0.001a -0.42 0.000a -0.54 0.857 -0.02
Initial comprehension duration
C1 C1 C2
C2 C3 C3
222.00 880.00 162.00
0.001a -0.42 0.236 -0.12 0.000a -0.56
Avg. comprehension duration
C1 C1 C2
C2 C3 C3
160.00 724.00 285.50
0.000a -0.40 0.015a -0.23 0.002a -0.30
Modeling phases
C1 C1 C2
C2 C3 C3
60.00 353.50 280.00
0.000a -0.54 0.000a -0.51 0.001a -0.31
Avg. modeling phase size
C1 C1 C2
C2 C3 C3
180.50 857.00 271.00
0.000a -0.37 0.171 -0.13 0.001a -0.31
Iteration chunk size
C1 C1 C2
C2 C3 C3
136.50 613.00 290.00
0.000a -0.58 0.001a -0.35 0.002a -0.37
Adding rate
C1 C1 C2
C2 C3 C3
142.00 877.50 261.50
0.000a -0.57 0.223 -0.13 0.001a -0.41
a
0.712
-0.48 -0.45 -0.04
significant at the 0.05/3 level Table B.16: Mann–Whitney U–tests for pairwise comparisons
210
Clusters
U
p
r
C1 C1 C2
C2 C3 C3
204.00 407.50 532.00
0.000a
Max. reconciliation phase size
C1 C1 C2
C2 C3 C3
375.00 675.50 423.50
0.218 -0.15 0.005a -0.30 0.150 -0.17
Avg. number of moves per node
C1 C1 C2
C2 C3 C3
274.00 471.00 478.00
0.008a -0.33 0.000a -0.47 0.448 -0.09
Delete iterations
C1 C1 C2
C2 C3 C3
294.00 667.50 530.00
0.017 -0.30 0.004a -0.30 0.909 -0.01
Reconciliation phases
a
0.000a 0.930
-0.46 -0.52 -0.01
significant at the 0.05/3 level Table B.17: Mann–Whitney U–tests for pairwise comparisons
211
NFL Draft This section presents details on the statistical tests conducted for cluster validation for the NFL Draft task. df between groups
df within groups
F
2 2
100 100
16.52 2.97
Reconciliation interactions Share of comprehension a
p
ηp2
0.000a 0.248 0.056 0.056
significant at the 0.05 level Table B.18: Oneway ANOVA for group comparisons
Cluster I J Reconciliation interactions
a
C1 C1 C2
C2 C3 C3
Mean difference (I–J)
Standard error
24.20 22.77 -1.43
4.85 4.49 4.53
significant at the 0.05 level Table B.19: Tukey HSD post–hoc tests for pairwise comparisons
212
p 0.000a 0.000a 0.946
χ2
df
Adding interactions Delete interactions
23.67 11.61
2 2
0.000a 0.003a
PPM iterations Initial comprehension duration Comprehension phases Avg. comprehension duration Modeling phases Avg. modeling phase size Iteration chunk size Adding rate Reconciliation phases Avg. reconciliation phase size Max. reconciliation phase size Avg. number of moves per node Delete iterations
33.60 16.30 36.11 6.87 26.27 7.04 11.31 22.32 25.73 3.38 11.28 3.15 1.08
2 2 2 2 2 2 2 2 2 2 2 2 2
0.000a 0.000a 0.030a 0.032a 0.000a 0.030a 0.003a 0.000a 0.000a 0.184 0.004a 0.207 0.583
a
p
significant at the 0.05 level
Table B.20: Kruskall–Wallis tests for group comparisons
Clusters
T
df
p
r
Iteration chunk size
C1 C1 C2
C2 C3 C3
-3.77 -1.37 2.62
43.95 71.00 70.00
0.000a 0.49 0.175 0.16 0.011a 0.30
Initial comprehension duration
C1 C1 C2
C2 C3 C3
4.00 1.38 -4.57
34.95 44.62 63.19
0.000a 0.56 0.175 0.20 0.000a 0.50
a
significant at the 0.05/3 level Table B.21: T–tests for pairwise comparisons
213
Clusters
U
p
r
Adding interactions
C1 C1 C2
C2 C3 C3
180.50 261.00 605.50
0.000a 0.000a 0.779
-0.53 -0.51 -0.03
Delete interactions
C1 C1 C2
C2 C3 C3
249.50 404.50 585.00
0.002a 0.005a 0.602
-0.40 -0.33 -0.06
PPM iterations
C1 C1 C2
C2 C3 C3
102.50 297.50 368.50
0.000a 0.000a 0.003a
-0.67 -0.46 -0.35
Comprehension phases
C1 C1 C2
C2 C3 C3
83.50 358.50 294.50
0.000a -0.545 0.001a -0.324 0.000a -0.381
Avg. comprehension duration
C1 C1 C2
C2 C3 C3
310.00 645.00 424.00
Modeling phases
C1 C1 C2
C2 C3 C3
140.50 372.50 369.50
0.000a -0.463 0.002a -0.309 0.003a -0.296
Avg. modeling phase size
C1 C1 C2
C2 C3 C3
286.00 568.50 466.00
0.010a -0.254 0.357 -0.091 0.061 -0.185
Adding rate
C1 C1 C2
C2 C3 C3
130.50 433.50 419.50
0.000a 0.015a 0.016a
-0.62 -0.29 -0.28
Reconciliation phases
C1 C1 C2
C2 C3 C3
160.00 260.00 601.00
0.000a 0.000a 0.735
-0.57 -0.52 -0.04
Max. reconciliation phase size
C1 C1 C2
C2 C3 C3
301.00 352.00 498.50
0.028 0.001a 0.251
-0.28 -0.38 -0.14
a
0.025 0.947 0.019
-0.220 -0.007 -0.232
significant at the 0.05/3 level Table B.22: Mann–Whitney U–tests for pairwise comparisons
214
Appendix C Supplementary Information This section provides supplementary information. Section C.1 details on the publications of the author. Section C.2 summarizes the abbreviations used in this thesis. Finally, Section C.3 concludes the thesis with an analysis of the process of thesis writing.
C.1 Publications Throughout the course of this thesis, I had the pleasure to work with researchers around the globe. This unparalleled learning experience was essential for the success of this thesis. In this context, the author was involved in several publications building the foundation for this thesis. An overview of all publications, the author was involved in, can be found in Figure C.1. The publications which constitute the basis for this thesis are marked in circles. In these publication, the author of this thesis was the driving force. Contributions of other authors to these publications are presented subsequently. Regarding the backgrounds presented in this thesis, Markus Martini contributed to the description of working memory (cf. Section 4.1.1). CEP constitutes a collaborative effort together with Stefan Zugal. The first description of CEP was published in [194]. In the PhD thesis of Stefan Zugal complementary information regarding CEP can be found [311]. An initial description of the PPM and MPDs was presented in [197], constituting the foundation for Chapter 6. Another publication, contributing to Chapter 6, is currently under review. In this context, Dirk Fahland created the first version of Figure 6.1 and Figure 6.5. Further, Anthi Xydis supported the author with the data collection and transcription of the verbal protocols of M S1 and Stefan Zugal was the second researcher coding the think aloud protocols of M S1 . Katharina Reiter was involved in the organization of the data collection of M S2 . Dirk Fahland supported the author when developing the measures for quantifying the PPM (cf. Chapter 7). Irene Vanderfeesten was responsible for executing M S3 in Eindhoven. The cluster analysis conducted in Chapter 8 is based on [190, 191].
215
Several changes were made to [190, 191], including the addition of new measures to form the final version of Chapter 8. In this context, Hajo Reijers and Jan Mendling conducted M S4 in Eindhoven and Berlin respectively. Further, Matthias Weidlich contributed the analysis of the clusters’ representatives (cf. Section 8.3) and Jan Mendling contributed to the section on the stability of measures (cf. Section 8.4.2). Pnina Soffer contributed to the first version of the model presented in Section 9.3. Parts of the future work described in Section 9.5 have been presented in [192]. [192] and Section 9.5 are based on the project proposal of Modeling Mind, which was created in collaboration with Barbara Weber and Stefan Zugal. Additionally, [188, 195] present work directly related to this stream of research, which have not been used in this thesis.
C.2 Abbreviations In this thesis several abbreviations were used. Even though we tried to introduce all abbreviations on first use, Table C.1 provides an overview of all abbreviations. Abbreviation
Full name
ACM ANOVA BPM BPMN CBS CEP CHES CLT CMR COMA cPPM CSV EPC EUR HSD IEEE IS LNCS M MAD
Association for Computing Machinery Analysis of variance Business Process Management Business Process Model and Notation Columbia Broadcasting System Cheetah Experimental Platform Computer–based Health Evaluation System Cognitive Load Theory Comprehension, modeling, reconciliation Collaborative Modeling Architecture Collaborative Process of Process Modeling Comma–separated Values Event–Driven Process Chain Euro Honestly Significant Difference Institute of Electrical and Electronics Engineers Information Systems Lecture Notes in Computer Science Mean Median Absolute Deviation
216
Abbreviation
Full name
Mdn MIT MPD MXML NFL OMG OO PAIS PBP PDF PNG PPM RDF RQ SD SEQUAL SIGCSE SIGKDD
Median Massachusetts Institute of Technology Modeling Phase Diagram Mining eXtensible Markup Language National Football League Object Management Group Object–oriented Process Aware Information System PPM Behavior Pattern Portable Document Format Portable Network Graphics Process of Process Modeling Resource Description Framework Research Question Standard Deviation Semiotic Quality Framework Special Interest Group on Computer Science Education Special Interest Group on Knowledge Discovery and Data Mining SPARQL Protocol and RDF Query Language Statistical Package for Social Sciences Subversion Lamport TeX Unified Modeling Language University of New Orleans Waikato Environment for Knowledge Analysis Extensible Markup Language
SPARQL SPSS SVN LATEX UML UNO WEKA XML
Table C.1: Abbreviations
C.3 Process of thesis writing A thesis on the Process of Process Modeling almost demands a detailed analysis of the process followed to write this thesis. For this purpose, we rely on a Bash script1 1
The script is freely available from: http://bpm.q-e.at/misc/ThesisEvolution
217
[294] [180] [181] [93]
Imperative Process Models
[186] [94]
Understandability
[92] [189]
[316] [314] [315]
Declarative Process Models
[318]
[321]
Modularization
[320] [312] [101] [319] [286] [313] [285] [234] [73]
[74] [190] [192]
[317]
[284] [188]
Process of Process Modeling
[283]
[194]
Tools for Empirical Research
[195] [110]
[292] [28] [191] [197] [30]
[293]
[29] [193]
Process Flexibility
[196] [187] [286] [124]
Semantic Web and Medical Informatics [54]
Figure C.1: All publications, organized by topic
218
[55]
[53]
developed by Stefan Zugal and presented in his PhD thesis to analyze the process of thesis writing. The script analyzes the LATEXsources of all intermediate versions of this thesis by obtaining all revisions from a SVN2 repository. A set of measures for each version is calculated, i.e., number of pages, number of references, number of figures, and number of tables. For details we refer to [311]. 350
pages references figures tables
300
Amount
250
200
150
100
50
0 1
6
11
16
21
26
31
36
41
46
51
56
61
66
71
76
81
86
91
SVN revision
Figure C.2: Process of thesis writing
Figure C.2 illustrates the process of thesis writing. In a nutshell, similar observations as described in [311] can made. For instance, we observe several steep phases of writing, where the number of pages increases quickly. In such phases, the author could rely on material that was previously published, e.g., revision 41 marks the addition of Chapter 8, which is based on [190, 191]. Along with the increase of pages, the number of tables increases quickly after revision 41. The existence of previously published material allowed the author to quickly add new content to the thesis. Each steep writing phase was followed by phases of reconciliation, where the number of pages only increased mildly or even decreased. As for the PPM, reconciliation phases were intended to improve the understandability of the added content, without adding new content. In such phases, the author was mostly concerned with linking the added material to the rest of the thesis. Finally, we observe several phases of steady writing. For instance, starting from revision 46, a steady increase 2
http://subversion.apache.org
219
of pages can be observed. During this time, several smaller chapters were written, e.g., Chapter 2. It should be noted that the time between revisions differs significantly. Especially toward the end of the thesis, several revisions were created on the same day as different tasks were completed. Finally, I would like to conclude this thesis with yet another measure. In total, this PhD required 4209 cups of coffee, which makes an average coffee consumption of 16 cups of coffee per page.
220
Bibliography [1] E. R. Aguilar, F. Ruiz, F. Garc´ıa, and M. Piattini. Evaluation measures for business process models. In Proc. SAC’06, pages 1567–1568, 2006. [2] E. R. Aguilar, L. Sanchez, F. G. Carballeira, F. Ruiz, M. Piattini, D. Caivano, and G. Visaggio. Prediction Models for BPMN Usability and Maintainability. In Proc. CEC’09, pages 383–390, 2009. [3] C. Alexander, S. Ishikawa, and M. Silverstein. A Pattern Language: Towns, Buildings, Construction. Oxford University Press, 1977. [4] J. R. Anderson. Acquisition of cognitive skill. Psychological Review, 89(4):369– 406, 1982. [5] M. J. Anderson. Some evidence on the effect of verbalization on process: A methodological note. Journal of Accounting Research, 23(2):843–852, 1985. [6] P. Andreßen and U. Konradt. Messung von Selbstf¨ uhrung: Psychometrische ¨ Uberpr¨ ufung der deutschsprachigen Version des Revised Self–Leadership Questionnaire. Zeitschrift f¨ ur Personalpsychologie, 6(3):117–128, 2007. [7] Y. L. Antonucci and R. J. Goeke. Identification of appropriate responsibilities and positions for business process management success. Business Process Management Journal, 17(1):127–146, 2011. [8] E. Arisholm and D. I. K. Sj¨ oberg. Evaluating the Effect of a Delegated versus Centralized Control Style on the Maintainability of Object–Oriented Software. IEEE Transactions on Software Engineering, 30(8):521–534, 2004. [9] D. J. Armstrong and B. C. Hardgrave. Understanding Mindshift Learning: The Transition to Object–Oriented Development. Management Information Systems Quarterly, 31(3):453–474, 2007. [10] A. Baddeley. Working Memory: Theories, Models, and Controversies. Annual review of psychology, 63(1):1–29, 2012.
221
Bibliography [11] A. Baddeley, M. W. Eysenck, and M. C. Anderson. Memory. Psychology Press, 2009. [12] W. Bandara, G. G. Gable, and M. Rosemann. Factors and measures of business process modelling: model building through a multiple case study. European Journal of Information Systems, 14(4):347–360, 2005. [13] F. C. Bartlett. Remembering: A Study in Experimental and Social Psychology. Cambridge University Press, 1932. [14] V. R. Basili. The Role of Experimentation in Software Engineering: Past, Current, and Future. In Proc. ICSE’96, pages 442–449, 1996. [15] J. Becker, M. Rosemann, and C. von Uthmann. Guidelines of business process modeling. In BPM, volume 1806 of LNCS, pages 241–262. Springer, 2000. [16] A. Biemiller and D. Meichenbaum. The nature and nurture of the self–directed learner. Educational Leadership, 50(2):75–80, 1992. [17] Z. Bilda, J. S. Gero, and T. Purcell. To sketch or not to sketch? that is the question. Design studies, 27(5):587–613, 2006. [18] T. Boren and J. Ramey. Thinking aloud: Reconciling theory and practice. IEEE Transactions on Professional Communication, 43(3):261–278, 2000. [19] J. L. Branch. Junior high students and think alouds: Generating information– seeking process data using concurrent verbal protocols. Library & Information Science Research, 23(2):107–122, 2001. [20] R. Brooks. Towards a theory of the cognitive processes in computer programming. International Journal of Man–Machine Studies, 9(6):737–751, 1977. [21] S. N. Cant, D. R. Jeffery, and B. Henderson-Sellers. A conceptual model of cognitive complexity of elements of the programming process. Information and Software Technology, 37(7):351–362, 1995. [22] J. Cardoso. Business process control–flow complexity: Metric, evaluation, and validation. International Journal of Web Services Research, 5(2):49–76, 2008. [23] F. Casati. Models, Semantics, and Formal Methods for the design of Workflows and their Exceptions. PhD thesis, Milano, 1998.
222
Bibliography [24] G. Cepeda Porras and Y. Gu´eh´eneuc. An empirical study on the efficiency of different design pattern representations in UML class diagrams. Empirical Software Engineering, 15(5):493–522, 2010. [25] W. Chase and H. Simon. The mind’s eye in chess. In W. Chase, editor, Visual information processing, pages 215–281. Academic Press, 1973. [26] W. Chase and H. Simon. Perception in chess. Cognitive Psychology, 4(1):55– 81, 1973. [27] J. Claes, F. Gailly, and G. Poels. Cognitive Aspects of Structured Process Modeling. In Proc. Cognise’13, pages 168–173, 2013. [28] J. Claes, I. Vanderfeesten, J. Pinggera, H. A. Reijers, B. Weber, and G. Poels. Visualizing the Process of Process Modeling with PPMCharts. In Proc. TAProViz’12, pages 744–755, 2013. [29] J. Claes, I. Vanderfeesten, J. Pinggera, H. A. Reijers, B. Weber, and G. Poels. A visual analysis of the process of process modeling. Information Systems and e–Business Management, pages 1–44, 2014. [30] J. Claes, I. Vanderfeesten, H. A. Reijers, J. Pinggera, M. Weidlich, S. Zugal, D. Fahland, B. Weber, J. Mendling, and G. Poels. Tying Process Model Quality to the Modeling Process: The Impact of Structuring, Movement, and Speed. In Proc. BPM’12, pages 33–48, 2012. [31] N. Clever, J. Holler, M. Shitkova, and J. Becker. Towards auto–suggested process modeling—prototypical development of an auto–suggest component for process modeling tools. In Proc. EMISA’13, pages 133–145, 2013. [32] J. Cohen. Statistical Power Analysis for the Behavioral Sciences. Lawrence Erlbaum Associates, 1988. [33] J. Cohen. Statistical power analysis. Current directions in psychological science, 1(3):98–101, 1992. [34] A. R. Conway, N. Cowan, M. F. Bunting, D. J. Therriault, and S. R. B. Minkoff. A latent variable analysis of working memory capacity, short–term memory capacity, processing speed, and general fluid intelligence. Intelligence, 30(2):163–183, 2002. [35] L. Cooke and E. Cuddihy. Using Eye Tracking to Address Limitations in Think–Aloud Protocol. In Proc. IPCC’05, pages 653–658, 2005.
223
Bibliography [36] G. F. Costain. Cognitive Support during Object–Oriented Software Development: The Case of UML Diagrams. PhD thesis, University of Auckland, 2007. [37] L. D. Couglin and V. L. Patel. Processing of critical information by physicians and medical students. Journal of Medical Education, 62(10):818–828, 1987. [38] N. Cowan. The magical number 4 in short–term memory: A reconsideration of mental storage capacity. Behavioral and Brain Sciences, 24(1):87–185, 2001. [39] N. Cowan. Working memory capacity. Psychology Press, 2005. [40] A. W. Crapo, L. B. Waisel, W. A. Wallace, and T. R. Willemain. Visualization and the process of modeling: a cognitive–theoretic view. In Proc. KDD’00, pages 218–226, 2000. [41] J. Creswell. Research Design: Qualitative, Quantitative and Mixed Method Approaches. Sage Publications, 2002. [42] B. Curtis, M. I. Kellner, and J. Over. Process modeling. Communications of the ACM, 35(9):75–90, 1992. [43] P. Dadam and M. Reichert. The ADEPT project: a decade of research and development for robust and flexible process support. Computer Science— Research and Development, 23(2):81–97, 2009. [44] D. Damian, A. Eberlein, M. Shaw, and B. Gaines. Using Different Communication Media in Requirements Negotiation. IEEE Software, 17(3):28–36, 2000. [45] I. Davies, P. Green, M. Rosemann, M. Indulska, and S. Gallo. How do practitioners use conceptual modeling in practice? Data & Knowledge Engineering, 58(3):358–380, 2006. [46] F. D. Davis. Perceived Usefulness, Perceived Ease of Use, and User Acceptance of Information Technology. Management Information Systems Quarterly, 13(3):319–340, 1989. [47] A. K. A. de Medeiros, A. Guzzo, G. Greco, W. M. P. van der Aalst, A. J. M. M. Weijters, B. F. van Dongen, and D. Sacc`a. Process mining based on clustering: A quest for precision. In Proc. BPI’07, pages 17–29, 2008. [48] N. K. Denzin. The Research Act, 2nd ed. McGraw–Hill, 1987.
224
Bibliography [49] F. D´etienne. Design Strategies and Knowledge in Object–Oriented Programming: Effects of Experience. Human–Computer Interaction, 10(2):129–169, 1995. [50] F. D´etienne. Assessing the cognitive consequences of the object–oriented approach: a survey of empirical research on object–oriented design by individuals and teams. Interacting with Computers, 9:47–72, 1997. [51] R. Dijkman, B. Gfeller, J. K¨ uster, and H. V¨olzer. Identifying refactoring opportunities in process model repositories. Information and Software Technology, 53(9):937–948, 2011. [52] T. C. DiLiello and J. D. Houghton. Maximizing organizational leadership capacity for the future: Toward a model of self–leadership, innovation and creativity. Journal of Managerial Psychology, 21(4):319–337, 2006. [53] M. Droop, M. Flarer, J. Groppe, S. Groppe, V. Linnemann, J. Pinggera, F. Santner, M. Schier, F. Sch¨ opf, H. Staffler, and S. Zugal. Translating XPath Queries into SPARQL Queries. In Proc. OTM Workshops’07, pages 9–10, 2007. [54] M. Droop, M. Flarer, J. Groppe, S. Groppe, V. Linnemann, J. Pinggera, F. Santner, M. Schier, F. Sch¨ opf, H. Staffler, and S. Zugal. Embedding Xpath Queries into SPARQL Queries. In Proc. ICEIS’08, pages 5–14, 2008. [55] M. Droop, M. Flarer, J. Groppe, S. Groppe, V. Linnemann, J. Pinggera, F. Santner, M. Schier, F. Sch¨ opf, H. Staffler, and S. Zugal. Bringing the XML and Semantic Web Worlds Closer: Transforming XML into RDF and Embedding XPath into SPARQL. In Proc. ICEIS’08, pages 31–45, 2009. [56] B. du Bois. A Study of Quality Improvements By Refactoring. PhD thesis, Universiteit Antwerpen, 2006. [57] A. T. Duchowski. A breadth–first survey of eye–tracking applications. Behavior Research Methods, Instruments, & Computers, 34(4):455–470, 2002. [58] M. Dumas, L. Garc´ıa–Ba˜ nuelos, M. L. Rosa, and R. Uba. Fast Detection of Exact Clones in Repositories of Business Process Models. Information Systems, 38(4):619–633, 2013. [59] M. Dumas, W. M. P. van der Aalst, and A. H. M. ter Hofstede. Process Aware Information Systems: Bridging People and Software Through Process Technology. Wiley–Interscience, 2005.
225
Bibliography [60] S. Easterbrook. Resolving requirements conflicts with computer–supported negotiation. In Requirements engineering, pages 41–65. Academic Press Professional, Inc., 1994. [61] S. Easterbrook, J. Singer, M.-A. Storey, and D. Damian. Selecting Empirical Methods for Software Engineering Research. In Guide to Advanced Empirical Software Engineering, pages 285–311. Springer, 2008. [62] K. A. Ericsson, W. G. Chase, and S. Faloon. Acquisition of a memory skill. Science, 208(4448):1181–1182, 1980. [63] K. A. Ericsson and W. Kintsch. Long–term working memory. Psychological review, 102(2):211–245, 1995. [64] K. A. Ericsson and J. H. Moxley. Working memory that mediates experts’ performance: Why it is qualitatively different from traditional working memory. In T. P. Alloway and R. G. Alloway, editors, Working memory, the connected intelligence, pages 109–136. Taylor and Francis, 2013. [65] K. A. Ericsson and H. A. Simon. Protocol analysis: Verbal reports as data. MIT Press, 1993. [66] T. Erl. Service–oriented Architecture: Concepts, Technology, and Design. Prentice Hall, 2005. [67] B. S. Everitt, S. Landau, M. Leese, and D. Stahl. Cluster Analysis, 5th ed. Wiley, 2011. [68] J.-D. Fekete, J. J. van Wijk, J. T. Stasko, and C. North. The value of information visualization. In A. Kerren, J. Stasko, J.-D. Fekete, and C. North, editors, Information Visualization, pages 1–18. Springer, 2008. [69] M. Fellmann, N. Zarvic, and A. Sudau. Ontology–based assistance for semi– formal process modeling. In Proc. EMISA’13, pages 117–132, 2013. [70] K. Figl and R. Laue. Cognitive Complexity in Business Process Modeling. In Proc. CAiSE’11, pages 452–466, 2012. [71] A. Finkelsetin, J. Kramer, B. Nuseibeh, L. Finkelstein, and M. Goedicke. Viewpoints: A Framework for Integrating Multiple Perspectives in System Development. International Journal of Software Engineering and Knowledge Engineering, 2(1):31–58, 1992.
226
Bibliography [72] S. Forster. Investigating the Collaborative Process of Process Modeling. In CAiSE 2013 Doctoral Consortium, pages 33–41, 2013. [73] S. Forster, J. Pinggera, and B. Weber. Collaborative Business Process Modeling. In Proc. EMISA’12, pages 81–94, 2012. [74] S. Forster, J. Pinggera, and B. Weber. Toward an Understanding of the Collaborative Process of Process Modeling. In Proc. CAiSE Forum’13, pages 98–105, 2013. [75] M. Fowler. Refactoring: Improving the Design of Existing Code. Addison– Wesley, 1999. [76] P. J. M. Frederiks and T. P. van der Weide. Information modeling: The process and the required competencies of its participants. Data & Knowledge Engineering, 58(1):4–20, 2006. [77] M. Furtner. Self–Leadership: Assoziationen zwischen Self–Leadership, Selbstregulation, Motivation und Leadership. Pabst Science Publishers, 2012. [78] M. Furtner and P. Sachse. The psychology of eye–hand coordination in human computer interaction. In Proc. HCI’08, pages 144–149, 2008. [79] E. Gamma, R. Helm, R. Johnson, and J. Vlissides. Design Patterns. Elements of Reusable Object–Oriented Software. Addison–Wesley Longman, 1994. [80] D. J. Garland and J. R. Barry. Cognitive advantage in sport: The nature of perceptual structures. The American Journal of Psychology, 104(2):211–228, 1991. [81] C. F. Gauss. Bestimmung der Genauigkeit der Beobachtungen. Zeitschrift f¨ ur Astronomie und verwandte Wissenschaften, 1:185–197, 1816. [82] A. L. Gilchrist and N. Cowan. Chunking. In V. S. Ramachandran, editor, The encyclopedia of human behavior, vol. 1, pages 476–483. Academic Press, 2012. [83] J. F. Gilgun. Qualitative Methods in Family Research, chapter Definitions, Methologies, and Methods in Qualitative Family Research, pages 22–39. Sage Publications, 1992. [84] A. Gl¨ockner and A.-K. Herbold. An eye–tracking study on information processing in risky decisions: Evidence for compensatory strategies based on automatic processes. Journal of Behavioral Decision Making, 24(1):71–98, 2011.
227
Bibliography [85] F. Gobet and H. A. Simon. Expert chess memory: Revisiting the chunking hypothesis. Memory, 6(3):225–255, 1998. [86] J. A. Goguen. Requirements engineering as the reconciliation of social and technical issues. In M. Jirotka and J. A. Goguen, editors, Requirements Engineering: Social and Technical Issues, pages 165–199. Academic Press, 1994. [87] G. Greco, A. Guzzo, L. Pontieri, and D. Sacc`a. Mining expressive process models by clustering workflow traces. In Proc. PAKDD’04, pages 52–62, 2004. [88] G. Greco, A. Guzzo, L. Pontieri, and D. Sacc`a. Discovering expressive process models by clustering log traces. IEEE Transactions on Knowledge and Data Engineering, 18(8):1010–1027, 2006. [89] T. R. Green and M. Petre. Usability Analysis of Visual Programming Environments: A Cognitive Dimensions Framework. Journal of Visual Languages & Computing, 7(2):131–174, 1996. [90] T. Gress. Modeling and Changing Business Process Models with Concurrent Task Trees. Master’s thesis, University of Innsbruck, Computer Science, 2012. [91] V. Gruhn and R. Laue. Complexity metrics for business process models. In Proc. BIS’06, pages 1–12, 2006. [92] T. Gschwind, J. Pinggera, S. Zugal, H. A. Reijers, and B. Weber. Edges, Structure, and Constraints: The Layout of Business Process Models. Technical Report RZ3825, IBM Research, 2011. [93] T. Gschwind, J. Pinggera, S. Zugal, H. A. Reijers, and B. Weber. A Linear Time Layout Algorithm for Business Process Models. Technical Report RZ3830, IBM Research, 2012. [94] T. Gschwind, J. Pinggera, S. Zugal, H. A. Reijers, and B. Weber. A linear time layout algorithm for business process models. Journal of Visual Languages & Computing, 2013. DOI: 10.1016/j.jvlc.2013.11.002. [95] A. S. Guceglioglu and O. Demirors. Using Software Quality Characteristics to Measure Business Process Quality. In Proc. BPM’05, pages 374–379, 2005. [96] R. Guindon. Designing the design process: exploiting opportunistic thoughts. Human–Computer Interaction, 5(2):305–344, 1990. [97] R. Guindon. Knowledge exploited by experts during software system design. International Journal of Man–Machine Studies, 33(3):279–304, 1990.
228
Bibliography [98] R. Guindon and B. Curtis. Control of cognitive processes during software design: what tools are needed? In Proc. CHI’88, pages 263–268, 1988. [99] I. Hadar. When intuition and logic clash: The case of the object–oriented paradigm. Science of Computer Programming, 78(9):1407–1426, 2013. [100] I. Hadar and U. Leron. How intuitive is object–oriented design? Communications of the ACM, 51(5):41–46, 2008. [101] C. Haisjackl, S. Zugal, P. Soffer, I. Hadar, M. Reichert, J. Pinggera, and B. Weber. Making Sense of Declarative Process Models: Common Strategies and Typical Pitfalls. In Proc. BPMDS’13, pages 2–17, 2013. [102] M. Hall, E. Frank, G. Holmes, B. Pfahringer, P. Reutemann, and I. H. Witten. The weka data mining software: an update. SIGKDD Explorations Newsletter, 11(1):10–18, 2009. [103] A. Hallerbach, T. Bauer, and M. Reichert. Capturing Variability in Business Process Models: The Provop Approach. Journal of Software Maintenance and Evolution: Research and Practice, 22(6–7):519–546, 2010. [104] D. Z. Hambrick and R. W. Engle. Effects of domain knowledge, working memory capacity, and age on cognitive performance: An investigation of the knowledge–is–power hypothesis. Cognitive Psychology, 44(4):339–387, 2002. [105] G. Hamerly and C. Elkan. Alternatives to the k–means algorithm that find better clusterings. In Proc. CIKM’02, pages 600–607, 2002. [106] A. R. Hevner, S. T. March, J. Park, and S. Ram. Design Science in Information Systems Research. Management Information Systems Quarterly, 28(1):75–105, 2004. [107] E. T. Higgins, A. W. Kruglanski, and A. Pierro. Regulatory mode: Locomotion and assessment as distinct orientations. Advances in Experimental Social Psychology, 35:293–344, 2003. [108] J. B. Hill, J. Sinur, D. Flint, and M. J. Melenovski. Gartner’s position on business process management. Technical report, 2006. [109] F. Hogrebe, N. Gehrke, and M. N¨ uttgens. Eye Tracking Experiments in Business Process Modeling: Agenda Setting and Proof of Concept. In Proc. EMISA’11, pages 183–188, 2011.
229
Bibliography [110] B. Holzner, J. Giesinger, J. Pinggera, S. Zugal, F. Sch¨opf, A. Oberguggenberger, E. Gamper, A. Zabernigg, B. Weber, and G. Rumpold. The Computer– based Health Evaluation Software (CHES): a software for electronic patient– reported outcome monitoring. BMC Medical Informatics and Decision Making, 12(1), 2012. [111] S. J. B. A. Hoppenbrouwers, H. A. Proper, and T. P. van der Weide. Formal Modelling as a Grounded Conversation. In Proc. LAP’05, pages 139–155, 2005. [112] S. J. B. A. Hoppenbrouwers, H. A. Proper, and T. P. van der Weide. A fundamental view on the process of conceptual modeling. In Proc. ER’05, pages 128–143, 2005. [113] M. H¨ ost, B. Regnell, and C. Wohlin. Using Students as Subjects—A Comparative Study of Students and Professionals in Lead–Time Impact Assessment. Empirical Software Engineering, 5(3):201–214, 2000. [114] J. D. Houghton and C. P. Neck. The revised self–leadership questionnaire: Testing a hierarchical factor structure for self–leadership. Journal of Managerial Psychology, 17(8):672–691, 2002. [115] J. Hughes and S. Parkes. Trends in the use of verbal protocol analysis in software engineering research. Behaviour & Information Technology, 22(2):127– 140, 2003. [116] M. Indulska, P. Green, J. Recker, and M. Rosemann. Business process modeling: Perceived benefits. In Proc. ER’09, pages 458–471, 2009. [117] R. J. K. Jacob and K. S. Karn. Eye Tracking in Human–Computer Interaction and Usability Research: Ready to Deliver the Promises. In The mind’s eye. Cognitive and applied aspects of eye movement research, pages 573–603. Elsevier, 2003. [118] R. Jeffries, A. Turner, P. Polson, and M. Atwood. The Process Involved in Designing Software. In Cognitive Skills and Their Acquisition, pages 255–283. Erlbaum, 1981. [119] K. Jensen. Coloured Petri nets: basic concepts, analysis methods and practical use. Springer, 1996. [120] T. D. Jick. Mixing Qualitative and Quantitative Methods: Triangulation in Action. Administrative Science Quarterly, 24(4):602–611, 1979.
230
Bibliography [121] M. A. Just and P. A. Carpenter. Eye fixations and cognitive processes. Cognitive Psychology, 8(4):441–480, 1976. [122] M. A. Just and P. A. Carpenter. A capacity theory of comprehension: Individual differences in working memory. Psychological Review, 99(1):122–149, 1992. [123] E. Kant and A. Newell. Problem Solving Techniques for the design of algorithms. Information Processing & Management, 20(1–2):97–118, 1984. [124] A. Kaser, B. Weber, J. Pinggera, and S. Zugal. Handlungsorientierung bei der Planung von Softwareprojekten. In Proc. TEAP’10, pages 253–253, 2010. [125] V. Khatri and I. Vessey. Information Use in Solving a Well–Structured IS Problem: The Roles of IS and Application Domain Knowledge. In Proc. ER’10, pages 46–58, 2010. [126] V. Khatri, I. Vessey, P. C. V. Ramesh, and S.-J. Park. Understanding Conceptual Schemas: Exploring the Role of Application and IS Domain Knowledge. Information Systems Research, 17(1):81–99, 2006. [127] J. Kim and F. J. Lerch. Why Is Programming (Sometimes) So Difficult? Programming as Scientific Discovery in Multiple Problem Spaces. Information Systems Research, 8(1):25–50, 1997. [128] E. Kindler. On the semantics of epcs: Resolving the vicious circle. Data & Knowledge Engineering, 56(1):23–40, 2006. [129] I. Kitzmann, C. K¨ onig, D. L¨ ubke, and L. Singer. A Simple Algorithm for Automatic Layout of BPMN Processes. In Proc. CEC’09, pages 391–398, 2009. [130] N. Kock, J. Verville, A. Danesh-Pajou, and D. DeLuca. Communication flow orientation in business process modeling and its effect on redesign success: results from a field study. Decision Support Systems, 46(2):562–575, 2009. [131] J. Koehler and J. Vanhatalo. Process Anti–Patterns: How to Avoid the Common Traps of Business Process Modeling. Technical Report RZ3678, IBM Research, 2007. [132] J. Kolb, B. Rudner, and M. Reichert. Towards gesture–based process modeling on multi–touch devices. In Proc. HC-PAIS’12, pages 280–293, 2012.
231
Bibliography [133] J. Kolb, B. Rudner, and M. Reichert. Gesture–based process modeling using multi–touch devices. International Journal of Information System Modeling and Design, 4(4):48–69, 2013. [134] A. Koschmider and H. A. Reijers. Improving the process of process modelling by the use of domain process patterns. Enterprise Information Systems, 2013. DOI: 10.1080/17517575.2013.857792. [135] G. Kotonya and I. Sommerville. Requirements Engineering with Viewpoints. Software Engineering Journal, 11(1):5–18, 1996. [136] J. Krogstie. Model–Based Development and Evolution of Information Systems: A Quality Approach. Springer, 2012. [137] J. Krogstie and S. Arnesen. Assessing enterprise modeling languages using a generic quality framework. In Information Modeling Methods and Methodologies, pages 63–79. Idea Group Publishing, 2005. [138] J. Krogstie, G. Sindre, and H. D. Jørgensen. Process models representing knowledge for action: a revised quality framework. European Journal of Information Systems, 15(1):91–102, 2006. [139] A. W. Kruglanski, E. P. Thompson, E. T. Higgins, M. Atash, A. Pierro, J. Y. Shah, and S. Spiegel. To do the “right thing” or to “just do it”: locomotion and assessment as distinct self–regulatory imperatives. Journal of Personality and Social Psychology, 79(5):793–815, 2000. [140] S. K¨ uhne, H. Kern, V. Gruhn, and R. Laue. Business process modeling with continuous validation. Journal of Software Maintenance and Evolution, 22(6– 7):547–566, 2010. [141] P. C. Kyllonen and D. L. Stephens. Cognitive abilities as determinants of success in acquiring logic skill. Learning and Individual Differences, 2(2):129– 160, 1990. [142] A. Lanz, B. Weber, and M. Reichert. Workflow Time Patterns for Process– aware Information Systems. In BPMDS’10, pages 94–107, 2010. [143] A. Lanz, B. Weber, and M. Reichert. Time patterns for process–aware information systems. Requirements Engineering, 19(2):113–141, 2014. [144] J. H. Larkin and H. A. Simon. Why a diagram is (sometimes) worth ten thousand words. Cognitive Science, 11(1):65–100, 1987.
232
Bibliography [145] H. Leopold, S. Smirnov, and J. Mendling. On the refactoring of activity labels in business process models. Information Systems, 37(5):443–459, 2012. [146] S. Lewandowsky, K. Oberauer, L.-X. Yang, and U. K. Ecker. A working memory test battery for MATLAB. Behavior Research Methods, 42(2):571– 585, 2010. [147] C. Leys, C. Ley, O. Klein, P. Bernard, and L. Licata. Detecting outliers: Do not use standard deviation around the mean, use absolute deviation around the median. Journal of Experimental Social Psychology, 49(4):764–766, 2013. [148] N. Liberman, C. Beeri, and Y. B.-D. Kolikant. Difficulties in learning inheritance and polymorphism. ACM Transactions on Computing Education, 11(1):1–23, 2011. [149] O. I. Lindland, G. Sindre, and A. Sølvberg. Understanding Quality in Conceptual Modeling. IEEE Software, 11(2):42–49, 1994. [150] J. MacQueen. Some methods of classification and analysis of multivariate observations. In Proc. Berkeley Symposium on Mathematical Statistics and Probability’67, pages 281–297, 1967. [151] A. Malhotra, J. C. Thomas, J. M. Carroll, and L. A. Miller. Cognitive processes in design. International Journal on Man–Machine Studies, 12:119–140, 1980. [152] M. W. McCracken. Models of Designing: Understanding Software Engineering Education from the Bottom Up. In Proc. CSEET’02, pages 55–63, 2002. [153] J. Mendling. Metrics for Process Models: Empirical Foundations of Verification, Error Prediction, and Guidelines for Correctness. Springer, 2008. [154] J. Mendling and J. Recker. Towards systematic usage of labels and icons in business process models. In Proc. EMMSAD’08, pages 1–13, 2008. [155] J. Mendling, H. A. Reijers, and J. Cardoso. What Makes Process Models Understandable? In Proc. BPM’07, pages 48–63, 2007. [156] J. Mendling, H. A. Reijers, and J. Recker. Activity Labeling in Process Modeling: Empirical Insights and Recommendations. Information Systems, 35(4):467–482, 2010. [157] J. Mendling, H. A. Reijers, and W. M. P. van der Aalst. Seven process modeling guidelines (7PMG). Information & Software Technology, 52(2):127–136, 2010.
233
Bibliography [158] J. Mendling and M. Strembeck. Influence factors of understanding business process models. In Proc. BIS’08, pages 142––153, 2008. [159] J. Mendling, M. Strembeck, and J. Recker. Factors of process model comprehension—Findings from a series of experiments. Decision Support Systems, 53(1):195–206, 2012. [160] J. Mendling, H. M. W. Verbeek, B. F. van Dongen, W. M. P. van der Aalst, and G. Neumann. Detection and prediction of errors in EPCs of the SAP reference model. Data & Knowledge Engineering, 64(1):312–329, 2008. [161] G. Miller. The Magical Number Seven, Plus or Minus Two: Some Limits on Our Capacity for Processing Information. The Psychological Review, 63(2):81– 97, 1956. [162] M. Montali, M. Pesic, W. M. P. van der Aalst, F. Chesani, P. Mello, and S. Storari. Declarative Specification and Verification of Service Choreographies. ACM Transactions on the Web, 4(1):1–62, 2010. [163] D. L. Moody. The ”Physics” of Notations: Toward a Scientific Basis for Constructing Visual Notations in Software Engineering. IEEE Transactions Software Engineering, 35(6):756–779, 2009. [164] C. P. Neck and J. D. Houghton. Two decades of self–leadership theory and research: Past developments, present trends, and future possibilities. Journal of Managerial Psychology, 21(4):270–295, 2006. [165] H. J. Nelson, D. J. Armstrong, and M. Ghods. Old Dogs New Tricks. Communications of the ACM, 45(10):132–137, 2002. [166] H. J. Nelson, D. J. Armstrong, and M. N. Kay. Patterns of Transition: The Shift from Traditional to Object–Oriented Development. Journal of Management Information Systems, 25(4):271–297, 2009. [167] A. Newell and H. A. Simon. Human problem Solving. Prentice Hall, 1972. [168] J. C. Nordbotten and M. E. Crosby. The effect of graphic style on data model interpretation. Information Systems Journal, 9(2):139–155, 1999. [169] B. Nuseibeh. Conflicting Requirements: When the Customer Is Not Always Right. Requirements Engineering, 1(1):70–71, 1996.
234
Bibliography [170] A. G. Nysetvold and J. Krogstie. Assessing business processing modeling languages using a generic quality framework. In Advanced topics in database research, volume 5, pages 79–93. Idea Group Publishing, 2006. [171] K. Oberauer. Design for a working memory. Psychology of learning and motivation, 51:45–100, 2009. [172] K. Oberauer, H.-M. S¨ uß, O. Wilhelm, and W. W. Wittman. The multiple faces of working memory: Storage, processing, supervision, and coordination. Intelligence, 31(2):167–193, 2003. [173] T. Ohno, N. Mukawa, and A. Yoshikawa. Freegaze: A gaze tracking system for everyday gaze interaction. In Proc. ETRA’02, pages 125–132, 2002. [174] OMG. BPMN Version 2.0. 2011. Accessed: July 2014.
http://www.omg.org/spec/BPMN/2.0/PDF/,
[175] W. F. Opdyke. Refactoring Object–Oriented Frameworks. PhD thesis, University of Illinois, 1992. [176] R. Or-Bach and I. Lavy. Cognitive activities of abstraction in object orientation: an empirical study. ACM SIGCSE Bulletin, 36(2):82–86, 2004. [177] T. Ormerod. Human Cognition and Programming. In Psychology of Programming, pages 63–82. Academic Press, 1990. [178] F. Paas, A. Renkl, and J. Sweller. Cognitive Load Theory and Instructional Design: Recent Developments. Educational Psychologist, 38(1):1–4, 2003. [179] N. Pennington, Y. L. Adrienne, and B. Rehder. Cognitive Activities and Levels of Abstraction in Procedural and Object–Oriented Design. Human–Computer Interaction, 10:171–226, 1995. [180] R. P´erez-Castillo, B. Weber, I. G.-R. de Guzm´an, M. Piattini, and J. Pinggera. Event Correlation in Non–Process–Aware Systems. In Proc. JISBD’13, pages 173–174, 2013. [181] R. P´erez-Castillo, B. Weber, J. Pinggera, S. Zugal, I. G.-R. de Guzm´an, and M. Piattini. Generating event logs from nonprocess–aware systems enabling business process mining. Enterprise Information Systems, 5(3):301–335, 2011. [182] M. Pesic. Constraint–Based Workflow Management Systems: Shifting Control to Users. PhD thesis, Technische Universiteit Eindhoven, 2008.
235
Bibliography [183] M. Petre. Why Looking Isn’t Always Seeing: Readership Skills and Graphical Programming. Communications of the ACM, 38(6):33–44, 1995. [184] C. A. Petri. Kommunikation mit Automaten. PhD thesis, Universit¨at Bonn, 1962. [185] R. Petrusel and J. Mendling. Eye–tracking the factors of process model comprehension tasks. In Proc. CAiSE’13, pages 224–239, 2013. [186] P. Pichler, B. Weber, S. Zugal, J. Pinggera, J. Mendling, and H. A. Reijers. Imperative versus Declarative Process Modeling Languages: An Empirical Investigation. In Proc. ER–BPM’11, pages 383–394, 2012. [187] J. Pinggera. Handling Uncertainty in Software Projects—A Controlled Experiment. Master’s thesis, University of Innsbruck, Institute of Computer Science, 2009. [188] J. Pinggera, M. Furtner, M. Martini, P. Sachse, K. Reiter, S. Zugal, and B. Weber. Investigating the Process of Process Modeling with Eye Movement Analysis. In Proc. ER–BPM’12, pages 438–450, 2013. [189] J. Pinggera, T. Porcham, S. Zugal, and B. Weber. LiProMo—Literate Process Modeling. In Proc. CAiSE Forum’12, pages 163–170, 2012. [190] J. Pinggera, P. Soffer, D. Fahland, M. Weidlich, S. Zugal, B. Weber, H. A. Reijers, and J. Mendling. Styles in business process modeling: an exploration and a model. Software & Systems Modeling, 2013. DOI: 10.1007/s10270-0130349-1. [191] J. Pinggera, P. Soffer, S. Zugal, B. Weber, M. Weidlich, D. Fahland, H. A. Reijers, and J. Mendling. Modeling Styles in Business Process Modeling. In Proc. BPMDS’12, pages 151–166, 2012. [192] J. Pinggera, S. Zugal, M. Furtner, P. Sachse, M. Martini, and B. Weber. The Modeling Mind: Behavior Patterns in Process Modeling? In Proc. BPMDS’14, pages 1–16, 2014. [193] J. Pinggera, S. Zugal, and B. Weber. Alaska Simulator—Supporting Empirical Evaluation of Process Flexibility. In Proc. WETICE’09, pages 231–233, 2009. [194] J. Pinggera, S. Zugal, and B. Weber. Investigating the process of process modeling with cheetah experimental platform. In Proc. ER–POIS’10, pages 13–18, 2010.
236
Bibliography [195] J. Pinggera, S. Zugal, B. Weber, D. Fahland, M. Weidlich, J. Mendling, and H. A. Reijers. How the Structuring of Domain Knowledge Can Help Casual Process Modelers. In Proc. ER’10, pages 445–451, 2010. [196] J. Pinggera, S. Zugal, B. Weber, W. Wild, and M. Reichert. Integrating Case– Based Reasoning with Adaptive Process Management. Technical Report TRCTIT-08-11, Centre for Telematics and Information Technology, University of Twente, 2008. [197] J. Pinggera, S. Zugal, M. Weidlich, D. Fahland, B. Weber, J. Mendling, and H. A. Reijers. Tracing the Process of Process Modeling with Modeling Phase Diagrams. In Proc. ER–BPM’11, pages 370–382, 2012. [198] T. Porcham. Design and Implementation of an Experimental Editor for the Cheetah Experimental Platform. Master’s thesis, University of Innsbruck, Institute of Computer Science, 2012. [199] A. Porter and L. Votta. Comparing Detection Methods For Software Requirements Inspections: A Replication Using Professional Subjects. Empirical Software Engineering, 3(4):355–379, 1998. [200] M. I. Posner. Attention in cognitive neuroscience. In The cognitive neurosciences, pages 615–624. MIT Press, 1995. [201] H. C. Purchase. Which Aesthetic has the Greatest Effect on Human Understanding? In Proc. GD’97, pages 248–261, 2007. [202] R Core Team. R: A Language and Environment for Statistical Computing. R Foundation for Statistical Computing, Vienna, Austria, 2013. [203] F. A. Rabhi, H. Yu, F. T. Dabous, and S. Y. Wu. A service–oriented architecture for financial business processes. Information Systems and e–Business Management, 5(2):185–200, 2007. [204] J. F. Rauthmann, C. T. Seubert, P. Sachse, and M. Furtner. Eyes as windows to the soul: Gazing behavior is related to personality. Journal of Research in Personality, 46(2):147–156, 2012. ´ Rebuge and D. R. Ferreira. Business process analysis in healthcare en[205] A. vironments: A methodology based on process mining. Information Systems, 37(2):99–116, 2012.
237
Bibliography [206] J. Recker. Understanding Quality in Process Modelling: Towards a Holistic Perspective. Australasian Journal of Information Systems, 14(2):43–63, 2007. [207] J. Recker. “Modeling with Tools is Easier, Believe Me” The Effects of Tool Functionality on Modeling Grammar Usage Beliefs. Information Systems, 37(3):213–226, 2012. [208] J. Recker and A. Dreiling. Does it matter which process modelling language we teach or use? An experimental study on understanding process modelling languages without formal education. In Proc. ACIS’07, pages 356–366, 2007. [209] J. Recker and M. Rosemann. Teaching business process modelling: experiences and recommendations. Communications of the Association for Information Systems, 25(32):379–394, 2009. [210] J. Recker, M. Rosemann, P. Green, and M. Indulska. Do ontological deficiencies in modeling grammars matter. Management Information Systems Quarterly, 35(1):57–79, 2011. [211] J. Recker, M. Rosemann, M. Indulska, and P. Green. Business process modeling—a comparative analysis. Journal of the Association for Information Systems, 10(4):333–363, 2009. [212] M. Reichert and P. Dadam. ADEPTflex: Supporting Dynamic Changes of Workflow without Losing Control. Journal of Intelligent Information Systems, 10(2):93–129, 1998. [213] M. Reichert and B. Weber. Enabling Flexibility in Process–Aware Information Systems: Challenges, Methods, Technologies. Springer, 2012. [214] H. A. Reijers and J. Mendling. Modularity in process models: Review and effects. In Proc. BPM’08, pages 20–35, 2008. [215] H. A. Reijers and J. Mendling. A study into the factors that influence the understandability of business process models. IEEE Transactions on Systems Man and Cybernetics, Part A, 41(3):449–462, 2011. [216] S. Rinderle-Ma, M. Reichert, and B. Weber. On the Formal Semantics of Change Patterns in Process–aware Information Systems. In Proc. ER’08, pages 279–293, 2008. [217] R. Rist. Schema Creation in Programming. Cognitive Science, 13(3):389–414, 1989.
238
Bibliography [218] P. Rittgen. Negotiating Models. In Proc. CAiSE’07, pages 561–573, 2007. [219] P. Rittgen. COMA: A Tool for Collaborative Modeling. In Proc. CAiSE Forum’08, pages 61–64, 2008. [220] P. Rittgen. Collaborative modeling—a design science approach. In Proc. HICSS’09, pages 1–10, 2009. [221] P. Rittgen. Quality and perceived usefulness of process models. In Proc. SAC’10, pages 65–72, 2010. [222] W. Robinson. Negotiation Behavior During Requirement Specification. In Proc. SE’90, pages 268–276, 1990. [223] E. Rol´on, J. Cardoso, F. Garc´ıa, F. Ruiz, and M. Piattini. Analysis and validation of control–flow complexity measures with BPMN process models. In Proc. BPMDS’09, pages 58–70, 2009. [224] M. Rosemann, T. de Bruin, and T. Hueffner. A model for business process management maturity. In Proc. ACIS’04, 2004. [225] M. Rosemann, S. Wasana, and G. Gable. Critical success factors of process modeling for enterprise systems. In Proc. AMCIS’01, pages 1128–1130, 2001. [226] M. B. Rosson and S. R. Alpert. The cognitive consequences of object–oriented design. Human–Computer Interaction, 5:345–379, 1990. [227] S. Roy, A. Sajeev, S. Bihary, and A. Ranjan. An Empirical Study of Error Patterns in Industrial Business Process Models. IEEE Transactions on Services Computing, 99:1, 2013, DOI: 10.1109/TSC.2013.10. [228] P. Runeson. Using Students as Experiment Subjects—An Analysis on Graduate and Freshmen Student Data. In Proc. EASE’03, pages 95–102, 2003. [229] N. Russell, A. H. M. ter Hofstede, D. Edmond, and W. M. P. van der Aalst. Workflow data patterns: Identification, representation and tool support. In Proc. ER’05, pages 353–368, 2005. [230] N. Russell, W. M. P. van der Aalst, and A. H. M. ter Hofstede. Workflow exception patterns. In Proc. CAiSE’06, pages 288–302, 2006. [231] N. Russell, W. M. P. van der Aalst, A. H. M. ter Hofstede, and D. Edmond. Workflow resource patterns: Identification, representation and tool support. In Proc. CAiSE’05, pages 216–232, 2005.
239
Bibliography [232] P. Sachse and W. Hacker. External procedures in design problem solving by experienced engineering designers – methods and purposes. Theoretical Issues in Ergonomics Science, 13(5):603–614, 2012. [233] P. Sachse, W. Hacker, and S. Leinert. External thought—does sketching assist problem analysis? Applied Cognitive Psychology, 18(4):415–425, 2004. [234] P. Sachse, M. Martini, J. Pinggera, B. Weber, K. Reiter, and M. Furtner. Das Arbeitsged¨ achtnis als Nadel¨ohr des Denkens. In P. Sachse and E. Ulich, editors, Psychologie menschlichen Handelns: Wissen & Denken—Wollen & Tun. Pabst Science Publishers, 2014. [235] M. Scaife and Y. Rogers. External cognition: how do graphical representations work? International Journal on Human–Computer Studies, 45(2):185–213, 1996. [236] M. Scaife and Y. Rogers. External cognition, innovative technologies, and effective learning. In P. Gardenfors and P. Johansson, editors, The encyclopedia of human behavior, vol. 1, pages 181–202. Routledge, 2005. [237] M. Schier. Adoption of Decision Deferring Techniques in Plan–driven Software Projects. Master’s thesis, Master Thesis, Department of Computer Science, University of Innsbruck, 2008. [238] M. Schrepfer, J. Wolf, J. Mendling, and H. A. Reijers. The impact of secondary notation on process model understanding. In Proc. PoEM’09, pages 161–175, 2009. [239] C. B. Seaman. Qualitative Methods. In Guide to Advanced Empirical Software Engineering, pages 35–62. Springer, 2008. [240] I. Sellin, A. Sch¨ utz, A. W. Kruglanski, and E. T. Higgins. Erfassung von Dimensionen der Selbstregulation. Der Locomotion–Assessment–Fragebogen. Technical report, Technische Universit¨at Chemnitz, 2003. [241] S. D. Sheetz, G. Irwin, D. P. Tegarden, H. J. Nelson, and D. E. Monarchi. Exploring the Difficulties of Learning Object–Oriented Techniques. Journal of Management Information Systems, 14(2):103–132, 1997. [242] S. D. Sheetz and D. P. Tegarden. Perceptual complexity of object oriented systems: a student view. Object Oriented Systems, 3:165–195, 1996.
240
Bibliography [243] S. D. Sheetz and D. P. Tegarden. Illustrating the cognitive consequences of object–oriented systems development. The Journal of Systems and Software, 59:163–179, 2001. [244] B. Shneiderman and R. Mayer. Syntactic/Semantic Interactions in Programmer Behavior: A Model and Experimental Results. International Journal of Computer and Information Sciences, 8(3):219–238, 1979. [245] K. Siau and M. Rossi. Evaluation techniques for systems analysis and design modelling methods—a review and comparative analysis. Information Systems Journal, 21(3):249–268, 2011. [246] M. E. Sime, T. R. G. Green, and D. J. Guest. Psychological Evaluation of Two Conditional Constructions Used in Computer Languages. International Journal of Man–Machine Studies, 5(1):105–113, 1973. [247] J. P. Simmons, L. D. Nelson, and U. Simonsohn. False–Positive Psychology: Undisclosed Flexibility in Data Collection and Analysis Allows Presenting Anything as Significant. Psychological Science, 22(11):1359–1366, 2011. [248] J. Singer, S. E. Sim, and T. C. Lethbridge. Software Engineering Data Collection for Field Studies. In Guide to Advanced Empirical Software Engineering, pages 9–34. Springer, 2008. [249] P. Soffer and I. Hadar. Applying ontology–based rules to conceptual modeling: a reflection on modeling decision making. European Journal of Information Systems, 16(5):599–611, 2007. [250] P. Soffer and M. Kaner. Complementing Business Process Verification by Validity Analysis: A Theoretical and Empirical Evaluation. Journal of Database Management, 22(3):1–23, 2011. [251] P. Soffer, M. Kaner, and Y. Wand. Towards Understanding the Process of Process Modeling: Theoretical and Empirical Considerations. In Proc. ER– BPM’11, pages 357–369, 2012. [252] M. Song, C. W. G¨ unther, and W. M. P. van der Aalst. Trace clustering in process mining. In Proc. BPI’08, pages 109–120, 2009. [253] M. Song and W. M. P. van der Aalst. Supporting process mining by showing events at a glance. In Proc. WITS’07, pages 139–145, 2007.
241
Bibliography [254] M. Soto, A. Ocampo, and J. Munch. The Secret Life of a Process Description: A Look into the Evolution of a Large Process Model. In Proc. ICSP’08, pages 257–268, 2008. [255] A. Srinivasan and G. Irwin. Communicating the Message: Translating Tasks Into Queries in a Database Context. IEEE Transactions on Professional Communication, 49(2):145–159, 2006. [256] B. Stein and F. Benteler. On the Generalized Box–Drawing of Trees: Survey and New Technology. In Proc. I–KNOW’07, pages 408–415, 2007. [257] J. Stirna, A. Persson, and K. Sandkuhl. Participative Enterprise Modeling: Experiences and Recommendations. In Proc. CAiSE’07, pages 546–560, 2007. [258] V. Surakka, M. Illi, and P. Isokoski. Voluntary eye movements in human– computer interaction. In R. Radach, J. Hyona, and H. Deubel, editors, The mind’s eye: Cognitive and applied aspects of eye movement research, pages 473–491. North Holland, 2003. [259] M. Svahnberg, A. Aurum, and C. Wohlin. Using students as subjects—an empirical evaluation. In Proc. ESEM’08, pages 288–290, 2008. [260] J. Sweller. Cognitive Load During Problem Solving: Effects on Learning. Cognitive Science, 12(2):257–285, 1988. [261] S. Taylor and R. Bogdan. Introduction to Qualitative Research Methods. Wiley, 1984. [262] D. P. Tegarden and S. D. Sheetz. Cognitive activities in OO development. International Journal on Human–Computer Studies, 54(6):779–798, 2001. [263] W. Tracz. Computer programming and the human thought process. Software: Practice and Experience, 9(2):127–137, 1979. [264] B. Tversky. What do sketches say about thinking. In Proc. Association for the Advancement of Artificial Intelligence Spring Symposium’02, pages 148–151, 2002. [265] B. Tversky and M. Suwa. Thinking with sketches. In A. B. Markman and K. L. Wood, editors, Tools for Innovation: The Science Behind the Practical Methods That Drive New Ideas, pages 75–84. Oxford University Press, 2009.
242
Bibliography [266] N. Unsworth and R. W. Engle. The nature of individual differences in working memory capacity: active maintenance in primary memory and controlled search from secondary memory. Psychological Review, 114(1):104–132, 2007. [267] W. M. P. van der Aalst. Verification of workflow nets. In Proc. ICATPN’03, pages 407–426, 1997. [268] W. M. P. van der Aalst. The application of petri nets to workflow management. Journal of circuits, systems, and computers, 8(1):21–66, 1998. [269] W. M. P. Van der Aalst and J. Dehnert. Bridging the Gap between Business Models and Workflow Specifications. International Journal of Cooperative Information Systems, 13(3):289–332, 2004. [270] W. M. P. van der Aalst, H. A. Reijers, A. J. M. M. Weijters, B. F. van Dongen, A. K. A. de Medeiros, M. Song, and H. M. W. Verbeek. Business process mining: An industrial application. Information Systems, 32(5):713–732, 2007. [271] W. M. P. van der Aalst and A. H. M. ter Hofstede. Verification of workflow task structures: A petri–net–based approach. Information Systems, 25(1):43–69, 2000. [272] W. M. P. van der Aalst, A. H. M. ter Hofstede, B. Kiepuszewski, and A. P. Barros. Workflow patterns. Distributed and Parallel Databases, (14):5–51, 2003. [273] W. M. P. van der Aalst, A. H. M. ter Hofstede, and M. Weske. Business process management: A survey. In Proc. BPM’03, pages 1–12, 2003. [274] B. F. van Dongen, A. K. A. de Medeiros, H. M. W. Verbeek, A. J. M. M. Weijters, and W. M. P. van der Aalst. The prom framework: A new era in process mining tool support. In Proc. Petri Nets’05, pages 444–454, 2005. [275] B. F. van Dongen and W. M. P. van der Aalst. A meta model for process mining data. EMOI–INTEROP’05, pages 309–320, 2005. [276] M. W. van Someren, Y. Barnard, and J. Sandberg. The think aloud method—a practical approach to modelling cognitive processes. Academic Press, London, 1994. [277] I. Vanderfeesten, J. Cardoso, J. Mendling, H. A. Reijers, and W. M. P. van der Aalst. Quality Metrics for Business Process Models. In L. Fischer, editor, BPM & Workflow Handbook, pages 179–190. Future Strategies Inc., 2007.
243
Bibliography [278] I. Vanderfeesten, H. A. Reijers, and W. M. P. van der Aalst. Evaluating workflow process designs using cohesion and coupling metrics. Computers in Industry, 59(5):420–437, 2008. [279] H. M. W. Verbeek, J. C. A. M. Buijs, B. F. van Dongen, and W. M. P. van der Aalst. Prom 6: The process mining toolkit. Proc. BPMDemos’10, pages 34–39, 2010. [280] C. Ware, H. C. Purchase, L. Colpoys, and M. McGill. Cognitive measurements of graph aesthetics. Information Visualization, 1(2):103–110, 2002. [281] S. Wasana, M. Rosemann, and G. Doebeli. A process modelling success model: insights from a case study. In Proc. ECIS’03, pages 1–11, 2003. [282] E. J. Webb, D. T. Campbell, R. D. Schwartz, L. Sechrest, and J. B. Grove. Nonreactive Measures in the Social Sciences. Houghton, 1981. [283] B. Weber, J. Pinggera, V. Torres, and M. Reichert. Change Patterns for Model Creation: Investigating the Role of Nesting Depth. In Proc. Cognise’13, pages 198–204, 2013. [284] B. Weber, J. Pinggera, V. Torres, and M. Reichert. Change Patterns in Use: A Critical Evaluation. In Proc. BPMDS’13, pages 261–276, 2013. [285] B. Weber, J. Pinggera, S. Zugal, and W. Wild. Alaska Simulator – A Journey to Planning. In Proc. XP’09, pages 253–254, 2009. [286] B. Weber, J. Pinggera, S. Zugal, and W. Wild. Alaska Simulator Toolset for Conducting Controlled Experiments. In Proc. CAiSE Forum’10, pages 205–221, 2010. [287] B. Weber, J. Pinggera, S. Zugal, and W. Wild. Handling Events During Business Process Execution: An Empirical Test. In Proc. ER–POIS’10, pages 19–30, 2010. [288] B. Weber and M. Reichert. Refactoring Process Models in Large Process Repositories. In Proc. CAiSE’08, pages 124–139, 2008. [289] B. Weber, M. Reichert, J. Mendling, and H. A. Reijers. Refactoring Large Process Model Repositories. Computers in Industry, 62(5):467–486, 2011. [290] B. Weber, M. Reichert, and S. Rinderle-Ma. Change Patterns and Change Support Features—Enhancing Flexibility in Process–Aware Information Systems. Data & Knowledge Engineering, 66(3):438–466, 2008.
244
Bibliography [291] B. Weber, S. Rinderle, and M. Reichert. Change Patterns and Change Support Features in Process–Aware Information Systems. In Proc. CAiSE’07, pages 574–588, 2007. [292] B. Weber, S. Zeitlhofer, J. Pinggera, V. Torres, and M. Reichert. How Advanced Change Patterns Impact the Process of Process Modeling. In Proc. BPMDS’14, pages 17–32, 2014. [293] B. Weber, S. Zugal, J. Pinggera, and W. Wild. Experiencing Process Flexibility Patterns with Alaska Simulator. In Proc. BPMDemos’09, pages 13–16, 2009. [294] M. Weidlich, S. Zugal, J. Pinggera, B. Weber, H. A. Reijers, and J. Mendling. The Impact of Sequential and Circumstantial Changes on Process Models. In Proc. ER–POIS’10, pages 43–54, 2010. [295] M. Weske. Business Process Management: Concepts, Methods, Technology. Springer, 2007. [296] G. White and M. Sivitanides. Cognitive Differences Between Procedural Programming and Object Oriented Programming. Information Technology and Management, 6(4):333–350, 2005. [297] I. Wilmont, E. Barendsen, and S. J. B. A. Hoppenbrouwers. Determining the role of abstraction and executive control in process modeling. In Proc. PoEM’12, pages 13–24, 2012. [298] I. Wilmont, E. Barendsen, S. J. B. A. Hoppenbrouwers, and S. Hengeveld. Abstract reasoning in collaborative modeling. In Proc. HICSS’12, pages 170– 179, 2012. [299] I. Wilmont, S. Brinkkemper, I. van de Weerd, and S. J. B. A. Hoppenbrouwers. Exploring intuitive modelling behaviour. In Proc. EMMSAD’10, pages 301– 313, 2010. [300] I. Wilmont, S. Hengeveld, E. Barendsen, and S. J. B. A. Hoppenbrouwers. Cognitive mechanisms of conceptual modelling. In Proc. ER’13, pages 74–87, 2013. [301] C. Wohlin, M. H¨ ost, and K. Henningsson. Empirical research methods in software engineering. In R. Conradi and A. I. Wang, editors, Empirical Methods and Studies in Software Engineering, pages 7–23. Springer, 2003.
245
Bibliography [302] C. Wohlin, R. Runeson, M. Halst, M. Ohlsson, B. Regnell, and A. Wesslen. Experimentation in Software Engineering: An Introduction. Kluwer, 2000. [303] E. A. Youngs. Human Errors in Programming. International Journal of Man– Machine Studies, 6(3):361–376, 1974. [304] S. Yusuf, H. Kagdi, and J. I. Maletic. Assessing the comprehension of uml class diagrams via eye tracking. In Proc. ICPC’07, pages 113–122, 2007. [305] P. Zangerl. Collaborative Process Modeling for Cheetah Experimental Platform. Master’s thesis, University of Innsbruck, Institute of Computer Science, 2013. [306] S. Zeitlhofer. The Impact of Change Patterns on the Process of Process Modeling. Master’s thesis, University of Innsbruck, Institute of Computer Science, 2014. [307] J. Zhang. The nature of external representations in problem solving. Cognitive Science, 21(2):179–217, 1997. [308] J. Zhang and D. A. Norman. Representations in distributed cognitive tasks. Cognitive Science, 18(1):87–122, 1994. [309] X. Zhao, C. Liu, Y. Yang, and W. Sadiq. Aligning Collaborative Business Processes—An Organization–Oriented Perspective. Transactions on Systems, Man, and Cybernetics, Part A: Systems and Humans, 39(6):1152–1164, 2009. [310] S. Zugal. Agile versus Plan–Driven Approaches to Planning—A Controlled Experiment. Master’s thesis, University of Innsbruck, Institute of Computer Science, 2008. [311] S. Zugal. Applying Cognitive Psychology for Improving the Creation, Understanding and Maintenance of Business Process Models. PhD thesis, University of Innsbruck, Department of Computer Science, 2013. [312] S. Zugal, C. Haisjackl, J. Pinggera, and B. Weber. Empirical Evaluation of Test Driven Modeling. International Journal of Information System Modeling and Design, 4(2):23–43, 2013. [313] S. Zugal and J. Pinggera. Low–Cost Eye–Trackers: Useful for Information Systems Research? In Proc. Cognise’14, pages 159–170, 2014.
246
Bibliography [314] S. Zugal, J. Pinggera, J. Mendling, H. A. Reijers, and B. Weber. Assessing the Impact of Hierarchy on Model Understandability—A Cognitive Perspective. In Proc. EESSMod’11, pages 123–133, 2011. [315] S. Zugal, J. Pinggera, H. A. Reijers, M. Reichert, and B. Weber. Making the Case for Measuring Mental Effort. In Proc. EESSMod’12, pages 37–42, 2012. [316] S. Zugal, J. Pinggera, and B. Weber. Assessing Process Models with Cognitive Psychology. In Proc. EMISA’11, pages 177–182, 2011. [317] S. Zugal, J. Pinggera, and B. Weber. Creating Declarative Process Models Using Test Driven Modeling Suite. In Proc. CAiSE Forum’11, pages 16–32, 2011. [318] S. Zugal, J. Pinggera, and B. Weber. The Impact of Testcases on the Maintainability of Declarative Process Models. In Proc. BPMDS’11, pages 163–177, 2011. [319] S. Zugal, J. Pinggera, and B. Weber. Toward Enhanced Life–Cycle Support for Declarative Processes. Journal of Software: Evolution and Process, 24(3):285– 302, 2012. [320] S. Zugal, P. Soffer, C. Haisjackl, J. Pinggera, M. Reichert, and B. Weber. Investigating expressiveness and understandability of hierarchy in declarative business process models. Software & Systems Modeling, 2013. DOI: 10.1007/s10270-013-0356-2. [321] S. Zugal, P. Soffer, J. Pinggera, and B. Weber. Expressiveness and Understandability Considerations of Hierarchy in Declarative Business Process Models. In Proc. BPMDS’12, pages 167–181, 2012. [322] M. zur Muehlen and J. Recker. How much language is enough? theoretical and practical use of the business process modeling notation. In Proc. CAiSE’08, pages 465–479, 2008.
247