NORGES LANDBRUKSHØGSKOLE Agricultural University of Norway
DOCTOR SCIENTIARUM THESES 1999:34
The Quick, the Cheap and the Dirty Benefit Transfer Approaches to the Non-market Valuation of Coastal Water Quality in Costa Rica
David N. Barton
Institutt for økonomi og samfunnsfag Norges landbrukshøgskole Avhandling nr. 1999:03
Department of Economics and Social Sciences Agricultural University of Norway Dissertation no. 1999:03
ii
David N. Barton David N. Barton, was born 1968 in Merton, England. He holds an M.Sc. (Siviløkonom) from the Norwegian School of Economics and Business Administration (NHH), and an M.Sc. in Economic Policy with Emphasis on Ecological Economics from Universidad Nacional de Costa Rica (UNA). A number of non-market valuation methods have been developed for integrating the costs and benefits of environmental impacts and mitigation measures in traditional economic welfare analysis. Because most of these methods are costly and time-consuming, welfare estimates from previous studies are often used in the evaluation of new projects, in what has come to be known as “benefit transfer”. As non-market valuation of environmental impacts gains acceptance, benefit transfers are increasingly practiced by development aid agencies and their consultants. The dissertation is a methodological and empirical evaluation of the reliability of the most popular benefit transfer approaches, relative to conducting original non-market valuation studies. Field studies were conducted in Costa Rica on households’ and visitors’ willingness-to-pay for avoiding sewage pollution of local coastal water resources. The size and causes of transfer errors are examined when benefit transfers are conducted between countries, and between different sites within the same country. If a consultant proposes a method which is both quick and cheap, how dirty is it? The research provides decision-makers working on water pollution issues with a basis for evaluating the uncertainty in benefit-cost analyses of treatment measures. The studies also contribute to the scarce literature on valuation of the environment in developing countries.
Department of Economics and Social Sciences Agricultural University of Norway PO Box 5033 N-1432 Ås, Norway
Associate Professor Ståle Navrud was the advisor of this dissertation.
Telephone: (+47) 6494 8600 Telefax: (+47) 6494 3012 e-mail:
[email protected] http:/www.nlh.no/Institutt/IOS
David N. Barton currently works as environmental economist for the InterConsult Group ASA. Telephone: (+47) 22 63 59 13 Telefax: (+47) 22 63 59 10 e-mail:
[email protected]
ISSN 0802-3220 ISBN 82-575-0312
iii
Abstract This collection of five papers provides an extensive methodological review and validity tests of benefit transfer approaches - a collection of techniques for extrapolating non-market valuation estimates from an existing study site to a new policy context. Empirical issues are evaluated through several contingent valuation surveys of the benefits of wastewater treatment to visitors and households along the Pacific coast of Costa Rica. The studies illustrate how statistical and econometric model assumptions affect WTP estimates, how they can potentially result in large benefit transfer errors, which in turn can lead to mistaken policy conclusions. The studies are a contribution to the scarce case literature on non-market valuation in developing countries. Several empirical findings are noteworthy. The common statistical tests of benefit transfers’ reliability generally require much greater accuracy than needed by policy makers for screening and prioritising development projects. Benefit transfer errors are generally smaller in magnitude than the sensitivity of WTP to data treatment and econometric assumptions. The benefit transfer experiments conducted here show that more complex benefit functions are on average not expected to reduce transfer error. However, transferring WTP for avoiding pollution-related illness episodes between Portugal and Costa Rica is more reliable than transferring epidemiological exposure-risk estimates. Furthermore, benefit transfer errors between the Costa Rican study and policy sites are comparable to typical prediction errors in financial cost analysis of wastewater treatment projects. Nonetheless, benefit transfer experiments which try to minimise transfer error through studying as similar sites as possible are deemed unproductive. Experiments which emphasise and control for differences will be more policy-relevant. Amongst others, a meta-analysis finds that willingness-topay (WTP) for wastewater treatment is significantly correlated with household income across developing country studies. However, simple transfer-adjustment factors such as GNP/capita are ‘black box’ approaches which take no account of local socio-demographic or environmental variation. Understanding local study context is duly emphasised. Attributes of the pollution-mitigating policy described in the contingent valuation scenario are shown to have external effects of their own. For example, institutional transaction costs and local environment externalities are significantly correlated with household WTP. An effort is made throughout to provide pracitioners and policymakers with a framework and proceedures for evaluating study information, including how costeffective benefit estimates are in reducing policy uncertainty.
Keywords: non-market valuation, contingent valuation, benefit transfer, benefit-cost analysis, validity, reliability, information value, decision-criteria, developing countries, Costa Rica, coastal zone management, wastewater treatment, water quality, beaches.
iv
Acknowledgements My first words of thanks go to my two supervisors; to Ståle Navrud, Agricultural University of Norway for always keeping me focused on the feasible, for guiding my enthusiasm in productive directions, and for inspiring critique of many more pages than made it into this thesis; and to Ulf Lie at the Centre for Environment and Resources (SMR), University of Bergen, for being in the right place at the right time and encouraging my interest in coastal zone management. Thank you to all our colleagues at SMR for providing a ‘home away from home’ on the stormy west coast of Norway. To several colleagues at the Agricultural University of Norway; Olvar Bergland and Richard Ready for their many tips on econometric analysis and willingness to share their programming knowledge; Arild Vatn for encouraging a curiosity about economics which extends far beyond economics; Knut Veisten for holding up a mirror to reflect the philosophical and humorous sides of our work. To John Dixon at the World Bank, for his encouragement and providing two summers of insight into the needs of a multilateral development agency. In Costa Rica, Miriam Miranda worked untiringly to organise survey logistics and interviewer training. Without her many years of experience in household surveys, and the dedicated students from the Universidad Nacional whom she helped to recruit, there would be little of significance to report in this thesis. A big thank you also to Darner Mora, Instituto Costarricence de Acueductos y Alcantarillados (AyA), and his colleagues of the Ecological Blue Flag Program, for providing institutional support, essential water quality data, and their knowledge of microbiology. To Leonardo Moya, AyA in Puntarenas, for sharing his knowledge of wastewater treatment and its impacts. I dedicate this work to my wife Rosalba for all those months we spent apart and for the good times we have ahead of us. To my parents Elaine and Nicholas for sharing with me their interest in peoples’ psychology and nature’s mechanics, and to my brothers Andrew, Laurence and Karsten for helping me develop the persistence and will to compromise which make long research projects possible. And finally, the people who gave me their time and hospitality for interviews were the sine qua non of this work. I hope the results here will also be of some practical use to them. Ultimately, this research was contingent on the good will of all the people I have thanked and forgotten to thank.
David N. Barton Ås, September 1999
v
Foreword This collection of articles was written with the purpose of fulfilling the academic requirements of a Ph.D. thesis in environmental economics. The goals of this research at the outset of the project were: General goal:
to improve the methods for economic analysis and decision-making in
development projects in coastal zones of developing countries. Sub-goals: •
to improve non-market valuation methods adapted to the contexts of developing economies and coastal areas.
•
to evaluate the validity of transferring economic benefit estimates between different project evaluation contexts.
•
to improve methods for applying non-market valuation in development assistance decisionmaking.
In order to provide the necessary depth, one particular method for valuing the non-market benefits of environment and development projects - contingent valuation(CV), was chosen. This has become the most frequently studied non-market valuation method in particularly the US and Europe, and has seen increasing case studies in developing countries during the past decade. However, personal interviews with environmental experts and economists in development co-operation institutions such as NORAD and the World Bank, indicate that valuation of non-market impacts of development projects is seldom undertaken.
Time, resource constraints, lacking in-house expertise, and
scepticism to the use of survey techniques in economic analysis, are the most frequently cited reasons for the gap between academic research and policy application of CV.
In answer to these limitations, this work looks closer at some of the validity and reliability issues of contingent valuation method and particularly the transfer of secondary valuation estimates when research time and resources are limited. The articles included here1 do not pretend to cover all the validity and reliability issues pertaining to contingent valuation and benefit transfer, but tackle those that arose from its application to a particular environmental policy and country context.
1
I ask the reader to bear with overlaps in the citation of background literature on benefit transfer which is due to collecting several articles on the same topic. vi
Out of a range of coastal zone management issues, municipal sewage pollution is a problem facing most developing countries with coastlines. The benefits of household sanitation relative to wider environmental amenities may vary, but inadequate disposal of sewage as a development problem is general. The choice of one pollutant, one geographical context and a single valuation method, limits the transferability of results to other environmental policy fields, but was a necessary trade-off in order to conduct a comparative study of contingent valuation and benefit transfer applications. Less emphasis needed to be placed on explaining ecological or geophysical differences between study sites, and more effort could be dedicated to explaining differences in household preferences and the institutions that affect them.
What inspired me to devote three and half years to one single valuation method of a single environmental problem? The devil is in the detail. It was the curiosity about why, when, where and how to apply environmental economic methods to policies for reducing the impacts of development. I hope to convey to the reader some of this curiosity, and provide satisfactory detail on the limitations and potential of benefit transfer as applied to water and sanitation projects in developing countries.
An earlier title to this collection - “A guide to shoestringing and gunslinging in non-market valuation” - was rejected due to being too obscure. It did expresses central ideas of the thesis: Benefit transfer has arisen from the need to do valuation studies on a shoestring budget, insufficient for conducting large primary studies. The bootstrapping technique of resampling is frequently used to generate confidence limits from the non-linear valuation models which are employed in decisionmaking. Finally, there are many cautions against ‘drawing too quickly’ when it comes to policy conclusions from benefit transfer. The current thesis title reflects the advantages and disadvantages of most applied benefit transfers to date, while capturing these ideas. Practitioners may also wish to reflect on the words of the gunslinger Tuco in the spaghetti western, “The Good, the Bad and the Ugly” (1966); “But if you miss, you better miss very well”.
vii
Table of Contents INTRODUCTION................................................................................................................................................................. 1 EXECUTIVE SUMMARY OF RESULTS...............................................................................................................................4 ISSUES FOR FURTHER RESEARCH...................................................................................................................................10 REFERENCES.....................................................................................................................................................................21 RAPID VALUATION OF ENVIRONMENTAL IMPACTS - A REVIEW OF BENEFIT TRANSFER APPROACHES..................................................................................................................................................................23 INTRODUCTION ...............................................................................................................................................................24 A N OVERVIEW OF BENEFIT TRANSFER.......................................................................................................................26 STUDY SELECTION CRITERIA .......................................................................................................................................29 INDIVIDUAL BENEFIT TRANSFER APPROACHES ........................................................................................................33 A STEPWISE APPROACH TO BENEFIT VALUATION AND TRANSFERS....................................................................54 USING VALUATION REFERENCE DATABASES IN BENEFIT TRANSFER....................................................................62 CONCLUSIONS ..................................................................................................................................................................67 A PPENDIX 1 - EMPIRICAL TESTING OF BENEFIT FUNCTION TRANSFER AND ST UDY SIMILARITY..................69 REFERENCES.....................................................................................................................................................................76 RELIABILITY AND VALIDITY ISSUES IN THE CONTINGENT VALUATION OF COASTAL RECREATIONAL WATER QUALITY IN A DEVELOPING COUNTRY................................................................79 INTRODUCTION ...............................................................................................................................................................80 VALUATION METHODOLOGY AND STATISTICAL MODELLING ..............................................................................84 VALIDITY, RELIABILITY AND ACCURACY..................................................................................................................88 RESEARCH METHODOLOGY ...........................................................................................................................................88 DATA.................................................................................................................................................................................94 REGRESSION RESULTS.....................................................................................................................................................99 DISCUSSION.....................................................................................................................................................................103 CONCLUSIONS ................................................................................................................................................................107 A PPENDIX 1 - W ILLINGNESS TO PAY QUESTIONS (TRANSLATION ) ....................................................................109 REFERENCES...................................................................................................................................................................110 TRANSFERRING THE BENEFITS OF AVOIDED HEALTH EFFECTS FROM WATER POLLUTION BETWEEN DEVELOPED AND DEVELOPING COUNTRIES......................................................................................................113 INTRODUCTION .............................................................................................................................................................114 THEORY ..........................................................................................................................................................................115 HYPOTHESES..................................................................................................................................................................118 WTP MODEL AND METHODOLOGY ...........................................................................................................................121 ESTIMATION ..................................................................................................................................................................124 SAMPLE CHARACTERISTICS........................................................................................................................................125 RELIABILITY OF BENEFIT TRANSFERS......................................................................................................................129 VALIDITY .......................................................................................................................................................................132 CONCLUSIONS ................................................................................................................................................................136 A PPENDIX 1 - HARRINGTON-PORTNEY HOUSEHOLD HEALTH MODEL ..............................................................138 A PPENDIX 2 - EXAMPLE OF TOP -DOWN PAYMENT CARD....................................................................................140 A PPENDIX 3 - ‘FULL’ MODEL PARAMETERS ACROSS SYMPTOMS AND COUNTRIES.........................................141 A PPENDIX 4 - SCENARIO AND VALUATION QUESTIONS (TRANSLATION)..........................................................144 REFERENCES...................................................................................................................................................................146 THE TRANSFERABILITY OF BENEFIT TRANSFER: AN EXPERIMENT IN VARYING THE TRANSFER CONTEXT.........................................................................................................................................................................148 INTRODUCTION .............................................................................................................................................................149 M ETHODOLOGY ............................................................................................................................................................151 M ODELLING DICHOTOMOUS CHOICE RESPONSES ...................................................................................................152 M ODEL SPECIFICATION AND BENEFIT TRANSFER..................................................................................................154 HYPOTHESES..................................................................................................................................................................155 SITE CHARACTERISTICS...............................................................................................................................................157 SURVEY SCENARIO ........................................................................................................................................................158
viii
SURVEY RESULTS..........................................................................................................................................................161 DISCUSSION.....................................................................................................................................................................173 CONCLUSIONS ................................................................................................................................................................174 A PPENDIX 1 - A SIMPLE EXAMPLE OF BE NEFIT TRANSFER ERROR ....................................................................177 A PPENDIX 2 - SCENARIO AND VALUATION QUESTIONS (TRANSLATION)..........................................................179 REFERENCES...................................................................................................................................................................185 HOW MUCH IS ENOUGH? THE VALUE OF INFORMATION FROM BENEFIT TRANSFERS IN A POLICYCONTEXT.........................................................................................................................................................................187 INTRODUCTION .............................................................................................................................................................188 PREVIOUS RESEARCH ....................................................................................................................................................189 THEORY AND METHODS ..............................................................................................................................................192 DATA...............................................................................................................................................................................201 RESULTS..........................................................................................................................................................................203 CONCLUSIONS ................................................................................................................................................................209 A PPENDIX 1 - A META-ANALYSIS OF WTP FOR WASTE WATER TREATMENT IN COASTAL ARE AS ............211 A PPENDIX 2 - REGRESSION PARAMETERS USED IN BENEFIT FUNCTION TRANSFERS.......................................212 REFERENCES...................................................................................................................................................................213 ANNEX 1 JACO VISITORS SURVEY (DECEMBER 1997)...................................................................................216 ANNEX 2 JACO HOUSEHOLDS SURVEY (DECEMBER 1997)...........................................................................228 ANNEX 3 PUNTARENAS HOUSEHOLDS SURVEY (NOVEMBER 1998)..........................................................241 ANNEX 4 BEACH VISITORS ILLNESS EPISODE SURVEY (JANUARY 1999)..............................................255 ANNEX 5 COLOUR CODED WATER QUALITY LADDERS ................................................................................268 ANNEX 6 WATER QUALITY MAPS (JACO VISITORS AND HOUS EHOLDS)..............................................269 ANNEX 7 WATER QUALITY MAPS (PUNTARENAS HOUSEHOLDS)............................................................270 ANNEX 8 MAP OF CENTRAL PACIFIC COAST OF COSTA RICA...................................................................271 ANNEX 9 MAP OF JACO..............................................................................................................................................272 ANNEX 10 MAP OF GREATER PUNTARENAS.......................................................................................................273
ix
Introduction Why conduct benefit-cost analysis of development projects that provide basic needs such as sanitation? Why try to place a monetary value on economically ‘intangible’ health and environmental effects?
Why don’t development agencies simply fund the wastewater disposal systems which
afford the poor the basic sanitary and environmental conditions people in rich countries take as basic rights? Only twenty eight percent of people in low-income countries had access to some form of sanitation in 1995 (World_Bank 1998). By the year 2000 it has been projected that 2.6 billion people will require new sanitation facilities worldwide (Gleick 1993). This figure does not include those people with adequate in-house sanitation, but inadequate disposal of wastewater, resulting in ‘external impacts’ on health, recreation and aesthetics.
Glancing at the figures of the lack of
adequate water and sanitation services in developing countries one may be forgiven for asking what role economic analysis has to play.
The answer to this introductory rhetorical question is that in the short and medium term funding is insufficient to provide these services to all those who need them. Limited funding requires prioritising development assistance by some measurable criteria of welfare per dollar invested.
Needs and
wants also vary according to the different impacts of water pollution, requiring a consistent approach to weighing peoples preferences between the sites requiring assistance. There should be a growing awareness, also among non-economists, that the costs of poor sanitation are not as economically intangible as they may seem from a developed country perspective.
Well known examples of the external costs of water pollution are; the 1% of Jakarta’s GDP annually spent by households on boiling tap water (World_Bank 1992), or the equivalent of 29% of slumdwellers income that would need to be spent on boiling water in Lima, Peru (Webb et al. in Bosch 1998). The direct cost of illness and defensive expenditures due to poor wastewater treatment are very tangible to households. Eight hundred thousand households in Jakarta spend an average of $500 in capital costs for private septic tanks (1997GNP/cap. was $1110), while in Cairo the per capita operation and maintenance costs of on-site sanitation exceed the costs of conventional sewerage by 400-500% (Guimont in Bosch 1998).
The impacts on property prices and other
multiplier effects are also significant. Peru’s 1991 cholera epidemic is estimated to have caused
1
losses to agricultural exports and tourism in the order of $180 million (USAID in Bosch 1998), with some estimates as high as $1 billion (Loetscher 1999; World_Bank 1992). However economic benefit-cost analysis of wastewater projects is rarely performed, and in even fewer cases are the externalities of water pollution valued monetarily.
The record of development funding allocation can also be improved. To cite examples from one of the leading development agencies, only 44% of World Bank water supply and sanitation projects approved in 1992 were shown to be economically sustainable throughout their planned lifetime (Loetscher 1999; World_Bank 1994). Another review of World Bank Staff Appraisal Reports from 1996-97 revealed that only 30% of urban projects were rated good or acceptable (Bosch 1998). Frequently identified weaknesses where the lack of alternative designs; the lack of rigorous benefit-cost analysis, including the use of opportunity costs, evaluation of taxes and subsidies, unclear and unjustifiable assumptions; and weak sensitivity/risk analysis. These problems are likely to be the rule rather than the exception for bilateral and multilateral development agencies.
The contingent valuation (CV) method holds out the promise of providing input to more comprehensive and rigorous benefit-cost analyses and quantification of opportunity costs. Based on economic welfare theory, the CV method provides testable assumptions about household behaviour when facing decisions between paying for so-called ‘intangible’ environmental amenities, and other goods and services. Welfare from increased provision of these amenities is given a monetary interpretation usually through households’ stated willingness-to-pay (WTP). The decision not to apply benefit-cost analysis and non-market valuation to particular areas of environment and development policy should require agencies to be specific about which alternative criteria they will use to allocate scarce development aid and fiscal resources.
2
The popularity of the contingent valuation method in the US and Europe has lead to a steadily increasing number of applications in lower The US National Research Council’s Committee on Wastewater Management for Coastal Urban Areas concluded in 1993 that contingent valuation studies “are seldom done for wastewater systems, but are potentially important. The results would indicate which groups receive benefits from improved wastewater management and what the approximate magnitude of those benefits may be. These results would also be useful in predicting public acceptance of new financing burdens, especially where large increases in financing requirements are expected. This information could be used to tailor financing strategies to the temporal and spatial distribution of anticipated benefits, thus minimising the chances of placing unjustified burdens on any sector of the population.”(NRC 1993).
income countries (Ekbom 1993; Georgiou et al. 1997; Whittington 1998). Apart from a handful of excellent ‘state-of-the-art’ CV studies on-site, it is likely that the most frequent use of willingness-to-pay estimates comes from extrapolation from studies in the literature to new policy sites, or benefit transfer.
With the advent of non-market
valuation databases accessible over the internet, such as the Environmental Valuation Reference Inventory (EVRI), a wider range of
secondary
estimates
are
becoming
available, faster and cheaper than ever
before. The prospects of information cost savings for development agencies and their consultants who conduct non-market valuation are large.
However, this collection of articles gives reason for sobriety regarding benefits transfer. Loetscher (1999) argues that unsustainable projects not only represent a misallocation of scarce funds. They also leave beneficiaries disappointed and prejudiced against the future use of certain technologies. Much the same argument could be used for the indiscriminate extrapolation of results from nonmarket valuation methods. It will only take a few exaggerated predictions of the economic benefits of sanitation, in a few high profile projects, for non-market valuation to be discredited as a policy analysis tool within a particular development agency. Although the practice of benefit transfer has been motivated by policy-needs, it presents a range of interesting academic and research questions. A focus of this work is therefore to uncover the limitations of benefit transfer, as well as the conditions under which it is more likely to succeed.
3
Executive summary of results The thesis is composed of a methodological review and four empirical articles. Willingness-to-pay results for the different studies are not summarised up front because, in the spirit of quality control of benefit transfer, the reader is encouraged to see the result in context.
Article 1 constitutes a methodological review of benefit transfer approaches and how they fit into environmental policy decision-making. These approaches include transferring unadjusted mean welfare estimates, simple adjusted means, benefit function transfer and meta-benefit function transfer. The article also reviews the use of computerised valuation reference inventories as a new research tool in benefit transfer, citing the Environmental Valuation Reference Inventory (EVRI) as an example.
The literature review focuses on the contingent valuation method, although broad
conclusions should be applicable to other non-market valuation methods. The article concludes that from a conceptual point of view and a review of past experiences, benefit transfer may have important applications in policy scoping, screening, and possibly priority setting. However, the degree of transfer error and relatively lacking theory to explain deviations between sites does not recommend using the benefit transfer ‘kit’ in setting Pigouvian taxes or user fees.
Specialised
reference databases on non-market valuation studies, such as EVRI, hold out the promise of making benefit transfer much cheaper and faster1. But the article asks whether they make transfers more reliable. It concludes that benefit transfer techniques are generally speaking not a replacement for primary non-market valuation studies, keeping in mind that primary contingent valuation studies have yet to gain wide acceptance as an input to environmental policy analysis, especially in countries outside the US.
While computerised databases such as EVRI have an important role to play in making non-market valuation results better known, I share several other authors’ view that we cannot avoid the central role of expert judgement. Although no such system is on the market yet, future computerised expert systems for benefit valuation should be applied with much caution and an awareness of the potential transfer errors. Recently, expert systems such as SANEX for sanitation system selection have
1
The EVRI is a database of non-market valuation studies, to be used in conjunction with the benefit transfer methods discussed here, rather than as an expert system for benefit transfer. 4
demonstrated levels of accuracy acceptable for pre-feasibility studies of sanitation financial costs to within errors of +/-30% (Loetscher 1999). But such cost transfers still rely on good judgement by the user, combined with the validation of on-site data in determining reasonable model inputs. Perhaps the greatest potential of the benefit transfer literature is the effort to consistently document how subjective estimates, prior to doing a study at the policy site, can affect decision-making. A stepwise decision-framework for institutions applying non-market valuation estimates is outlined which would make the use of benefit estimates in policy-making more consistent. A review of the literature also reveals that further studies are needed regarding how different benefit transfer approaches affect policy decision, or what has been called ‘tests of importance’ (Smith 1992).
Article 2 discusses issues of validity, reliability and robustness of a contingent valuation study of beach visitors’ willingness to pay for improvements in surface and groundwater quality due to waste water treatment in the coastal town of Jaco, Costa Rica. The double-bounded dichotomous choice approach was used here2. The study has its place in this collection as an illustration of the quality control issues a user of contingent valuation estimates should check before including them in policy analysis or as a basis for benefit transfer. While aiming to apply all of the 1993 NOAA3 Panel recommendations on contingent valuation (Arrow et al. 1993), the study discusses several common pitfalls such as the effect of substitute sites on WTP, the ‘embedding’ of the water quality attributes in a larger good, and the incentive incompatibility of the ‘payment vehicle’ used to elicit visitors’ WTP. It thus complements the on-going discussion of the NOAA recommendations (Carson et al. 1996; Carson et al. 1998), cautioning against their uncritical use an ‘industry standard’ for contingent valuation.
Although the study site is a tourist resort, some of the methodological problems encountered should be relevant for other types of development. Open access rights to coastal beaches is a particular problem for defining a politically credible and incentive compatible means for visitors to pay for local wastewater treatment. The NOAA recommendations to test whether WTP is sensitive to the scope of environmental improvements is shown to be complicated by little prior public information concerning water quality levels at the study site. Furthermore, sewerage and wastewater treatment 2
A referendum style question asks respondents to support or reject a policy leading to an environmental improvement at a specified price (e.g. a user fee). In a double bounded approach, the same question is then repeated but with a higher or lower asking price depending on the respondent’s first reply.
5
provides multiple use benefits from improving surface and groundwater, complicating the interview information load of a realistic scope test.
The study does not uncover significant sensitivity of WTP to the increasing scope from the improvement of recreational seawater quality only to the improvement of all surface and groundwater resources in the area. While failure to conduct a scope test, or to show scope sensitivity effects, is a critique of the internal validity of contingent valuation results, it is argued that this ‘standard’ should be viewed in light of the policy application. Scope tests were a central issue in the litigation proceedings following the Exxon Valdez oil spill in Alaska, for which the NOAA Panel was primarily convened.
For applications with lesser legal/political demands on accuracy, such as scoping and
screening, and situations where the absence of scope is given an economic rationale, I argue that CV estimates may still have policy relevance. As one reviewer put it, “there are horses for courses”.
As an alternative to making WTP contingent on the improvement in water quality, Article 3 evaluates beach visitors WTP to avoid one day episodes of illness associated with sewage pollution of bathing water.
Instead of asking respondents to make a subjective evaluation of a damage function
stretching from pollutant emission to health impact, they here consider only changes in this health endpoint. CV estimates using an iterative payment card approach4 in Costa Rica were compared to an almost identical study conducted in Portugal a year earlier. Illness episodes considered were a full day of eye irritation, gastroenteritis, and coughing. To date these type of benefit estimates exist almost entirely in developed countries and the promise of benefit transfer is alluring. However, statistical tests of the function relating household socio-demographic characteristics to WTP, significantly reject (5% level) that benefit functions5 are drawn from the same underlying population. While it may come as no surprise to the uninitiated that Costa Ricans and Portuguese households are different and relate to the CV questions differently, this test is a check on whether we can statistically justify adjusting WTP by household characteristics. Including recreation, environmental, and health
3
National Oceanographic and Atmospheric Administration Respondents are asked whether they would pay prices specified on the payment card, starting at zero and repeating the question until they reach the highest amount on the card they would be willing to pay to avoid the illness episode. 5 Throughout we will take ‘benefit function’, ‘valuation function’ and ‘WTP function’ to mean the estimated regression function, unless otherwise stated. 4
6
attitudes/history as explanatory variables shows that there are also very few consistent non-economic explanations of WTP across the episodes and across countries.
Transfers of mean unadjusted WTP, as well as WTP adjusted for GNP/capita, for stated household income, and for household socio-demographic characteristics, were conducted between the two countries. Unadjusted mean WTP lead to transfer errors of 50-100% depending on the site used as a basis for comparison. Adjusted transfer errors were larger, with 54-120% transfer errors for the household income adjustment, and 55-129% error for the adjustment including other household characteristics. In this study, the increasing divergence of transferred WTP is a result of statistically different benefit functions, although this fact does not on its own lead to larger transfer errors, as is demonstrated in a later study. As a surprise, when adjusting WTP by GNP/capita transfer errors are only 6-9%.
Rather than an endorsement of this oft practised “gunslingers’” approach to
valuation, it is a coincidence of being too “quick on the draw”. Closer examination of income statistics and travel costs show that, had visitors samples been more representative of national population characteristics in Portugal and Costa Rica, the GNP/capita-adjusted transfers would have been much further off target, while unadjusted transfers would have been more reliable.
In order to obtain an estimate of the aggregate benefits due to wastewater treatment that reduce pathogen exposure, the willingness to pay at a health end-point must be coupled to epidemiological exposure-response risk functions.
A relevant point of comparison is therefore the possible
prediction error of exposure-response risk functions. A review of epidemiological studies has shown that overall relative risk for swimming in relatively polluted water, versus swimming in clean water, range between 0.4 and 3.0 for studies of respiratory and gastroenteritic symptoms (WHO 1998)6. Transferring epidemiological information is in other words even more uncertain than transferring contingent valuation of illness episodes. Rather than a carte blanche for benefit transfer, it should lead to rigorous evaluation of all the modelling assumptions that go into extended benefit-cost analysis.
The range of aggregate net benefits can be several orders of magnitude when considering
wastewater treatment projects with health impacts. There are no obvious reasons why this level of uncertainty doesn’t also apply to other pollution-related health problems.
6
Relative risk of swimming in clean water, versus not swimming at all, ranged between 1.0 and 2.5 for gastroenteric symptoms alone (WHO 1998). 7
Article 4 returns to WTP scenarios describing a wastewater treatment plan and resulting improvements in surface and groundwater quality.
In this study, household responses from city
districts of the port of Puntarenas are compared to those of households in the town of Jaco, about an hours drive down the coast.
An intuition of benefit transfer is that site similarity should reduce
transfer error (Desvousges et al. 1992), but the neoclassical economic theory upon which contingent valuation is based provides little richness of detail regarding what makes a site similar for purposes of valuing environmental amenities.
Explanatory variables in contingent valuation are largely identified ad hoc7, and here we examine amongst others whether vicinity is a good proxy for similarity. In addition to socio-demographic characteristics in census data, we also examine characteristics of sanitation, resource use, implementing agency and environmental attitudes which we know to vary between sites and to explain WTP significantly. Statistical tests show that Costa Ricans are ‘alike’ in the way sociodemographics affect WTP, but that there are significant differences between adjacent city districts, as well as between urban and rural areas in those models which include all the hypothesised variables. Transfer errors between all subsamples do not exceed +/-30%. This is comparable to transfer errors of financial cost predictions made by expert systems such as SANEX (Loetscher 1999).
Once again these encouraging numbers hide some significant details. Transfer errors of simple income-adjustment are almost twice as low as for the transfer of the unconditional mean WTP. But models using more socio-economic explanatory variables make little improvement on transfer unadjusted mean WTP. Using a ‘full model’, containing all the variable types mentioned previously, actually increases transfer error relative to the socio-economics-only model. Closer inspection of descriptive statistics for the subsamples reveals that the adjustment effect of several significant explanatory variables cancel each other out. The study demonstrates, counter to most of the earlier literature, that the more complex the contingent valuation model, the greater is the probability that benefit function transfer will not reduce transfer error relative to transferring the ‘raw’ unadjusted mean.
This assumes contingent valuation studies continue to be specified ad hoc, and that the
benefit transfer practitioner has no statistics on model variables at the policy site with which to make 7
I don’t use the term in a pejorative sense. In Latin it means something close to contingent on the circumstances, i.e. “with a particular end or purpose”, “addressing specific or immediate problems or needs” and “fashioned from whatever is immediately available” (WWWebsters dictionary). 8
judicial adjustments. Development agencies should take note as lack of census data in developing countries is a limitation of benefit transfer.
Article 5 compares the benefit transfer results with data from the ex ante and historic costs of a sewerage and treatment project, and the actual costs of doing benefit transfer and CV surveys in Puntarenas. Simple Bayesian updating is used to update expected net benefits of a wastewater treatment project with each new piece of information on household WTP. The change in opportunity costs of mistakenly deciding for or against implementing the project are weighed against the incremental study cost. In this way we determine after the study has been done, what would have been (ex post) the efficient amount of information to collect about households at the policy site. However, from a practical point of view the article argues that ex ante, the best the policy-maker can do is to decide whether there is sufficient information to make a decision for or against the policy, given her confidence in the non-market valuation and cost engineering results. A meta-analysis of CV studies of WTP for wastewater treatment finds significant correlation with household income across developing country studies. The resulting meta-benefit function is then used to update the initial (prior) WTP value in a stepwise Bayesian updating process of benefit estimates.
Given our study costs and with a wastewater treatment project covering 6000
households, we find that every incremental benefit transfer study is ‘worth it’, economically speaking. For a CV survey size of about 700 ‘valid’ WTP responses, the contingent valuation ‘cut-off point’ is at about 1500 households, where the costs of the study exceed reduction in expected opportunity cost per household. A rule of thumb under these conditions would be, don’t survey more than half the population. As bizarre as that sounds, it implies that contingent valuation in small rural contexts is probably not the most efficient way to make a decision. Although variable CV survey costs are lower in developing countries (Whittington 1998), there are often high fixed costs which set a lower limit to an efficient CV study. This constraint becomes even clearer when we use the more incentive compatible, but less efficient, dichotomous choice contingent valuation method.
Scenario analysis using the Bayesian approach shows that, depending on what prior information about WTP the analyst chooses to use (given its availability),
9
the project can be deemed
economically sustainable, unsustainable, or uncertain8.
Using a stepwise Bayesian updating
approach we uncover how susceptible policy analysis is to “errors by omission” in benefit-cost analysis. This last article backs up the claim made in the methodological review that best-practice guidelines are needed within development agencies for which and how non-market valuation estimates are to be admitted to economic feasibility studies. An old adage of environmental economists is that “it is better to value something poorly than not at all”. The opportunity cost arguments in this last article refute that idea. However, the collection of articles as a whole shows that there is sufficient methodology now available to use non-market valuation results consistently but critically, in environmental policy-making, even for such a multi-faceted environmental amenity as water.
Issues for further research What is the external validity of the results presented above?
Can the reader expect the same
magnitude of benefit transfers errors in other contexts, or expect the explanations for lack of convergence to be the same? Several issues require a brief discussion including; the choice of benefit transfer strategy, whether doing contingent valuation in developing countries is ‘different’, and problems related to providing information on multiple project impacts, including institutional transaction and transformation costs.
The discussion also serves as a basis for further research
questions that arose during the study.
Benefit transfer strategies The first question concerns a more precise definition of similarity in comparing study and policy site contexts before undertaking benefit transfer.
This question is by implication fundamental to
contingent valuation, but we only outline the principal positions so that the reader can better evaluate which strategy was adopted in the empirical work that follows.
One line of thought runs that benefit transfer can be attempted where study and policy contexts are “similar”, or if they are different, using benefit functions that are complex enough to capture relevant 8
Although the financial cost-recovery for the project is uncertain based on the WTP results, the reader should be aware that all external effects were not evaluated here. 10
differences (Desvousges et al. 1998; Desvousges et al. 1992). This could be called a contextual mitigation approach. This is an eclectic approach because most contingent valuation studies are ‘steeped in context’, focusing on the effects of discrete environmental impacts in a particular policysetting.
It begs the question, what aspects of the context - what contingencies - have incentive
effects and should be considered by the household during the survey?
Another tack is to focus on producing and transferring benefit estimates which are as context-free as possible, where ideally no site-specific corrections would need to be made. A good example is the valuation of health effects, or endpoints, on the margin, under certainty, and with little or no reference to their cause.
Using what CV researchers have called ‘home grown values’ (Cummings et al.,
1995) in a benefit transfer context - values influenced as little as possible by the survey scenario information - could be labelled a generic progressive approach. An aim of such studies is to establish a database of transferable benefit estimates for future policy analysis (EC 1999). This is useful when a range of policy options with different levels of impact and baselines must be compared. Willingness to pay responses which do not refer to the baseline environmental context are more easily applied in marginal benefit-cost analysis. A relevant question here is what aspects of context must we ask the respondents not to consider for benefit estimates to be as generic and transferable as possible?
Both approaches discuss context, contingencies and constraints on households choices almost as synonyms. The difference in approaches lies only in the trade-off between the internal and external validity of a valuation study that comes from making respondents choices more or less contingent on the constraints of the particular policy context. From a practical point of view, most non-market valuation studies will continue to be commissioned with a particular policy in mind, and the focus will be on demonstrating internal validity to the decision-maker.
Others have argued that without
specifying their binding constraints, the choices expressed by households in a CV survey are, economically speaking, inconsequential (Carson et al. 1999). Both the generic and contextual approaches employed in this collection of articles point toward this conclusion.
More empirical
evidence is needed on what aspects of context have incentive effects and thereby affect benefit transfer.
11
Benefit transfer in developing country studies There are many good examples of general and specific guidelines for designing contingent valuation scenarios (Arrow et al. 1993; Brookshire and Neill 1992; Carson et al. 1999; Cummings et al. 1986; Desvousges et al. 1992; Kask and Shogren 1994; Mitchell and Carson 1989). However, few contend that using contingent valuation in environmental policy analysis for developing countries is any different from in the US or Europe. Still, using such a phrase as ‘developing country case study’ in a journal title is often meant to cast new light on the well-tried CV method. Is conducting contingent valuation studies any different in developed countries? Are there conditions which limit the conclusions of these articles to developing countries, or perhaps to some subgroup of them?
Whittington (1998) has discussed several lessons learned which may distinguish CV studies conducted in developing countries; (i) conveying the willingness to pay concept to decision-makers and interviewers, (ii) cultural and idiomatic interpretation of respondents’ answers, (iii) setting very high or very low prices in referendum-type willingness to pay which ‘conflict’ with poor households’ interests or the financial aims of the agency, (iv) constructing joint public-private CV scenarios typical of sanitation projects, and (v) ethical problems related to information given to the respondents during the survey. Thanks to lower survey costs and higher response rates, he concludes that conducting high quality CV surveys may actually be easier in developing countries, as long as the challenges above can be overcome.
The conclusions presented in this collection of articles support this argument. Furthermore, better and cheaper primary studies in developing countries are in fact arguments against using benefit transfer instead of primary CV in policy analysis, ceteris paribus. Articles 3 and 4 show that when all other things are not equal, the arguments against using only secondary estimates become even more compelling.
With the resources available, and in the particular Costa Rican setting of the
studies reported here, the challenges posed by points (i-iv) were surmountable. However, Article 2 argues that the ethical challenges of contingent valuation studies may require relaxing some of the NOAA recommendations.
12
For example, focus groups and pilot surveys conducted during the study constantly brought up households’ evaluation of water quality or health risk in the absence of public information. Households also showed considerable concern for the ‘hidden’ costs of public policies in terms of poor or lacking provision of the promised level of services, lacking enforcement of payment and free-riding by others, and the frequent deviation of funds, all part of what economists would refer to as policy transactions costs.
Even in Costa Rica, with a long record of natural resource
management policies, these information and transaction costs regarding water quality are significant issues. In countries with relatively inexperienced environmental protection agencies, less access to the press for whatever reason, and more corrupt or inefficient public utilities, the ethical information requirements of a CV survey will be stronger, and benefit transfer more complicated.
There are some further issues in addition to those mentioned above, which affect benefit transfer in a developing country. As hinted at earlier, where the focus is on small scale development projects, e.g. in rural areas, contingent valuation studies may be too expensive relative to the aggregate value of the information it provides. In and of itself, this may be an argument for benefit transfer, and is further discussed in Article 5.
Apart from income levels, what sets developing countries apart in economists’ minds is a less developed market-economy, which often is synonymous with weaker or unique private property rights regimes (Brookshire and Whittington 1993). If citizens’ environmental rights, such as to potable water or safe recreational waters, are not legally established, the basis for willingness-to-pay studies may actually be stronger. While this argues in favour of some primary CV applications in developing country, different legal or customary rights may affect WTP responses. Unless different regimes can be controlled for in significant and predictable ways, benefit transfer can run into trouble.
Finally, benefit transfer may be more difficult in developing countries simply because the availability of similar studies is smaller. While this depends on the definition of ‘similar’, any one developing country today has few if any existing non-market studies of the same policy. This is especially true of ambient air and water quality, which are typically policy areas which lag behind natural resource management, with Costa Rica as an example. If comparable studies do exist, the benefit function transfer method will be limited by the frequent poor availability of environmental monitoring and
13
socio-economic census-type data at the policy site. Even if census data do exist, large scale ruralurban migration, changing birth rates, or rapid economic growth - all vicariously used as definitions of development - make the ‘shelf-life’ of descriptive statistics shorter than in the so-called developed countries.
In Table 1 a few macro indicators of relevance for non-market valuation are compared for Costa Rica and average low and low-middle income countries. For practitioners wishing to transfer the valuation results in this collection of papers, Table 1 provides a first glance at the broader context of the valuation results contained here. The issues discussed below are salient examples, rather than an exhaustive list of indicators of relevance for benefit transfer across country contexts.
Costa Rica ranks in the upper half of the category of lower-middle income countries, as defined by the World Bank. Income levels obviously vary between and within rural and urban areas, with clear consequences for quick and dirty adjustment methods using national averages. While, the comparison of average poverty levels and income distribution between an average low income country and Costa Rica is not very meaningful, Costa Rica’s poverty level is very different from e.g. neighbouring Nicaragua (to cite a tempting site for benefit transfer from a development agency point of view). Distinguishing household willingness and ability to pay will therefore be a more relevant issue in Nicaragua than Costa Rica. Conducting transfers to a country with a history of very high inflation will also call for extra caution, as large devaluations or new currencies may make consumer price indices unreliable. Nicaragua during the 1980’s is a relevant example. Respondents may also include inflation uncertainty considerations in their WTP responses, e.g. through providing strategic responses based on their expectations of frequent increases in public utility rates. This was less of a concern in Costa Rica.
14
Table 1. How representative is a contingent valuation study in Costa Rica ?
Selected development indicators: 1997 GNP/capita - Atlas methodology (ranking) - PPP-adjusted (ranking) Population below international poverty line ($1/day, 1989) Gini index Consumer price index (average annual growth 1990-97) Population growth rate (ages 0-14, average. p.a., 1997-2010) Adult illiteracy rate (above age 15, 1995) Freshwater resource availability (cubic meters per capita) National access safe water (1995)
Costa Rica US$2680 (95) US$6510 (85) 18.9%
Country averages: Lower middle Low income income countries* countries** definition: definition: US$786-3125 < US$785 25.6%* 43.8%**
47.0
57.1*
50.3**
17.4%
1.1%*
62.9%**
-0.7%
-0.6%
0.7%
5% male 5% female 27425
14% male 25% female 6878
24% male 45% female 6252
100%
78%
69%
Urban access to sanitation 100% 75% 29% (on-site, 1995) (1982) Source: World Development Indicators 1999, World Bank. Note: The figures marked with stars are country specific comparisons: *Panama (GNP/cap. $3080), **Nicaragua (GNP/cap. $410)
Table 1 illustrates Costa Rica’s falling birth-rate and the dramatic changes that may occur in the census data used for benefit transfer. The last census was conducted in 1984 when the birthrate was positive, young families larger and disposable household incomes smaller, to name just some of the relevant implications.
Adult literacy in Costa Rica is higher than in most low-middle income
countries. As a proxy for education levels and access to information on environmental issues in the press, this may have consequences for preferences. It is certainly an issue in determining costs of a primary CV relative to benefit transfer, as high illiteracy may raise non-response rates and/or require more extensive use of focus groups to design visual scenario representations. In some cultures, women may be selected as respondents because they are in charge of household expenditures, while being more likely to be illiterate than their husbands. These issues are tackled in papers 2 and 4, respectively.
It is apparent that Costa Rica is a tropical country with abundant supplies of water relative to most other developing countries. Even though water pollution is becoming a national policy issue, households have until recently not experienced scarce potable water or reduced access to
15
swimmable bathing sites. Water-borne household excreta disposal has also meant that households quite easily solve in-house sanitation problems, but that the external impacts of urbanisation are more far-reaching. Relative preferences in drier countries are likely to be different.
Finally, Costa Rica was chosen as a case study site because of the relative accessibility of background water quality and socio-demographic data, ease of research logistics and policy interest from the national water utility and environmental authorities. In countries where these conditions are less favourable, costs of obtaining benefit estimates of a certain accuracy will probably be higher. While the empirical results of this research may therefore be less transferable due to these idiosyncrasies, the issues regarding the relevance and reliability of benefit transfer should be all the more pertinent. Contingency and context In conjunction with the research on reliable econometric techniques in non-market valuation, there lies an important research challenge in identifying consistent ‘non-economic’ predictors of consequence for household spending on environmental amenities.
The particular challenge of a
research agenda in benefit transfer is to find aspects that systematically affect household choices, while keeping in mind that this information must be readily available without having to do large surveys on site.
Article 2 discusses how respondents often implicitly consider biophysical linkages and resist attempts to isolate attributes or resources during the valuation exercise.
In the water sector, a contextual
valuation approach would emphasise the fact that a policy of sewerage and wastewater treatment leads to different pollution levels in different sources of drinking water and recreational sites. Spulber and Sabbaghi (1998) emphasise the need for planning and economic models of the water sector to account for water as a multi-graded product. This calls for considering the joint-products of pollution control policies in CV scenarios. If they are realistic, CV scenarios often lead household to think of diverse impacts, which should be made explicit through their inclusion or exclusion in a systematic fashion.
16
In the same vein, institutional economics offers a particularly rich mine of hypotheses for contextual aspects that affect contingent valuation.
Whittington (1998) argues that from a theoretical
perspective “it is not possible to value a project independently of how it is paid for or the institutional regime that is assumed to be in place when the project is implemented”. The overwhelming majority of institutional issues researched in CV studies try to isolate the individual incentive effects of different willingness-to-pay question formats (open-ended, dichotomous choice, iterative etc.) and types of payment vehicle (donation, user charge, income tax etc.)9. The wider implications of institutional changes on the rest of the scenario context has received little attention. A recent CV study of watershed management policies demonstrated that institutional characteristics of the funding mechanism had significant impacts on WTP, as well as significant trade-offs between institutional and other policy attributes (Johnston et al. 1999). In this case the respondents conditioned their stated valuations on ex ante assumptions concerning the government’s ability to dedicate new tax revenue to the specific policy (op. cit).
To cite one possible route, Ostrom has presented a framework for evaluating the costs of institutional transformation and transaction in the management of common property resources (CPR’s) (Ostrom 1990). Open access lakes and coastlines are veritable common pool resources, and theories on CPR’s management should be highly relevant in the valuation of their water qualityrelated amenities.
Too many to detail here10, Ostrom has, through an extensive case material,
identified a number of ‘situation variables’ that affect whether institutions choose to adopt new rules for appropriating resources from the common pool. Appropriator institutions also have ‘rules for changing rules’, which in the case of environmental economics is the extended benefit-cost analysis. In Articles 1 and 5, situations when formal benefit-cost analysis is not ‘worth it’ and some alternative decision criteria should be adopted, are discussed. From non-market valuation’s viewpoint, many of the transformation costs and transactions costs of the new institutions should also apply to whether households adopt or reject a new policy. Furthermore, how much households are willing to pay should also be affected by these costs.
9
For an overview of response incentive issues see (Carson et al. 1999). Examples include, appropriators residence relative to the CPR, the number of appropriators involved in multiple use situations together, heterogeneity of interests, autonomy to change rules, legitimacy of rules in use, past strategies of appropriators. 10
17
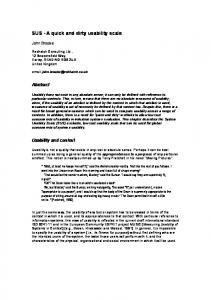
Figure 4 illustrates some of the implications for contingent valuation and benefit-cost analysis. In this example we assume that respondents believe they will be affected by costs of institutional transformation and transactions relating to the proposed policy, in addition to the proposed new user fee. Reasons may be that current institutions are inefficient in implementing a clean water policy, either with regards to fulfilling water quality standards or deviation of funds to other purposes than wastewater treatment. Respondents may expect more of the same or worse if there is a history of frequent institutional reforms. Crucially, these perceived costs are traditionally not made explicit in the CV scenario, i.e. are externalities of an externality-mitigating policy. In traditional CV scenarios, any costs of implementation are assumed to be observable and incorporated in the proposed new user fee.
Figure 4. WTP responses to environmental policy externalities Price M a x W T P u
M a x W T P b
“unbiased” survival curve (WTPu) “biased” survival curve (WTPb)
M e a n W T P u M e a n W T P b
0
% of respondents 100% voting yes at price p Protests / zero W T P r e s p o n s e s due to total costs of institutional change > expected benefits of proposed policy
If the respondent thinks there will be no additional costs incurred then response will be along an “unbiased survival curve”( WTPu). If a respondent expects any such costs to fall on her, she may change her maximum WTP and her response at any particular bid level from yes to no. This leads to a lower “biased survival curve” (WTPb), for the occasion presented back-to-front to resemble a demand curve.
The maximum WTP or ‘cut-off point’ would be lower in the latter case, while a
larger percentage of our sample would be observed as voting against or having zero WTP. In this case “bias” is not an appropriate term because attributes of the policy are a relevant part of the 18
amenity being considered. WTP responses may still be valid for the policy package as a whole, but it would be incorrect to conclude that what is measured is due solely to the improvement in water quality.
Two hypotheses are suggested. One that respondents use a ‘mark-down’ factor equivalent to the utility loss they expect from the policy externality. This may also take the form of weighting their unbiased WTP response by their subjective belief in implementation, also known as ‘probability of provision’ (Mitchell and Carson 1989). This lowers WTP of those who still vote yes to the policy, as well as leading to more protest or zero observations, as shown in Figure 4.
Article 4 provides
some evidence that respondents who derive positive welfare from the coastal water quality improvements, reduced their WTP due to localised policy externalities if they lived close to the wastewater treatment plant or preferred a different plant operator.
A second hypothesis, requiring less economic rationality and information, is that respondents who have a strong enough, but unquantifiable disutility from the policy vote no to implementation, while others do not change their response because some mental threshold has not been passed. Most CV studies decide to either model zero and protest responses as having non-positive WTP (truncation), or model them as having exactly zero WTP (censoring). An approach more consistent with policy transaction cost would ask willingness-to-accept compensation (WTA) of those respondents voting no to a policy, with detailed follow-up questions to identify those who had true negative WTP and why.
Demonstrating the significance of transaction and transformation costs has consequences for welfare measures, but also for the choice of decision criteria. External policy costs may make the cost and benefit sides of a policy package non-separable, which would lead to inconsistency in marginal analysis. Vatn and Bromley show how rights specification (polluter pays or victim pays) is crucial to the Pareto optimal level of pollution (Vatn and Bromley 1997). In the presence of different mitigation costs of polluter and victim, the rights structure is endogenous to the “efficient” levels of pollution through shifts in the abatement cost curve. If rights structure, or other institutional aspects of the mitigation policy, are endogenous to the mitigation benefits, supply and demand curves are non-separable, introducing a problem for welfare efficiency analysis. The practitioner should
19
therefore be able to justify that the responses to benefits of a policy are separable from all the policy’s costs.
An interesting empirical approach would be to use the methods of choice experiments, such as conjoint analysis from market research (Ben-Akiva 1994; Louviere 1988), to explore households understanding of situation variables such as those discussed by Ostrom.
Choice-based methods
could be used before a CV survey is conducted in order to discover the relative utility weights and rates of substitution between attributes of the policy. Better CV scenarios could be designed, and the relationships in scenario context could be better documented in order to explain transfer error. As non-market valuation studies continue to become more frequent, meta-analysis will be another important tool for finding the sources of transfer error. Institutional transaction and transformation costs of public policies may be particularly high in poor developing countries, which is where one would expect empirical studies to show the most significant effects. Conclusions This collection of articles has argued that given that policy-makers accept contingent valuation estimates as valid decision-criteria, and given that benefit transfer is already a common practice among environment and development agencies, research must focus on explaining the size of transfer errors between sites.
This research agenda is composed of at least four main aspects;
understanding differences in the way a survey is designed and conducted due to conditions specific for developing countries, as well as according to the type of externality being dealt with. Emphasis must always be placed on how data are analysed, but the research on WTP ellicitation and related econometric techniques has thus far been much more productive than that of study of context. How benefit estimates are actually used and the requirements of their users is also a relatively neglected field of research. This collection of articles tries to achieve a balance in the effort devoted to these four aspects, while encouraging future research in benefit transfer especially on scenario design and policy use. In doing so this work improves the methods of economic analysis and decision-making for development projects, providing specific recommendations on how to conduct and evaluate nonmarket valuation methods adapted to water pollution and coastal zone management policies.
20
References Arrow, K. J., Solow, R., Leamer, E., Portney, P., Radner, R., and Schuman, H. (1993). “Report of the NOAA Panel on Contingent Valuation.” Federal Register 58, 4601-4614 . Ben-Akiva, M. (1994). “Combining revealed and stated preference data.” Marketing Letters, 5(4), 335-350. Bosch, C. (1998). “A Methodology to quantify externalities in wastewater projects. The Costs of no sanitation.” Draft copy , Middle East and North Africa Region, World Bank, Washington, D.C. Brookshire, D. S., and Neill, H. R. (1992). “Benefit transfer: conceptual and empirical issues.” Water Resources Research, 28(3), 651-655. Brookshire, D. S., and Whittington, D. (1993). “Water resource issues in developing countries.” Water Resources Research, 29(7), 1883-1888. Carson, R. T., Groves, T., and Machina, M. J. “Incentive and informational properties of preference questions.” Plenary address. European Association of Resource and Environmental Economists, Oslo, Norway, June 1999. Carson, R. T., Hanemann, W. M., Kopp, R. J., Krosnick, J. A., Mitchell, R. C., Presser, S., Ruud, P. A., and Smith, V. K. (1996). “Was the NOAA Panel correct about contingent valuation?” Discussion Paper 96-20 , Resources for the Future, Washington D.C. Carson, R. T., Hanemann, W. M., Kopp, R. J., Krosnick, J. A., Mitchell, R. C., Presser, S., Ruud, P. A., Smith, V. K., Conaway, M., and Martin, K. (1998). “Referendum design and contingent valuation: the NOAA Panel's no-vote recommendation.” The Review of Economics and Statistics, 335-338. Cummings, R. G., Brookshire, D. S., and Schulze, W. D. (1986). Valuing environmental goods: an assessment of the contingent valuation method, Rowan and Allanheld, Totowa. Cummings, R. G., Harrison, G. W., and Rutström, E. E. (1995). “Homegrown values and hypothetical surveys: is the dichotomous choice approach incentive compatible?” American Economic Review(85), 260-266. Desvousges, W. H., Johnson, F. R., and Banzhaf, H. S. (1998). Environmental policy analysis with limited information. Principles and applications of the transfer method., Edward Elgar, Cheltenham, UK. Desvousges, W. H., Naughton, M. C., and Parsons, G. R. (1992). “Benefit transfer: conceptual problems in estimating water quality benefits using exiting studies.” Water Resources Research, 28(3), 675-684. EC. (1999). “Benefit transfer and economic valuation of environmental damage in the European Union: with special reference to health.” Final Report to the DG-XII, European Comission contract ENV4-CT96-0227 . Ekbom, A. (1993). “75 case studies on environmental economic evaluation in developing countries.” Working Paper, Environmental Economics Unit, University of Gothenburg. Georgiou, S., Whittington, D., Pearce, D., and Moran, D. (1997). Economic values and the environment in the developing world, Edward Elgar, Cheltenham. Gleick, P. H. (1993). Water in crisis: a guide to the world's fresh water resources, Oxford University Press, New York. Hoehn, J. P. (1991). “Valuing the multidimensional impacts of environmental policy: Theory and methods.” American Journal of Agricultural Economics(73), 289-299.
21
Hoehn, J. P., and Loomis, J. B. (1993). “Substitution effects in the valuation of multiple environmental programs.” Journal of Environmental Economics and Management, 25, 56-75. Hoehn, J. P., and Randall, A. (1989). “Too many proposals pass the benefit cost test.” American Economic Review, 79(544-551). Johnston, R. J., Swallow, S. K., and Weaver, T. F. (1999). “Estimating willingness to pay and resource tradeoffs with different payment mechanisms: an evaluation of a funding guarantee for watershed management.” Journal of Environmental Economics and Management(38), 97-120. Kask, S. B., and Shogren, J. F. (1994). “Benefit transfer protocol for long-term health risk valuation: A case of surface water contamination.” Water Resources Research, 30(10), 2813-2823. Loetscher, T. (1999). “Appropriate sanitation in developing countries: the development of a computerised decision aid,” Ph.D. thesis, University of Queensland, Brisbane. Louviere, J. J. (1988). “Conjoint analysis modelling of stated preferences. A review of theory, methods, recent developments and external validity.” Journal of Transport Economics and Policy(January). Mitchell, R. C., and Carson, R. T. (1989). Using surveys to value public goods. the contingent valuation method, Resources for the Future, Washington D.C., USA. NRC. (1993). Managing wastewater in coastal urban areas, National Academy Press, Washington D.C. Ostrom, E. (1990). Governing the commons - The Evolution of institutions for collective action, Cambridge University Press. Smith, V. K. (1992). “On separating defensible benefit transfers from smoke and mirrors.” Water Resources Research, 28(3), 685-94. Spulber, N., and Sabbaghi, A. (1997). Economics of water resources: from regulation to privatization, Kluwer Academic Publishers, Boston. Vatn, A., and Bromley, D. (1994). “Choices without prices without apologies.” Journal of Environmental Economics and Management, 26, 129-148. Vatn, A., and Bromley, D. W. (1997). “Externalities - A Market model failure.” Environmental & Resource Economics(9), 135-151. Whittington, D. (1998). “Administering contingent valuation surveys in developing countries.” World Development, 26(1), 21-30. WHO. (1998). “Guidelines for safe recreational-water environments: coastal and fresh-waters.” Draft for consultation , World Health Organisation. World_Bank. (1992). World development report 1992: development and the environment, Oxford University Press, Washington D.C. World_Bank. (1994). 1992 Evaluation results, Operations Evaluation Department, World Bank, Washington D.C. World_Bank. (1998). “World development indicators 1998.” , World Bank, Washington D.C.
22
Rapid valuation of environmental impacts - a review of benefit transfer approaches11.
Abstract Rapid valuation of environmental impacts is a common feature of project appraisal under time, budget and information constraints. As environmental valuation reference databases become publicly available - potentially containing dozens of benefit estimates for any one type of project - rapid appraisal will be made even more easier. This paper provides a number of cautions against the indiscriminate use of ad hoc approaches to benefit transfer and suggests more consistent alternatives such as meta-analysis and benefit function transfer. It reviews empirical studies of the potential errors under the different approaches. Examples are drawn mainly from the contingent valuation studies of health effects of air and water pollution and recreational amenities, although general conclusions should be applicable to other non-market valuation methods. While benefit transfer may be justified by time and budget constraints it is no replacement for primary non-market valuation studies. While most published original studies are subject to peer review there is no such quality control for benefit transfer within a typical project appraisal. When point estimates are used out of context with no cross-checking of the validity and accuracy of the original study, projects may be approved that upon closer scrutiny have low or negative economic returns. The paper is cautiously optimistic as to the role of benefit transfer when proper precautions are taken. It proposes a stepwise approach to dealing with valuation reference information and decisions of whether to conduct a primary valuation study or not. The paper concludes with a review of a recently developed valuation reference database, discussing its potential and pitfalls.
11
Acknowledgements: The initial idea for the paper came from a Ph.D. seminar held by Reed Johnson in 1997. The paper was elaborated during an internship with the Environmental Economics and Indicators Unit, Environment Department at the World Bank, July 1998. Many thanks to John Dixon (World Bank), Ståle Navrud (Agricultural University of Norway) and Jim Frehs (Environment Canada) for providing helpful suggestions on earlier drafts, and to the authors of various benefit transfer studies for graciously letting me cite their work. I would like to thank Environment Canada for granting access and permission to review the Environmental Valuation Reference Inventory (EVRI) database. 23
Introduction Benefit transfer involves the application of primary non-market valuation estimates to a secondary setting for which the original study was not expressly designed (Brookshire and Neill 1992). Estimates from the original study site are typically applied to a transfer context, or policy site, because time and financial resources are too scarce to conduct a primary study (Desvousges et al. 1992).
Even though the validity of non-market valuation methods such as contingent valuation is still debated for certain environmental goods and services, and despite highly varying levels of accuracy, “off-theshelf“ values are now frequently used by consulting firms and development agencies in projects appraisal. For World Bank projects Operational Directive 4.01 Annex B states that: “for each of the alternatives, the environmental costs and benefits should be quantified to the extent possible, and economic values should be attached where feasible.” Although non-market valuation methods are still being questioned by some decision-makers, feasibility is more often than not defined in terms of time and funding constraints. The first available valuation study that is “similar” to the project site is often transferred ad hoc to justify the investment. The question is no longer whether benefit transfer can be done, but when it should be done and how to do it in a consistent manner given the requirements for reliability demanded by the policy-context and the decision-maker.
Benefit transfer tests between sites within the same country have held out some promise of providing policy-makers with more timely, cheap and sufficiently reliable estimates to improve decisionmaking. However, this does not necessarily apply in cross-cultural contexts . Whether the potential error of benefit transfers relative to original studies is acceptable is an empirical question of the particular decision-setting at hand. Sometimes demonstrating benefits to accuracy within one order of magnitude will be enough for a project to be approved.
The potential errors of so-called “quick-and-dirty” versus “slow-and-clean” approaches has been studied for appraisal of productivity changes in agriculture (van de Walle and Gunewardena 1998). Even where market prices and production data are readily available, the use of rapid appraisal techniques that ignore, for example, distributional effects can wipe out the net social gains from public 24
investment. In their review of 19 irrigation project appraisals by the World Bank, van de Walle and Gunewardena show that “slow and clean” methods can lead to fewer projects being accepted, but that their net benefit are more robust to unexpected increases in project costs. They conclude that the increased cost of additional data collection (an integrated household survey) and more detailed appraisal would be dwarfed by the benefits of better project selection.
Where readily available market data does not exist, rapid assessment techniques are perhaps even more common. Impacts on health and environmental amenities provide the greatest challenges to non-market valuation and by extension to the practice of benefit transfers (Krupnick 1992). Due to biases in the publication literature towards studies with “unique” characteristics, there are still relatively few repeat studies that test the reliability of benefit transfers between sites or over time. This is particularly true of cross-country comparisons (Brookshire 1992) which are the most relevant for the operations of development co-operation agencies.
The paper provides an overview of the benefit transfer methods that are in use, their relative advantages and disadvantages. Conceptual as well as practical criteria for evaluating and comparing valuation studies are provided. It is beyond the scope of the paper to give coverage of all health and environmental impacts.
Instead, the paper provides illustrations of specific problems with
transfers for health effects of air pollution and loss of recreational amenities from water pollution. The handful of studies providing tests of benefit transfer at the time of writing are reviewed. For further reading, an excellent text book review and case study on all the steps of benefit transfer has been written by Desvouges, Johnson and Banzhaf (1998).
We first present a general overview of the benefit transfer approach and an example of the type of non-market valuation information available to the practitioner. Then criteria for validity and accuracy in choosing non-market valuation estimates are discussed. We show how the requirements for reliability will generally vary with the policy context. The next section goes through different approaches to benefit transfer when different levels of information are available to the practitioner. I then propose a stepwise approach to using secondary and primary valuation information under time and funding constraints. The last section presents an example of the Environment Canada - USEPA
25
Environmental Valuation Reference Inventory (EVRI) and the protocol used for defining study “similarity”. The paper concludes with several cautions regarding the use of such databases. An Overview of benefit transfer In recent years environmental economics and non-market valuation methods have seen increasing application to project appraisal in developing countries (Dixon et al. 1995; Ekbom 1993; Whittington 1998).
Still the large majority of valuation studies are from developed countries,
suggesting the possibility of transferring estimates for rapid appraisal. Practised for years by policymaking bodies under resource and time constraints, benefit transfer is now recognised as part of the recommended “valuation toolkit”
by some international agencies.
Whatever the information
available the general approach can be described in four general stages (ADB 1996.):
(i) Select reference studies. Case studies that are “similar” to the problem being considered are selected. A consistent definition of “similarity” is crucial to reliability of the transfer. In attempt to define a protocol for required benefit transfer information, the Environmental Valuation Reference Index (EVRI) sponsored by Environment Canada and USEPA provides one example of a set of characteristics by which to evaluate “similarity” and select studies (see Box 5).
(ii) Adjust values. This is the “benefit transfer step” per se which usually consists of a doseresponse quantification stage and a monetary valuation stage. When the primary valuation study concerns causes/doses of different magnitude to that considered at the policy site it is sometimes necessary to adjust the size of the response by making a simple linear extrapolation or “transferring” an existing empirical dose-response function12 . The adjustment of the monetary benefit values can be done in a number of ways requiring increasing levels of information and illustrated in Figure 3 below.
(iii) Calculate unit values per unit of time. Transferred values are multiplied by the number of individuals affected e.g. per day, requiring the definition of the market or relevant study population.
26
(iv) Calculate total discounted value. For benefit-cost analysis (BCA) purposes, the relevant time span of the impact is determined, and a discount rate chosen to arrive at the present value of benefits to be compared to that of the policy or project costs.
This four step process gives the impression that benefit transfer is a method applicable to most project and policy evaluation. While this is true at a very aggregate level, this paper argues that each type of environmental asset or health impact requires specific and detailed knowledge of the original studies.
Having conducted an initial literature search the practitioner may be lucky to find several
original studies of the same environmental problem from which to select estimates. This is illustrated for valuation of coastal water quality improvements due to waste water treatment in Table 1. In Table 1 there are 40 estimates of willingness-to-pay from 16 developing and developed countries. We can see that the point estimates cover a range of values spanning two orders of magnitude. Which of the studies do we choose? Should we use an average of benefit estimates from the most similar studies to our project site? Should we use some weighting criteria to reflect confidence in each study or to reflect cross-country differences in e.g. household income? Even when we look at WTP as a percentage of stated income or GNP/capita adjusted for purchasing power we see that there are still large discrepancies between studies. The proliferation of information illustrates the need for methods that make explicit a researchers criteria for evaluating the validity and accuracy of study estimates and for picking similar study sites.
12
Together these constitute a “damage function” and in section 4 we stress the importance of evaluating the reliability of different types of dose-response functions t hat are implicit in any non-market valuation study. 27
Table 1 - Willingness to pay for waste water treatment in coastal areas Author (year)
Country
Breivik and Hem (1986)
Norway (Kristiansand)
Breivik and Hem (1986)
Norway (Kristiansand)
Dalgard (1989) Dalgard (1989)
Notes on Sample Mean Bid siz e (N) WTP Models, (p.a. Sample, PPPScenario $1997) IB,A,W 300 48.35 IB,U,W
143
46.45
Norway (Drammen)
PC,U,W
156
Norway (Drammen)
PC,N,W
127
Aarskog (1987)
Norway (Oslo)
PC,N,W
Aarskog (1987)
Norway (Oslo)
Bergland et al. (1999)
Norway (VannsjøHobøl) Norway (Orre)
DB,A,W
Bergland et al. (1999)
St.dev. of CV WTPi (p.a. PPP$1997) 80.96# 1.67 118.90#
WTP % WTP % of of PPP-adj. House- GNP/cap. hold income n.a. 0.20
2.56
n.a.
0.19
78.17
127.67 1.63
0.23
0.32
47.94
73.71 1.54
0.14
0.20
43
72.04
92.47 1.28
0.16
0.30
PC,U,W
150
109.13
139.24 1.28
0.25
0.45
DB,A,W
258
223.39
345.64#
1.55
n.a.
0.92
236
323.52
419.52#
1.30
n.a.
1.33
#
Lindsey(1994)
US (Baltimore County)
PC,A,W
824
54.73
1.78
n.a.
0.19
Bockstael et al. (1989)
US (Cheasapeake Bay)
SB,U,W
412
188.85
1156.28#
97.25
6.12
n.a.
0.65
#
Bockstael et al. (1989)
US (Cheasapeake Bay)
SB,N,W
547
59.31
5.14
n.a.
0.20
Wood et al.(1996)
Canada (Nova Scotia)
PC,A,W
267
300.39
304.79
481.68
n.a.
0.88
1.38
LeGoffe (1995)
France (Brest)
PC,A,W
607
37.72
60.48
n.a.
0.17
0.17
#
Georgiou et al. (1996)
UK (Great Yarmouth)
OE,U,W
197
23.04
47.59
2.07
0.10
0.11
Georgiou et al. (1996)
UK (Lowestoft)
OE,U,W
203
26.10
41.56#
1.59
0.11
0.13
Vasquez (1998)
Chile (Dichato)
SB,U,W
370
290.82
440.85#
1.52
0.98
2.38
Niklitschek & Leon (1996) Chile (coastal city)
SB,A,W
1247
241.27
386.88
n.a.
0.22
1.97
Darling et al. (1992)
Barbados
SB,A,WS
433
235.25
377.23
n.a.
n.a.
2.24
Darling et al. (1992)
Barbados
SB,A,W
277
14.54
23.31
n.a.
n.a.
0.14
SB,A,W
1500
19.48
31.23
n.a.
0.44
0.21
IB-OE,U,S
1224
76.67
62.04 0.81
1.89
4.76
McConnel & Ducci (1989) Uruguay (coastal city) Whittington et al. (1993)
Ghana (Kumasi)
#
Hoehn & Krieger (1998)
Egypt (Cairo)
SB,A,S
903
118.70
96.14
0.81
n.a.
3.85
Hoehn & Krieger (1998)
Egypt (Cairo)
SB,A,W
1008
34.78
35.33#
1.02
n.a.
1.13
Choe (1998)
Georgia (Tblisi)
IB-OE,A,W
342
20.40
32.71
n.a.
0.54
1.03
Choe (1998)
Georgia (Kutasi)
IB-OE,A,W
119
31.00
49.71
n.a.
1.12
1.57
Choe et al.(1996)
Philippines(Davao)
IB-OE,U,W
174
74.17
82.19 1.11
0.81
2.02
Choe et al.(1996)
Philippines(Davao)
IB-OE,N,W
389
52.12
70.16 1.35
0.57
1.42
Choe et al.(1996)
Philippines(Davao)
SB,U,W
174
60.14
72.17 1.20
0.66
1.64
Choe et al.(1996)
Philippines(Davao)
SB,N,W
389
2.00
62.14 31.00
0.02
0.05
Choe et al.(1996)
Philippines(Davao)
DB,U,W
174
102.24
60.14 0.59
1.12
2.79
Choe et al.(1996)
Philippines(Davao)
DB,N,,W
389
70.16
32.07 0.46
0.77
1.91
Lauria et al.(1999)
Philippines (Calamba)
IB-OE,A,S
374
72.17
98.23 1.36
0.58
1.97
Lauria et al.(1999)
Philippines (Calamba)
IB-OE,A,WS
354
110.26
106.25 0.96
0.89
3.00
Lauria et al.(1999)
Philippines (Calamba)
SB,A,S
374
90.21
68.16 0.76
0.73
2.46
Lauria et al.(1999)
Philippines (Calamba)
SB,A,WS
354
134.31
1.08
3.66
Altaf and Hughes (1994)
B. Faso (Ouagadougou)
SB,A,S
605
238.50
382.43
n.a.
3.84*
23.85**
Altaf (1994)
Pakistan (Gujaranwala)
IB,A,S
986
54.32
87.10
n.a.
0.78
3.44
World Bank (1992)
Brasil (Sao Paolo)
SB,A,W
550
409.13
656.04
n.a.
6.34
6.44
Barton (1998)
Costa Rica (Jaco)
DB,A,WS
271
353.51
372.07#
1.05
3.04
5.43
70.16 0.52
Abreviations: PPP= purchasing power parity , U=surface water resource users , N=non-users, A= no distinction/all users and non-users, OE=open-ended, SB/DB= single/double bounded dichotomous choice, IB=iterative bidding, P=payment card, IB-OE=iterative bidding with open follow-up; S=WTP for sewerage connection only. W=wastewater treatment only, SW=sewerage connection and waste water treatment. CV=coefficient of variation=St.dev.WTP/Mean WTP . Notes: *as % of household expenditure. **Due to currency overvaluation and problems in finding a reliable consumer price index, 1997 PPP-adjusted values are unreliable.; # calculated from reported standard error of mean WTP as St.dev. individual WTPi =√N*St.error mean WTP. SEE REFERENCES ARTICLE 5 FOR PUBLICATION DETAILS.
28
Study selection criteria In this section we discuss the criteria of validity and accuracy that need to be evaluated before applying secondary benefit estimates to a new site. The demands for validity and accuracy of primary valuation studies is determinant of the reliability of the transfer. Once the idea is accepted that some use of secondary studies is necessary, the policy maker would ideally consider what levels of accuracy or uncertainty are acceptable for the particular decision at hand. Questions raised concerning the validity and accuracy of primary non-market valuation methods are therefore equally relevant for benefit transfer. Validity A prerequisite for benefits transfer is that the primary study was conducted using the best available information and methods. What guidelines does one have in selecting studies that are deemed methodologically valid and reliable? Comprehensive references are available for contingent valuation methods (Cummings et al. 1986; Hanemann and Kanninen 1996; Mitchell and Carson 1989), but probably the single most influential recommendations were made by the NOAA Blue Ribbon Panel (Arrow et al. 1993)13. There are no comparable guidelines for hedonic pricing and travel cost methods.
A reliable CV study would document compliance with most/all of the NOAA
recommendations, justifying why deviations were made. These could include exceptions on certain points that do not concern natural resource damage assessment specifically, and special difficulties in developing country settings (Whittington 1998). The validity of original studies would also have to be questioned before application to a different site could go ahead. Crucial to this evaluation is the definition of site similarity. Characteristics of a site refer broadly to its environmental features, as well as institutional and socio-economic characteristics of the population in question. One approach to a protocol for study characteristics is discussed in the final section.
13
An overview of the recommendations are found in paper 2 of this collection. Although the recommendations have come under criticism (Diamond and Hausman 1994) they still constitute a “benchmark” for most practitioners of contingent valuation. 29
If a whole benefit function is transferred only explanatory variables that are significant can be expected to have an effect on willingness to pay. A primary study with few or no significant variables may only be useful for transfer of unconditional WTP estimates in which case there is no control of site specific characteristics. These primary studies may have low theoretical construct validity as well as low convergent validity.
By construct validity we mean that variables expected by economic theory are significant and have the correct sign, while convergent validity in a primary study refers to finding significant variables of the same sign and magnitude as appear in other peer-reviewed studies in the literature (Mitchell and Carson 1989). In general a primary study that has more significant site specific variables should be preferable, assuming that both the study site and policy are faced with the same “policy package” to be evaluated. In testing whether benefit transfer results in the same parameter estimates as a primary study we are using the strictest form of the convergent validity criterion. Accuracy For now we assume that the non-market valuation approach is deemed valid in the original study site setting by the decision-maker and practitioner. Desvouges et al. (1992) suggest that decisionmakers will then seek to minimise mean squared error of the transferred benefit estimate (w) applied to the policy site given time and resource requirements. Available information in terms of valuation reference studies, is the last constraint and the key to the choice of benefit transfer method chosen. Minimise MSE (w) = Var (w) + (Bias(w))2 subject to
(1)
AF=AF 0 (available funds), AT=AT0 (available time), AI=AI0 (available information).
The limits to acceptable bias and variance will vary according to the application (Brookshire 1992). Despite unavoidable errors, the usual justification for using a rapid appraisal or benefit transfer approach rests on the assumption that decisions based on imperfect information are superior to no decisions at all.
30
Applications vary from gains in the knowledge base, through screening and policy-decisions, to pricing and natural resource damage assessment (Figure 1).
Figure 1. A Continuum of Decision Settings
Low Gains in knowledge
Required Accuracy High Screening Policy priority Pricing setting
(e.g. scoping, justifying existing programs, new case studies)
(e.g. preliminary BCA of projects with NPV>0, “withwithout” analysis )
(e.g. ranking of options using BCA)
(e.g. marginal social cost pricing, natural resources damages assessment)
Note: BCA=benefit-cost analysis; NPV=net present value. Source: adapted from Brookshire (1992) and Deck and Chestnut (1992)
Using non-market valuation for some pricing decisions, such as setting park entrance fees, may require less accuracy if one is “testing” demand elasticity with WTP as a starting point for future adjustments. However, fine tuning incentive levels to marginal cost pricing or using valuation results as a legal basis for compensation claims for natural resource damages requires the highest level of accuracy.
As is the case for natural resource damages assessments and litigation, applications requiring greater accuracy may be those with less time available for conducting studies, although financial resources may not necessarily be more limited here.
Benefit transfer would require convergent validity and
accuracy to a degree which would enable a decision-maker to accept or reject the method when setting “compensable damages”. It should be noted that the literature on benefit function transfer has seldom defined the type of decision being considered or what constitutes acceptable transfer error in evaluating the policy at hand. Future benefit transfer case studies could be more explicit about the maximum reliability that the method can provide for different types of environmental goods. Although estimated benefits may not be accurate in the strict statistical sense (e.g. within 95% confidence bounds), they may be a sufficient basis for decision-making if costs are relatively small.
31
Box 1. Uncertainty in marginal social cost pricing - an example Non-market valuation studies are quite frequently used as input to benefit-cost analysis, but seldom used as a basis for marginal social cost pricing, e.g. setting emissions taxes on air pollution. As we will see from this conceptual example, in determining the accuracy requirements for estimates of marginal benefits of reduced pollution, policy-makers must also consider uncertainty related to the marginal abatament cost curve. Here we use the example from air pollution and the transport sector, where the polluters have the characteristics of being atomistic and mobile. In the context of valuation it is more often the case that uncertainty regarding the marginal benefit estimates is large relative to uncertainty regarding the costs of abatement. Direct costs of abatement can be estimated based on observed market prices. Conceptually we can think of the marginal abatement cost curve (MC) as relatively fixed. Several studies have shown how abatement costs rise in a predictable and stepwise fashion as the cheapest technological emissions reductions options are exhausted (Eskeland 1992). In Figure 2 we compare marginal social cost pricing based on primary and transferred valuation estimates. Using transferred marginal benefit estimates - the value of marginal reduction in health costs of air pollution - increases the confidence interval of the marginal benefit curve from ∆MBprimary to ∆MBtransfer . This is so if we assume that using transferred estimates is less accurate than using primary estimates. The confidence interval for transferred benefit estimates could be calculated using Monte Carlo techniques. Figure 2. The importance of accuracy as policy implementation proceeds Price
E(MB)
MC
∆ T transfer ∆ T primary
T*
∆ΜΒprimary ∆ M B transfer -
Q transfer
Q
primary
Q*
Q Q
+ transfer
+ primary
Emissions abatement (Q)
Within this confidence interval the decision-maker expects marginal benefits E(MB) and sets the emissions tax (T*) accordingly. For simplicity this is depicted as being the same for both primary and transferred estimates. This results in Q* pollution abatement. Based on the confidence interval from the transferred MB estimates, the range in which an efficient incentive should be set once “true MB” is known has increased from ∆Tprimary to ∆Ttransfer. By basing the size of our incentive on a transferred rather than a primary valuation estimate we have increased the possible costs of setting an erroneous incentive level relative to the socially optimal 32
level of abatement. If Q-transfer turns out to be the efficient level of pollution abatement, then Q* has provided a socially inefficient level of abatement. On the other hand if Q+transfer turns out to be optimal, we have allowed an excessive level of emissions and health costs. Why should the shape and magnitude of the marginal abatement cost curve matter for accuracy? Because the MC curve only rises steeply for the last abatement options, the potential deviation or “regret” due to the realised Q from the optimum Q* is lower as we move the MB curve to the right. In setting a tax incorrectly when initial abatement options are available at low marginal costs, the magnitude of potential regrets is largest because of the “flatness” of the MC curve. This would indicate that using transferred estimates to set the first incentive levels has potentially large efficiency costs when uncertainty about benefits is high. In conclusion, this conceptual example would council using primary non-market valuation estimates where possible when setting price incentives in environmental policy. Benefit transfer might be relied upon at later stages if emissions charges are to be revised and high marginal abatement costs make the deviation of erroneous incentive levels from the optimum less serious. For a further discussion price-based incentives under uncertainty see (Baumol and Oates 1988).
Individual benefit transfer approaches Current approaches to benefit transfer, each involving increasing information requirements, can be illustrated as a continuum from transfers of single or weighted point estimates through meta-analysis of multiple valuation studies to benefit function transfer (Figure 3). Figure 3. Continuum of benefit transfer approaches No similar study sites
1-2 similar valuation studies
Low/none Subjective non-replicable
AF t RT t >AT t
Clarify constraints on benefit transfer: Required Information t > AIt ? Required Funds t > AFt ? Required Time t > ATt ?
Non-market valuation “toolkit”: 1. Ad hoc “best” study approaches 2. Meta-analysis 3. Benefit function transfer 4. Primary non-market valuation study on site
RF t< AF t
RT t (w - c) or E < (w - c)
E > (w - c)
Accept projects with probable positive net benefits
Reject projects with probable negative net benefits
Inconclusive: more information required (next valuation method)
Rank projects using a benefit-cost criterion?
Note: total policy costs are expressed as a positive number (c>0). In this Figure wp|s is the individual benefit estimate using any one or a combination of the methods in the non-market valuation “toolkit”.
59
Meta-analysis of all comparable studies produces an estimate that represents a central tendency in the available literature. We would expect such an estimate to lie somewhere between the minimum (w4) and maximum (w1) values. Selecting the most similar study for a benefit functions transfer may give more representative and accurate estimates, but in this hypothetical case benefits are still not larger than costs by the margin specified by the decision-maker. Time and funding permitting a primary valuation study is commissioned and indicates that benefits are “sufficiently” large to approve the project. Under different circumstances the opposite conclusion may just as easily have been reached. Figure 8. Example of a stepwise evaluation of benefit estimates in project screening Benefits (b) of implementation per household
E+ bt E
-
* * * *
w w w w
s|s 1
s|s 2 s|s 3 s|s 4
*
w
p|m
*
w
p|s
*
w
p|p
accept project inconclusive: more info required reject project
t1
t2
t3
AT study time
c t=-b t Opportunity costs (c ) of implementation per household “Ad hoc” approach
Primary study Benefit function Meta -analysis transfer (incl. pilot)
Note: * w=mean benefit estimates per household; AT=available time; E+ -E-=decision-makers confidence interval in non-market benefit estimates expressed as a +/- % of project costs per household (c=-b); wi j = primary or secondary non-market benefit estimate. Subscripts: s=secondary studies; p|m=benefit transfer to policy site using meta-benefit function; p|s=benefit transfer to policy site using benefit function from a secondary study site; p=primary study at policy site (pilot or main survey).
Limitations of a stepwise approach The approach assumes that information on epidemological and other biophysical aspects of the damage function are given, or that these estimates are less uncertain than the economic benefits. In practice scarce research funds may be better spent on primary studies of biophysical functions if Monte Carlo simulation, or sensitivity analysis, show that they dominate the variability of overall damage estimates. The same consideration must be made for research on project cost projections. 60
In an efficient information search, the costs of a primary valuation study should in principle not exceed the reduction in opportunity costs of a wrong decision about the sign of net benefits. It is conceivable that for some local public goods and small populations, study costs outweigh this monetary value of the reduction in uncertainty. This would cast into doubt the relevance of benefitcost analysis as an information aggregation and decision-making tool in that particular context. There may be decision-making processes locally available that are more transaction cost-effective.
The stepwise approach builds on the assumption that benefit function transfer is more accurate than meta-analysis because it contains more site-specific information. A similar caveat is the assumption that benefit transfer using information from a small pilot sample at the policy site is superior to benefit function transfer using (often outdated) census type data. If a meta-analysis is feasible for goods that are “similar” to that of the policy site, it is because there are at least some 20-30 individual studies available from which to estimate a meta-function underlying all the studies. Single benefit function transfer implies choosing the “best study” within this set. In practice variations between studies will mean bias in one direction or another away from the conditional mean of the studies in the metaanalysis. A prediction using meta-benefit function requires often strict assumptions about functional form and error distribution which can lead to downward bias in standard errors and a false sense of accuracy Alternatively, a meta-analysis could be conducted simply to determine a plausible range of mean welfare estimates.
For resources that are similar, where users are from the same population, and policy or project impacts of similar magnitude, meta-analysis will be an increasingly popular option as more primary valuation studies are conducted. For certain unique resources, benefit function transfer may be the only “transfer” option because only a few comparable studies will be available. The meta-analysis step in Figure 3 is “skipped”. In this sense the stepwise approach to benefit transfer is a conceptual model that is most relevant for types of environmental goods were sufficient studies are available to compare all methods. In many cases the option will simply be between conducting a primary valuation study and leaving non-market benefits out of the evaluation all together (i.e. conduct costeffectiveness analysis).
61
Using valuation reference databases in benefit transfer This section discusses some of the characteristics of valuation reference databases that are becoming available. As an example of such a database we look at the EVRI of Environment Canada and USEPA. A searchable valuation reference database called ENVALUE20 was first launched by the New South Wales EPA, Australia. This section refers mainly to EVRI as it is the most recent database with the most flexible and detailed search and screening system. EVRI21 will be “on-line” and commercially available during 1999.
In 1993 Environment Canada decided to develop a protocol for conducting benefit transfer and a standardised database to eventually be made available on the internet. Environment Canada has developed the EVRI in collaboration with a number of international experts and organisations. Especially noteworthy is the collaboration with staff from the United States Environmental Protection Agency, Office of Water. For the time being, entries in the EVRI are concentrated in the area of water valuation studies, while the testing phase is in progress. However, studies in other fields are being added continually both by the developers and users themselves. The internet interface includes facilities to: 1. define the characteristics to match study sites to the policy site 2. search for potential study matches using a Searching Module 3. refine the search using the Searching Module, and 4. evaluate the applicability of the studies using a Screening Module In addition, new studies can be entered by the registered users themselves through a Capture Module. An illustration of the EVRI protocol that is used to evaluate study “similarity” is given in Box 5 below. These are the information categories used to describe every EVRI record. The advantages of EVRI include reducing the time and cost involved in locating suitable studies for benefits transfer. This should be especially beneficial for those countries and organisations that have not previously had the ability to access the wealth of studies available in the literature. The database can improve the quality of benefits transfers significantly by making a wider variety of studies
20 21
http://www.epa.nsw.gov.au/envalue http://evri1.ec.gc.ac/evri 62
available for comparisons. Valuation reference databases, including EVRI, are not tools to perform simple mean unit benefit transfer or even benefit function transfer. They are rather a tool for ascertaining whether similar studiers identified may be appropriate for use by a competent analyst in a transfer. Box 5. A protocol for study characteristics - EVRI valuation reference categories Study reference information: 1. Title 2. Author of study 3. Where and when published Study area and human population characteristics: 4. Country in which study was conducted 5. Location of study site within country 6. Average national income level 7. Availability of substitutes and substitute sites 8. Study population characteristics Environmental focus of study: 9. Type of environmental asset 10. Type of good or service derived from the asset 11. Extent of environmental change due to the project 12. Characteristics of environmental stressor 13. Source of stressor Study methods: 14. Type of study (primary, meta-analysis, benefit transfer) 15. Type of survey information 16. Availability of survey information 17. Year of data 18. Type of economic measure (welfare estimate) 19. Valuation technique employed 20. Information on valuation equations/functions Estimated values: 21. Discount rate used 22. Type of benefit estimate Alternative Language Summary 23. Abstract Below a number of issues are flagged to potential users of these databases, using the EVRI as an example. The points are based on a qualitative in-house survey and a focus group with World Bank staff working in environmental economics and project appraisal. Following comments on the completeness and flexibility of the database itself, we offer some process related comments on limitations due to the person and/or the institution interested in doing rapid valuation. 63
Some limitations of the EVRI database •
Llittle information to evaluate accuracy and validity of benefit estimates. Study summaries by definition lack detail. The summary information in EVRI is not a substitute for the detail of the original study, especially when checking validity and accuracy is required. The database does not prompt detailed information on statistical techniques and regression functions, such as chosen significance levels, variance-covariance matrices, significant variables, or standard errors of welfare estimates.
Data collection proceedures and empirical methodology is also difficult to
evaluate with such summary information as is on a database (admittedly it may also be difficult in published studies themselves).
The main emphasis of the database is on selecting studies with comparable site characteristics and policy impacts, and choosing mean estimates. Databases such as EVRI are useful to the extent that they provide access to details on significant study design characteristics. Because of its ease of access the EVRI encourages practitioners to seek out the original study. However, when severe time constraints make reviewing the original study impossible, practitioners should resist the temptation to transfer the mean benefit estimates that are available “on-line”.
•
Meta-analysis and benefit function transfer. Because of logisitical difficulties in capturing the many econometric models that often make up a valuation study, the EVRI has included an overview of the significant variables and the resulting estimates. This information helps the user decide whether to consult the original study or not. Meta-analysis and benefit function transfer are therefore not made much easier by the EVRI database. One still has to go to the published literature and obtain the original research. However, studies found in the EVRI will be made directly available by the central EVRI library at Environment Canada, which should reduce search time considerably, especially for “grey literature”.
•
Little information on dose-response. Extrapolation of policy impacts between two sites that are similar in every other respect than the baseline and/or the magnitude of the impact, still requires detailed information on dose-response. A dose response relationship is in fact implicit in all valuation of environmental impacts. Studies that clearly specify the dose-response end-point and the valuation starting point (see Figure 5) do not necessarily require specification of a dose64
response function, unless policy impacts are being analysed. Where valuation is used for policy analysis only a small minority of non-market valuation studies publish any information on underlying dose-response functions. EVRI does not encourage improvements in this reporting practice.
On the other hand, this is understandable given that detailed econometric or
epidemiological information may be hard to standardise in such a database, and personnel qualified for quality controlling a wide range of studies may not be available. In summary, the EVRI is an economic valuation, rather than a epidemiological database. •
Quality control filters. Users require an indication of the quality of information that is on the database.
Quality control in EVRI has initially been conducted by trained environmental
economists at Environment Canada. In future any study that has valuation results will eligible for entry into the EVRI. This will be promoted by the “capturing module” which allows users also to enter grey literature that they are aware of. The EVRI ensures that the information available is correct and as complete as possible, but it is left entirely to the user to conduct quality control in applying the estimates. An obvious filter for any analyst would be to check the author and publication. For environmental economists already familiar with the literature the database is therefore a useful information tool. For non-specialists, author and journal publication are not discerning characteristics and there is a danger that every record may be treated as equally reliable.
65
Process-related issues in using databases for benefit transfer A database that puts the user at the limits of available information has great potential. However, users may or may not be experienced in benefit transfer or environmental economics. There is ample reason for emphasising, once again, the responsibility of users of valuation reference database to consult original studies and/or professional advice before entering into the often complex process of benefit transfer.
•
personal judgement and lacking guidelines and protocols. Increased access to information increases rather than diminishes the need for judgement.
This is especially true when few
guidelines for assessing validity and reliability of benefits transfers exist beyond those aimed at conducting primary studies (e.g. NOAA Blue Ribbon Panel , Arrow et al. 1993).
•
danger of making ex post justification “easier”. Without quality controling the studies that are selected for transfer, access to a greater range of benefit estimates increases the possibility of selecting extreme values which in turn increases the probability of either erroneously accepting or rejecting a project. Requirements to use meta-analysis of benefit function transfer, instead of transferring unit or point estimates would also go some way to remedying this problem.
•
non-market valuation used too late in project design to make benefit transfer relevant. Currently, the dominant practice is to conduct valuation studies once the technical specifications of a project have been established. Using benefit transfer in its most cost-effective manner, scoping and screening a large range of project options would be done at an earlier stage. Without further guidelines, the temptation may be to use point estimates found in “on-line” databases to calculate exact economic rates of return or set user tariff levels, tasks for which most authors feel the methods lack reliability.
•
promote the use of existing estimates while slowing the generation of new ones. In lineagencies, task or project managers faced with strong time and funding constraints and relatively expensive and time consuming primary studies, will face the temptation to conduct cheap but very inaccurate ad hoc benefit transfer. Good accessibility to existing estimates has a possible
66
trade-off in that there is less incentive in operational departments to conduct or commission new studies in which the reliability of benefit transfer is tested empirically.
•
promote new fields of research and technology transfer. In research departments, a search module such as that found in the EVRI may have the opposite effect as above. A fully populated reference inventory may in fact help guide research into new and previously unexplored areas when no “matches” have been found. When the decision has been made to conduct a full valuation study, a search may also quickly reveal the “state-of-the-art” e.g. in highly significant, recent valuation models published in well-renowned journals. Under the condition that rapid access to library services is available, a database such as EVRI will be a valuable tool to researchers in developing countries interested in the most recent valuation techniques for “technology transfer”.
Conclusions This paper has provided a non-technical overview of the different conceptual approaches to benefit transfer, set in a policy context. A review of the methodological literature reveals that an array of techniques is available to take advantage of every level of information on the benefits of environmental policies. A ‘stepwise’ or Bayesian approach to structuring prior assumptions about welfare estimates, and then updating them with new information, makes non-market valuation more transparent for policy purposes. If non-market methods are to have increasing trust of policymakers these approaches will need to be formalised in ‘valuation protocols’, similar in ambition to the NOAA Panel guidelines on contingent valuation (Arrow et al. 1993). This paper has suggested an outline for such guidelines which need to be filled with the specific requirements of the different agencies charged with extended benefit-cost analysis of environmental policies.
While much of the empirical literature on benefit transfer has focused on testing convergent validity, there are very few examples of studies evaluating the importance of benefit transfer in the policy process (Desvousges et al. 1998). Given current scepticism among policy-makers to non-market valuation methods such as contingent valuation, it might be some time until they ‘trust’ the use of secondary estimates based on these methods. However, much of the scepticism may be due to the 67
fact that contingent valuation, with its increasingly sophisticated econometric models, has remained firmly in the academic sphere. The challenge for practitioners lies in reconciling this sometimes opaque sphere with the crystal ball desired by the policy maker. Further empirical applications are therefore called for which compare the accuracy and reliability of benefits transfer methods across different contexts, relative to the cost of information, and relative to environmental policy-makers requirements for accuracy from other disciplines such as cost engineering and dose-response modelling.
68
Appendix 1 - Empirical testing of benefit function transfer and study similarity This section looks in some more detail at how study similarity is defined and econometric approaches to testing the reliability of benefit function transfer from study to policy site. It offers several conceptual explanations for why these tests may fail to show statistical reliability. Various authors have proposed and employed tests for similarity between study and policy sites (Bergland et al. 1999; Brookshire and Neill 1992; Brouwer and Spaninks 1997; Downing and Ozuna 1993; Kirchhoff et al. 1997; Koppelman and Wilmot 1986; Loomis 1992; VandenBerg 1995). With only a handful of studies having tested reliability, these explanations are highly preliminary. Here we organise their various conclusions within a series of broad hypotheses proposed by Brookshire (1992).
H1. Benefits transfers are robust to differences in site characteristics X.
If it is clear from regression coefficients that site characteristics have high elasticities and/or non-linear effects the practitioner cannot easily assume that expected WTP will be the same at both sites. If elasticities are low, effects direct/linear or variables not significant one could have more confidence in the unconditional mean WTP being equal at the both sites (ceteris paribus).
ws|s=wp|p
(H1)
Here we test whether unconditional means are equal at study site and policy site22. This test is rather primitive, and can only really be justified when no site-specific explanatory variables are found to be significant at the study site. Nevertheless, it gives an initial indication of how erroneous the practice of “cheap and dirty” transferring of unconditional mean WTP estimates can be. This happens to be the type of transfer that is most often practised in “desk-top” studies and project proposals when little site specific information is available.
Brookshire (1992) also suggests experiments where different institutions are tested to find the robustness of other non-institutional site characteristics. This assumes that environmental goods have 22
This can be t-tested using bootstrapped asymptotic standard errors for mean WTP. 69
an underlying value function that is not site-specific. Given the cost of such experiments and the universe of explanatory variables, the best place to start would be with variables dictated by economic theory (prices of substitutes and compliments, and income). H2. The values generated with the coefficients from the study site applied to the policy site characteristics are identical to the values that would be obtained with a primary study at the policy site. This hypothesis was suggested above in formula (3) where the predictive power of the transferred benefit function is tested against the primary estimate of WTP at the policy site. The “average effects” model is given by the function f() and its parameters.
ws|s=ws|p= f
s
( β$ , X ) (H ) s
p
2
This test only examines the predictive accuracy of the method, not the validity of transferring the benefit function itself23. H3. Estimated benefit functions at the policy site and study site are equal and/or drawn from the same population. This general hypothesis gives rise to two specific tests of benefit function transferability (Bergland et al. 1999). The estimated parameters at the study site are tested for equality with estimated parameters at the policy site24:
βˆ
p
= βˆ s
(H3.1)
The test assumes that the parameters at the policy site are “true” and tests whether those of the study site are significantly different. This test can also be reversed by assuming that the study site parameters are ”true”.
23
Given that WTP is often estimated using a model incidentally truncated at zero (e.g. tobit) a variant of this and the previous test uses the actual non-truncated conditional and unconditional means, respectively (Kirchhoff et al. 1997). 24 Using a Chow-test (Loomis, 1992) or a Score test (Bergland et al. 1999). 70
However, rejection of H3.1 does not tell us whether the failure of benefit transfer was due to specification error (subjective error) or true differences in the study and policy sites (objective error). This is discussed further under hypothesis H5.
Another weaker test examines whether parameters at the study site (s) and policy site (p) are drawn from the same population25. Here we need make no assumption that one particular study represents the true parameters.
β = β$
p
= β$
s
(H3.2)
Both of these benefit function transfer tests have been criticised (Downing and Ozuna 1993). Due to non-linearities in the willingness-to-pay functions we may observe significant differences in parameter estimates between sites (H3), but no significant difference between mean benefit estimates (H1 and H2). In a study of WTP for preserving peat meadows in the Netherlands (Brouwer and Spaninks 1997) this seeming contradiction was observed. Although there is no a priori reason to expect it, statistically similar benefit transfer functions could also result in significantly different mean willingnessto-pay estimates (Kirchhoff et al. 1997)26. The authors conclude that several tests should be employed simultaneously for cross-checking purposes. H4. The values from the study site are robust over time. Preferences at the site have not changed if underlying site characteristics have not done so. The uncertainty involved in benefit transfer not only refers to differences across sites, but also across time for the same site. This hypothesis questions the “temporal” validity of the available studies and their “shelf-life”. Any benefit transfer which is not a simultaneous test must confront the issue of whether there are site-specific variables that are time-dependent. Time stability would seem particularly relevant for benefit transfer in areas with high inflation and populations with high discount rates, such as in some developing countries. Brookshire (1992) suggest repeat studies on the same site and/or using a fixed pool of respondents.
25
Using a Likelihood Ratio test treating each site as a nested model of the pooled sample (Bergland et al. 1999) 26 An exceptional case is when there are strong collinearities in population characteristics, i.e. two structurally different populations resulting in the same regression coefficients. 71
H5. No interaction effects occur between X’s, either at the study site or policy site. Differences in some of the variables between sites do not imply that coefficients for remaining variables may not be used. Hypotheses H3.1-3.2 tested the overall transferability of benefit functions between study and policy sites. If these tests reject transferability, however, significant differences may be due to one or only a few of the significant variables in the “best statistical model”. Hypothesis H5 would suggest that if there are no significant collinearities between the X’s at the study site we may test various partial specifications of the “best statistical model”, checking for the one that gives the most accurate transfer. It could be argued that this exposes us to specification error (Koppelman and Wilmot 1986), but because we have no priors on the variables that make up the “true benefit function” it is not obvious that partial or reduced models are inferior to full models concerning prediction.
An initial step could be to examine distributions for the significant variables to see whether populations were similar for these variables. Variables where distributions were significantly different would be prime candidates for elimination if hypotheses H3.1-3.2 showed significantly different parameter estimates. With the reduced model the transfer tests could be repeated. The danger of this approach is that by increasing degrees of freedom we also increase the variance of the transferred estimate.
A more detailed study of specification error in benefit transfer could be conducted within a framework proposed by Koppelman and Wilmot (1986)27. The authors proposed comparing three different models for evaluating specification error of benefit function transfer. A “full model” includes all variables specified by theory as well as variables found to consistently significant in other studies. A “reduced model” is any subset of these variables, for example only those variables predicted by consumer theory or else what we have called the “best statistical model”. A “mixed model” would use all the variables to estimate parameters at the study site (s), but then use a subset of these for prediction at the policy site (p).
27
With certain caveats regarding their comparison of non-nested models using the log likelihood test. 72
The random utility specification of the indirect utility function for consumption of a public good is defined as above:
ws=XsIβ sI+XsXβ sX+es (4.1)
where superscript I=included variable and X=excluded variable, and subscript i=site of study location.
w$
I $ I p/ s = X p β s
+X
X p
β$ s X
(4.2) is then the “full model” used for prediction at the policy site.
An auxiliary regression illustrates the relationship between the included and excluded variables, either at the study or policy site:
XiX=XiIγi+ei
(5)
Substituting (5) into (4.1) at the study site,
ws=XsIβ*+ε∗ (6)
where β*=β sΙ + γsβ sX (7)
and
ε∗=esβ sX +ε s
(8)
the utility is described as a function of included variables:
w$
p /s
=X
I p
β$ s * = X
I s
(β
s
I
+γ
s
β
s
X
)
(9) is the “reduced model” used for prediction.
The “mixed model”, by using parameter estimates from the full model at the study site on a reduced set of variables from the policy site, replaces the excluded variables in full model with an auxiliary regression relationship at the policy site:
w$ p /s = X Ip β$ s I +(X Ip γ p + e p ) β$s X = X Ip ( β$ s I +γ p β$ s X ) + e p β$ s X (11)
73
With this model hypothesis H5 can be expressed as γp =0, conditional on γs =0. If γs ≠ 0, included parameter estimates from the study site will be biased and inconsistent. If γs=0, but γp ≠ 0, exclusion of relevant variables at the policy site will still lead to biased value estimate at the policy site.
We can revisit hypothesis H3.1 in the light of this error specification model. Looking at equation (7), rejection of this hypothesis can be ascribed to the total error (TE) introduced by differences in the parameters vectors between the study site (s) and the policy site (p) as follows:
TE(β)= β$ s* − β$ *p = β$ sI − β$ pI + γ s β sX − γ p β pX
(12)
From equations (11-12) we see that hypothesis H3.1 may be rejected for a number of reasons due either to true unexplained differences in the sites or as a result of specification error by the practitioner. Below are what are expected to be three of the most common reasons for failure to pass the strictest of the benefit transfer tests:
(ι) the included parameters at the study site and policy site are significantly different, β$ pI ≠ β$ sI (a “true” site difference in preferences);
(ii) the excluded variables are not significant at the study site and are not correlated with included variables( β sX =0, γs=0) leading to specification of a “best statistical model”. However, the excluded variables are significant at the policy site, β pX ≠ 0, resulting in a transfer bias if γp ≠ 0.
(iii) the bias incurred from excluding variables from the study site and policy site models is positive and, crucially, is significantly different at both sites; (γs ≠ 0) ≠ (γp ≠ 0). Only if the correlations between included and excluded variables at the study site and policy site are identical will this double misspecification not result in further bias in the transfer.
Referring back to Kirchoff et al. (1997), explanation (i) shows that expected willingness to pay and benefit functions can clearly expected to be different, with rejection of H1, H2 and H3. However, under explanations (ii) and (iii) if we find no significant difference in mean or predicted WTP when 74
testing H1 and H2, it may still be possible to reject benefit function identity under H3. Whether we use “the best statistical model” or the “full model” for benefit transfer this will be true. By checking correlation coefficients between excluded and included variables before running “the best statistical model” we can get a rough fix on whether γs ≠ 0 and whether we are committing an “avoidable” specification bias. Because we do not a priori know the “true” benefit function at the policy site there will always exist an element of unexplained and therefore unavoidable specification error (unless of course we are experimenting by fully replicating the study at the policy site).
75
References ADB. (1996.). Economic evaluation of environmental impacts : a workbook., Environmental Division, Office of Environment and Social Development, Asian Development Bank, Manilla. Alberini, A., Eskeland, G. S., Krupnick, A., and McGranahan, G. (1996). “Determinants of diarrheal disease in Jakarta.” Policy Research Working Paper 1568, Policy Research Department, Public Economics Division, World Bank, Washington. Alberini, A., and Krupnick, A. (1997). “Air pollution and acute respiratory illness: evidence from Taiwan and Los Angeles.” American Journal of Agricultural Economics, 79(5), 1620-1624. Arrow, K. J., Solow, R., Leamer, E., Portney, P., Radner, R., and Schuman, H. (1993). “Report of the NOAA Panel on Contingent Valuation.” Federal Regis ter 58, 4601-4614 . Baumol, W., and Oates, W. (1988). The theory of environmental policy, Cambridge University Press, Cambridge. Bergland, O., Magnussen, K., and Navrud, S. (1999). “Benefit transfer: testing for accuracy and reliability.” Comparative environmental economic assessment: meta analysis and benefit transfer, R. J. G. M. Florax, P. Nijkamp, and K. Willis, eds., Kluwer Academic Publishers, Dordrecht. Boyle, K. J., Poe, G. L., and Bergstrom, J. C. (1994). “What do we know about groundwater values? Preliminary implications from a meta analysis of contingent-valuation studies.” American Journal of Agricultural Economics, 76(December), 1055-1061. Brookshire, D. S. “Issues regarding benefit transfer.” Proceedings of the Association of Environmental and Resource Economists 1992 Workshop. Brookshire, D. S., and Neill, H. R. (1992). “Benefit transfer: conceptual and empirical issues.” Water Resources Research, 28(3), 651-655. Brouwer, R., Langford, I. H., Bateman, I. J., Crowards, T. C., and Turner, R. K. (1997). “A Meta-analysis of wetland contingent valution studies.” Working Paper GEC 97-20, CSERGE, London. Brouwer, R., and Spaninks, F. (1997). “The Validity of transferring environmental benefits: further empirical testing.” Working Paper GEC 97-07, CSERGE, London. Cummings, R. G., Brookshire, D. S., and Schulze, W. D. (1986). Valuing environmental goods: an assessment of the contingent valuation method, Rowan and Allanheld, Totowa. Desvousges, W. H., Johnson, F. R., and Banzhaf, H. S. (1998). Environmental policy analysis with limited information. Principles and applications of the transfer method., Edward Elgar, Cheltenham, UK. Desvousges, W. H., Naughton, M. C., and Parsons, G. R. (1992). “Benefit transfer: conceptual problems in estimating water quality benefits using exiting studies.” Water Resources Research, 28(3), 675-684. Diamond, P. A., and Hausman, J. A. (1994). “Contingent valuation: is some number better than no number?” Journal of Economic Perspectives, 8(4), 45-64. Dixon, J. A., Carpenter, R. A., Fallon, L. A., and Sherman, P. B. (1995). Economic valuation of environmental impacts, Earthscan, London. Downing, M., and Ozuna, T. J. (1996). “Testing the reliability of the benefit function transfer approach.” Journal of Environmental Economics and Management, 30(3), 316-22.
76
Ekbom, A. (1993). “75 case studies on environmental economic evaluation in developing countries.” Working Paper, Environmental Economics Unit, University of Gothenburg. Eskeland, G. (1992). “Demand management in environmental protection: fuel taxes and air pollution in Mexico City.” , Country Economics Departmentent, World Bank, Washington D.C. Florig, K. H. (1993). “The Benefits of air pollution reduction in China.” Paper presented at the 5th International Summer Symposium on Science and World Affaris, 22-30 July,1993, Massachusetts Institute of Technology, Cambridge, MA , Resources for the Future, Washington. Gaarder, M. (1998). “Do health effects from air pollution affect the distribution of income and welfare?. Seminar 30 July. Environmental Economics and Indicators Unit, Environment Department, World Bank.” . Hanemann, W. M., and Kanninen, B. (1996). “The Statistical analysis of discrete response CV data.” Working Paper 798, Department of Agricultural and Resource Economics, Division of Agriculture and Natural Resources, University of California at Berkley, Berkley. Johnson, F. R., Fries, E., and Banzhaf, S. (1996). “Valuing morbidity: an integration of the willingness-to-pay and health-status index literatures.” Journal of Health Economics, 16(6), 643-665. Kirchhoff, S. “Benefit function transfer vs. meta-analysis as policy-making tools: a comparison.” Workshop on Meta-analysis ad benefit transfer: state of the art and prospects, Tinbergen Institute, Amsterdam. Kirchhoff, S., Colby, B. G., and LaFrance, J. T. (1997). “Evaluating the performance of benefit transfer: an empirical inquiry.” Water Resources Research(33), 75-93. Koppelman, F. S., and Wilmot, C. G. (1986). “The Effect of omission of variables on choice model transferability.” Transport Research, 20B(3), 205-213. Krupnick, A., Harrison, K., Nickell, E., and Toman, M. (1996). “The Value of health benefits from ambient air quality improvements in Central and Eastern Europe: an exercise in benefits transfer.” Environmental & Resource Economics(7), 307-332. Loomis, J. B. (1992). “The Evolution of a more rigorous approach to benefit transfer: benefit function transfer.” Water Resources Research, 28(3), 701-705. Loomis, J. B., and White, D. S. (1996). “Economic benefits of rare and endangered species: summary and metaanalysis.” Ecological Economics(18), 197-206. Machado, F., and Mourato, S. “Improving the assessment of water related health impacts: evidence from coastal waters in Portugal.” First World Congress on Environmental and Resource Economics. Venice, 25th27th June. Mitchell, R. C., and Carson, R. T. (1989). Using surveys to value public goods. the contingent valuation method, Resources for the Future, Washington D.C., USA. Navrud, S. (1994). “Economic valuation of external costs of fuel cycles. Testing the benefit transfer approach.” Integrated electricity resource planning, A. T. de Almeida, ed., Kluwer Academic Publishers, Netherlands, 49-66. Ostro, B., Sanchez, J. M., Aranda, C., and Eskeland, G. S. (1996). “Air pollution and mortality: results from a study of Santiago, Chile.” Journal of Exposure Analysis and Environmental Epidemiology, 6(1), 97-114. Small, K. A., and Kazimi, C. (1995). “On the costs of air pollution from motor vehicles.” Journal of Transport Economics and Policy, XXIX(1), 7-32.
77
Smith, K. V., and Huang, J. C. (1993). “Hedonic models and air pollution: twenty-five years and counting.” Environmental and Resource Economics(3), 381-394. Smith, V. K., and Kaoru, Y. (1990). “What have we learned since Hotelling's letter? A meta-analysis.” Economics Letters(32), 267-272. van de Walle, D., and Gunewardena, D. (1998). “How dirty are "quick and dirty" methods of project appraisal?” Policy Research Working Paper 1908 , Development Research Group, World Bank. Vose, D. (1996). Quantitative risk analysis. A Guide to Monte Carlo simulation modelling, John Wiley & Sons, Chichester. Walsh, R. G., Johnson, D. M., and McKean, J. R. (1992). “Benefit transfer of outdoor recreation demand studies 1968-1988.” Water Resources Research, 28(3), 707-713. Whittington, D. (1998). “Administering contingent valuation surveys in developing countries.” World Development, 26(1), 21-30.
78
Reliability and validity issues in the contingent valuation of coastal recreational water quality in a developing country28
Abstract The article discusses the challenges of using the contingent valuation method (CVM) to evaluate the benefits to beach visitors from reduced sewage pollution of surface and groundwater in a town on the Pacific coast of Costa Rica. Results from the beach visitors’ survey did not strengthen the case for using the contingent valuation method on this particular problem of water pollution in a recreational area. The case study shows various problems with meeting the NOAA “burden of proof” requirement for scope sensitivity. The study faced other challenges that are of particular relevance to conducting contingent valuation in developing countries. Common pitfalls include the effect of substitutes, embedding and ni centive incompatibility of the payment vehicle. Problems that require particular attention include little a priori information on current water quality in the population and open access rights to coastal areas. The study is an illustration of how detailed documentation of validity and reliability criteria can help decision-makers uncover the relevant strengths and weakness of contingent valuation studies.
28
Acknowledgement: I would like to thank three anonymous referees for a number of helpful comments and constructive critiques. In Costa Rica, Darner Mora and his collegues at Acueductos y Alcantarillados (AyA), as well as Miriam Miranda (UNA) deserve special recognition for providing access to environmental data and field assistance. I would like to thank Ståle Navrud, Olvar Bergland , Knut Veisten, Richard Ready, Arild Vatn and Per Halvor Vale for helpful comments. Any errors or omissions are my own. This research was funded by the Norwegian Research Council (NFR). This paper has also appeared as Barton(1998), “Applying NOAA Panel Recommendations to Contingent Valuation Studies in Developing Countries - A Case Study of Coastal Water Quality in Costa Rica” Discussion Paper #D-24/1998, Department of Economics and Social Science, Agricultural University of Norway 79
Introduction Of the large number of contingent valuation studies that had been conducted by the end of the 1980’s under 2% of those published were in developing countries (Ekbom 1993). During the last decade this figure has been rising rapidly with CV now in frequent use for evaluation of water and sanitation projects (Whittington 1998). Still, only a handful of these studies have been concerned with valuation of the benefits of reduced water pollution in coastal waters (Choe et al. 1996; Darling et al. 1993; Lauria et al. 1999; McConnell and Ducci 1989; Niklitschek and León 1996; Vasquez 1997). More surprising is the fact that relatively few studies have been conducted for marine and coastal recreation in industrialised countries such as the US or Europe (Freeman 1995). In countries with limitations on research budgets the relevance of expensive contingent valuation in policy decision-making may be the first question asked. Choe et al. (1996) found willingness to pay for improvements in surface water quality of 0.5-0.9% of stated income, while for neighbourhood sanitation benefits from sewerage in Africa figures of 1-2% are not uncommon (Whittington et al. 1992). In the Philippines Choe et al. found that these values were far from covering the costs of providing sewerage and water treatment. However, WTP for reduced sewage pollution of surface water quality in the available UK and French studies is in the 0.1%-0.3% range (Georgiou et al. 1998), supporting the intuition that once basic sewerage problems have been solved and income increases, relative household expenditure on improving quality of nearby surface water bodies decreases.
While not a validity or reliability problem for CV, low willingness to pay for
environmental amenities in low-income areas is a conventional wisdom suggesting that expensive full blown CV studies may not be necessary until environmental quality becomes a community priority.
Given that a CV study is relevant and affordable, questions of validity and reliability should be even more at issue in developing than developed countries. A recent survey of non-market valuation studies conducted in Central America, concluded that few if any had conducted methodological tests to document the validity and reliability of the contingent valuation method in these new contexts(Shultz 1997).
Despite criticism and its focus on natural resource damage assessment, a
standard reference for conducting valid and reliable contingent valuation studies is the NOAA Panel recommendations (Arrow et al. 1993).
Examples of developing country CV studies that follow
most of these recommendations are starting to appear. For example, in the Phillipines tests were 80
conducted for the sensitivity of benefit estimates to the scope of improvements in surface water conditions, as well as to different estimation approaches and distributional assumptions (Choe et al. 1996; Lauria et al. 1999).
Some challenges to CV may have special relevance in developing countries. Mitchell and Carson (1989) argue that respondents value “policy packages” including institutional aspects in addition to the proposed environmental changes. Depending on reliability of the institution respondents may weigh WTP by the “probability of provision” they perceive for the public good. Others may way their responses by the opportunity they see for giving strategic yes-responses with the aim of “free riding” on other respondents payment once the policy is put in place. Other authors have explained free riding in terms of the transaction costs of regulating common pool resources with open access characteristics (Ostrom 1990).
Whether supply of public goods is uncertain, inefficient, or
compliance and payment difficult to enforce, greater caution is called for in specifying the institutional context of the proposed policy.
Conveying information on the relevant attributes of water quality may be particularly difficult when dealing with respondents with little a priori information or formal education29 . Even in US studies of benefits from coastal marine recreation Freeman(1995) found that a common methodological weakness was the lack of qualitative attributes in explaining demand for visitation, as well as missing linkages between the discharges affected by policies and the attributes of the coastal environment that mattered to people. More detailed descriptions of the benefits of water quality improvements have recently been employed in studies of freshwater, such as variants of the “water quality ladder”(Carson and Mitchell 1993), including detailed verbal and photographic descriptions (Bergland et al. 1999). In beach water quality studies from Europe, risk perception and culturally determined attitudes to health risk have also been shown to affect willingness to pay, albeit in ways which are not yet well understood (Georgiou et al. 1998).
The first section justify the use of a CV study at the study site. A valuation model, as well as the validity, reliability and accuracy criteria for evaluating regression results is then presented. Research 29
Admittedly, in traditional societies, informal education may go hand in hand with intimate knowledge of the local environmental and clear preferences for the conditions that provide subsistence and quality of life.
81
methodology is further discussed, including sample selection, and survey design issues. Survey results follow including response rates, a discussion of observed scenario information effects, regression results, and an evaluation of the accuracy and robustness of WTP to various modelling assumptions. Finally, we discuss the various methodological challenges to results of this survey of beach visitors. Coastal sewage pollution in Costa Rica Tourism is the principle foreign currency earner in Costa Rica, the two main attractions for visitors being beach recreation and nature tourism in the country’s many national parks (ICT 1996). Costa Rica has a more than 20 year history of regulating land-use in protected areas and the coastal (Sorensen 1990), but water pollution problems have only recently become a policy concern. For the past two years the Ecological Blue Flag Program, a co-operation between various ministries and the private sector30, has been conducting regular monitoring of faecal coliform levels in rivers, estuaries, near-shore sea water and drinking water for some 60 beaches around the country. Modelled on a similar European Union initiative, the Blue Flag Programme certifies beaches according to their sanitation and environmental quality, publicising the rating and providing information locally at beaches (e.g. signposting). With rapid urban growth following tourism development it is now recognised that despite the country’s large number of beaches, poor waste water disposal may lead to unacceptable sanitary conditions at some of the most popular and accessible ones (Mora 1997). The Blue Flag Programme was interested in the reliability of contingent valuation as an input to feasibility studies of local waste water treatment measures. Study site description The town of Jaco on the Pacific coast of Costa Rica was selected for repeatedly failing Blue Flag recommendations for fresh and seawater quality while remaining an important tourist destination. The town, with a population of about 3000 inhabitants has experienced a sevenfold increase in population and largely unplanned urban growth since the last census in 1984. Visitation by both Costa Rican residents and foreign tourists is one of the highest in the country, roughly estimated at
However, with rapid urbanisation and/or industrialisation any society may rapidly loose traditional knowledge at the same time as new and unknown types of environmental degradation make themselves felt. 30 Public water utility (AyA), Ministries of Tourism, Health and the Environment and the Costa Rican Board of Tourism 82
some 30 000 a month during high season from December-March31. Faecal coliform levels in river water and sea water indicate a large presence of untreated sewage. Evaluation of sewage loading from households and businesses to nearby water bodies is difficult due to total lack of municipal inspection of on-site disposal systems. Of inhabited households some 87% had a septic tank, while the remaining 13% used either latrines or pits32. Only two hotels have functional small scale treatment plants, while the rest rely on septic tanks or direct discharge.
Monitoring data show faecal coliform counts far exceeding recommended guidelines for human contact in rivers and estuaries all year round, while in sea water, sewage pollution is below recommended levels most of the year at most stations33 (Table 1).
Coliform levels in sea water
could be expected to rise above recommended levels if visitation and town population continue to rise without installation of adequate sewage disposal. With no other towns in the micro-watershed, prevailing sea currents and dilution effects, the externality problem is local.
Table 1 Recommended levels of fecal coliform levels in water bodies Faecal coliforms / 100 ml. (geometric average) Recommendation by location and/or type of use Sea water Freshwater 0 (undetectable) Potable water A) if the first response to A is ”yes”, or a lower bid (Al 0
(3)
The log-likelihood functions for the double bounded dichotomous model can then be defined as follows:
[
]
[
]
I ln F (0) + I ln F(A ) − F (0) + I ln F (A) − F (A ) nn l ny l lnL = ∑ 0
[
+ I ln F(A ) − F(A) + I ln 1 − F (A ) yn h yy h
[
]
]
(4)
Here I is an indicator function taking the value of one when responses are in relevant category (y=”yes”, n=”no”, 0=true zero) and zero otherwise. Estimation of the log-likelihood function is analogous to approaches found in the bio-essay literature on “survival analysis” (Greene 1993). Expected WTP can be expressed as : E[ w] =
∞
∫
∞
0
x⋅ f ( x) dx =
−∞
∫
∞
∫
x⋅0 dx + 0⋅ F(0) + x⋅f(x) dx =
-∞
0
∫ x⋅f(x) dx
(5)
0
For the truncated normal distribution expected WTP may be calculated as38: E [w ]= µ + σ
φ ( − µ /σ ) 1− Φ ( − µ / σ )
(6)
Confidence intervals for estimated willingness to pay in (6) were calculated using the “bootstrapping” method (Bergland et al. 1990; Efron and Tibshirani 1986) .
37
In the present model WTP is not bounded by disposable income which may bias expected willingness to pay upward. 38 where µ=location parametre, σ=scale parametre, φ = standard normal p.d.f., Φ = standard normal c.d.f. The expectation of WTP for the log-normal distribution is E [ w ]= e µ + 1 / 2 σ The lognormal distribution does not include zero responses, biasing E(w) upward relative to the truncated normal. Models were estimated using the LIFEREG procedure in SASTM. 2
87
Validity, reliability and accuracy The selection of potential explanatory variables was based on consumer demand theory, significant variables found in similar studies in the literature, NOAA recommendations for cross-tabulation, and follow-up questions regarding scenario information effects.
For every variable suggested by
consumer theory, or its relevant proxy, found to be significant and of the expected sign, we will say that the willingness-to-pay estimate has increasing economic construct validity.
For the validity of
the scope effect we test H0: w all water > w sea water versus H1: w sea water ≥ w all water Since q sea water ∈ q all water
, rejecting H0 implies that the survey is less valid by the NOAA ‘burden of proof’ standards.
Increased (weak) convergent validity is claimed for significant and correct predictions of the sign for variables from other valuation studies (Mitchell and Carson 1989). necessarily have an established economic theoretical justification.
These variables do not
The “full model” regression
includes all explanatory variables considered, while a “best statistical model” was specified using a stepwise elimination approach and a significance level of 10%. Setting statistical reliability at this level for model specification is common in contingent valuation studies (Bergland et al. 1999; Mitchell and Carson 1989).
The accuracy of mean WTP was evaluated using bootstrapped confidence
intervals at the 95% level. Reliability can also be given a non-probabilistic interpretation as the robustness of mean WTP to different model specifications, a definition which is useful when checking the sensitivity of policy benefits versus costs. Research methodology Qualitative and quantitative information was obtained in 4 main stages: (1) three focus groups were held on-site with hotel and business owners, foreign and Costa Rican visitors, while a fourth meeting was held with Costa Rican visitors residing in the metropolitan area some 3 hours drive away. Focus groups explored understanding of water quality terminology, of visual aids including different map descriptions and “water quality ladders”, as well as alternate arrangements of payment vehicles and implementing institutions; (2) a pre-test was conducted on 10 people in the local health centre to check survey length, respondent understanding and remove ambiguities in question wording; (3) a pilot survey of 20 visitors was conducted three weeks before the main survey. These were used to obtain prior distributions of willingness-to-pay from which bid amounts for the main survey were
88
then selected (see Table 3); (4) finally, the main survey of was conducted over the course of two ten day periods at the start of tourist high season in December of 199739. Sample selection Beach visitors resident in Costa Rica were surveyed through systematic random sampling on the beach, selecting every second stationary person, with groups counted as one interception. Visitors were asked whether they swam or practiced any water sports during their stay, to control for users and non-users. Foreign tourists were not sampled for two reasons. They were less likely to be return visitors, and would not have personal use values affected by future water quality at this particular site. Focus groups also revealed high protest rates among foreigners to all of the payment mechanisms proposed. For purposes of the scope test, we also wanted to interview resident visitors who were likely to have better information regarding local water quality. Due to this selection effect aggregate welfare measures from the study will be conservative40. However, methodological conclusions regarding reliability and validity of this CV study can still be drawn from the existing samples. Survey design Two different survey instruments were applied, with visitors randomly assigned to each version. Introductory questions concerned respondent opinion about principle problems facing the site, as well as the frequency and type of activities practiced at the beach and substitute sites. Respondents were asked the frequency with which they would repeat their visit during the coming five years given their current knowledge of the site . Then respondents were asked to state their knowledge of family illness related to contaminated water and their subjective opinion of the current level of local water quality in the sea, rivers and groundwater. Respondents classified water quality using show-cards with colour-coded symbols and verbal representation of the water quality levels portrayed in Table 2.
39
A household and visitors survey were conducted simultaneously. Here we only report contingent valuation results from the visitor’s survey, although certain descriptive household statistics are included for comparison. The necessity of different payment vehicles and bid distributions made results incomparable, and WTP results from the household sample are presented elsewhere in a paper on benefits transfer within Costa Rica (Barton 1999).
89
Table 2. Multiple water resource description of coastal water quality Classification levels used in showcards: Class A / 1 / I
Sea water (A-C) A. Fit for swimming all year B. Fit for swimming dry season; not fit rest of year
River and estuarine water (1-3) 1.Fit for human contact all year 2.Fit for human contact dry season; not fit rest of year
Well- and groundwater (I-III) I. Potable well-water; no faecal pollution in groundwater Class B / 2 / II II. Potable well-water; contamination possibility from faecal pollution in surrounding groundwater Class C / 3 / III C. Not fit for 3. Not fit for human III. Well-water not potable; faecal swimming all year contact all year pollution in groundwater Note: seasonal quality classification is based on geometric average of monthly coliform counts.
Then information on objective current water quality was presented using the same show-cards. A colour-coded map with symbols showing the current situation of surface water pollution in rivers, estuaries and in the sea along the beach, as well as the situation of groundwater, repeated the information in the show-cards. Using two new sets of maps, respondents were then asked to consider two alternative paths for future water quality, one with and another without a community water treatment plant five years hence. The information describing the current and projected future state of water resources under different scenarios as presented through the maps to the respondents is summarised in Figure 2.
The visitor sample was split by offering one group information only on current and future sea water quality (qy-axis), while the other subsample was informed about current and future states of all three water resources(qx,qy,qz axes).
With reference to Figure 2, in the ‘no treatment’ scenario the
situation would deteriorate from the current situation - drawn here as a solid triangle, to the worst possible situation - drawn as smallest inner chequered triangle on the lowest level of the three axes. In the ‘with treatment scenario’, the situation would improve from the solid drawn triangle to the outer chequered triangle - on the highest water quality level of all three axes. In other words, through the three maps, respondents in the ‘sea water’ sample cast referendum votes on the maintenance of swimmable sea quality versus a potential deterioration to unswimmable levels all year. The ‘all water’ sample voted on the difference between the conceptual outer and inner triangles.
40
For purposes of a financial feasibility study, welfare which cannot be captured will not be relevant for decisionmaking. One may ask whether the “uncaptured” welfare of foreign visitors is relevant to economic analysis if a national accounting stance is taken (Ruitenbeek 1990). 90
Figure 2. Overview of valuation scenarios and water quality Sea water quality (qy) Class A
Scenario combinations of quality levels Current (1997): 5 years with treatment measures: 5 years no treatment measures:
Class B
Class C Class 3 Class III
Class 2
Class II
Class 1
Class I Well- and groundwater quality (qz)
River and estuarine water quality (qx)
After receiving the scenario information respondents were asked whether they found the five year projections credible and the frequency with which they would return given the worst case or “no treatment” alternative. Visitors were then asked whether they would vote “for” or “against” a voluntary visitors road toll to be collected before entering the community and administered by the municipality. The full sequence of WTP questions is given in appendix 1.
91
Several different payment vehicles were explored in focus groups due to the problem of capturing rents from an essentially open access resource. The choice of payment vehicle is discussed further Table 3 Bid amounts
below.
Visitor survey 1 st bid (A) 2 nd bid high (Ah) 2 nd bid low (Al) 100 150 50 200 300 100 500 750 250 1000* 1500 500 Note: *not based on the fourth quintile from the pilot WTP distribution, but added in order to better cover the upper tail of a distribution we expected to observe had the pilot sample size been larger.
valuation question substitutes
Before asking the repeated
beach
reminders about sites
and
budget
constraints were given. The bid sequence for the double bounded dichotomous choice questions is given in Table 3.
A series of follow-up questions were asked to identify protests and “true zero” responses. The household survey differed from the visitor survey in that it also included a set of questions regarding respondent preferences for local institution that would implement the waste water treatment project. Households were also asked a series of questions concerning domestic water and sanitation practices. Finally, both samples were asked questions on socio-economic household characteristics. Design issues As the study relied heavily on focus groups and the pilot survey in adapting well-tried scenarios from the literature to local conditions, a few process-related comments are in order.
The well-known
“water quality ladder” for freshwater (Bergland et al. 1999; Carson and Mitchell 1993) was simplified and extended to include sea water and groundwater, with simple dry/rainy season variations in pollution added to adjust for local use patterns of surface water. Respondents showed reluctance in confining their consideration only to sea water when all coastal water bodies would in fact benefit from the sewage treatment project given local hydrological conditions. For this reason information on improvements in well-water and river water were added to the scenario. Vatn and Bromley described the interdependence of environmental attributes as resulting in a “composition problem” when attempting to price any single attribute, but a description encompassing all coastal water resources seemed unavoidable (Vatn and Bromley 1994). In economic terms the waste water treatment project can be described as resulting in “joint environmental products” which all have potential welfare effects.
92
The treatment technology was not described in detail, although it was stated that the system would lead sewage to a plant situated at a distance from the community where treated water would be released safely to the sea. Health risk was not made explicit in the scenario description, under the assumption that respondents would find the public health recommendations of swimmable water credible.
Benefits therefore concern discrete changes in the availability of water bodies for
recreation or consumption as recommended by public authorities, rather than marginal reductions in personal risk of illness. This simplification is not satisfactory for benefit-cost analysis at the margin, but can be justified given the current methodological problems in relating health risk to pollution levels (Fleisher et al. 1993), description of risk (Georgiou et al. 1998), and the lack of epidemiological studies for bathing and drinking water in Costa Rica. Focus groups revealed that public information on surface water and groundwater pollution was largely unheard of.
The stark contrast between a priori knowledge of sewage pollution levels and
monitoring data suggested that respondents’ information might be changed significantly during the survey.
Controlling for shifts in attitudes to water pollution during the course of survey would
provide explanations for the expected differences in scope effects between the two visitor samples.
Considerable effort was expended in finding a credible and acceptable payment vehicle for the visitors surveys. Exclusion and enforcement of user charges was also a difficult proposition because beach and estuaries are “open access” resources by law, while Costa Rica enforces no legislation that bans bathing in polluted water bodies. The focus groups showed visitors’ suspicion of hotel room surcharges or local tourism taxes due to perceived tax evasion by local hotels. Clearly an a priori choice of the payment vehicle without exploration in focus groups and pilot surveys cannot be made without the risk of high non-response rates on the one hand, or problems of free riding and yeah-saying, on the other. This is particularly true in areas with little previous experience of user charges aimed at providing environmental services. The local Municipality had for some time been contemplating a toll road to pay for public works in the town, making the choice of payment vehicle policy relevant, although liable to incentive incompatibility. Despite the possibility of free-riding, responses were deemed to still be relevant for discussing differences in scope effects, given the same road toll across sub samples.
A final critique of this position is that differences between the two
93
subsamples may be harder to detect due to the increased “noise” created by uncertainty regarding the payment mechanism.
Data Sample and item response rates ‘Sample response’ rates of 89% were within the limits accepted by many practitioners and recommended by the NOAA Panel (Arrow et al. 1993; Smith et al. 1997) (Table 4). Of these Table 4. Sample sizes and response rates Visitors unknown 401 (100%) 42 (11%) “All waters” “Sea water” subsample subsample Freq. % Freq. % = sample response 179 100 180 100 - protest bids 6 3 1 0,5 - don’t know / missing obs. 1 1 5 3 = valid WTP responses 172 96 174 96,5 - zero WTP 3 2 3 1,5 =item responses (WTP>0) 169 94 171 95 Note: zero WTP, protest and don’t know replies to valuation questions are distinguished through follow-up questions. Where percentages do not add up to 100% this is due to rounding effects. Population Selected sample size - sample non-response
visitors, about 96% of both “all waters”
and
“sea
water”
subsamples either answered affirmatively
to
paying
a
voluntary road toll or gave identifiable reasons for why their WTP was zero.
No
more than 4% of all interviews were protests or respondents answering don’t know to all the WTP questions without clear
reasons. However, the very high positive ‘item response’ rates of 94% and 95% to the willingness to pay questions indicate that a road toll as a means of financing a community waste water treatment project may have encouraged free riding41.
Pilot survey response rates to an open-ended question of willingness to pay a road toll had obtained a 100% response rate, with none of the visitors failing to express their maximum WTP, despite the cognitive difficulties this type of question often poses (Hanemann and Kanninen 1996; Mitchell and Carson 1989).
On the other hand, high response rates also suggest populations open to
participating in surveys, as well as the fact that focus groups and pre-tests achieved their aim of improving respondent understanding of the scenario.
41
There a few precedents of voluntary road tolls in Costa Rica, such as the financing of conservation projects near the community of Monteverde. 94
A closer look at the distribution of item response rates is indicative of the reliability of WTP estimates (Table 5) . On the 1st bid level questions, the high proportions of “yes” to “no” answers on the highest bid in both sub samples suggests that the distribution derived from the open-ended pilot (Table 3) may not have been the best prior for the distribution of dichotomous choice answers.
Table 5. Visitor response rates to willingness to pay questions All waters scenario Sea water scenario 1st bid (A) 2nd bid (A h/l) 1st bid (A) 2nd bid (A h/l) Bid level % yes %no dn % yes %no dn % yes %no dn % yes %no 1500 60 40 0 68 23 1000 47 47 5 52 43 5 750 63 33 3 78 19 500 80 17 2 81 19 0 72 25 2 79 21 300 87 13 0 83 17 250 62 38 0 92 8 200 89 11 0 91 9 0 150 83 17 0 91 9 100 95 5 0 80 20 0 96 4 0 50 50 50 50 50 0 50 50 Note: See table 3 for bid sequences. Percentages do not add up to 100% because of rounding error
dn 9 3 0 0 0 0 0 0
On the 2nd bid level question, non-declining yes-no ratios for higher bid levels and surprising stability between the subsample treatments further suggest that one or a combination of “yeah”-saying, compliance bias, or free riding might have been an issue in the visitor sample (Hoinville and Jowell 1977; Mitchell and Carson 1989). Higher successive bids did not consistently increase “no” and reduce “yes” responses for these high bids.
Scenario information effects Before discussing regression results, we look at how the extent of information on water quality affected the samples differently (Figures 3-6 ). Before being informed of the purpose of the survey, under 10% of respondents mentioned waste water pollution as one of “the three biggest problems facing the community and its beach” (Figure 3).
95
Figure 3. Opinion of biggest problems facing residents of and visitors to community 0.4 Households
0.35
Visitors
0.3 0.25 0.2 0.15 0.1 0.05
Other social problems
Lack of potable water
Poor roads
Waste water pollution / sewage
There are none
Lack of signposting
Solid organic/ inorganic waste
Natural characterst ics beach/ sea
0
Note: Proportions from a simultaneous local household survey are included for comparison. Results from this survey are presented elsewhere.
For comparison we have included the prior concerns of local households in Jaco42. The relative importance of potable water quality for households (24%) versus visitors (3%) is noteworthy, as well as the large proportion of both groups which cite social problems not related to the natural environment (39% and 38% respectively). We can safely say that there was relatively little prior awareness of the surface water quality issue addressed by this survey.
Regarding a priori knowledge of current water quality, 51% of households, 45% of the ‘all waters’ subsample, and 35% of the ‘sea water’ subsample found water quality levels to be similar to what they had stated before hearing the scenario. Visitors expectations conformed more poorly to the actual situation than for households, as expected (Figure 4). Figure 4 How information on actual water pollution levels conforms to expectations 0.6 0.5 0.4
Households Visitors ( all waters scenario) Visitors (sea water scenario)
0.3 0.2 0.1 0 Much less
42
Less
Similar
Information collected simultaneously with visitors’ survey. 96
Greater
Much greater
Of note, the visitors’ “all waters” versus “sea water” subsamples differed markedly in their response to information on current pollution level. In the ‘all waters’ subsample 31% versus 13% in the ‘sea water’ subsample found pollution greater than expected. On the other hand,18% of the ‘all water’ subsample versus 40% of the ‘sea waters subsample’ found actual pollution lower than expected. This gives an initial indication that the differences in the scope of current pollution between the subsamples was understood as intended.
Turning to the effects of information on future water quality under the policy alternatives, as measured by the proportion of visitors who would change the frequency of future beach visitation if no treatment measures were taken (Figure 5). In both samples, the proportion of visitors who would not return rises from around 20% under present conditions, to 86%-88% under the worst case scenario. This indicates that differences in scenario information on the future state of river water and groundwater seem to have little impact on behavioural intentions of beach visitors.
97
Figure 5 - Intention to repeat visit during next five years under a priori quality versus scenario worst case 0.9 As much as before 0.8 0.7
Less than before Will not return
Visitors All waters scenario
Visitors Sea water scenario
0.6 0.5 0.4 0.3
Current
Worst case
Current
Worst case
0.2 0.1 0
This cannot be explained as the result of visitors being relatively unconcerned about benefits to anything but sea water. Twelve percent (12%) of visitors mentioned improvements in river water, and 47% potable drinking water quality, as the most important benefits of the treatment measures (Figure 6). Figure 6. Opinion on most important benefits from waste water treatment project 0.5 0.45 0.4 0.35 0.3 0.25 0.2 0.15 0.1 0.05 0
Visitors Households
Sea water fit for swimming
River water fit for human contact
Well water (potable)
All water resources equally important
Don't know
However, intentions to repeat visit may be weakly correlated with these attitudes43. In summary, while current differences in quality are meaningful to respondents, summary statistics indicate that differences in future water quality do not elicit significant responses in future intentions to visit across subsamples.
43
This would weaken the case for using repeat visit intentions as a proxy for the effect of information on future water quality (anonymous referee). 98
Regression results Reliability Did this CV survey provide better information on WTP than expert judgement? Only limited support can be found for the validity of WTP estimates from the two visitors samples.
The visitors’ full
model (lognormal error distribution) has relatively few significant explanatory variables.
The
explanatory variables ‘number of children’, ‘log of income’, ‘total annual visits to substitute sites’, and ‘practices water sports’ have the expected sign and are significant in one or other of the subsamples at the 10% level. Except for “log of 1st bid” none are significant across subsamples (Table 6).
Unexpectedly, total years of education is significantly and negatively correlated with log of WTP. This indicates a lack of what we called “weak” convergent validity for the visitors’ subsample relative to findings in other studies. Although the likelihood ratio statistic confirms that the overall model is significant at the 95% level, by our earlier definition, the lack of consistent significant variables across subsamples with the expected sign show that validity is lower than expected.
For both subsamples the regression of the log of the 1st bid (A) on log of WTP shows a significant and strong anchoring effect - the coefficient for the 1st bid is 0,53 for the pooled visitors’ sample. Although the strength of the anchoring effect depends on the choice of starting bids, the presence of anchoring questions the assumption that respondents hold a priori values regarding the public good and indicates that a value formation process is at work during the survey cued by the bid levels (Hoehn and Randall 1987)
44
.
This bias is partially mitigated in welfare analysis because
respondents are randomly assigned to both high and low starting bids.
44
Halvorsen and Sælensminde (1998) have shown that this can lead to significantly heteroskedastic error terms, explaining some of the upward bias in WTP relative to open-ended type WTP questions. McLeod and Bergland show that this problem also leads to efficiency losses that reduce the advantages of the double-bounded model (Halvorsen and Sælensminde 1998; McLeod and Bergland 1999). 99
Table 6. Full visitors model (pooled sample) Variable Constant (µ) Socio-economic variables Sex (female) d Age Years of formal education Number of persons in household χ 2 6.415 0.709
0.123 0.211
0.991
0.091
0.0001 0.0008
Sea water subsample Parameter ASE Pr > χ 2 6.795 0.162
0.142 0.302
1.130
0.114
0.0001 0.5909
lnLA= lnL0A= LRI= lnLB= lnL0B= LRI= -172.34 -177.88 0.031 -161.23 -161.37 0.001 Likelihood ratio statistic: k=-2(ln LAB - ( ln LA +ln LB)=-2(-335.96-(-172.34-161.23))=4.78 (sign. at 10%) Note: Parameter and ASE figures are rounded to three decimal places.
We saw from descriptive statistics that additional information on future river and groundwater quality does not affect intention to visit in any of the subsamples (Figure 5). We can reject the hypothesis that there is correlation between future intention to visit and WTP.
Table 8 strengthens the argument that respondents focus relatively more on the scenario information on current water quality than on future quality with and without the treatment policy. We therefore conjecture that our detailed description of this public good, including information on baseline quality, may have come at the cost of failing to meet the “burden of proof” requirements of sensitivity to the scope of improvements.
However, there are other plausible explanations for the lack of scope
effect which must be considered. The importance of substitute sites for WTP is partially confirmed in the visitors model by the significance of the dummy “total annual visits to other beaches”. Problems related to water quality being embedded in recreation day and the incentive compatibility of the payment vehicle are discussed in conclusion.
A more rigorous scope test would have split the sample three ways, including the present two subsamples, as well as a third sample discussing only the potential improvements in river and groundwater quality (∆qz and ∆qx in Figure 2). This strategy has two drawbacks. It increases sample size by a third. There is also the distinct possibility that respondents will find it difficult to disassociate reductions in pollution of river water quality from improvements in sea water quality due to the composition problem (Vatn and Bromley 1994). That critique cannot be aimed at the present split sample design because sea water quality is much less likely to affect river and groundwater.
102
Robustness of willingness to pay estimates Finally, given an evaluation of the validity and reliability of WTP models we look at the robustness of mean WTP estimates for use in welfare analysis. Estimation of mean WTP shows sensitivity to the bid format and distributional assumptions (Table 9). The yeah-saying detected in Table 5 leads to a right-hand tail which particularly effects expected WTP in the lognormal distribution.
In this study,
the double bounded dichotomous choice format can be seen as a “compromise” between the lower WTP from the open-ended format and the higher single bounded estimates. Concerning the possible error introduced by this CV to a benefit-cost analysis of the ‘wastewater treatment project’, our estimates vary by more than an order of magnitude due only to statistical assumptions.
Table 9. Robustness - sensitivity of willingness-to-pay to model specifications Estimated WTP Valuation approach Visitor pooled sample (bid format - distribution - model specification) Mean Median 1.Open ended pilot - non-parametric - none 405 250 2.Single bounded - lognormal - unconditional 2633 1083 3.Double bounded - normal – uncond. - conservative 970 882 4.Double bounded - normal - unconditional 995 923 5.Double bounded - lognormal - unconditional 1539 850 6.Double bounded - lognormal - best conditional 1511 886 Note: All WTP figures in December 1997 colones; 1USD=240 colones. “Unconditional” refers to the unconditional WTP estimate, while “best conditional” refers to WTP conditional on the significant explanatory variables. Conservative = all “don’t know” responses coded as zero WTP. The pilot is based on only N=20 responses.
Discussion The extent to which this study followed NOAA recommendations is given in Table 10. With few exceptions this study conforms to the recommendations. Nevertheless, the validity of the visitor survey was relatively poor with few significant variables in the pooled model, and instability of significant variables across subsamples. The visitors sample did not show sensitivity to the scope of hypothetical benefits. Small sample size cannot take all the blame because in several instances we observed significant effects that were counterintuitive.
The poor validity of the visitors model and failure to meet the NOAA scope test may be due to “pitfalls” common to CV studies of recreational benefits, as well as problems of special relevance to some developing countries. Failure here is not a general critique of CVM’s validity, but rather an
103
illustration of its limitations under circumstances we have tried to define in some detail (Carson 1995).
•
Incentive incompatibility and substitute sites
Despite efforts in focus groups to tailor a credible payment vehicle it may still have suffered incentive compatibility problems in the visitors’ subsample. A voluntary road toll may encourage strategic responses from visitors who would like to see water treatment measures implemented, but would not pay or would go elsewhere once they were. Access to substitute sites has some negative effect on willingness-to-pay as shown in the visitors model. However, available substitute sites may also lead to insensitivity to the scope of water quality changes at the study site. A large number of alternate destinations also makes it difficult to resort to simple travel cost approaches. Random utility travel cost models are an alternative, although the lack of sensitivity of visitor intentions to different water quality levels would require a much larger sample size spread across multiple sites with large variations in quality levels.
• Embedding problem - a recreation day Although, a voluntary road toll was shown to be the most credible payment mechanism for visitors it may also encourage embedding effects. By paying a road toll the visitor can be seen as paying for a “day at the beach”, which in many cases includes other attributes than enjoyment of water related activities. More comprehensive water quality improvements may not elicit increased willingness-topay because these environmental attributes are “embedded” in the good “a day at the beach”. Just as water pollution was not perceived as a salient local problem, water quality improvements may have little marginal effect when these are embedded in a set of non-environmental attributes .
The substitute site, incentive compatibility and embedding problems described above should be much lower for contingent valuation of local households. Local water resources are in many ways unique to residents who’s livelihoods depend on them, while e.g. a community sewage tax only encompasses sanitation and environmental benefits and is also much less subject to free-riding behaviour.
104
• Problem of composition - hydrological linkages Hydrological linkages in the coastal watershed suggest that the attributes of different water resources are not independent and that waste water treatment has joint benefits. Using the traditional water quality ladder and conducting a “clean” scope test is more difficult. Although the original focus of the study was valuation of sea water quality, local focus group discussions and hydrological data indicated that respondents might find it difficult to evaluate sea water without information on groundwater and river water quality. This variant of the embedding problem has also been called a “composition problem”
(Vatn and Bromley 1994)
in which biophysical linkages make
consideration of separate parts of a natural system conceptually difficult for respondents. It may have blurred respondents’ distinction between improvements in sea water and all coastal water resources. For projects with multiple and joint environmental benefits some form of choice-based46 approaches might provide a better context for valuation (Louviere 1988).
• Information effects and reference dependency We have argued that the lack of scope effect among visitors may also be due to a “cognition problem” leading to an reaction akin to “reference dependency” (Tversky and Kahneman 1991). The significance of the dummy “ water quality worse than expected” in the “all waters “ subsample illustrates the effect of receiving surprising negative information on current water quality. On the other hand, follow-up questions on visitor intentions under the worst case scenario show no significant effects, indicating that respondents’ WTP may be “reference dependent” to information on current rather than future water quality.
46
Variably also known by the name of conjoint analysis. 105
Table 10. Study compliance with NOAA Panel Guidelines for Contingent Valuation Surveys
“Burden of proof” requirements
Compliance
Comment /results
Minimisation of sample and item non-responses
yes
WTP responsiveness to scope of environmental improvement Understanding of valuation task
no
Belief in restoration scenario
yes
Provide reference to cost of programme
yes
valid WTP responses as % of selected sample size: 86% of visitors’ pooled subsamples no significant sensitivity to scope of benefits in a split sample test of visitors WTP item non-response rate: 4% of visitors pooled subsamples expressed disbelief in 5 year “worst case” and “best case” for water quality: 7% of visitors (“sea water” scenario) 2% of visitors (“all waters” scenario) explicit in scenario and specification of sewage charge (households) and road toll levels (visitors)
General guidelines and goals Probability sampling
yes
yes
Personal interviews Pre-testing of interviewer effects and survey instruments Record advance information given to respondents Accurate description of programme or policy
yes yes
WTP valuation question Explicit no answer or don’t know option provided
yes no *
Reminder of undamaged substitutes
yes
Adequate time lapse until recovery
yes
Follow-up questions on motivation for WTP and understanding Deflection of warm glow and “yeah”- saying
yes
n.a. yes/no
yes/no
systematic random sample of households and nationally resident visitors household and visitors 4 focus groups, 1 pre-test and 1 pilot survey none was provided to avoid focusing effect Water quality ladder and waste water treatment descriptions simplified to improve respondent understanding Double bounded dichotomous choice “d.n.” provided as option, but not prompted by enumerator other nearby beaches specified in detail by respondent 5 years until full waste water treatment implemented is credible (see above) adequate for separation of true zero and true protest bids Double-bounded dichotomous choice question employed, possible “yeah”-saying or free-riding preceding WTP question
Reminder of alternative expenditure possibilities yes and substitute sites Sensitivity to interim vs. steady-state n.a.** interim waste water treatment is not a policy losses/improvement option Sensitivity to time of implementation / present n.a.** no sensitivity test conducted on time of policy value of benefits implementation Note: yes/no=compliance with NOAA guideline in question; n.a.=not applicable; * (Carson et al. 1998) find no significant effect on WTP distribution from including “don’t know” option; **these requirements are most relevant for natural resource damage assessments.
106
Such cognition problems are not trivial. Providing public health recommendations on current water quality at all coastal recreational sites is a clear objective of the Ecological Blue Flag Programme and a benchmark against which future improvements are judged. CV studies of water quality improvements cannot easily justify not providing such baseline information when respondents are poorly informed about environmental quality at the outset. However, in this study there are indications of a trade-off between providing relevant scenario information and “reference dependency” on present quality levels, rather than the future water quality changes which are the object of study. More generally, further controls for value formation effects of scenario information seem justified, especially when dealing with “invisible” environmental quality issues in areas with little formal education or previous public information. Conclusions The study found several limitations to the application of the NOAA burden of proof requirement for testing scope sensitivity.
Various “pitfalls” such as definition of substitute site and incentive
incompatibility are well-known from studies in the US and Europe. However, these may be exacerbated in developing areas with little prior information on environmental quality and lacking credibility or inefficiency of public environmental policies.
Increasing scenario information on
environmental quality may reduce non-response rates and increase reliability, but may complicate conducting the scope test. Hydrological linkages further complicate scope testing. For small populations, typical of many “village or town level” developing country applications, conducting a scope test may not be statistically feasible when also having to comply with the NOAA Panel recommendation for referendum type WTP questions.
The study has tried to give examples of the ‘good practice’ documentation of validity, reliability and robustness. Detailed documentation of sample and item response rates and extensive reporting of follow-up questions on how scenario information affects WTP make the relative weaknesses of this CV survey apparent. The case for conducting CV studies of visitors’ WTP in developing countries has not been strengthened by this particular study. Incentive compatibility problems in an open access resource, and the composition problem in dealing with a policy conveying joint environmental products, are problems of this particular application of contingent valuation . However, producing a reliable study by NOAA standards is generally expensive and time intensive, prohibitively so in many
107
“town or village level” applications and small rural populations in developing countries. Although the scope test has become contingent valuation’s ‘industry standard’, less rigorous validity criteria may be acceptable for benefit-cost analyses of development projects, when demands on precision are not those of natural resource damage assessments in litigation questions.
108
Appendix 1 - Willingness to pay que stions (translation) Visitors: (…) In order to implement the system the municipal government of (..) would be the institution in charge. The money necessary to build the sewage system could be obtained from outside the community. However, in order to operate and maintenance the system the municipality would require a monthly contribution by the inhabitants and visitors. Q. If, on your next visit, there were a voluntary road toll per person at the entrance to (name of community) with the purpose of implementing the sewage system and obtaining the improvements in water quality, would you or would you not pay? ___1=I would not make a voluntary payment ___2=I would make a voluntary payment ___99999=don’t know/no answer Now, in the following questions keep in mind that you already pay for other public services and that you can visit the other beaches that you mentioned at the start of the interview. Also remember that if you pay a road toll you will have to reduce your budget during your stay by the same amount. Q. If at this voluntary road toll they ask for Ai colones per adult for the improvements in water quality in (name of community) , would your be personally willing to pay this amount? Remember that we are comparing the improvements between the situation in five years if no measures are taken (Map 2) and the situation if the sewage system is built (Map 3). ___1=Yes ___0=No ___99999=don’t know/no answer Q2. The costs of operation and maintenance of the sewage system are not known with certainty. If at this voluntary road toll they ask for Aij colones per adult for the improvements in water quality in (name of community) , would your be personally willing to pay this amo unt? ___ 1=Yes ___ 0=No ___ 99999=don’t know/no answer
(…)
109
References Alberini, A., Kanninen, B., and Carson, R. T. (1997). “Modeling response incentive effects in dichotomous choice contingent valuation data.” Land Economics, 73(4), 309-24. Arrow, K. J., Solow, R., Leamer, E., Portney, P., Radner, R., and Schuman, H. (1993). “Report of the NOAA Panel on Contingent Valuation.” Federal Register 58, 4601-4614 . Bateman, I. J., Langford, I. H., and Rasbash, I. J. (1999). “Willingness-to-pay question format effects in contingent valuation studies.” Contingent valuation of environmental preferences: Assessing theory and practice in the USA, Europe, and developing countries, I. J. Bateman and K. G. Willis, eds., Oxford University Press. Bergland, O., Magnussen, K., and Navrud, S. (1999). “Benefit transfer: testing for accuracy and reliability.” Comparative environmental economic assessment: meta analysis and benefit transfer, R. J. G. M. Florax, P. Nijkamp, and K. Willis, eds., Kluwer Academic Publishers, Dordrecht. Bergland, O., Romstad, E., Kim, S.-W., and McLeod, D. (1990). “The Use of bootstrapping in contingent valuation studies.” , Department of Agriculture and Resource Economics, Oregon State University. Carson, R., and Mitchell, R. C. (1993). “The Value of clean water: the public's willingness to pay for boatable, fishable, and swimmable quality water.” Water Resources Research, 29(7), 2445-2454. Carson, R. T. “Contingent valuation surveys and tests of insensitivity to scope.” International conference on determining the value of non-marketed goods: economic, psychological, and policy relevant aspects of contingent valuation methods, Bad Homburg, Germany, July 1994. Carson, R. T., Hanemann, W. M., Kopp, R. J., Krosnick, J. A., Mitchell, R. C., Presser, S., Ruud, P. A., Smith, V. K., Conaway, M., and Martin, K. (1998). “Referendum design and contingent valuation: the NOAA Panel's no-vote recommendation.” The Review of Economics and Statistics, 335-338. Choe, K.-A., Whittington, D., and Lauria, D. T. (1996). “The Economic Benefits of surface water quality improvements in developing countries: a case study of Davao, Philippines.” Land Economics, 72(4), 519537. Darling, A. H., Gomez, C., and Niklitschek, M. E. (1993). “The Question of a public sewerage system in a Caribbean country: a case study.” Environmental Economics and Natural Resource Management in Developing Countries, M. Munasinghe, ed., Committee of International Development Institutions on the Environment (CIDIE). Efron, B., and Tibshirani, L. (1986). “Bootstrap methods for standard errors, confidence intervals, and other measures of statistical accuracy.” Statistical Science, 1(1), 54-77. Ekbom, A. (1993). “75 case studies on environmental economic evaluation in developing countries.” Working Paper, Environmental Economics Unit, University of Gothenburg. Fleisher, J. M., Jones, F., Kay, D., Stanwell-Smith, R., Wyer, M., and Morano, R. (1993). “Water and Non-WaterRelated Risk Factors for Gastroenteritis among Bathers Exposed to Sewage-Contaminated Marine Waters.” International Journal of Epidemiology, 22(4), 698-708. Freeman, A. M. I. (1995). “The Benefits of water quality improvements for marine recreation: a review of the empirical evidence.” Marine Resource Economics, 10, 385-406.
110
Georgiou, S., Langford, I., Bateman, I., and Turner, R. K. (1998). “Determinants of individuals' willingness to pay for perceived reductions in environmental health risks: a case study of bathing water quality.” Environment and Planning A 30, 577-594. Greene, W. H. (1993). Econometric Analysis, Prentice Hall International Editions, New Jersey. Halvorsen, B., and Sælensminde, K. (1998). “Differences between willingness-to-pay estimates from open-ended and discrete-choice contingent valuation methods: the effects of heteroskedasticity.” Land Economics, 74(2), 262-82. Hanemann, W. M., and Kanninen, B. (1996). “The Statistical analysis of discrete response CV data.” Working Paper 798, Department of Agricultural and Resource Economics, Division of Agriculture and Natural Resources, University of California at Berkley, Berkley. Hoehn, J., and Randall, A. (1987). “A satisfactory benefit cost indicator from contingent valuation.” Journal of Environmental Economics and Management(14), 226-247. Hoinville, G., and Jowell, R. (1977). Survey research practice, Heinemann Educational Books, London. ICT. (1996). “Encuesta Area de Extranjeros, Temporada Turistica Alta 1996, Instituto Costarricence de Turismo.” . Lauria, T., Whittington, D., Choe, K.-A., Turingan, C., and Abiad, V. (1999). “Household demand for improved sanitation services: a case study of Calamba, the Philippines.” Contingent valuation of environmental preferences: Assessing theory and practice in the USA, Europe, and developing countries, I. J. Bateman and K. G. Willis, eds., Oxford University Press. Louviere, J. J. (1988). “Conjoint analysis modelling of stated preferences. A review of theory, methods, recent developments and external validity.” Journal of Transport Economics and Policy(January). McConnell, K. E., and Ducci, J. H. “Valuing environmental quality in developing countries: two case studies.” AERE Session on Contingent Valuation Studies in Developing Countries, Atlanta, Georgia. McLeod, D. M., and Bergland, O. (1999). “Willingness-to-pay estimates using the double-bounded dichotomouschoice contingent valuation format: a test for validity and precision in a Bayesian framework.” Land Economics, 75(1), 115-125. Mitchell, R. C., and Carson, R. T. (1989). Using surveys to value public goods. the contingent valuation method, Resources for the Future, Washington D.C., USA. Mora, D. (1997). “Las mejores playas del país buscan la bandera azul.” Aguas Para Siempre - Revista Oficial del Instituto Costarricence de Acueductos y Alcantarillados, 3-11. Mora, D., Rojas, J. C., Sequiera, M., Mata, A., and Coto, M. (1989). “Criterios bacteriologicos y calidad sanitaria de las aguas de las playas de Costa Rica Periodo 1986-1988.” Tecnología en Marcha, 9(3). Niklitschek, M., and León, J. (1996). “Combining intended demand and yes/no responses in the estimation of contingent valuation models.” Journal of Environmental Economics and Management(31), 387-402. Ostrom, E. (1990). Governing the commons - The Evolution of institutions for collective action, Cambridge University Press. Ruitenbeek, H. J. (1990). “The Rainforest Supply Price: A Step Towards Estimating a Cost Curve for Rainforest Conservation.” 29, The Development Economics Research Programme, London School of Economics. Shultz, S. (1997). “La valoración de recursos naturales y ambientales no basada en el mercado en Centroamerica y el Caribe.” Revista de CEPAL(#93 December), 65-76.
111
Smith, V. K., Zhang, X., and Palmquist, R. B. (1997). “Marine debris, beach quality, and non-market values.” Environmental and Resource Economics(10), 223-247. Sorensen, J. (1990). “An assessment of Costa Rica´s coastal management program.” Coastal Management(18), 37-63. Tversky, A., and Kahneman, D. (1991). “Loss aversion in riskless choice: a reference-dependent model.” Quarterly Journal of Economics(106), 1039-1061. Vasquez, F. (1997). “Valoracion contingente y estimacion económica de los beneficios recreacionales de la playa de Dichato (Tome-Chile).” Revista Economia y Administracion(48), 75-88. Vatn, A., and Bromley, D. (1994). “Choices without prices without apologies.” Journal of Environmental Economics and Management, 26, 129-148. Whittington, D. (1998). “Administering contingent valuation surveys in developing countries.” World Development, 26(1), 21-30. Whittington, D., Lauria, D. T., Wright, A. M., Choe, K., Hughes, J. A., and Swarna, V. (1992). “Household demand for improved sanitation services: a case study of Kumasi, Ghana.” Water and Sanitation Report 3, UNDP-World Bank Water and Sanitation Program.
112
Transferring the benefits of avoided health effects from water pollution between developed and developing countries47
Abstract
Transferring estimates of the economic benefits of environmental improvements from developed to developing countries is a common practice in benefit-cost analyses by international development agencies and their consultants. A large and growing body of contingent valuation studies makes benefit transfer increasingly tempting. Two very similar contingent valuation surveys on the willingness-to-pay to avoid episodes of eye irritation, gastroenteritis and coughing episodes due to sewage-polluted seawater were conducted on visitors to beaches in Portugal and Costa Rica. Convergent validity tests of transferring unadjusted mean WTP, incomeadjusted WTP, and WTP adjusted for common socio-demographic variables were rejected. A test of WTP model parameters rejected that they were drawn from the same pooled sample for all the three episode types. When compared to on-site studies in Costa Rica, benefit transfer from Portugal leads to errors typically in the order of 100%. Adjusting WTP for declared income or other easily accessible socio-demographic variables does not reduce transfer error. The common practice of adjusting WTP by relative GNP/capita is a “black box” approach we strongly caution against unless it can be shown that both study and policy site populations are nationally representative. This study shows that transfer of health benefit estimates can be both cheap and fast, but potentially quite unhealthy for policy analysis.
47
Acknowledgement: I would like to thank Susana Mourato, Lecturer in Environmental Economics at Imperial College of Science, Technology and Medicine, for providing the Portuguese data and valuable comments on earlier versions of the paper. I would also like to thank Richard Ready and Ståle Navrud for their suggestions on estimation and comments on earlier versions. Any mistakes or omissions are my own. This research was partially funded by the Norwegian Research Council. This paper has also appeared as Barton (1999), “Quick and dirty: transferring the benefits of avoided health effects from water pollution between developed and developing countries” Discussion Paper #D-9/1999. Department of Economics and Social Science, Agricultural University of Norway. 113
Introduction The review of benefit transfer in a 1992 issue of Water Resources Research has lead to an increasing number of studies published testing for convergent validity of contingent valuation estimates of willingness-to-pay between study and policy sites (Bergland et al. 1999; Brookshire and Neill 1992; Brouwer and Spaninks 1997; Desvousges et al. 1992; Downing and Ozuna 1996; EC 1999; Kirchhoff et al. 1997; Loomis 1992).
Most studies are within-country transfers, and only two concern the transfer of WTP to avoid health effects of environmental quality. In the only cross-country study, transfers of WTP to avoid illness episodes between five European countries was tested (EC 1999). Average absolute transfer error from a pooled four country model to a fifth country was 36.2% for unadjusted mean WTP, 43.6% for simple income-adjusted WTP and demographic explanatory variables. did not reduce transfer errors.
45.4% for WTP conditional on a function of socio-
Of note was the fact that increasing site-specific information
Desvousges et al. (1998) transferred WTP to avoid 21 illness
conditions due to air pollution using a meta-analysis of five CV studies from the US. A quality of well-being (QWB) index based on expert judgement was used to compare different conditions and derive a meta-benefit function. The model predicted WTP of the component studies with 90% confidence. These values were aggregated with cost-of-illness and value of statistical life estimates and used to predict a marginal change in air pollution of particulate matter in Minnesota. When compared with transfers from a meta-analysis of hedonic property values of air pollution in San Francisco, transferred mean WTP differed by 50% or more.
While few studies have shown WTP estimates and valuation functions to be transferable by commonly accepted statistical criteria, an ‘importance test’ of transfer errors may give the go-ahead in certain decision-contexts within the same country and for the same good (Desvousges et al. 1992; León et al. 1997; Smith 1992). However, from the European Commission transfers study, there is reason to expect that benefit transfer may lead to greater errors across national institutional and cultural contexts.
114
While transfer of valuation estimates is commonly practiced in benefit-cost analysis by development organisations such as the World Bank, there is very little empirical research to document the validity and reliability48 of transfers from developed to developing countries. A little work has been done in dose-response functions in the environmental economics literature. For example, a study of transfers of the probability of illness for PM10 levels between Los Angeles and Taiwan find an average prediction error of 25% (Alberini and Krupnick 1997) . This research has shown that population averages hide very large differences in prediction errors across demographic groups such as age.
The present study evaluates transferring estimates of WTP to avoid an episode day of eye irritation, stomach upset(gastroenteritis) and coughing between populations of seaside beach visitors in Portugal and Costa Rica.
For purposes of comparison, the methodology follows closely the
European five-countries study of WTP to avoid consequences of various illness episodes49 (EC 1999). To our knowledge this is the first (published) study looking at transfer of WTP estimates between so-called developed and developing countries.
The following section briefly discusses theoretical differences in WTP for water quality and avoided illness due to pollution. We then review several hypotheses for testing the validity of benefit transfer and the methodology for eliciting and estimating WTP for the three illness symptoms. A discussion of observed sample characteristics in Portugal and Costa Rica is followed by estimates of expected WTP and transfer errors. We then comment on the convergent validity of the transfers based on the significance of the multivariates of the survival models of WTP.
Finally, we make several
recommendations regarding transfers of health benefit estimates between countries a distinct as Costa Rica and Portugal. Theory Harrington and Portney (1987), and later Desvousges et al. (1998), provide a model which explains household’s economic motivations for avoiding an episode of sickness due to pollution. We review their model to identify a conservative a measure of WTP with as little reliance as possible on contextdependent evaluation by the respondent. The discussion aims to show that by valuing ex post health 48
Here we refer to convergent validity based on statistical equality of parameters. By reliability we mean the size of transfer error. 49 hospital stay, casualty, bed confinement, a day of coughing, eye irritation or stomach upset 115
improvements at so-called ‘health endpoints’ and under certainty, we can improve the chances of a benefit transfer succeeding across distinct environmental and institutional contexts.
In this slightly
modified Harrington-Portney model, an episode of illness i is given as: Episode:
Si=Si(P,b;A,M)
, SM=dS/dMChi 0.0021 0.9185 0.3507 0.0910 0.7369 0.3812 0.0050
Puntarenas pilot study (open ended): Data: Noncensored Values= Left Censored Values=
82 0
Right Censored Values= Interval Censored Values=
0 0
Regression parameters: Log Likelihood for NORMAL -698.0948701 Variable
DF
Estimate
INTERCPT SEX AGE EDUC HHSIZE UNEMPLOY HHINC SCALE
1 1 1 1 1 1 1 1
3162.41686 -687.91988 -27.323417 72.911079 -123.0808 -111.2268 -0.0007397 1205.21533
Std Err ChiSquare 917.0016 318.909 11.30985 51.8529 78.09842 389.1269 0.001885 94.1115
11.89318 4.653097 5.836556 1.977156 2.483682 0.081703 0.153972
Pr>Chi 0.0006 0.0310 0.0157 0.1597 0.1150 0.7750 0.6948
Puntarenas main study (double bounded dichotomous choice): Data: Noncensored Values= Left Censored Values=
0 35
Right Censored Values= 218 Interval Censored Values= 438
Regression parameters: Log Likelihood for NORMAL -877.0541113 Variable
DF
Estimate
INTERCPT SEX AGE EDUC HHSIZE UNEMPLOY HHINC SCALE
1 1 1 1 1 1 1 1
2865.20137 -392.74798 -16.40696 24.3356908 1.48305208 -63.972359 0.0020497 1299.77013
Std Err ChiSquare 318.0042 127.6988 4.086343 16.99889 33.05095 280.1815 0.000826 48.59269
81.17918 9.459191 16.1208 2.049492 0.002013 0.052132 6.15625
Pr>Chi 0.0001 0.0021 0.0001 0.1523 0.9642 0.8194 0.0131
113
Run using SAS LIFEREG PROCEDURE for survival analysis and a normal distribution. Note: hhsize=persons in household, hhinc=monthly household income, educ=years of education. 212
References Arrow, K. J., and Fisher, A. C. (1974). “Environmental preservation, uncertainty, and irreversibility.” Quarterly Journal of Economics(88), 312-19. Atherton, T. J., and Ben-Akiva, M. E. (1976). “Transferability and updating of disaggregate travel demand models.” Transportation Research Record(610), 12-18. Atkinson, S. E., Crocker, T. D., and Shogren, J. F. (1992). “Bayesian exchangeability, benefit transfer, and research efficiency.” Water Resources Research, 28(3), 715-722. Barton, D. N. (1998). “Applying NOAA Panel recommendations to contingent valuation studies in developing countries - a case study of coastal water quality in Costa Rica.” Discussion paper #24/98 , Department of Economics and Social Sciences, Agricultural University of Norway. Barton, D. N. (1999). “The Transferability of benefit transfer: an experiment in varying the context of willingnessto-pay for water quality improvements.” Discussion Paper #10/99 , Department of Economics and Social Sciences, Agricultural University of Norway. Bergland, O., Magnussen, K., and Navrud, S. (1999). “Benefit transfer: testing for accuracy and reliability.” Comparative environmental economic assessment: meta analysis and benefit transfer, R. J. G. M. Florax, P. Nijkamp, and K. Willis, eds., Kluwer Academic Publishers, Dordrecht. Bergland, O., Romstad, E., Kim, S.-W., and McLeod, D. (1990). “The Use of bootstrapping in contingent valuation studies.” , Department of Agriculture and Resource Economics, Oregon State University. Brouwer, R., Langford, I. H., Bateman, I. J., Crowards, T. C., and Turner, R. K. (1997). “A Meta-analysis of wetland contingent valution studies.” Working Paper GEC 97-20, CSERGE, London. Brouwer, R., and Spaninks, F. (1997). “The Validity of transferring environmental benefits: further empirical testing.” Working Paper GEC 97-07, CSERGE, London. Carson, R. T., Groves, T., and Machina, M. J. “Incentive and informational properties of preference questions.” Plenary address. European Association of Resource and Environmental Economists, Oslo, Norway, June 1999. Desvousges, W. H., Johnson, F. R., and Banzhaf, H. S. (1998). Environmental policy analysis with limited information. Principles and applications of the transfer method., Edward Elgar, Cheltenham, UK. DGEC. (1992). “Encuesta de hogares de propositos multiples del Gran Puntarenas.” , Direccion General de Estadistica y Censos, Costa Rica. Downing, M., and Ozuna, T. J. (1996). “Testing the reliability of the benefit function transfer approach.” Journal of Environmental Economics and Management, 30(3), 316-22. EC. (1999). “Benefit transfer and economic valuation of environmental damage in the European Union: with special reference to health.” Final Report to the DG-XII, European Comission contract ENV4-CT96-0227 . Freeman, A. M. (1984). “The Quasi-option value of irreversible development.” Journal of Environmental Economics and Management, 11, 292-295. Gourieroux, C., and Monfort, A. (1995). Statistics and econometric models. Volume 1., Cambridge University Press, Cambridge. Horowitz, J. (1993). “A New model of contingent valuation.” American Journal of Agricultural Economics, 75(5), 1268-72.
213
Judge, G. G., Hill, R. C., Griffiths, W. E., Lütkepohl, H., and Lee, T.-C. (1988). Introduction to the theory and practice of econometrics, John Wiley and Sons, New York. Kirchhoff, S. “Benefit function transfer vs. meta-analysis as policy-making tools: a comparison.” Workshop on Meta-analysis ad benefit transfer: state of the art and prospects, Tinbergen Institute, Amsterdam. Kirchhoff, S., Colby, B. G., and LaFrance, J. T. (1997). “Evaluating the performance of benefit transfer: an empirical inquiry.” Water Resources Research(33), 75-93. Krutilla, J. V. (1964). “Conservation reconsidered.” American Economic Review, 57, 777-786. Leamer, E. E. (1982). “Sets of posterior means with bounded priors.” Econometrica(50), 725-736. León, C. J., Vázquez-Polo, F. J., Riera, P., and Guerra, N. (1997). “Testing benefit transfer with prior information.” Discussion paper , Department of Applied Economics, University of Las Palmeras de Gran Canaria, Spain. León, J., and Vázquez Polo, F. J. (1998). “A Bayesian approach to double bounded contingent valuation (Modelización del aprendizaje en valoración contingente).” Discussion paper , Department of Applied Economics, University of Las Palmeras de Gran Canaria, Spain. Loetscher, T. (1999). “Appropriate sanitation in developing countries: the development of a computerised decision aid,” Ph.D. thesis, University of Queensland, Brisbane. Loomis, J. B. (1992). “The Evolution of a more rigorous approach to benefit transfer: benefit function transfer.” Water Resources Research, 28(3), 701-705. Loomis, J. B., and White, D. S. (1996). “Economic benefits of rare and endangered species: summary and metaanalysis.” Ecological Economics(18), 197-206. McLeod, D. M., and Bergland, O. (1999). “Willingness-to-pay estimates using the double-bounded dichotomouschoice contingent valuation format: a test for validity and precision in a Bayesian framework.” Land Economics, 75(1), 115-125. Parsons, G. R., and Kealy, M. J. (1994). “Benefits transfer in a random utility model of recreation.” Water Resources Research, 30(8), 2477-2484. Schwartz, J. (1994). “Air pollution and daily mortality: A review and meta-analysis.” Envrionmental Resources(64), 36-52. Smith, V. K. (1992). “On separating defensible benefit transfers from smoke and mirrors.” Water Resources Research, 28(3), 685-94. Smith, V. K., and Huang, J. (1995). “Can markets value air quality? A Meta-analysis of hedonic property value models.” Journal of Political Economy, 103(1), 209-27. Smith, V. K., and Kaoru, Y. (1990). “What have we learned since Hotelling's letter? A meta-analysis.” Economics Letters(32), 267-272. Sturtevant, L. A., Johnson, F. R., and Desvousges, W. H. (1995). “A meta-analysis of recreational fishing.” , Triangle Economic Research, Durham, North Carolina. van de Walle, D., and Gu newardena, D. (1998). “How dirty are "quick and dirty" methods of project appraisal?” Policy Research Working Paper 1908 , Development Research Group, World Bank. Vaughan Jones, C. (1991). Financial risk analysis of infrastructure debt. The Case of water and power investments, Quorum Books, New York.
214
Viscusi, W. (1985). “Are individuals Bayesian decision-makers?” American Economic Review, 75, 381-85. Vose, D. (1996). Quantitative risk analysis. A Guide to Monte Carlo simulation modelling, John Wiley & Sons, Chichester. Walsh, R. G., Johnson, D. M., and McKean, J. R. (1992). “Benefit transfer of outdoor recreation demand studies 1968-1988.” Water Resources Research, 28(3), 707-713.
215
Annex 1 Jaco visitors survey (December 1997)
216
VERSION VISITANTES
TODO 1000
ENCUESTA PRINCIPAL
ESPACIO PARA USO
CONFIDENCIAL
DE LA OFICINA:
IDENTIFICACION - LLENE SI SE REALIZA LA ENCUESTA
Encuestador ID no: Fecha: /
/ _
/ ___
Sector playa:__sur___/_ norte_ Encuesta no.:
Hora que empezó:
/______
/ /
OBS#_______
Hora que terminó:_____/_____
A. PREGUNTAS DE SELECCION DE RESPONDENTE -LLENE SI SE REALIZA LA ENTREVISTA A1. EL RESPONDENTE ES MAYOR A 18 AÑOS ?
SI____
A2. HABLA O ENTIENDE ESPANOL?
SI____
LEA LA SIGUIENTE INTRODUCCION Buenos días/tardes. Cómo está? Me llamo (muestra identificación). Soy estudiante de la Universidad Nacional y estamos haciendo un estudio sobre aspectos de la calidad de la visita a Playa Jacó (SI PREGUNTA MAS RESPONDA: sobre el ambiente y de algunos servicios públicos). No es una encuesta política o religiosa. La entrevista durará unos minutos. A3. Ud. es visitante a Playa Jacó? SI____ NO____=>DESPIDASE CORTESMENTE A4. De qué nacionalidad es Ud.? _______________________ A5. Ud. es residente en Costa Rica o ha estado y/o tiene planes de quedarse durante los próximos 6 meses ? ___SI=> REALIZA LA ENTREVISTA ___NO=> DESPIDASE Y ANOTA “NO RESIDENTE” Y NACIONALIDAD EN HOJA DE CONTROL Sus respuestas serán absolutamente confidenciales y su nombre no aparecerá en ninguna parte (anónimo). Podríamos sentarnos? No hay respuestas correctas o incorrectas. Simplemente piense bien en cada pregunta antes de dar su mejor respuesta.
217
B. PREGUNTAS DE PRECALENTAMIENTO Y OPINION GENERAL B1. Desde hace cuantos años viene Ud. a Playa Jacó? ……………años B2. Cuáles son los tres aspectos menos atractivos de Playa Jacó para Ud. como turista ? NO SUGIERE RESPUESTA. ESPERE Y ANOTA ___01. Contaminación ___2. Falta de (acceso a ) ___3. Basura inorgánica en la humana de los ríos o del mar agua potable playa o en el agua ___4. Basura orgánica en la __5. Falta de información o ___6. Pobre acceso / malas playa o en el agua rotulación sobre playa carreteras ___7. Condiciones naturales de __8. Condiciones naturales ___9. No hay ninguno la arena de las aguas del mar ___10. Otros (especifique):
B3.
Si las condiciones actuales se mantienen como hasta hoy durante los próximos 5 años Ud. regresará durante este período a Playa Jacó? ______0=Si con la misma ___2=Si pero menos ___3=No frecuencia que este año frecuentemente que este año
218
C. PREGUNTAS SOBRE USO DE PLAYAS Hablemos ahora del uso que Ud. y su familia dan a Playa Jacó y a otras playas donde han ido durante los últimos doce meses (de diciembre 96 hasta e incluyendo esta visita). C1. En qué provincia y ciudad o pueblo vive Ud.? ____________ provincia
______________ ciudad /pueblo
Cuántos veces fueron a (nombre de playa) entre :
Cómo viaja a esta playa? (vea código)
diciembre 96 y marzo 97?
1=carro,2=bus corriente, 3=bus de excursion, 4=taxi, 5=avion, 6=moto, 7=otro
abril 97 y hoy?
Playa Jacó
C2-1) C2-2) ___/___ en total ___/___ en total ___/___ por mes ___/___por mes Me puede dar el nombre de otras playas donde han ido con más frecuencia durante este mismo período? C3-1) C3-1) C3-2) ____/___ ___/___ C4-1) C4-1) C4-2) ____/___ ___/___ C5-1) C5-1) C5-2) ____/___ ___/___ C6-1) C6-1) C6-2) ____/___ ___/___ C7-1) C7-1) C7-2) ____/___ ___/___ SENALE SI SE VISITA 2 o + PLAYAS EN EL MISMO VIAJE
C2-3) /___/
C2-3) /___/ C4-3) /___/ C5-3) /___/ C6-3) /___/ C7-3) /___/
TARJETA 1 C8. De la siguiente lista señale las tres actividades que Ud. disfruta más durante un día en la playa: 01 02 03 04 05 06 07 08 09 10 11=otros (especifique)__________________________________________
D. PREGUNTAS SOBRE CONOCIMIENTO Y PERCEPCIONES DE LAS CONDICIONES AMBIENTALES Y SANITARIAS DEL AGUA Ahora, hablemos de problemas de salud en la playa…
219
Cuánto dura de su casa? Horas/ minutos C2-4) ___/___
C2-4) ___/___ C4-4) ___/___ C5-4) ___/___ C6-4) ___/___ C7-4) ___/___
D1. Conoce los riesgos para la salud por nadar en, o ingerir agua contaminada? ___1=SI __ 0=NO Le voy a leer un texto breve sobre este tema…. Cuando se descarga aguas negras sin tratar en áreas costeras, nadar en aguas del mar y ríos puede ser riesgoso para la salud. Las aguas marinas contaminadas por materia fecal pueden causar una variedad de trastornos, entre ellos dolores estomacales, diarrea, tos, resfríos, infecciones, alergias, y posiblemente enfermedades más serias. D2. Según su conocimiento, Ud. o algun miembro de su familia ha sufrido algún trastorno producto de contacto con aguas contaminadas? ___0=Ningún trastorno ___1=Sí en Playa Jacó ___2=Sí en otra playa del país Ahora, le voy a mostrar una manera en que podemos clasificar la calidad de las aguas del mar frente a la playa. Observemos y leamos la información. MAR - CLASIFICACION DE AGUAS D3. En su opinión, cuál clase de calidad en la hoja describe mejor la situación de las aguas del mar frente a Playa Jacó durante este último año? ___1=Clase A
___2=Clase B
___3=Clase C
___99999=NS/NR
RIOS Y ESTEROS - CLASIFICACION DE AGUAS D4. En su opinión, cuál clase de calidad en la hoja describe mejor la situación de las aguas de los ríos y esteros frente a Playa Jacó durante este último año? ___1=Clase 1
___2=Clase 2
___3=Clase 3
___99999=NS/NR
POZOS - CLASIFICACION DE AGUAS D5. En su opinión, cuál clase de calidad en la hoja describe mejor la situación de las aguas de pozos y subterraneas en Playa Jacó durante este último año? ___1=Clase I
___2=Clase II
___3=Clase III
___99999=NS/NR
D6. En su opinión cuál de los siguientes grupos cree Ud. es la fuente de aguas negras más grande en Playa Jacó, actualmente?
220
*****ROTAR (PONGA UN X EN LA CAJA DONDE EMPIEZA A LEER - AVANZA UNA CAJITA POR CADA ENTREVISTA ): ___ ___ ___ ___ ___ ___1= habitantes ___2=visitantes ___3=oficinas ___4=agricultura ___5=comercio públicas ___99999=NS/NR E. PREGUNTAS DE VALORACION Ahora, le voy a dar una información sobre la zona… Estudios realizados en esta zona indican que la contaminación fecal es producto de la descarga de aguas negras al suelo, a los ríos, esteros o directamente al mar sin un tratamiento adecuado. En Playa Jacó las aguas subterraneas están tan cerca a la superficie que los tanques sépticos pueden desbordarse cuando hay fuertes lluvias. La saturación del suelo facilita el paso del contaminante fecal por las aguas subterraneas a los ríos, esteros y al mar. Por eso los tanques sépticos no pueden proteger la calidad de las aguas de ríos, esteros y del mar en Playa Jacó. La contaminación de las aguas subterráneas afecta al agua de pozo pero generalmente no la de cañería cuya fuente queda alejada de la comunidad MAPA 1 Ahora, en este mapa Ud. puede observar la clasificación de la calidad de los aguas en Playa Jacó según un estudio de 1997... • La calidad de las aguas del mar se clasifican éste año como aptas para la natación durante todo el año o sea Clase A. • La de los ríos y esteros se clasifica como no aptas para contacto humano durante todo el año o sea Clase 3. • Se detecta contaminación fecal en aguas subterraneas, pero el agua de pozos todavía sigue potable o sea Clase II. E1. En comparación con lo que sabía antes de esta entrevista, la contaminación por aguas negras en Playa Jacó que acaba de ver es…(lea alternativas)...de lo que creía? ____1. mucho menos ____2. menos ___3. parecida ___4. más ___5. mucho más REPITA LA PREGUNTA PERO LEYENDO ALTERNATIVAS AL REVES
Ahora, con el crecimiento futuro de la comunidad de Playa Jacó y el aumento del turismo, la cantidad de contaminación fecal aumentaría y la calidad de las aguas subterráneas, de los ríos y del mar se podría ver deteriorada. En lo siguiente le voy a mostrar una posible situación en Playa Jacó a un plazo de cinco años si no se toma ninguna medida.
221
MAPA 2 Y COMPARA CON MAPA 1 En esta situación futura… • La calidad de aguas del mar se vería deteriorada a ser no aptas para la natación durante todo el año (clase C). • Las aguas de los ríos y esteros seguirían siendo no aptas para contacto humano (Clase 3). • El agua subterránea y de pozo ya no es potable debido a contaminación fecal (Clase III) E2. Después de haber visto los mapas, Ud. está o no está de acuerdo con la posibilidad de la situación a cinco años plazo si no se toma medidas? ___1=SI ___0=NO => E3. Porqué no está de acuerdo con la información presentada? (especifique)________________________________________ ___99999=NS/NR ________________________________________ E4.
Visitaría a Playa Jacó en 5 años si la calidad de las aguas fuera como ilustrada en mapa 2?
______0=Si con la misma frecuencia que este año
___1=Si pero menos frecuentemente que este año
___2=No
Ahora, hablemos de posibles soluciones al problema de la contaminación fecal en Jacó…. En Playa Jacó un sistema de alcantarillado sanitario o cloacas sustituiría al sistema actual de tanques sépticos. Con este sistema de alcantarillado sanitario las aguas negras del hogar son llevadas por tuberías a un lugar de tratamiento lejos de su casa. Después del tratamiento las aguas pueden ser devueltas limpias a los ríos o al mar. Al llevar y tratar las aguas negras de su hogar, el sistema de alcantarillado sanitario tendría tres beneficios que se ilustran en el siguiente mapa: MAPA 3 - SITUACION CON MEDIDAS - COMPARA CON MAPA 2 1) mantendría la calidad de las aguas del mar para que sean aptas para la natación todo el año 2) mejoraría la calidad de las aguas de los ríos y esteros para que sean aptas para contacto humano todo el año. 3) mejoraría la calidad de las aguas subterráneas para que el agua de pozo sea siempre potable
222
E5. Cuál de los tres beneficios del sistema de alcantarillado es el más importante para su hogar? ___1. mar apto para la natación
___2. ríos y esteros aptos para el contacto humano
___4. Todos son igualmente importantes
___99999= NS/NR
___ 3. agua de pozo potable (acuerde que no se refiere al agua de cañería ) LEAN 1-3 SOLAMENTE 4 SOLO SI INSISTE
Para realizar el sistema se encargaría a la Municipalidad como institución responsable . El dinero necesario para construir el sistema de alcantarillado se podría conseguir fuera de la comunidad. Sin embargo, para operar y mantener el sistema la Municipalidad necesitaría un aporte mensual por parte de los pobladores y los visitantes. E6. En su próxima visita, si hubiera un peaje voluntario por persona a la entrada de Playa Jacó para apoyar un sistema de alcantarillado y mejorar la calidad de sus aguas dulces y marinas, pagaría o no pagaría Ud. ? ___1= no pagaría un aporte voluntario => PASE POR FILTRO A PREGUNTA E13 ___2= pagaría un aporte voluntario ___99999= NS/NR => PASE POR FILTRO A PREGUNTA E13 FILTRO : SI RESPONDIO “EN FAVOR” A PREGUNTA E6 LEA LO SIGUIENTE Y SIGUE CON PREGUNTA E7 Ahora, en las siguientes preguntas tenga presente que Ud. ya paga para otros servicios públicos y que puede visitar las otras playas que mencionó al incio de la entrevista. Recuerde también que al pagar un peaje debería reducir el presupuesto de su estancia por un monto equivalente. E7. Si en el peaje voluntario le piden 1000 colones por adulto para las mejoras en la calidad de las aguas en Playa Jacó, estaría personalmente dispuesto a contribuir ese monto? Recuerde que estamos comparando las mejoras entre la situación en cinco años si no se toma ninguna medida (Mapa 2) y la situación si se hace el sistema alcantarillado (Mapa 3). SI NECESARIO REPITA TODA LA PREGUNTA ___1=SI => PASE A E8 ___0=NO ___99999=NS/NR => PASE A E9
223
FILTRO : SI RESPONDIO “SI” EN PREGUNTA E7 E8. No se sabe con certeza los costos de operar y mantener el sistema de alcantarillado. Si en el peaje voluntario le piden 1500 colones por adulto para las mejoras en la calidad de las aguas en Playa Jacó, estaría personalmente dispuesto a contribuir ese monto? ___ 1=SI => PASE POR FILTRO A PREGUNTA E10 ___ 0=NO ____99999=NS/NR
FILTRO : SI RESPONDIO “NO” EN PREGUNTA E7 E9. No se sabe con certeza los costos de operar y mantener el sistema de alcantarillado. Si en el peaje voluntario le piden 500 colones por adulto para las mejoras en la calidad de aguas en Playa Jacó, estaría personalmente dispuesto a contribuir ese monto? ___ 1=SI => PASE POR FILTRO A PREGUNTA E10 ___ 0=NO ____99999=NS/NR => PASE POR FILTRO A PREGUNTA E13 FILTRO A E10: SI RESPONDIO “SI” A PREGUNTAS E7, E8 o E9 LEA LO SIGUIENTE Y HAGA PREGUNTAS E10-E12 Ahora, le voy a leer unas opiniones que algunas personas nos han dado acerca de pagar para mejoras en la calidad de aguas. Ud. puede usar esta tarjeta para responder a ellas diciendome para cada frase si está “muy de acuerdo”, “algo de acuerdo”, “algo en desacuerdo”, o “muy en desacuerdo”. TARJETA 2 EN PREGUNTAS E10-E12 E10. “El apoyar las mejoras en la calidad de aguas dulces y marinas vale más para mi que (lea monto más alto de E7-E9 que recibio un “SI”) colones por visita. ___1. muy de acuerdo
___2. algo de acuerdo
___3.algo en desacuerdo
224
___4. muy en desacuerdo
___99999. NS/NR
E11. “Tomando en cuenta mi ingreso y el costo de la estancia en Playa Jacó (lea monto más alto de E7-E9 que recibio un “SI”) es lo máximo que podría pagar para apoyar las mejoras en la calidad de las aguas .” ___1. muy de acuerdo
___2. algo de acuerdo
___3.algo en desacuerdo
___4. muy en desacuerdo
___99999. NS/NR
E12. “Yo hubiera podido pagar más que (lea monto más alto de E7-E9 que recibio “SI”) colones por visita, pero considero que no es la responsabilidad del visitante pagar para obtener las mejoras en la calidad de las aguas.” => PASE A SECCION F. ___1. muy de acuerdo
___2. algo de acuerdo
___3.algo en desacuerdo
___4. muy en desacuerdo
___99999. NS/NR
FILTRO A E13: SI RESPONDIO “EN CONTRA” o “NS/NR” EN PREGUNTA E6 “NO” o “NS/NR” EN PREGUNTA EN PREGUNTA E9 LEA LO SIGUIENTE Y HAGA PREGUNTAS E13 - E16 Ahora, le voy a leer unas opiniones que algunas personas nos han dado acerca de pagar para mejoras en la calidad de aguas. Ud. puede usar esta tarjeta para responder a ellas diciendome para cada frase si está “muy de acuerdo”, “algo de acuerdo”, “algo en desacuerdo”, o “muy en desacuerdo”. TARJETA 2 EN PREGUNTAS E13-E15 E13. “ Las mejoras en la calidad de aguas dulces y marinas no tiene ningún valor para mi persona.” ___1. muy de acuerdo
___2. algo de acuerdo
___3.algo en desacuerdo
___4. muy en desacuerdo
___99999. NS/NR
E14. “Tomando en cuenta mi ingreso y el costo de la estancia en Playa Jacó no tengo las condiciones para apoyar las mejoras en la calidad de las aguas.” ___1. muy de acuerdo
___2. algo de acuerdo
___3.algo en desacuerdo
225
___4. muy en desacuerdo
___99999. NS/NR
E15. “Obtener las mejoras en la calidad de las aguas tiene valor para mi, pero no aceptaría medidas donde cobran al visitante, porque considero que no es nuestra respondabilidad pagar para esto.” ___1. muy de acuerdo
___2. algo de acuerdo
___3.algo en desacuerdo
___4. muy en desacuerdo
___99999. NS/NR
E16. “Obtener las mejoras en la calidad de las aguas tiene valor para mi, pero no aceptaría pagar porque el dinero se desviaría a otros fines que el propio tratamiento de aguas”. ___1. muy de acuerdo
___2. algo de acuerdo
___3.algo en desacuerdo
___4. muy en desacuerdo
___99999. NS/NR
H. PREGUNTAS SOCIOECONOMICAS Antes de terminar la encuesta quisiera hacerle algunas preguntas sobre los miembros de su hogar. H1. ANOTA SEXO DEL RESPONDENTE…..___0=Masculino
___1=Feminino
H2. Cuántos años tiene Ud.?…………………(años)
H3. Cuál es el último grado y año de educación que Ud. ha aprobado ? Primaria --------------- Secundaria------------ Universidad-------------- …o más NR 00 01 02 03 04 05 06 07 08 09 10 11 12 13 14 15 16 17 18 19 …___ 99999
H4. Incluyendo a Ud. cuantas personas viven en su hogar?_______ (número)
H5. Cuantos de ellos no han cumplido 15 años?_________(número)
226
TARJETA 3 H6. Voy a mostrarle una serie de descripciones de su posible estado de empleo. Por favor digame cuál representa mejor su situación actual? Categoría : 01 02
03 04
05
06
07 08
NR 99999
09=Otro (especifique):…………………………………………………… En la siguiente pregunta acuerdese que ésta encuesta es confidencial y anónimo… H7.1 Cuál fue su ingreso efectivamente percibido en el último período de pago(semanal, quincenal o mensual) de este hogar ? Incluye sueldos, salarios, pensiones, alquileres, intereses, rentas, y utilidades de cualquier negocio. Es decir su ingreso total. Ingreso colones______________ por semana / quincena / mes ____99999=NS/NR=> PASE A H7.2 Y USE TARJETA 4
H7.2 Si no conoce el ingreso exacto tal vez me podría dar algo más aproximado. Por favor, indique la categoría general que corresponde a su ingreso total por mes. NR/NS Categoría: 01 02 03 04 05 06 07 08 09 99999 Aqui terminamos! Tiene algun comentario o pregunta que desea hacernos? 1………………………………………………………………………………………… 2.………………………………………………………………………………………… 3.………………………………………………………………………………………… Muchisimas gracias por su valiosa participación en este estudio. DESPIDESE CORTESMENTE
I2. EL INFORMANTE ESTUVO ACOMPAÑADO POR OTROS ADULTOS DURANTE LA ENCUESTA?
___1=SI
___0=NO
227
Annex 2 Jaco households survey (December 1997)
228
VERSION HOGARES 3000 ENCUESTA PRINCIPAL
ESPACIO PARA USO
CONFIDENCIAL
DE LA OFICINA:
IDENTIFICACION - A LLENAR CUANDO SE REALIZA LA ENCUESTA
Encuestador ID no: Fecha: /
/ _
/ ___
Barrio/Manzana no.______/______ Encuesta no.:
Hora que empezó:
/______
/ /
OBS#_______
Hora que terminó:_____/_____
A. PREGUNTAS DE SELECCION DE RESPONDENTE A1. LA CASA ESTA HABITADA POR INQUILINOS(>6 meses) O DUENOS ? SI____ A2. EL RESPONDENTE ES MAYOR A 18 AÑOS? SI____ LEA LA SIGUIENTE INTRODUCCION Buenos días/tardes. Cómo está? Me llamo (muestra identificación). Soy estudiante de la Universidad Nacional y estamos haciendo un estudio sobre aspectos de la calidad de vida en Playa Jacó (SI PREGUNTA MAS RESPONDA: sobre el ambiente y de algunos servicios públicos). No es una encuesta política o religiosa. La entrevista durará unos minutos A3. Ud. es jefe del hogar o participa en la manutención económica de éste hogar? ___SI=> CONTINUA CON LA ENTREVISTA ___NO=> HAGA CITA PARA ENTREVISTAR “JEFE DEL HOGAR” : ……./………..(hora/dìa)
Sus respuestas serán absolutamente confidenciales y su nombre no aparecerá en ninguna parte (anónimo). Estamos entrevistando pocos hogares y su participación en la entrevista es muy importante. Podríamos sentarnos? No hay respuestas correctas o incorrectas. Simplemente piense bien en cada pregunta antes de dar su mejor respuesta.
B. PREGUNTAS DE PRECALENTAMIENTO Y OPINION GENERAL B1. Desde hace cuantos años vive Ud. en Playa Jacó? ……………años B2. Cuáles son los tres problemas más grandes que enfrenta la comunidad de Playa Jacó actualmente? NO SUGIERA RESPUESTA. ESPERE Y ANOTA ___01. Contaminación ___2. Falta de (acceso a ) ___3. Basura inorgánica humana de los ríos o del mar agua potable en la playa o en el agua ___4. Basura orgánica en la __5. Falta de información o ___6. Pobre acceso / malas playa o en el agua rotulación sobre playa carreteras ___7. Condiciones naturales de __8. Condiciones naturales ___9. No hay ninguno la arena de las aguas del mar ___10. Otros (especifique):
229
Ahora, hablemos de las condiciones para el turismo en Playa Jacó …. B3. Si estos problemas se mantienen en Playa Jacó, como hasta hoy, durante los próximos 5 años Ud. cree que el turismo a esta playa va a … ___1=aumentar
___2=mantenerse como hoy en día
___3=disminuir
___99999=NS/NR
Hablemos de la importancia del turismo para su hogar…. B4. Su situación laboral depende o no depende de la llegada de turistas a Playa Jacó? ___1. SI DEPENDE ___0. NO DEPENDE => PASE A C. B5. En qué porcentaje cree que el ingreso total de su hogar depende directa- o indirectamente del turismo? (una aproximación sería suficiente) En porcentaje:______________(0-100%) ___99999=NS/NR C. PREGUNTAS SOBRE USO DE PLAYAS Hablemos ahora del uso que Ud. y su familia dan a Playa Jacó y otras playas donde han ido durante los últimos doce meses (de diciembre 96 hasta hoy). Cuántos veces fueron a (nombre de playa) entre : Nombre de playa: diciembre 96 y marzo 97? abril 97 y hoy? Playa Jacó C1) ____/___ en total o C2) ____/___ en total o ____/___ por mes o ____/___ por mes o ____/___ por semana ____/___ por semana Me puede dar el nombre de otras playas donde han ido C3) A+B+C=____/____ C4) A+B+C=____/____ con más frecuencia durante (para uso de la oficina) (para uso de la oficina) este período ? A. ____/___ en total ___/___ en total B. ____/___ en total ___/___ en total C. ____/___ en total ___/___ en total TARJETA 1 C5. De la siguiente lista señale las tres actividades que Ud. disfruta más durante un día en la playa: 01 02 03 04 05 06 07 08 09 10 11=otros (especifique)__________________________________________
230
D. PREGUNTAS SOBRE CONOCIMIENTO Y PERCEPCIONES DE LAS CONDICIONES AMBIENTALES Y SANITARIAS DEL AGUA Ahora, hablemos de problemas de salud… D1. Conoce los riesgos para la salud por nadar en, o ingerir agua contaminada? ___1=SI __ 0=NO Le voy a leer un texto breve sobre este tema…. Cuando se descarga aguas negras sin tratar en áreas costeras, nadar en aguas del mar y ríos puede ser riesgoso para la salud. Las aguas dulces y saladas contaminadas por materia fecal pueden causar una variedad de trastornos, entre ellos dolores estomacales, diarrea, tos, resfríos, infecciones, alergias, y posiblemente enfermedades más serias. D2. Según su conocimiento, Ud. o algun miembro de su familia ha sufrido algún trastorno producto de contacto con aguas del mar contaminadas? ___0=Ningún trastorno ___1=Sí en Playa Jacó ___2=Sí en otra playa del país D3. Conoce casos de visitantes a Playa Jacó que han sufrido algun trastorno producto de contacto con aguas del mar contaminadas? ___1=SI ___0=NO Ahora, le voy a mostrar una manera en que podemos clasificar la calidad de las aguas del mar frente a la playa , de los ríos y de las aguas subterraneas. Observemos y leamos la información. MAR - TARJETA CLASIFICACION DE AGUAS D4. En su opinión, cuál clase de calidad en la hoja describe mejor la situación de las aguas del mar frente a Playa Jacó durante este último año? ___1=Clase A
___2=Clase B
___3=Clase C
___99999=NS/NR
RIOS Y ESTEROS - TARJETA CLASIFICACION DE AGUAS D5. En su opinión, cuál clase de calidad en la hoja describe mejor la situación de las aguas de los ríos y esteros frente a Playa Jacó durante este último año? ___1=Clase 1
___2=Clase 2
___3=Clase 3
231
___99999=NS/NR
POZOS - TARJETA CLASIFICACION DE AGUAS D6. En su opinión, cuál clase de calidad en la hoja describe mejor la situación de las aguas de pozos y subterraneas en Playa Jacó durante este último año? ___1=Clase I
___2=Clase II
___3=Clase III
___99999=NS/NR
D7. En su opinión cuál de los siguientes grupos cree Ud. es la fuente de aguas negras más grande en Playa Jacó, actualmente? *****ROTAR (PONGA UN X EN LA CAJA DONDE EMPIEZA A LEER - AVANZA UNA CAJITA POR CADA ENTREVISTA ): ___ ___ ___ ___ ___ ___1= habitantes ___2=visitantes ___3=oficinas ___4=agricultura ___5=comercio públicas ___99999=NS/NR
E. PREGUNTAS DE VALORACION Ahora, le voy a dar una información sobre la zona… Estudios realizados en esta zona indican que la contaminación fecal es producto de la descarga de aguas negras al suelo, a los ríos, esteros o directamente al mar sin un tratamiento adecuado. En Playa Jacó las aguas subterraneas están tan cerca a la superficie que los tanques sépticos pueden desbordarse cuando hay fuertes lluvias. La saturación del suelo facilita el paso del contaminante fecal por las aguas subterraneas a los ríos, esteros y al mar. Por eso los tanques sépticos no pueden proteger la calidad de las aguas de ríos, esteros y del mar en Playa Jacó. La contaminación de las aguas subterráneas afecta al agua de pozo pero generalmente no la de cañería cuya fuente queda alejada de la comunidad. E1. Este hogar ha experimentado problemas con el tanque séptico después de lluvias fuertes? ___1=SI ___ 0=NO (O NO TIENE) MAPA 1 Ahora, en este mapa Ud. puede observar la clasificación de la calidad de los aguas en Playa Jacó según un estudio de 1997... • La calidad de las aguas del mar se clasifican éste año como aptas para la natación durante todo el año o sea Clase A. • La de los ríos y esteros se clasifica como no aptas para contacto humano durante todo el año o sea Clase 3. • Se detecta contaminación fecal en aguas subterraneas, pero el agua de pozos todavía sigue potable o sea Clase II.
232
E2. En comparación con lo que sabía antes de esta entrevista, la contaminación por aguas negras en Playa Jacó que acaba de ver es…(lea alternativas)...de lo que creía? ____1. mucho menos ____2. menos ___3. parecida ___4. más ___5. mucho más REPITA LA PREGUNTA PERO LEYENDO ALTERNATIVAS AL REVES Ahora, con el crecimiento futuro de la comunidad de Playa Jacó y el aumento del turismo, la cantidad de contaminación fecal aumentaría y la calidad de las aguas subterráneas, de los ríos y del mar se podría ver deteriorada. Seguidamente le voy a mostrar una posible situación en Playa Jacó a un plazo de cinco años si no se toma ninguna medida.
MAPA 2 Y COMPARA CON MAPA 1 En esta situación futura… • La calidad de aguas del mar se vería deteriorada a ser no aptas para la natación durante todo el año (clase C). • Las aguas de los ríos y esteros seguirían siendo no aptas para contacto humano (Clase 3). • El agua subterranea y de pozo ya no es potable debido a contaminación fecal (Clase III) E3. Después de haber visto los mapas, Ud. está o no está de acuerdo con la posibilidad de la situación a cinco años si no se toman medidas? ___1=SI ___0=NO => E4. Porqué no está de acuerdo con la información presentada? (especifique)________________________________________ _________________________________________________ ___99999=NS/NR Ahora, hablemos de posibles soluciones al problema de la contaminación fecal en Jacó…. En Playa Jacó un sistema de alcantarillado sanitario o cloacas sustituiría al sistema actual de tanques sépticos. Con este sistema de alcantarillado sanitario las aguas negras del hogar son llevadas por tuberías a un lugar de tratamiento lejos de su casa. Después del tratamiento las aguas pueden ser devueltas limpias a los ríos o al mar. Al llevar y tratar las aguas negras de su hogar, el sistema de alcantarillado sanitario tendría tres beneficios que se ilustran en el siguiente mapa:
233
MAPA 3 - SITUACION CON MEDIDAS - COMPARA CON MAPA 2 1) mantendría la calidad de las aguas del mar para que sean aptas para la natación todo el año 2) mejoraría la calidad de las aguas de los ríos y esteros para que sean aptas para contacto humano todo el año. 3) mejoraría la calidad de las aguas subterráneas para que el agua de pozo sea siempre potable
E5. Cuál de los tres beneficios del sistema de alcantarillado es el más importante para su hogar? LEA 1-3 SOLAMENTE, MARCA 4 SOLAMENTE SI INSISTE ___1. mar apto para la ___2. ríos y esteros aptos ___ 3. agua de pozo potable natación para el contacto humano (acuerde que no se refiere al agua de cañería ) ___4. Todos son igualmente ___99999= NS/NR importantes Para realizar el sistema se encargaría a la Municipalidad de Garabito como institución responsable . El dinero necesario para construir el sistema de alcantarillado se podría conseguir fuera de la comunidad. Sin embargo, para operar y mantener el sistema la Municipalidad necesitaría un aporte mensual por parte de los pobladores y el sector turístico. Después de haber visto los mapas con las mejoras en calidad de aguas que podría aportar el sistema ….. E6. Si hubiera una votación en Jacó en favor o en contra de que cada hogar pague una tarifa mensual de alcantarillado para realizar un sistema de alcantarillado y obtener las mejoras en la calidad de las aguas, cómo votaría Ud. ? ___1= en contra una tarifa mensual de alcantarillado => PASE POR FILTRO A E13 ___2= en favor una tarifa mensual de alcantarillado ___99999= NS/NR => PASE POR FILTRO A E13
FILTRO : SI RESPONDIO “EN FAVOR” A PREGUNTA E6 LEA LO SIGUIENTE Y SIGUE CON PREGUNTA E7 EN PAGINA 7
Ahora, en las siguientes preguntas tenga presente que Ud. ya paga para otros servicios públicos. Recuerde también que si paga una tarifa mensual de alcantarillado debe reducir el presupuesto de su hogar cada mes por el mismo monto.
234
E7. Si el costo por hogar para realizar el sistema y obtener las mejoras en la calidad de las aguas en Playa Jacó fuera de 3000 colones por mes , su hogar estaría dispuesto a pagar la tarifa de alcantarillado? Recuerde que estamos comparando las mejoras entre la situación en cinco años si no se toma ninguna medida (Mapa 2) y la situación si se hace el sistema alcantarillado (Mapa 3). SI NECESARIO REPITA TODA LA PREGUNTA ___1=SI => PASE A E8 ___0=NO ___99999=NS/NR => PASE A E9 FILTRO : SI RESPONDIO “SI” EN PREGUNTA E7 E8. No se sabe con certeza los costos de operar y mantener el sistema de alcantarillado. Ahora, si el costo por cada hogar para realizar el sistema y los beneficios en calidad de las aguas fuera de 6000 colones por mes, su hogar estaría dispuesto a pagar la tarifa de alcantarillado? ___ 1=SI ___ 0=NO ___ 99999=NS/NR => PASE POR FILTRO A PREGUNTA E10 FILTRO : SI RESPONDIO “NO” EN PREGUNTA E7 E9. No se sabe con certeza los costos de operar y mantener el sistema de alcantarillado. Ahora, si el costo por cada hogar para realizar el sistema y los beneficios en calidad de las aguas fuera de 1500 colones por mes, su hogar estaría dispuesto a pagar la tarifa de alcantarillado? ___ 1=SI => PASE POR FILTRO A PREGUNTA E10 ___ 0=NO ____99999=NS/NR => PASE POR FILTRO A PREGUNTA E13 FILTRO A E10: SI RESPONDIO “SI” A PREGUNTAS E7, E8 o E9 LEA LO SIGUIENTE Y HAGA PREGUNTAS E10-E12 Ahora, le voy a leer unas opiniones que algunas personas nos han dado acerca de pagar para mejoras en la calidad de aguas. Ud. puede usar esta tarjeta para responder a ellas diciendome para cada frase si está “muy de acuerdo”, “algo de acuerdo”, “algo en desacuerdo”, o “muy en desacuerdo”.
235
TARJETA 2 EN PREGUNTAS E10-E12 E10. “El obtener las mejoras en la calidad de aguas dulces y marinas vale más que (lea monto más alto de E7-E9 que recibio un “SI”) colones por mes, para mi hogar”. ___1. muy de acuerdo
___2. algo de acuerdo
___3.algo en desacuerdo
___4. muy en desacuerdo
___99999. NS/NR
E11. “Tomando en cuenta nuestro ingreso y todos los gastos que tenemos que hacer (lea monto más alto de E7-E9 que recibio un “SI”) colones por mes, es lo máximo que mi hogar podría pagar para obtener las mejoras en la calidad de las aguas.” ___1. muy de acuerdo
___2. algo de acuerdo
___3.algo en desacuerdo
___4. muy en desacuerdo
___99999. NS/NR
E12. “Mi hogar hubiera podido pagar más que (lea monto más alto de E7-E9 que recibio “SI”) colones por mes, pero considero que no es nuestra responsabilidad pagar para obtener las mejoras en la calidad de las aguas.” => PASE A SECCION F. ___1. muy de acuerdo
___2. algo de acuerdo
___3.algo en desacuerdo
___4. muy en desacuerdo
___99999. NS/NR
FILTRO: SI RESPONDIO “EN CONTRA” o “NS/NR” EN PREGUNTA E6 0 “NO” o “NS/NR” EN PREGUNTA E9 E13. Estaría Ud. y/o los miembros de su familia dispuestos a trabajar voluntariamente para construir y mantener el sistema de alcantarillado? ___1=SI => E14. Cuántas horas aportarían al mes? ……… ….(horas) ___0=NO ___99999=NS/NR LEA LO SIGUIENTE Y HAGA PREGUNTAS E15 - E18 EN PAGINA 8 Ahora, le voy a leer unas opiniones que algunas personas nos han dado acerca de pagar para mejoras en la calidad de aguas. Ud. puede usar esta tarjeta para responder a ellas diciendome para cada frase si está “muy de acuerdo”, “algo de acuerdo”, “algo en desacuerdo”, o “muy en desacuerdo”.
236
TARJETA 2 EN PREGUNTAS E15-E18
E15. “Obtener las mejoras en la calidad de aguas dulces y marinas no tiene ningún valor para este hogar.” ___1. muy de acuerdo
___2. algo de acuerdo
___3.algo en desacuerdo
___4. muy en desacuerdo
___99999. NS/NR
E16. “Tomando en cuenta nuestro ingreso y todos los gastos que tenemos que hacer, no tenemos las condiciones para pagar las mejoras en la calidad de las aguas.” ___1. muy de acuerdo
___2. algo de acuerdo
___3.algo en desacuerdo
___4. muy en desacuerdo
___99999. NS/NR
E17. “Obtener las mejoras en la calidad de las aguas tiene valor para este hogar, pero no aceptaríamos medidas que cobren al hogar, porque considero que no es nuestra respondabilidad pagar para esto.” ___1. muy de acuerdo
___2. algo de acuerdo
___3.algo en desacuerdo
___4. muy en desacuerdo
___99999. NS/NR
E18. “Obtener las mejoras en la calidad de las aguas vale algo para este hogar, pero no aceptaríamos pagar porque el dinero se desviaría a otros fines que el propio tratamiento de aguas”. ___1. muy de acuerdo
___2. algo de acuerdo
___3.algo en desacuerdo
___4. muy en desacuerdo
___99999. NS/NR
TODOS F. PREGUNTAS SOBRE PERCEPCIONES DE INSTITUCIONES Ahora, hablemos de quién podría ser mejor para brindar el servicio de alcantarillado en Jacó… F1. Voy a mencionar las instituciones, incluyendo la municipalidad, que podrían hacerse cargo del sistema de alcantarillado. Cuál de ellas sería para Ud. la mejor , o tal vez tiene otra sugerencia ? *****ROTAR (PONGA UN X EN LA CAJA DONDE EMPIEZA A LEER - AVANZA UNA CAJITA POR CADA ENTREVISTA ): ___ ___1= la municipalidad => PASE A PREGUNTA G1 ___ ___2= una asociación comunal y local de acueducto y alcantarillado ___ ___3= el instituto costarricence de acueductos y alcantarillados (AyA) ___ ___4= una empresa privada ___ ___5= otra (especifique) ____99999= no sabe => PASE A PREGUNTA G1 237
Suponga ahora que no es la Municipalidad, sino (institución 2-5 mencionada por respondente) quién se encargaría del sistema de alcantarillo y tratamiento.
F2. Porqué prefiere a (institución mencionada por respondente) en lugar de la Municipalidad? (especifique)……………………………………………………………………………… ……………………………………………………………………………………………….. F3. Pensando en las diferencias entre esta institución y la Municipalidad, quisiera revisar su respuesta sobre cuánto pagaría en tarifa de alcantarillado? ___1=SI => (I)“Ud. dijo que con la Municipalidad estaba dispuesto a pagar (lea monto más alto de E7-E9 que recibio un “SI” ). => (II) “Ud. dijo que no quería contribuir” . LEA (I) O (II) SEGUN EL CASO. ___ 0=NO ___99999=NS/NR =>PASE A PREGUNTA G1
F4. Ahora si fuera (institución 2-5 mencionada por respondente), cuánto sería la tarifa más alta que su hogar estaría dispuesto a pagar por mes para realizar las mejoras en la calidad de aguas? (por mes) Colones por mes ___99999=NS/NR
G. PREGUNTAS SOBRE CONDICIONES SANITARIAS G1 Este hogar tiene pozo? G2. Toman agua del pozo ?
___1=SI ___1=SI
___0= NO=> PASE A G3 ___0= NO
G3. Toman agua de la cañería ? ___1=SI
___0=NO
G4. Hierven o cloran el agua para tomarla?
___1=SI
G5 Cuánto pagan por el servicio de agua potable? ___________colones por mes / trimestre / año G6. Esta casa tiene tanque séptico?
___0=NO
____99999=NS/NR
___1=SI ___0=NO => PASE A H1
G7. Con qué frecuencia limpian el tanque séptico? Cada___________ meses / años. ___99999=NS/NR “ NUNCA”=0 => PASE A H G8. Cuánto paga por el servicio de limpieza? _________colones por limpieza ___99999=NS/NR
238
H. PREGUNTAS SOCIOECONOMICAS Antes de terminar la encuesta quisiera hacerle algunas preguntas sobre los miembros de este hogar. H1. ANOTA SEXO DEL RESPONDENTE…..___0=Masculino
___1=Feminino
H2. De qué nacionalidad es Ud?…………………(especifique) ___1=C.R. ___0=otro H3. Cuántos años tiene Ud.?…………………(años) H4. Cuál es el último grado y año de educación que Ud. ha aprobado ? Primaria --------------- Secundaria------------ Universidad-------------- …o más NR 00 01 02 03 04 05 06 07 08 09 10 11 12 13 14 15 16 17 18 19 …___ 99999
H5. Incluyendo a Ud. cuantas personas viven en su hogar?_______ (número) H6. Cuantos de ellos no han cumplido 15 años?_________(número) TARJETA 3 H7. Voy a mostrarle una serie de descripciones de su posible estado de empleo. Por favor digame cuál representa mejor su situación actual? Categoría : 01 02
03 04
05
06
07 08
NR 99999
09=Otro (especifique):…………………………………………………… En la siguiente pregunta acuerdese que esta encuesta es confidencial y anónimo… H8.1 Cuál fue el ingreso efectivamente percibido en el último período de pago (semanal, quincenal o mensual) de este hogar ? Incluye sueldos, salarios, pensiones, alquileres, intereses, rentas, y utilidades de cualquier negocio. Es decir el ingreso total del hogar. Ingreso colones______________ por semana / quincena / mes ___99999=NS/NR => PASE A PREGUNTA H8.2 Y USE TARJETA 4
H8.2 Si no conoce el ingreso exacto tal vez me podría dar algo más aproximado. Por favor, indique la categoría general que corresponde al ingreso del hogar por mes. NR/NS Categoría: 01 02 03 04 05 06 07 08 09 99999 Aqui terminamos! Tiene algun comentario o pregunta que desea hacernos? 1………………………………………………………………………………………… 239
/___/
2.…………………………………………………………………………………………… 3.…………………………………………………………………………………………… I1. Había escuchado de esta encuesta anteriormente ? ___1=SI
___ 0=NO
Muchisimas gracias por su valiosa participación en este estudio. DESPIDESE CORTESMENTE I2. EL INFORMANTE ESTUVO ACOMPAÑADO POR OTROS ADULTOS DURANTE LA ENCUESTA?
__1=SI
240
___0=NO
Annex 3 Puntarenas households survey (November 1998)
241
VERSION TOTAL
MONTO INICIAL:
PUNTARENAS ENCUESTA PRINCIPAL
ESPACIO PARA USO
CONFIDENCIAL
DE LA OFICINA:
IDENTIFICACION - A LLENAR CUANDO SE REALIZA LA ENCUESTA
Encuestador ID no: Fecha: /
/ _
/ ___
Barrio/Manzana no.______/______ Encuesta no.:
Hora que empezó:
/______
/ /
OBS#_______
Hora que terminó:_____/_____
A. PREGUNTAS DE SELECCION DE RESPONDENTE A1. LA CASA ESTA HABITADA POR 6 MESES O MAS ? A2. EL RESPONDENTE ES MAYOR A 18 AÑOS?
SI____ SI____
Buenos días/tardes. Cómo está? Me llamo (muestra identificación). Soy estudiante de la Universidad Nacional y estoy colaborando con un estudio sobre diferentes aspectos de la calidad de vida en Puntarenas (SI PREGUNTA MAS RESPONDA: sobre el ambiente y de algunos servicios públicos). Con todo respeto le solicito unos minutos para llenar este cuestionario. (Este es mi carné de identificación.) A3. Ud. es jefe del hogar o participa en la mantención económica de éste hogar? ___SI=> CONTINUA CON LA ENTREVISTA ___NO=> HAGA CITA PARA ENTREVISTAR “JEFE DEL HOGAR” : ______/_______(hora/dìa)
Sus respuestas serán absolutamente confidenciales y su nombre no aparecerá en ninguna parte (anónimo). Estamos entrevistando pocos hogares y su participación en la entrevista es muy importante. Podríamos sentarnos? No hay respuestas correctas o incorrectas. Simplemente piense bien en cada pregunta antes de dar su mejor respuesta.
B. PREGUNTAS DE PRECALENTAMIENTO Y OPINION GENERAL Hablemos de la ciudad de Puntarenas, incluyendo a Barranca. B1. Desde hace cuantos años vive Ud. en Puntarenas? _____________años B2. Cuáles son los tres problemas más grandes que enfrenta la comunidad de Puntarenas actualmente? Mencionelos por favor del más importante al menos importante.
242
NO SUGIERA RESPUESTA. ESPERE Y ANOTA SECUENCIA CON 1..2..3 ___01. Contaminación de los ___2. Pobre calidad de / ___3. Pobre recolección de ríos, esteros o del mar acceso a agua potable basura ___4. Contaminación del aire __5. Falta de empleo ___6. Malas carreteras ___7. Falta de servicios de __8. Falta de vivienda ___9. Alcoholismo, atención médica adecuada drogadicción, prostitución ___10. Dengue u otras __11. No hay ninguno ___12. Otro (especifique): enfermedades contagiosas Ahora, hablemos de las condiciones para el turismo y los visitantes en Puntarenas …. B3. Si estos problemas se mantienen en Puntarenas durante los próximos 5 años Ud. cree que el turismo/visitación a Puntarenas va a … ___1=aumentar
___2=mantenerse como hoy en día
___3=disminuir
___99=NS/NR
Hablemos de la importancia del turismo en Puntarenas para su hogar…. B4. Directa- o indirectamente, su situación laboral depende o no depende de la llegada de visitantes ? ___1. SI DEPENDE ___0. NO DEPENDE => PASE A C. B5. En qué porcentaje cree que el ingreso total de su hogar depende directa- o indirectamente del turismo en general? (una aproximación sería suficiente) En porcentaje:______________(0-100%) ___99=NS/NR C. PREGUNTAS SOBRE USO DE PLAYAS Hablemos ahora del uso que Ud. y miembros de su familia dan a las playas de Puntarenas y Doña Ana, así como los ríos y esteros del área durante los últimos doce meses (diciembre 97 hasta hoy). (QUALQUIER ACTIVIDAD RECREATIVA U OCUPACIONAL)
nombre de lugar: C1. Playa de Puntarenas o Doña Ana C2. Río Barranca C3. Estero de Puntarenas
Cuántos veces fueron a (nombre de lugar) entre : diciembre 97 y marzo 98? abril 98 y hoy? en total por mes semanal en total por mes
semanal
___/___
___/___
___/___
___/___ ___/___
___/___
___/___
___/___
___/___
___/___ ___/___
___/___
___/___
___/___
___/___
___/___ ___/___
___/___
TARJETA 1 C4. De la siguiente lista señale las tres actividades que Ud. disfruta más durante un día en la playa: 243
01
2 3 4 5 6 7 8 9 10 11=otros (especifique)__________________________________________ D. PREGUNTAS SOBRE PERCEPCIONES Y CONOCIMIENTO DE LAS CONDICIONES AMBIENTALES Y SANITARIAS DEL AGUA Ahora, hablemos de problemas de salud… D1. Conoce los riesgos para la salud por nadar en, o ingerir agua contaminada? ___1=SI __ 0=NO Le voy a leer un texto breve sobre este tema…. Cuando se descarga aguas negras sin tratar en áreas costeras, nadar en aguas del mar y ríos puede ser riesgoso para la salud. Las aguas dulces y saladas contaminadas por materia fecal pueden causar una variedad de trastornos, entre ellos dolores estomacales, diarrea, tos, resfríos, infecciones, alergias, y posiblemente enfermedades más serias. D2. Según su conocimiento, Ud. o algun miembro de su familia ha sufrido algún trastorno o enfermedad producto de contacto con aguas contaminadas? ___0=Ningún trastorno o enfermedad ___1=Sí en el área de Puntarenas. ___2=Sí en otra playa/río del país D3. Conoce casos de visitantes a Puntarenas que han sufrido algun trastorno producto de contacto con aguas del mar o de ríos contaminados? ___1=SI ___0=NO Ahora, le voy a mostrar una manera en que podemos clasificar la calidad de las aguas del mar frente a la playa , de los ríos, esteros y de las aguas subterráneas. Observemos y leamos la información. MAR - TARJETA CLASIFICACION DE AGUAS D4. En su opinión, cuál clase de calidad en la hoja describe mejor la situación de las aguas del mar frente a Puntarenas/Doña Ana durante este último año? ___1=Clase A
___2=Clase B
___3=Clase C
___99=NS/NR
RIOS Y ESTEROS - TARJETA CLASIFICACION DE AGUAS D5. En su opinión, cuál clase de calidad en la hoja describe mejor la situación de las aguas del Río Barranca durante este último año? ___1=Clase 1
___2=Clase 2
___3=Clase 3
244
___99=NS/NR
D6. En su opinión, cuál clase de calidad en la hoja describe mejor la situación de las aguas del Estero de Puntarenas durante este último año? ___1=Clase 1
___2=Clase 2
___3=Clase 3
___99=NS/NR
SUBTERRANEA/POZO - TARJETA CLASIFICACION DE AGUAS D7. En su opinión, cuál clase de calidad en la hoja describe mejor la situación de el agua subterránea o de pozo en el lugar donde estamos ubicados durante este último año? (acuerdse que no se refiere a agua de cañería en ésta pregunta) ___1=Clase I
___2=Clase II
___3=Clase III
___99=NS/NR
D8. En su opinión quiénes provocan más la contaminación de aguas en Puntarenas actualmente? Me puede mencionar tres sectores que más contaminan ? ESPERE. ANOTA SECUENCIA DE RESPUESTA CON 1..2..3. SI MENCIONA UN NOMBRE DE EMPRESA PREGUNTA QUE ACTIVIDAD ___01. Hogares / ___2. Planta de ___3. Hoteles ___4. Chancheras, ___5. Hospital habitantes tratamiento el Roble y restaurantes gallineras, ganado ___6. Industrias ___7. Ingenios o ___8. Diesel ___09. ___10. Plantas químicas beneficios de café y aceite de Plaguicidas de empacadoras barcos laagricultura ___11.Otro (Especifique)……………………………………………………….. __99=NS/NR
E. ESCENARIO Y VALORACION Ahora, le voy a dar una información sobre la zona de Puntarenas incluyendo a Barranca… Estudios realizados en esta zona indican que la contaminación fecal es producto de la descarga de aguas negras al suelo, al río Barranca, al Estero o directamente al mar sin un tratamiento adecuado. En Puntarenas las aguas subterráneas están tan cerca a la superficie que el acantarillado sanitario y los tanques sépticos pueden desbordarse cuando hay fuertes lluvias o mareas. La saturación del suelo facilita el paso del contaminante fecal por las aguas subterráneas a los ríos, el Estero y al mar. Ahora, la contaminación de las aguas subterráneas puede afectar al agua de pozo privado, pero generalmente no la de cañería porque es tratada para que sea potable antes de llegar a su casa. E1. Este hogar ha experimentado problemas con aguas negras después de lluvias fuertes o mareas altas? ___1=SI ___ 0=NO
245
E2. Dónde caen las aguas negras de éste hogar? ___1. Al tanque séptico ___5. Al Estero
___2. A la cloáca / Alcantarillado sanitario ___6. Al río, o una quebrada
ESPERE RESPUESTA.
___3. Al caño ___4. Zanja abierta o frente a la casa / al suelo (letrina) Alcantarillado pluvial ___7. Otro (especifique) ___99 NS/NR ………………………….
El sector oeste de Puntarenas (el Centro) descarga sus aguas negras sin tratamiento a cloácas que van directamente al Estero. En el sector este de Puntarenas (incluyendo Barranca) hace varios años se construyó la planta de tratemiento El Roble que recoge aguas negras de una tercera parte de las casas de la ciudad. La planta limpia las aguas negras antes de lanzarlas al Estero de Puntarenas. Sin embargo, el crecimiento de la ciudad ha sido tal que hoy en día la planta no puede recibir más aguas negras sin que la calidad de las aguas que se echan al Estero se deteriore. Por eso el sistema de tratamiento que tiene Puntarenas actualmente no podrá proteger la calidad de los diferentes cuerpos de agua en el futuro.
MAPA 1 Ahora, en este mapa Ud. puede observar la clasificación de la calidad de los cuerpos de agua en Puntarenas según estudios de 1997... • La calidad de las aguas del mar se clasifican éste año como aptas para la natación durante todo el año o sea Clase A (en casi toda la playa). • La del Estero se clasifica como no apta para contacto humano durante todo el año o sea Clase 3 y del Río Baranca como no apta durante la época lluviosa o sea Clase 2 . • El agua de pozo es potable, pero hay posibilidad de contaminación por materia fecal en aguas subterráneas alrededor, o sea Clase II. E3. En comparación con lo que sabía antes de esta entrevista, la contaminación por aguas negras en Puntarenas que acaba de ver es…(lea alternativas)...de lo que creía? ____1. menos ___2. parecida ___3. más REPITA LA PREGUNTA PERO LEYENDO ALTERNATIVAS AL REVES Ahora, con el crecimiento futuro de Puntarenas la cantidad de contaminación fecal aumentaría y la calidad de los diferentes cuerpos de agua se podría ver deteriorada. Seguidamente le voy a mostrar una posible situación en Puntarenas a un plazo de cinco años si no se toma ninguna medida.
246
MAPA 2 Y COMPARA CON MAPA 1 En esta situación futura… • La calidad de aguas del mar se vería deteriorada a ser no aptas para la natación durante todo el año (clase C). • Las aguas de los ríos y esteros seguirían siendo no aptas para contacto humano (Clase 3). • El agua de pozo privado ya no es potable debido a contaminación fecal de las aguas subterráneas (Clase III) E4. Después de haber visto los dos mapas, Ud. está o no está de acuerdo con que se puede dar ésta situación a cinco años si no se toman medidas? ___1=SI ___0=NO => E5. Con qué aspectos la información presentada no está acuerdo ? ___99=NS/NR (especifique)………………………………………………………….. ……………………………………………………………… Ahora, hablemos de posibles soluciones al problema de la contaminación fecal en Puntarenas…. En Puntarenas una extensión y mejora del sistema de alcantarillado sanitario y tratamiento sustituiría al sistema actual de letrinas, tanques sépticos y alcantarillado parcial. Con este nuevo sistema las aguas negras de todos los hogares de Puntarenas serán llevadas por tuberías a un lugar de tratamiento alejado de la comunidad. Después del tratamiento las aguas pueden ser devueltas limpias a los ríos, el Estero o al mar. Al llevar y tratar efectivamente las aguas negras de los hogares de Puntarenas, el sistema de alcantarillado sanitario y tratamiento tendría varios beneficios que se ilustran en el siguiente mapa:
MAPA 3 - SITUACION CON MEDIDAS - COMPARA CON MAPA 2 1) mantendría la calidad de las aguas del mar para que sean aptas para la natación todo el año 2) mejoraría la calidad de las aguas de los ríos y esteros para que sean aptas para contacto humano todo el año. 3) mejoraría la calidad de las aguas subterráneas para que el agua de pozo sea potable sin riesgo de contaminación Ahora, veamos los mapas 1, 2 y 3 y hagamos una comparación entre ellos. Comparemos la condición del mar, del Río Barranca, el Estero y las aguas subterráneas usando los símbolos y colores que vimos anteriormente (SENALE TARJETAS ).
247
E6. En su opinión, cuál de estos mapas representa la situación con la mejor calidad de todos los diferentes cuerpos de agua (qué situación preferiría más si pudiera escoger)? => Cuál de los mapas representa la peor calidad de todos los cuerpos de agua (qué situación preferiría menos si pudiera escoger)? Haga la comparación antes de responder. ___Mejor calidad/ ___INTERMEDIO ___Peor calidad/ más preferido menos preferido PONGA NUMERO DEL MAPA EN CASILLA
___99=NS/NR
E7. Cuál de los beneficios del sistema de alcantarillado es el más importante para Ud. ? LEA 1-4 SOLAMENTE, MARQUE 5 SOLAMENTE SI INSISTE ___1. mar frente a la playa ___2. Río Barranca apto ___ 3. Estero de Puntarenas apto para la natación para contacto humano apto para contacto humano ___4. agua subterránea/de ___5. Todos son igualmente ___99= NS/NR pozo potable (no se refiere al importantes agua de cañería ) Para realizar el nuevo sistema se encargaría a la Municipalidad de Puntarenas como institución responsable . El dinero necesario para construir el sistema de alcantarillado se podría conseguir fuera de la comunidad. Sin embargo, para operar y mantener el sistema la Municipalidad necesitaría un aporte mensual por parte de los pobladores y las otras fuentes de aguas servidas. Después de haber visto los mapas con las mejoras en calidad de aguas que podría aportar el nuevo sistema ….. E8. Si hubiera una votación en Puntarenas en favor o en contra de que cada hogar pague una tarifa mensual de alcantarillado para ampliar y mejorar el sistema actual y obtener éstas mejoras en la calidad de las aguas, cómo votaría Ud. ? ___1= en contra de una tarifa mensual de alcantarillado => PASE POR FILTRO E12 ___2= a favor de una tarifa mensual de alcantarillado ___99= NS/NR => PASE POR FILTRO A E12
FILTRO : SI RESPONDIO “A FAVOR” A PREGUNTA E8 => LEA LO SIGUIENTE Y SIGUE CON PREGUNTA E9 ABAJO. -----------------------------------------------------------------------------------------------------------Ahora, en las siguientes preguntas tenga presente que Ud. ya paga para otros servicios públicos. Recuerde también que si paga una tarifa mensual de alcantarillado debe reducir el presupuesto de su hogar cada mes por el mismo monto. CIRCULO SOBRE MONTOS INDICADOS POR HOJA DE CONTROL
248
E9. Si el costo por hogar para realizar el sistema y obtener las mejoras en la calidad de las aguas en Puntarenas fuera de 500 1000 1500 3000 colones por mes , su hogar estaría dispuesto a pagar la tarifa de alcantarillado? Recuerde que estamos comparando las mejoras entre la situación en cinco años si no se toma ninguna medida (Mapa 2) y la situación si se hace el sistema alcantarillado (Mapa 3). SI NECESARIO REPITA TODA LA PREGUNTA ___1=SI => PASE A E10 ___0=NO ___99=NS/NR => PASE A E11 FILTRO : SI RESPONDIO “SI” EN PREGUNTA E9 E10. No se sabe con certeza los costos de operar y mantener el sistema de alcantarillado. Ahora, si el costo por cada hogar para realizar el sistema y los beneficios en calidad de las aguas fuera de 1000 2000 3000 6000 colones por mes, su hogar estaría dispuesto a pagar la tarifa de alcantarillado? ___ 1=SI ___ 0=NO =>PASE A PREGUNTA F1 ___ 99=NS/NR FILTRO : SI RESPONDIO “NO” O “NS/NR” EN PREGUNTA E9 E11. No se sabe con certeza los costos de operar y mantener el sistema de alcantarillado. Ahora, si el costo por cada hogar para realizar el sistema y los beneficios en calidad de las aguas fuera de 250 500 750 1500 colones por mes, su hogar estaría dispuesto a pagar la tarifa de alcantarillado? ___ 1=SI => PASE A PREGUNTA F1 ___ 0=NO ____99=NS/NR => PASE POR FILTRO A PREGUNTA E12
249
FILTRO: SI RESPONDIO “EN CONTRA” o “NS/NR” EN PREGUNTA E8 0 “NO” o “NS/NR” EN PREGUNTA E11
LEA LO SIGUIENTE Y HAGA PREGUNTAS E12 - E15 EN PAGINA 8 Ahora, le voy a leer unas opiniones que algunos entrevistados nos han dado acerca de pagar para mejoras en la calidad de aguas. Para cada frase que le voy a leer digame por favor si está “ de acuerdo” o “ en desacuerdo” con lo que han dicho estas personas.
E12. “Obtener las mejoras en la calidad de aguas dulces y marinas no tiene ningún valor para nuestro hogar.” ___1. de acuerdo ___0. en desacuerdo ___99. NS/NR E13. “Tomando en cuenta nuestro ingreso y todos los gastos que tenemos que hacer, no tenemos las condiciones para pagar las mejoras en la calidad de las aguas.” ___1. de acuerdo ___0. en desacuerdo ___99. NS/NR E14. “Obtener las mejoras en la calidad de las aguas tiene valor para nuestro hogar, pero no aceptaríamos medidas que cobren al hogar, porque considero que no es nuestra respondabilidad pagar para esto.” ___1. de acuerdo ___0. en desacuerdo ___99. NS/NR E15. “Obtener las mejoras en la calidad de las aguas vale algo para nuestro hogar, pero no aceptaríamos pagar porque el dinero se desviaría a otros fines que el propio tratamiento de aguas”. ___1. de acuerdo ___0. en desacuerdo ___99. NS/NR
F. PREGUNTAS SOBRE PERCEPCIONES DE INSTITUCIONES Ahora, hablemos de quién sería mejor para brindar el servicio de alcantarillado en Puntarenas… F1. Voy a mencionar las instituciones, incluyendo la Municipalidad, que podrían hacerse cargo del sistema de alcantarillado. Cuál de ellas sería para Ud. la mejor , o tal vez tiene otra sugerencia? *****ROTAR (PONGA UN X EN LA CAJA DONDE EMPIEZA A LEER - AVANZA UNA CAJITA POR CADA ENTREVISTA ): ___ ___1= la municipalidad => PASE A PREGUNTA F3 ___ ___2= una asociación comunal y local (de acueducto y alcantarillado) ___ ___3= el AyA (Acueductos y alcantarillados ) ___ ___4= una empresa privada ___ ___5= otra (especifique)……………………………..
250
X
____99= NS/NR
=> PASE A PREGUNTA G1
F2. Porqué prefiere a (institución preferida) y no a la Municipalidad? Le voy a leer unas posibles razones. Tal vez tiene otra sugerencia? La (institución preferida) puede lograr…. …LEA ALTERNATIVAS 1-3. ___1. los mismos resultados ___2. mejores ___3. tanto mejores resultados en calidad de agua a un costo resultados en calidad de en calidad de aguas como hacerlo a más bajo agua con el mismo costo un costo más bajo ___4. Otra razón (especifique)………………………………………………………… ………………………………………………………………………………………….. Ahora, algunas personas quieren cambiar su respuesta sobre la tarifa mensual de alcantarillado cuando han tenido la oportunidad de pensar en las ventajas y desventajas que tiene la Municiaplidad (en comparación con su institución preferida). F3. Cuál es el monto más alto que está dispuesto a pagar por mes en tarifa de alcantarillado a (institución preferida) para que se den las mejoras en la calidad de aguas ? (el monto más alto que pagaría sin que Ud. sienta que está gastando demasiado en relación con lo que éstas mejoras realmente valen para su hogar). Colones por mes
___99=NS/NR
G. PREGUNTAS SOBRE CONDICIONES SANITARIAS Y AGUA Ahora le voy a hablar del agua en su hogar…. G1 Cuáles fuentes de agua potable usan en éste hogar? Cuál es el más importante? LEA ALTERNATIVAS. MARCA MAS IMPORTANTE CON (*)=> G1.1 ___1. Agua del tubo ___2. Pozo ___3. Agua en botella
___4. Otros. Especifique……………… …………………………………..
G2. Qué tratamiento dan al agua de consumo antes de tomarla? LEA ALTERNATIVAS ___1. Hervir
___2. Filtrar/reposar
___3. Clorar
G3 Cuánto pagan por el servicio de agua potable? ___________colones por mes (0= no se paga)
___4. No se hace nada
____99=NS/NR
G4. Con el abastecimiento de agua potable que tiene ahora su hogar está ? ___1. satisfecho ___2.no satisfecho (Especifique)………………………………… ___99. NS/NR ……………………………………………………………….
251
Ahora voy a hablar de las condiciones sanitarias de su hogar…. G5. Con qué frecuencia limpian el tanque séptico? Cada___________ meses / años. ___99999=NS/NR NO TIENE=”-” , NUNCA=”0” => PASE A G7 TIEMPO ENTRE LA ULTIMA VEZ Y LA PROXIMA VEZ QUE PIENSAN LIMPIARLO G6. Aproximadamente, cuánto paga por el servicio de limpieza? _________colones por limpieza
___99=NS/NR
G7. Con el sistema sanitario que tiene su hogar ahora está ?…….. ___1. satisfecho ___2. no satisfecho (Especifique)……………………………… ___99. NS/NR ……………………………………………………………. H. PREGUNTAS SOCIOECONOMICAS Antes de terminar la encuesta quisiera hacerle algunas preguntas sobre los miembros de este hogar. H1. ANOTA SEXO DEL ENCUESTADO…..___0=Masculino
___1=Feminino
H2. De qué nacionalidad es Ud? ___1=C.R. ___0=otro (especifique)…………………………. H3. Cuántos años tiene Ud.?_______________(años) H4. Cuál es el último grado y año de educación que Ud. ha aprobado ? Primaria --------------- Secundaria------------ Universidad-------------- …o más NR 00 01 02 03 04 05 06 07 08 09 10 11 12 13 14 15 16 17 18 19 …___
99
H5. Incluyendo a Ud. cuantas personas viven en su hogar?_______ (número) H6. Cuántos personas menores a 15 viven en éste hogar y cuales son sus edades? ANOTA EDADES. NINGUNO MENOR A 15 = “-”
(30 C) Moderado (25-30 C) Fresco ( Por favor describe en detalle:…………………………………………………………. F2. Cuán en serio tomó la pregunta sobre disponibilidad de pago? Muy en serio 1 Algo en serio 2 Nada en serio 3
266
F3. Por favor, anote cualquier otro comentario pertinente a la entrevista……………………………………………………………………………………… ……………………………………………………………………………………
267
Annex 5 Colour coded water quality ladders (Jaco and Puntarenas surveys)
268
Annex 6 Water quality maps (Jaco visitors and households) Map 1 - Jaco Beach, situation today Map 2 - Jaco Beach, possible situation if no measures are taken Map 3 - Jaco Beach, situation with sewerage and waste water treatment (used in visitors’ ‘all waters’ survey version)
269
Annex 7 Water quality maps (Puntarenas households) Map 1 - Puntarenas : situation today Map 2 - Puntarenas : situation in 5 years without measures Map 3 - Puntarenas : situation in 5 years with sewerage and waste water treatment (‘full improvement” version in blue and green) Map 3 - Puntarenas : situation in 5 years with sewerage and waste water treatment (‘partial improvement” version in blue, green and orange)
270
Annex 8 Map of Central Pacific Coast of Costa Rica (Scale: each quadrant 55x55 km)
271
Annex 9 Map of Jaco (Scale: each quadrant 1x1 km)
272
Annex 10 Map of Greater Puntarenas (Scale: each quadrant 1x1 km)
273