Aug 6, 2010 - Purchase [Pur97] examined how different graph drawing .... search questions were not domain-specific. ... servers with a *.net domain name.
Author manuscript, published in "Eurovis 2010, 12th annual Eurographics/IEEE Symposium on Visualization 29(3) (2010) 1173--1182" DOI : 10.1111/j.1467-8659.2009.01683.x
Eurographics/ IEEE-VGTC Symposium on Visualization 2010 G. Melançon, T. Munzner, and D. Weiskopf (Guest Editors)
Volume 29 (2010), Number 3
The Readability of Path-Preserving Clusterings of Graphs Daniel Archambault1,4 , Helen C. Purchase2 , and Bruno Pinaud1,3 1 INRIA
Bordeaux Sud-Ouest, France of Glasgow, United Kingdom 3 CNRS UMR 5800 LaBRI Université de Bordeaux I, France 4 University College Dublin, Clique Research Cluster, Ireland
inria-00471432, version 1 - 6 Aug 2010
2 University
Abstract Graph visualization systems often exploit opaque metanodes to reduce visual clutter and improve the readability of large graphs. This filtering can be done in a path-preserving way based on attribute values associated with the nodes of the graph. Despite the extensive use these representations, as far as we know, no formal experimentation exists to evaluate if they improve the readability of graphs. In this paper, we present the results of a user study that formally evaluates how such representations affect the readability of graphs. We also explore the effect of graph size and connectivity in terms of this primary research question. Overall, for our tasks, we did not find a significant difference when this clustering is used. However, if the graph is highly connected, these clusterings can improve performance. Also, if the graph is large enough and can be simplified into a few metanodes, benefits in performance on global tasks are realized. Under these same conditions, however, performance of local attribute tasks may be reduced. Categories and Subject Descriptors (according to ACM CCS): H.1.2 [Information Systems]: User/Machine Systems—Human Factors; G.2.2 [Discrete Mathematics]: Graph Theory—Graph Algorithms
1. Introduction Many visualization systems have exploited metanodes to improve the readability of graphs. Each metanode places a subset of the nodes and edges inside an opaque node, hiding these details. Edges connecting two metanodes are metaedges. Metanodes can be constructed in a pathpreserving [AMA08] manner which ensures that if a path is visible in the metanode representation, it actually exists in the underlying graph. In this paper, a path-preserving clustering (PPC) is a flat clustering with opaque metanodes that hide graph details but reflect underlying graph connectivity.
volve both attributes and graph topology. Outlying paths to external machines can indicate security leaks in a network. Understanding the connectivity between servers before and during an attack on Internet infrastructure can help a variety of investigators. Also, the central core of ISPs near the centre of a large network is important for administrators. Graph visualization systems often recursively place subgraphs into metanodes, forming a cluster tree or graph hierarchy. Some of this work exploits a pre-existing drawing [EF96, SZG∗ 96, GKN05, vHvW04] while others draw the graph as the user explores the data [EH00, AvHK06, DGDGL07, AMA08]. Many of these systems use attributes [PVP01, Wat06, AMA08]. In our experiment, a PPC corresponds to a two-level, path-preserving graph hierarchy where node attribute values define metanodes. Thus, our experiment, in part, validates many of these representations.
Often, attributes are associated with the nodes or edges of the graph and are used to construct metanodes. In this experiment, attributes are extrinsic information associated with the nodes of the graph that has no explicit relationship to the graph structure. As an example, in a computer network, servers can have a name attribute, but this name does not necessarily have a relationship to network topology.
In this paper, we present a formal user study with the primary research question:
Questions where such clusterings may help are common. In a computer networking scenario [CBB00], tasks often in-
• When do PPCs improve the readability of graphs with attribute values associated with the nodes?
c 2010 The Author(s)
c 2010 The Eurographics Association and Blackwell Publishing Ltd. Journal compilation Published by Blackwell Publishing, 9600 Garsington Road, Oxford OX4 2DQ, UK and 350 Main Street, Malden, MA 02148, USA.
D. Archambault, H. C. Purchase, & B. Pinaud / The Readability of Path-Preserving Clusterings of Graphs
In addition, we ask the secondary research questions: • How does the size of the graph affect these results? • How does graph connectivity affect these results? Overall, we did not find a significant difference when PPCs constructed using node attributes were used. However, if the graph is highly connected, PPCs can improve performance. Also, if the graph is large enough and can be simplified into a few metanodes, benefits in performance on global tasks are realized. Under these same conditions, however, local attribute tasks may have reduced performance.
inria-00471432, version 1 - 6 Aug 2010
2. Related Work In this work, we test PPCs constructed using node attribute values. As such, we divide related work into two sections. Section 2.1 presents related areas of graph hierarchy visualization. Section 2.2 presents experiments that have examined graph readability. 2.1. Graph Hierarchy Visualization A number of techniques have been proposed to visualize a graph and a superimposed hierarchy. These methods group subgraphs recursively into metanodes, forming a hierarchy of coarse graphs. Such techniques can be used to visualize a graph where the nodes have attribute values if nodes of the same value are placed inside the same metanode. A number of techniques have been proposed including: extruding the graph hierarchy into the third dimension [EF96], multi-focal fisheye views where metanodes are expanded and viewed in the context of the entire graph [SZG∗ 96], topological fisheye views where abstract versions of the graph are presented at increasing distances from the focus centre [GKN05], and interactively visualizing hierarchies of small world clusterings [vHvW04]. These systems typically draw the entire graph beforehand and exploit this layout to construct a suitable hierarchy. Steerable techniques draw portions of the graph hierarchy on demand as the user explores the graph, and a number of these approaches have also been suggested in the literature [EH00, AvHK06, DGDGL07, AMA08]. In this experiment, we tested interfaces (like many of the above systems) that render the graph hierarchies using opaque metanodes. However, we only test two-level hierarchies and only allow the participant to click on a metanode to reveal its details. This interaction is the most basic and generally supported in nearly all of the above described systems. 2.2. Graphs Readability Experiments Purchase [Pur97] examined how different graph drawing aesthetic criteria affected the readability of graphs. In this
experiment, the author showed that minimizing bends, minimizing edge crossings, and maximizing symmetry may affect user performance. The experiment provided evidence that the number of edges that cross the shortest path in a graph drawing or the continuity of a path may also affect the readability of a graph drawing. A more recent series of experiments examined other factors influencing graph readability [HEH08]. A first experiment found that users tended to prefer well separated clusters to delineate groups of nodes and that central nodes were more important to the group than exterior ones [HHE06]. Secondly, users tended to follow links that lead, in an Euclidean sense, from a source node towards a target node when following a path [HEH09]. The work of van Ham and Rogowitz [vHR08] suggested clusters sometimes were clarified by placing a few nodes of the cluster on the boundary of a convex polygon. Although all of these works studied the influence of aesthetic criteria on graph readability, none of them examined their effect in a PPC context, as we do in this experiment. However, these results should be considered when drawing all levels of the graph hierarchy. Schaffer et al. [SZG∗ 96] studied the readability of a hierarchically clustered graph using either a fisheye or zoom method for revealing details in clusters. The authors found that the fisheye method was significantly faster and required significantly less interaction. However, they did not find a significant difference in terms of the number of errors made by the participants. Although the experiment did use a graph hierarchy, it was focused on determining if the fisheye technique influenced performance. Wattenberg [Wat06] examined roll-up and selection operations on graphs with node attributes. In his technique, the graph is divided into groups of nodes based on attribute values. Each group is aggregated into a single metanode and the metanodes are laid out in a grid based on attribute value. Through several pilot studies, the author found evidence that the tool could help users spot patterns in attributed graphs. It should be noted however that the pilots were informal and that the technique is not path-preserving. 3. The Experiment To test whether depicting PPCs constructed using node attribute data help in reading graphs, we performed a within subjects experiment. We performed a 2 condition (PathPreserving Clustering (PPC) vs. No Clustering (NC)) × 6 data set × 4 question design. In order to create the six data sets, two large graphs were chosen, one with low connectivity and the other with high connectivity. Small, medium, and large subsets of this data were taken. The experiment interface consisted of one of the conditions, either PPC or NC, and a question on the right side of the screen. The question and condition were visible for the duration of the task. As seen in Figure 1, four radio buttons c 2010 The Author(s)
c 2010 The Eurographics Association and Blackwell Publishing Ltd. Journal compilation
D. Archambault, H. C. Purchase, & B. Pinaud / The Readability of Path-Preserving Clusterings of Graphs
inria-00471432, version 1 - 6 Aug 2010
(a) NC Condition
(b) PPC Condition
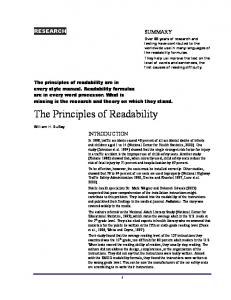
Figure 1: The experiment interface. The question was shown in the upper right corner of the screen. When the participant thought they had the right answer, the participant selected a radio button on the right and clicked valider ma réponse (or “confirm answer”. (a) The NC condition interface on the Internet medium data. (b) The PPC condition interface on the Internet medium data. Both interfaces are showing the same version of question 1 used in the experiment.
appear on the right of the interface. The participants selected a radio button to indicate their answer and confirmed their response by clicking on the button at the bottom of the screen. All experiments were conducted in the same quiet, windowless room and on the same machine. They were conducted individually, with only the participant and the experimenter present. A thirty inch Apple Cinema display was used so that graph elements would be maximally visible. 3.1. Interfaces Interaction was controlled as much as possible in the experiment across conditions. Under both the PPC and NC conditions, the participant could pan the display by holding down the left mouse button and dragging. Likewise, the participant could zoom by scrolling the mouse wheel. c 2010 The Author(s)
c 2010 The Eurographics Association and Blackwell Publishing Ltd. Journal compilation
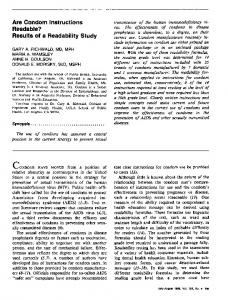
To open metanodes during the PPC condition, the participant clicked on the metanode with the right mouse button. The details of the metanode were shown on a circular, coloured background. When participants clicked with the right mouse button on this background, the metanode would close. Figure 2 shows a metanode before and after it has been opened. When a metanode is closed, it is opaque and hides all details it contains, which is consistent with many existing systems [SZG∗ 96, EH00, vHvW04, GKN05, AvHK06, AMA08]. No other form of interaction was permitted. Focus nodes, in both conditions, were large, black hexagons or pentagons. They were used to indicate the node or the pair of nodes relevant to the question. In the PPC condition, if either of the focus nodes were present inside a metanode, the outline of the metanode was highlighted with a thick black line. This encoding eliminated any additional
D. Archambault, H. C. Purchase, & B. Pinaud / The Readability of Path-Preserving Clusterings of Graphs
(a) Closed Metanode
(b) Open Metanode
Figure 2: Open/closed metanodes in the experiment. (a) The gold metanode is closed. (b) The gold metanode is open.
inria-00471432, version 1 - 6 Aug 2010
cognitive cost of searching for nodes or reading labels. To help the participant find the focus nodes quickly, focus nodes were made significantly larger than other nodes in the graph. Colours encoded attribute values under both conditions of the experiment. Four colours were used: red, blue, purple, and gold. This colouring scheme was used for both nodes and metanodes and participants were notified that metanodes contained only nodes of that colour. 3.2. Data Sets Two data sets were used in this experiment: Internet and IMDB. We took subsets of this data to make graphs of three sizes with consistent connectivity properties. Only three sizes of data were chosen so that we could explore the effect of graph size, but still have the experiment last a reasonable amount of time. The participants were not made aware of what Internet and IMDB actually represented. While it would be interesting to investigate the readability of graphs within the context of real-world domains, our research questions were not domain-specific. Thus, there was no need for the domain to play a role. We simply chose two data sets each of realistic size and structure. For the NC condition, the graph without metanodes was drawn with a force-directed algorithm [FLM95] that took node size into account. For the PPC condition, the contents of each metanode were drawn independently and then the metanode level above was drawn with the same forcedirected algorithm. These layouts were controlled for all versions of the questions in the experiment. 3.2.1. Internet Internet is a scan of the major servers on the Internet backbone performed in 2005 by the Internet mapping project [CBB00]. Nodes are servers and an edge exists if two servers exchanged packets. In order to generate our graphs, we chose three subsets of Internet. Starting from the set of servers whose name contains the string Bordeaux, we added all nodes and edges distance four, six, and eight from these servers in a graph theoretic sense. We denote these data sets: Internet small
consisting of 215 nodes 281 edges, Internet medium consisting of 745 nodes and 955 edges, and Internet large consisting of 3,351 nodes 4,083 edges. The number of edges in this data set is relatively low compared to the number of nodes with the ratio of edges to nodes ranging from 1.21 to 1.31. Thus, we term these data sets “low connectivity” data. A two-level graph hierarchy was constructed on top of this data set. The first level replaces connected components of the same attribute by metanodes while the second level is the contents of the metanodes. In both conditions, nodes are coloured according to attribute. The nodes in red correspond to servers with a *.fr name. Next, nodes in blue correspond to servers with a *.net domain name. Nodes in gold have only an IP address recorded. All remaining nodes are coloured purple. Figure 3(a) and 3(b) show the small and large version of this data under the NC and PPC conditions. 3.2.2. IMDB IMDB is the largest connected component of the InfoVis 2007 contest data set [KJKC07]. Nodes are movies, and edges exist between movies if they share an actor. In order to generate our graphs, we chose three subsets of IMDB. First, we randomly removed edges from this data set to reduce its connectivity, improving the overall readability of the data set. Then, from this filtered data set, we selected nodes at distance one or two from movies that won at least three Oscars. IMDB small consists of 78 nodes and 145 edges of movies that are one hop away computed with 70% of the edges randomly removed. IMDB medium consists of 356 nodes and 601 edges of movies at distance one or two computed with 80% of the edges randomly removed and 50% of the nodes. IMDB large consists of 434 nodes and 802 edges of movies at distance one or two computed with 80% of the edges randomly removed and 40% of the nodes. The number of edges in this data set is relatively high when compared to the number of nodes with the ratio of edges to nodes ranging from 1.68 to 1.86. Thus, we term this data “high connectivity” data. As in Internet, a two-level graph hierarchy was constructed on top of this data set. In both conditions, nodes are coloured according to attribute. The nodes in red correspond to movies that have a comedy genre. Next, nodes in blue correspond to movies with a drama genre name. Nodes in gold have a thriller genre. The remaining nodes are coloured purple. Figure 3(c) and 3(d) show the small and large version of this data under the PPC and NC conditions.
3.3. Tasks To answer our research questions, we should require the participant to read both global and local structure in a graph with attributes. We would also like to test tasks that c 2010 The Author(s)
c 2010 The Eurographics Association and Blackwell Publishing Ltd. Journal compilation
inria-00471432, version 1 - 6 Aug 2010
D. Archambault, H. C. Purchase, & B. Pinaud / The Readability of Path-Preserving Clusterings of Graphs
(a) Internet Small NC
(b) Internet Large PPC
(c) IMDB Small PPC
(d) IMDB Large NC
Figure 3: Four of the six data sets under the PPC and NC conditions. (a) The NC condition of the small version of Internet. (b) The PPC condition of the large version of Internet. (c) The PPC condition of the small version of IMDB. (d) The NC condition of the large version of IMDB.
are both focused on attributes and underlying graph topology. Four question types (local/attribute, global/attribute, global/topology, local/topology) are therefore needed to investigate our research questions on graphs with both relational structure and node attribute values. Keywords were presented in bold, so that the participant could easily recognize each question. For each of the six data sets, four versions of each question were created with different focus nodes. The four questions were posed in French, but we provide English equivalents in this paper. The relevance of the four questions will be illustrated with reference to the computer network example where each node has an associated machine name. The first question considers the degree of a node with attributes. The question is local, and is primarily an attribute task that depends on graph topology: 1. Which colour is the most connected to the black hexagon? c 2010 The Author(s)
c 2010 The Eurographics Association and Blackwell Publishing Ltd. Journal compilation
In the demonstration session, the participants were explained that colour meant the colour of the original nodes in the graph and not the metanodes. The four different attribute values, represented by each colour, are offered as four possible answers. In our computer networking example, this question relates to understanding server interconnections. The second question is global and purely based on the attribute information present in the graph and did not depend at all on graph topology. This question asked: 2. Which colour is the most present in the graph? The four different attribute values, represented by each colour, are offered as four possible answers. In our computer networking example, this question relates to determining the types of machines at the centre of the network. The third question tests if participants could trace sets of paths through the graph. The question is a global/topology task that depends on attribute information.
D. Archambault, H. C. Purchase, & B. Pinaud / The Readability of Path-Preserving Clusterings of Graphs
3. Which of the following paths is a valid path from the hexagon to the pentagon? Four sequences of colours are offered as possible answers. The maximum length of a sequence used in the experiment is four. Only one sequence exists as a valid sequence of colours from the hexagon to the pentagon. If a sequence contains multiple nodes of the same colour in a row, for example red-red-red-blue-blue-red, the multiple instances of the same colour were collapsed down to a single instance in the answers, red-blue-red. Participants were notified of this property at the beginning of the experiment. This question tests the readability of path-preserving decompositions. In our computer networking example, this question may help in finding outlying paths to strange machines in the network. The final question tests if small cycles of three to five nodes are readable around a node. The question is local and focuses on topology but depends on attribute information.
inria-00471432, version 1 - 6 Aug 2010
4. Which is a valid cycle that contains the hexagon? As above, four sequences of colours are offered as possible answers. The maximum length of a sequence used in the experiment is four. Only one sequence is a valid cycle that contains the hexagon. If a sequence contains multiple nodes of the same colour in a row, they were collapsed down to a single instance in the answers, and participants were made aware of this property. This question tests the readability of path-preserving decompositions. In our computer networking example, this question has similar motivations to question 3, but is more local in nature. We posed multiple choice questions based on the focus nodes, rather than asking the participants to interact with the graphs on the screen. Multiple choice questions were preferable to participant interaction because questions one and two did not require identifying specific nodes. Also, questions three and four would require clicking on a fewer number of nodes in the PPC condition, introducing a bias against the NC condition. 3.4. Experimental Design Before each condition, the interface was demonstrated to the participant. These demonstrations allowed the participants to ask questions, to find out about the experimental tasks, and to see how the answers could be found. The experimental procedure required answering all questions under one condition first followed by all those in the other condition. Therefore, any cognitive shift required to move from one interface to another was incurred only once. We counterbalanced between participants by presenting the NC condition first to even-numbered participants and the PPC condition first to odd-numbered participants. At the end of the experiment, participants were asked to complete a short survey in order to compile preference data. There were twenty-four experimental tasks for each condition: 6 data sets and 4 questions with no time limit imposed
on the tasks. For each participant, this sequence of twentyfour questions was randomized differently for each condition in order to counter the learning effect. Each set of questions was prefixed with a set of six practice questions. These six questions presented each data set once and each question at least once to the participant. Participants were not made aware that these practice questions did not form part of the experiment. Therefore, thirty questions were answered per condition, giving a total of sixty questions. We had four versions of questions 1, 3, and 4 on each data set at our disposal. As each question on each data set is asked at most twice under one condition, once as a practice question and once during the experiment, we ensured that the same version of the question was never asked twice to the same participant. Versions were randomized so that sometimes a particular version of a question was a practice question and sometimes it was used as experimental data. Question 2 was asked as a practice question and as data for one random data set under each condition. Both conditions were rendered using the Tulip framework [Aub03]. For all four questions, participants responded by selecting a radio button with the correct answer and committed their answer with a push button at the bottom of the interface. The radio buttons were labeled with answers as described in section 3.3. Participants typically completed the experiment between sixty and ninety minutes. Twenty-eight subjects (21 male, 7 female) participated in the experiment. 4. Results Our pilot experiments suggested that the size of the graph was an important factor, and that very large graphs would produce a ceiling effect in the data: in very large graphs, the tasks would be so difficult that few participants would get any of the tasks right, and there would be no variation in the data. We subsequently reduced the size of the medium and large data sets of IMDB to the sizes presented in this paper, because of the difficulty that our pilot subjects had with the experiment. We were certain that graph size would have an effect on performance but were not sure to what degree. Also, graph connectivity could possibly influence our results, but again, we were uncertain to what degree. Our analysis was performed in three stages. In the first stage, we consider the effect of our conditions, NC and PPC, on an overall and a per question basis. Section 4.1 presents these results. Subsequently, we examined the effects of size and graph connectivity on an overall and, sometimes, on a per-question basis. Sections 4.2 and 4.3 present these results. A non-parametric, repeated-measures, exact Wilcoxon signed rank test was chosen for our analysis because the data collected was not normally distributed, and we were always comparing only two conditions (NC vs PPC). A standard significance level of α = 0.05 was used to determine statistical significance between conditions. When splitting the data c 2010 The Author(s)
c 2010 The Eurographics Association and Blackwell Publishing Ltd. Journal compilation
D. Archambault, H. C. Purchase, & B. Pinaud / The Readability of Path-Preserving Clusterings of Graphs
PPC
20−19
100
NC
72−63
0
20
40
60
80
100 80 40 20
NC
15−14
0
PPC
29−26
Q4
60
80
NC
25−22
0
PPC
42−41
20
40
60
80 60 40 20
NC
41−37
Q3
100
Q2
100
Q1
0
0
20
40
60
80
100
Overall
PPC
69−68
NC
51−42
PPC
50−47
PPC
0.11−0.083
1.0
NC
0.25−0.17
0.0
0.2
0.4
0.6
0.8
1.0
NC
0.21−0.17
0.0
PPC
0.17−0.17
0.2
0.4
0.6
0.8
1.0
NC
0.15−0.17
0.0
PPC
0.15−0.12
0.2
0.4
0.6
0.8
1.0 0.8 0.6 0.4 0.2
NC
0.19−0.21
0.0
0.0
0.2
0.4
0.6
0.8
1.0
Mean response time (sec.)
PPC
0.23−0.17
NC
0.16−0.17
PPC
0.1−0
Mean error rate
100 60 40 20
NC
44−38
PPC
50−47
1.0
NC
0.21−0.25
PPC
0.11−0.12
0.0
0.2
0.4
0.6
0.8
1.0
PPC
0.12−0.12
0.0
0.2
0.4
0.6
0.8
1.0 0.8
NC
0.14−0.12
Overall, we did not find a significant difference in terms of response time (p = 0.68) or error rate (p = 0.084) as shown in the left-most column of Figure 4.
PPC
40−34
Response time (sec.)
0.2
4.1. NC and PPC
NC
46−40
0
PPC
36−34
Large 80
100 80 60 40 20
NC
31−28
0
0
20
40
60
80
100
Medium
0.4
In all the bar charts presented in this section, a line between bars indicates that a significant difference was found. The mean and median values, separated by a dash, are written below each bar in the chart. Average response time includes all tasks, regardless of their accuracy.
Small
0.6
to consider participant performance on individual questions, graph size and graph connectivity, we applied a Bonferroni correction, reducing the significance level to α = 0.025 for this second-level analysis. When we further divide the data a third time, we reduce the significance level to α = 0.0125.
0.0
inria-00471432, version 1 - 6 Aug 2010
Figure 4: Mean response time and errors, comparing NC to PPC. In this and all subsequent bar charts, lines indicate where significance is found. The mean and median values, separated by a dash, are written below each bar of the chart.
NC
0.23−0.25
PPC
0.23−0.25
Mean error rate Figure 5: Mean response time and errors, comparing NC to PPC, for small, medium, and large data sets.
4.1.1. By Question Subdividing the data by question, we find that for question 2, “Which colour is the most present in the graph?”, NC is significantly faster than PPC (p = 0.002), but PPC produced significantly fewer errors (p = 0.018). A positive correlation of 0.23 (p = 1.6 × 10⁻⁵ ) between time and error indicates that faster response times did not lead to more errors. No other significant difference was found. 4.2. Effect of Graph Size Figure 5 presents the results of our first secondary research question which examined the effect of graph size. Considering only the small data, we found no significant difference in terms of response time or error rate either overall or per question. When analyzing only the medium data, we found that c 2010 The Author(s)
c 2010 The Eurographics Association and Blackwell Publishing Ltd. Journal compilation
the PPC condition produced significantly fewer errors (p = 0.001) with no significant difference in response time. As our questions depend on attributes and topology differently, we divided this data a third time by question to see where the significant difference in error rate was present. Figure 6 shows the results of this analysis. For question 1, the NC condition produced significantly fewer errors (p = 0.002) than PPC. For question 2, PPC produced significantly fewer errors than NC (p = 0.00098). In question 3, PPC produced significantly fewer errors than NC (p = 0.00098). We did not find any significant difference in terms of error rate for question 4. No other significant difference was found. When analyzing only the large data, on question 2, we found that NC was significantly faster than PPC (p = 3.7 ×
D. Archambault, H. C. Purchase, & B. Pinaud / The Readability of Path-Preserving Clusterings of Graphs
100
NC
0
PPC
17−14
20
40
60
80
100 80 40 20
NC
14−13
0
PPC
25−22
Q4
60
80
NC
25−22
0
20
40
60
80 60 40 20 0
Q3
100
Q2
100
Q1
PPC
87−70
NC
64−47
59−43
PPC
55−46
0−0
1.0
NC
0.34−0.5
0.0
PPC
0.2
0.4
0.6
0.8
1.0
NC
0.2−0
0.0
PPC
0.21−0
0.2
0.4
0.6
0.8
1.0 0.8 0.6 0.4 0.2
NC
0.054−0
0.0
0.0
0.2
0.4
0.6
0.8
1.0
Medium mean response time (sec.)
PPC
0.089−0
NC
0.23−0
PPC
0.14−0
Medium mean error rate
4.4. Survey Data Our interviews with the participants revealed that they typically did not find this experiment too difficult and many of them were confident in their answers. The majority of participants reported not spending too much time searching for the focus nodes in the experiment, either the hexagon or the pentagon, and therefore the most of the response time was spent actually reading the graph, as was intended. Overall and on a per question basis, participants tended to prefer the PPC condition. However, for answering question 1, participants were less supportive of it.
60 0
20
40
60 40 20 0
NC
51−42
PPC
49−50
1.0 0.8 0.2
0.4
0.6
0.8
1.0
Mean response time (sec.)
NC
PPC
0.074−0.083 0.11−0.083
0.0
On IMDB, we found no significant difference in terms of response time. However, PPC produced significantly fewer errors than NC globally on this data (p = 0.002). In an attempt to discover where this difference was located, we subsequently divided the data by question but did not find a significant difference in terms of error rate. No other significant difference was found.
PPC
35−32
0.6
On the Internet data, over all questions, there was no significant difference in terms of response time or error rate.
NC
30−29
0.4
We then divided the data by graph connectivity with Internet being low connectivity data and IMDB being high connectivity data. Figure 7 shows these results.
0.2
4.3. Effect of Graph Connectivity
80
100
High
100
Low 80
10−5 ), but there was no significant difference in terms of error rate. No other significant difference was found.
0.0
inria-00471432, version 1 - 6 Aug 2010
Figure 6: Mean response time and errors, comparing NC to PPC, for the medium data sets.
NC
0.31−0.33
PPC
0.19−0.17
Mean error rate Figure 7: Mean response time and errors, comparing NC to PPC, for low and high connectivity data sets. Condition NC PPC No Preference
Overall 4 21 3
Q1 13 14 1
Q2 4 23 1
Q3 5 22 1
Q4 5 19 4
Figure 8: Qualitative preference data: overall and by question. No preference indicates the participant had no preference or felt it depended on the situation/question.
5.1. Which is better: PPC or NC?
Therefore, we cannot claim that either one is better or worse than the other overall. This is a very interesting result: while the intuitions of algorithm designers may be that providing a two-level hierarchy will be useful to the user, this data reveals that this is not necessarily always the case.
When comparing all data for NC to PPC, we did not find significant differences in terms of response time or error rate.
Using PPC for question 2 produced significantly fewer errors than NC, but PPC was significantly slower. A positive
5. Discussion
c 2010 The Author(s)
c 2010 The Eurographics Association and Blackwell Publishing Ltd. Journal compilation
D. Archambault, H. C. Purchase, & B. Pinaud / The Readability of Path-Preserving Clusterings of Graphs
Data Set Internet IMDB
Small |N| |E| 44 42 31 39
Medium |N| |E| 182 183 173 258
Large |N| |E| 1,240 1,279 193 307
inria-00471432, version 1 - 6 Aug 2010
Figure 9: The number of nodes/metanodes and edges presented in the PPC version of each data set. |N| is the number of nodes/metanodes while |E| is the number of edges.
correlation between time and errors suggests that faster answers did not lead to more errors, and therefore the interaction between time and error does not affect these two conclusions. This would indicate that the two-level graph hierarchy helped participants judge the number of nodes of a given attribute value in the graph. As node size was proportional to the number of nodes within a metanode, the larger surface area would have helped the participant judge the colour of the node. Also, the size of the metanode may have provided a good summary of the number of nodes it contains.
5.2. Does the size of the graph make a difference? When dividing the data by size, we did not find a significant difference between the NC and the PPC conditions for the small and large graphs, however, we found that there were significantly fewer errors in the PPC condition for the medium graphs, particularly with questions 2 and 3. As questions 2 and 3 are global questions, one focusing on attributes and the other on topology, it seems that the two-level graph hierarchy helped the participants read global properties of the medium graphs that depend on attributes. It is surprising that the only size effects were found in the medium graphs, rather than at either of the extremes. It is possible that the simplicity of the small graphs meant that the clustering brings no advantage. With larger graphs, if the two-level graph hierarchy is less effective at simplifying the graph into a few large metanodes, performance might degrade. Figure 9 reports the number of nodes and edges at the metanode level of the hierarchy. PPC reduced the number of metanodes in the medium data sets more effectively, possibly improving readability. Question 1 was local, and we found that PPC produced significantly more errors than NC on the medium data. As the question purely depends on local information, it may be the case that the two-level graph hierarchy complicated matters when trying to answer this question. As a design guideline, two-level, path-preserving hierarchies can help performance on global tasks, both in terms of topology and attributes, when the data can be divided into a few large metanodes. However, for local/attribute questions, under these same conditions, it may hinder performance. c 2010 The Author(s)
c 2010 The Eurographics Association and Blackwell Publishing Ltd. Journal compilation
5.3. Does the connectivity of the graph make a difference? In terms of graph connectivity, we found that for high connectivity graphs, the PPC condition produced significantly fewer errors than the NC condition over all tasks. This key result suggests that this type of clustering can help users understand high connectivity data. This finding could be due to the fact that metanodes may simplify a lot of the edge crossings present in the graph, an important factor in improving graph readability [Pur97]. 5.4. Limitations All experiments are limited by their parameters and results are generalizable only within the scope of those parameters. Three sizes of graphs were acquired from real world data sources. The two graphs chosen have different levels of connectivity. We chose a variety of different tasks for reading a graph with attributes, and analyzed our data separately according to these tasks. By highlighting the relevant nodes to the question in black and making them relatively larger, we minimized the effect of visual search. The majority of our participants had a computer science background, but some mathematical knowledge is helpful for these tasks. 6. Conclusion and Future Work In future work, our result suggests that coarsening techniques [AvHK06, AMA08, Arc09, vHWV09], which merge several small metanodes into a few large ones, could provide benefits in terms of graph readability. Similarly, pathpreserving hierarchies recursively coarsen a graph. Our experiment suggests that each level of the hierarchy should contain a small number of large metanodes that are subdivided at lower levels or that deeper hierarchies may provide a benefit. However, in both cases, further study is needed. Most of our questions, following paths, cycles, and adjacency could be adapted for testing multi-level hierarchies. In this experiment, we provide evidence that pathpreserving flat clusterings of graphs do not always help users read a graph with attributes associated with the nodes. Overall, we did not find a significant difference when this type of clustering was used. However, if the graph is highly connected, such a representation can improve performance. Also, if the graph is large enough and can be simplified into a few metanodes, benefits in performance on global tasks are realized. Under these same conditions, however, local attribute tasks may have reduced performance. Acknowledgments We would like the thank the anonymous reviewers for their comments which improved this paper. This work was supported in part by the INRIA Bordeaux Sud- Ouest GRAVITÉ project. Finally, we would like to thank all of the participants who took part in this experiment.
D. Archambault, H. C. Purchase, & B. Pinaud / The Readability of Path-Preserving Clusterings of Graphs
References [AMA08] A RCHAMBAULT D., M UNZNER T., AUBER D.: GrouseFlocks: Steerable exploration of graph hierarchy space. IEEE Trans. on Visualization and Computer Graphics 14, 4 (2008), 900–913. [Arc09] A RCHAMBAULT D.: Structural differences between two graphs through hierarchies. In Proc. of Graphics Interface (2009), pp. 87–94. [Aub03] AUBER D.: Tulip : A huge graph visualization framework. In Graph Drawing Software, Mutzel P., Jünger M., (Eds.), Mathematics and Visualization. Springer-Verlag, 2003, pp. 105– 126. [AvHK06] A BELLO J., VAN H AM F., K RISHNAN N.: ASKGraphView: A large scale graph visualization system. IEEE Trans. on Visualization and Computer Graphics (Proc. Vis/InfoVis ’06) 12, 5 (2006), 669–676.
inria-00471432, version 1 - 6 Aug 2010
[CBB00] C HESWICK B., B URCH H., B RANIGAN S.: Mapping and visualizing the Internet. In Proc. USENIX (2000). www.cheswick.com/ches/map.
L., D ILL J., D UBS S., ROSEMAN M.: Navigating hierarchically clustered networks through fisheye and full-zoom methods. ACM Trans. on Computer-Human Interaction (TOCHI) 3, 2 (1996), 162–188. [vHR08] VAN H AM F., ROGOWITZ B. E.: Perceptual organisation in user-generated graph layouts. IEEE Trans. on Visualization and Computer Graphics (Proc. Vis/InfoVis ’08) 14, 6 (2008), 1333–1339. [vHvW04] VAN H AM F., VAN W IJK J.: Interactive visualization of small world graphs. In Proc. IEEE Symp. on Information Visualization (InfoVis’04) (2004), pp. 199–206. [vHWV09] VAN H AM F., WATTENBERG M., V IEGAS F.: Mapping text with phrase nets. IEEE Transactions on Visualization and Computer Graphics 15, 6 (2009), 1169–1176. [Wat06] WATTENBERG M.: Visual exploration of multivariate graphs. In Proc. of SIGCHI conference on Human Factors in Computing Systems (2006), pp. 811–819.
[DGDGL07] D I G IACOMO E., D IDIMO W., G RILLI L., L IOTTA G.: Graph visualization techniques for web clustering engines. IEEE Trans. on Visualization and Computer Graphics 13, 2 (March/April 2007), 294–304. [EF96] E ADES P., F ENG Q.: Multilevel visualization of clustered graphs. In Proc. Graph Drawing (GD’96) (1996), vol. 1190 of LNCS, Springer-Verlag, pp. 101–112. [EH00] E ADES P., H UANG M. L.: Navigating clustered graphs using force-directed methods. Journal of Graph Algorithms and Applications 4, 3 (2000), 157–181. [FLM95] F RICK A., L UDWIG A., M EHLDAU H.: A fast adaptive layout algorithm for undirected graphs. In Proc. Graph Drawing (GD’94) (1995), vol. 894 of LNCS, pp. 388–403. [GKN05] G ANSNER E., K OREN Y., N ORTH S.: Topological fisheye views for visualizing large graphs. IEEE Trans. on Visualization and Computer Graphics 11, 4 (2005), 457–468. [HEH08] H UANG W., E ADES P., H ONG S.: Beyond time and error: a cognitive approach to the evaluation of graph drawings. In BELIV ’08: Proc. of the 2008 conference on BEyond time and errors (2008), pp. 1–8. [HEH09] H UANG W., E ADES P., H ONG S.: A graph reading behaviour: Geodesic-path tendency. In Proc. of the 2nd Pacific Visualization Symposium (2009), pp. 137–144. [HHE06] H UANG W., H ONG S., E ADES P.: How people read sociograms: a questionnaire study. In APVis ’06: Proc. of the 2006 Asia-Pacific Symposium on Information Visualisation (2006), pp. 199–206. [KJKC07] K OSARA R., JANKUN -K ELLY T. J., C HLAN E. (Eds.):. IEEE InfoVis 2007 Contest: InfoVis goes to the movies (2007). www.apl.jhu.edu/Misc/Visualization/index.html. [Pur97] P URCHASE H. C.: Which aesthetic has the greatest effect on human understanding? In Proc. of the 5th International Symp. on Graph Drawing (1997), vol. 1353, Springer-Verlag, pp. 248– 261. [PVP01] PATTISON T., V ERNIK R., P HILLIPS M.: Information visualization using composable layouts and visual sets. In Proc. of the 2001 Asia-Pacific Symp. on Information Visualization (2001), pp. 1–10. [SZG∗ 96]
S CHAFFER D., Z UO Z., G REENBERG S., BARTRAM c 2010 The Author(s)
c 2010 The Eurographics Association and Blackwell Publishing Ltd. Journal compilation