OCTOBER 2015
KINGFIELD AND LADUE
1125
The Relationship between Automated Low-Level Velocity Calculations from the WSR-88D and Maximum Tornado Intensity Determined from Damage Surveys DARREL M. KINGFIELD Cooperative Institute for Mesoscale Meteorological Studies, University of Oklahoma, and NOAA/OAR/National Severe Storms Laboratory, Norman, Oklahoma
JAMES G. LADUE Warning Decision Training Division, National Weather Service, Norman, Oklahoma (Manuscript received 25 August 2014, in final form 18 April 2015) ABSTRACT The relationship between automated low-level velocity derived from WSR-88D severe storm algorithms and two groups of tornado intensity were evaluated using a 4-yr climatology of 1975 tornado events spawned from 1655 supercells and 320 quasi-linear convective systems (QLCSs). A comparison of peak velocity from groups of detections from the Mesocyclone Detection Algorithm and Tornado Detection Algorithm for each tornado track found overlapping distributions when discriminating between weak [rated as category 0 or 1 on the enhanced Fujita scale (EF0 and EF1)] and strong (EF2–5) events for both rotational and delta velocities. Dataset thresholding by estimated affected population lowered the range of observed velocities, particularly for weak tornadoes while retaining a greater frequency of events for strong tornadoes. Heidke skill scores for strength discrimination were dependent on algorithm, velocity parameter, population threshold, and convective mode, and varied from 0.23 and 0.66. Bootstrapping the skill scores for each algorithm showed a wide range of low-level velocities (at least 7 m s21 in width) providing an equivalent optimal skill at discriminating between weak and strong tornadoes. This ultimately limits identification of a single threshold for optimal strength discrimination but the results match closely with larger prior manual studies of low-level velocities.
1. Background and motivation National Weather Service (NWS) assessments following the 27 April 2011 Southeast tornado outbreak and the 22 May 2011 Joplin, Missouri, tornado found that the population failed to personalize the potential severity of the tornadoes for which they were warned (NOAA 2011a,b). A lack of specific information contained within the warnings to better facilitate risk assessment was cited as a major reason why more public response was not taken. After a number of meetings among government, private, and academic sectors, a plan was formulated to improve impact-based decision support services (IDSS). IDSS is currently the number one goal of the Weather-Ready Nation initiative within the NWS (NWS 2013). This path implies that the NWS
Corresponding author address: Darrel M. Kingfield, 120 David L. Boren Blvd., Ste. 3923, Norman, OK 73072. E-mail:
[email protected] DOI: 10.1175/WAF-D-14-00096.1 Ó 2015 American Meteorological Society
needs real-time guidance on tornado intensity in order to communicate the appropriate threat level in the text of future tornado warnings. However, a limited number of studies exist to help inform decision-making. Thus, the guidance available needs to be greatly expanded to assist forecasters in determining tornado intensity analogous to what is identified by the enhanced Fujita (EF; WSEC 2006) scale. The implementation of the Weather Service Radar 1988-Doppler (WSR-88D) network across the United States provided a new era of observation for thunderstorms and attendant hazards (Burgess et al. 1993; Polger et al. 1994; Brotzge and Donner 2013). For tornado identification, forecasters look for a rapid change in the radial velocity across adjacent beams at the lowest scanning elevation angle from the WSR-88D (around 0.58). This guidance comes from several studies that indicate enhanced differential velocities are present near cloud base at the onset of tornadogenesis, particularly for storms closer to the radar (Brown et al. 1978; Trapp
1126
WEATHER AND FORECASTING
and Davies-Jones 1997; Trapp et al. 1999). Two common metrics employed to quantify these lowest angle velocities are low-level delta velocity (LLDV) and low-level rotational velocity (LLRV). LLDV is the difference between the outbound velocity Vout and inbound velocity Vin as they lie on adjacent radials. LLRV is defined as the mean of the sum of the absolute magnitudes of the minimum velocity Vmin and maximum velocity Vmax: LLDV 5 Vout 2 Vin LLRV 5
and
Vmax 2 Vmin . 2
(1) (2)
A few methods exist to utilize the above metrics to determine a relationship between common radar attributes and tornado intensity. A study by Toth et al. (2013) compared maximum tornado intensity to LLDV values as seen by both the WSR-88D and mobile, nearrange radar. They found a high positive linear correlation of velocity estimates between both platforms and suggest the WSR-88D could be utilized to estimate tornado intensity during an ongoing tornado. LaDue et al. (2012) investigated how high-resolution damage survey information coincides with WSR-88D vortex parameters from 179 volume scans of data across five severe weather days. They found a positive correlation between LLDV and EF rating and combined tornado width with LLDV to generate a power dissipation (i.e., amount of work done on the surface by the tornado) metric that was also positively correlated with userderived calculations of LLDV. Smith et al. (2012a) performed a manual analysis comparing maximum tornado EF rating against both near-storm environmental parameters on a 40-km grid and LLRV values calculated using WSR-88D data. Their analysis of peak LLRV found a strong relationship between rotational velocity and tornado strength across all convective modes. Our motivation was to determine how much skill there is in discriminating between a weak and strong tornado using automated LLDV and LLRV calculations from severe storm algorithms currently fielded with the WSR88D. For this study, we define a weak tornado as being rated EF0 or EF1 and a strong tornado as being rated greater than or equal to an EF2 on the EF scale, similar to the strength thresholds between severe and significant severe in forecast products issued by the Storm Prediction Center. The severe storm algorithms performing these calculations are the Mesocyclone Detection Algorithm (MDA; Stumpf et al. 1998), which provides values of both LLDV and LLRV; and the Tornado Detection Algorithm (TDA; Mitchell et al. 1998), which provides values of LLDV. While MDA and TDA have been in the
VOLUME 30
baseline WSR-88D software for over a decade and the focus of several studies (e.g., Jones et al. 2004; Trapp et al. 2005), there have been several improvements in data quality that warrant an investigation into the recent performance of these algorithms. First, superresolution data (Torres and Curtis 2007) at the split-cut elevations (OFCM 2006) are now operationally implemented and provide a reduction of the effective beamwidth to 1.028 from the legacy 1.388 (Brown et al. 2002, 2005). This implementation allows for vortex signatures to be resolved at longer ranges from the radar as long as they are able to be efficiently sampled by the radar beam. MDA has been redesigned to utilize the superresolution velocity data; however, TDA still uses a recombined version of the WSR-88D base data that degrades the superresolution data back to legacy resolution. Second, a two-dimensional (2D) velocity dealiasing algorithm (2DVDA), originally developed by Jing and Weiner (1993), became the default dealiasing scheme operationally in winter 2013, replacing the predecessor local environment dealiasing (LED) algorithm (Eilts and Smith 1990). Prior evaluations of 2DVDA show improvement in the overall velocity dealiasing (Witt et al. 2009; Kingfield and LaDue 2013; Miller et al. 2013), but the foundational assumption of a relatively uniform wind field with the differences between neighboring gates being less than the Nyquist velocity lowers the confidence of correct dealiasing in isolated, strong shear environments (e.g., mesocyclones). Regardless, preliminary results from Miller et al. (2013) show a higher amount of correctly dealiased features using 2DVDA over LED, which would result in more accurate MDA and TDA detections. Herein, we describe the value of comparing automated calculations of LLDV and LLRV from the WSR88D along a tornado track and the ability of these metrics to discriminate between two classes of tornado intensity. Section 2 specifies the data and techniques employed for this study. Section 3 discusses the results of this study. Section 4 examines the interpretation and operational applicability of the results. We conclude with a synopsis of the work and an outlook for future studies in section 5.
2. Data and methods a. Acquisition and playback The official record of tornado track segments in the United States (i.e., damage swaths grouped by individual tornadoes and county boundaries, hereafter referred to as tornado events) is maintained by the National Climatic Data Center (NCDC) and distributed within
OCTOBER 2015
KINGFIELD AND LADUE
their Storm Data publications and online (NWS 2007). For this study, we used all recorded tornado events in the first four years of nationwide WSR-88D superresolution scanning, from 1 January 2009 to 31 December 2012, which met the following requirements: 1) The event in the database must have been verified by an NWS employee or referenced a damage survey in the event narrative using the EF scale. 2) There must be a start (genesis) and end (dissipation) location on record. 3) The event time period must be at least one volume scan (;4 min) in duration. A data quality requirement was added as a result of the fact that the primary source of information may not be an NWS employee but rather an external entity (e.g., law enforcement, storm chaser, emergency manager, amateur radio, etc.). Because of the uncertain nature as to whether an NWS damage survey was provided, these events (1986 total) were removed from the dataset. A spatial requirement was added to ensure both start and end locations were on record for minute-by-minute tracking. In total, 138 events did not meet the spatial criterion. A temporal requirement was added to ensure the tornado had the potential to be scanned by at least one WSR-88D within range. There were 1667 events that had a recorded duration of less than 4 min and these events were excluded from the dataset. This temporal constraint does eliminate the evaluation of short-lived tornadoes; however, we are currently limited by the operational constraints of the WSR-88D network. From the original 5850 tornado events available, around 65% of the dataset was removed through the above criteria, leaving 2059 events for further analysis. Using the start and end locations of each remaining tornado event, all WSR-88D locations within 300 km of either point had their level-II data requested from the NCDC within a 1-h window around the event time. These level-II data files were replayed at real-time speed through the NWS Radar Product Generator (RPG) software to generate the operational MDA and TDA parameters. Independent testing showed variable detection efficiency at reprocessing speeds faster than real time and real-time processing provides an environment more analogous to NWS operations. In total, 13 135 h of the level-II files were reprocessed, creating 252 039 MDA detections and 21 330 TDA detections.
b. Quality control and data extraction To pair the MDA and TDA detections with an appropriate tornado event, tracks were assembled using the start and end locations on record and assuming a linear connection between the points. To account for spatial and
1127
temporal inconsistencies that can occur with reporting (Witt et al. 1998; Stumpf et al. 1998; Trapp et al. 2006), buffers in space and time were added to assist in the matching process. A temporal window of at least one volume scan (;4 min) was added before and after each event, providing all radars with at least three opportunities to generate MDA and/or TDA detections. To provide an estimate of the tornado location at 1-min intervals, the pathlength was divided by the event duration. At each estimated tornado point, a variable spatial buffer with a radius of 5–7.5 km was added to capture detections not directly collocated with the path on record while minimizing the number of matches from surrounding nontornadic storms during the automated matching process. The number of time steps along the track determined the size of the buffer, with the tornado midpoint being allocated the largest buffer of 7.5 km. The upper bound of the spatial buffer was chosen empirically by manually tracking the centroid velocity maximum for a subset of tornado days initialized using a 5-km-radius window utilized from prior mesocyclone analyses (Burgess and Lemon 1991; Jones et al. 2004). In order for an MDA or TDA detection to be retained for further analysis, it had to fall within the spatial buffer of the estimated point along the track and be generated by the WSR-88D within the 1-min time period associated with that buffer. While the above space–time window will minimize contamination from nontornadic sources, it does not alleviate the issue of a single detection being classified within two (or more) tornado events at the same time. To remedy this issue, we assigned the detection to the tornado event with the highest EF-scale rating. If both tornado events were of equal strength, the detection is paired with the closest event as measured through the Euclidean distance between the detection point and the center of the search window associated with each event. With each recorded tornado event, there is only one documented EF rating for the entire path. As a result, the authors assume the strength on record is the highest rating confidently observed during a survey. To ensure the greatest chance of matching the detections to the strongest segment of the tornado, only the peak values LLDV and LLRV from MDA and TDA were extracted for recording in the final dataset. With this assumption in place, any radar in the dataset had to provide at least two detections from MDA or TDA for a peak value to be extracted. Otherwise, any single detection would by default contain all of the peak values and may not yield a fair comparison with maximum tornado intensity. This strategy also helps to increase the odds that one of the scans has been adequately sampled, largely as a result of a proper amount of beam offset (Wood and Brown 1997).
1128
WEATHER AND FORECASTING
c. Range and height considerations Currently, MDA can assign mesocyclone detections out to 300 km while TDA is limited to a 100-km range from any single WSR-88D. For sampling at longer ranges, radar horizon and aspect ratio issues can affect the detection of low-level rotation (Burgess et al. 1993; Wood and Brown 1997). To address the concerns of identifying a peak low-level signature from MDA, the authors explored three different methods of analysis. The first method involved only using events where the highest LLDV or LLRV was sampled within 100 km of a WSR-88D and removing all events where detections peak beyond 100 km. In this method, all detections within 300 km of any WSR-88D were evaluated through the spatiotemporal matching system defined above. Peak detections were identified independent of range for both MDA and TDA. However, events were only retained when the highest LLDV or LLRV was within 100 km of a WSR-88D. Under this method, we are left with 846 peak detections from MDA and 862 peak detections from TDA that occurred within 100 km. There were 2414 other peak LLRV or LLDV MDA detections that occurred beyond 100 km from the tornado event that were discarded in this analysis. The second method involved only evaluating detections within 100 km and identifying the peak velocity within this range. All MDA and TDA detections beyond this 100-km preprocessing range were removed from consideration. Under this method, 894 peak detections from MDA and 862 peak detections from TDA were retained for further analysis. We end up with more MDA detections because we were retaining more events that span across this 100-km range. For example, suppose the MDA LLDV values are of 15 m s21 at 95 km, 17 m s21 at 98 km, and 20 m s21 at 104 km. Under the first method, the peak detection occurred beyond 100 km and the event was subsequently discarded. Under the second method, we only considered the 15 and 17 m s21 detections and the event was subsequently retained with a peak at 17 m s21. The third method involved using a fixed-height criterion of 2 km for MDA and TDA. In both algorithms, the altitude of the lowest 2D circulation observed was tracked with each subsequent volume scan. All detections with a base altitude above this 2-km threshold were removed from consideration for peak low-level velocity identification. Under this method, we were left with 1183 peak MDA detections and 862 peak TDA detections that occurred below these height thresholds. Furthermore, we varied the height thresholds from 1 to 3 km and while we observed variability, the overall distributions and skill scores observed were fairly similar.
VOLUME 30
As a result of the better sample size of MDA using the fixed-height criterion, the full results of this analysis will be presented here. However, it should be noted that full analyses of the other two methods were also performed and contained similar trends to what will be summarized below in both distribution shape and overall skill. Applying this height criterion alongside the spatiotemporal buffers defined above narrowed the 226 238 MDA detections to 3275 and the 18 346 TDA detections down to 2623 (Fig. 1).
d. Breakdown by convective mode Convective mode can influence not only the severity of attendant hazards but a forecaster’s response to those hazards. This is illustrated by Brotzge et al. (2013), where supercell morphologies accounted for 97% of tornado fatalities, 96% of injuries, and 92% of damage when evaluating all events from 2003 to 2004. In that same period, quasi-linear convective system (QLCS) morphologies only accounted for 1% of tornado fatalities, 3% of injuries, and 6% of damage. Furthermore, QLCS events had lower probabilities of detection and mean warning lead times compared to supercells. Using their study as motivation, we wanted to explore how well strength could be discriminated by MDA and TDA between these two convective modes. Utilizing an updated version of the radar-based convective mode database defined in Smith et al. (2012b), all events had their associated convective mode classified into one of three categories: QLCS, supercell, or other. If an event in our dataset did not match spatially or temporally to their database, it was classified as unknown. A large majority of our initial 2059 tornado events were spawned from supercells (80.4% of all events) with QLCS (15.6% of all events) coming in a distant second. The other category made up roughly 2% of our dataset and was subsequently discarded because of their relatively low sample sizes.
e. Ground truth quality assessment The EF-scale rating system provides an estimate of tornadic wind speeds based on damage seen in the wake of the event. Currently, 26 of the 28 damage indicators (DIs) assessed to assign an EF rating consist of manufactured structures. For each DI, there is a range of degrees of damage (DODs) that a structure could sustain during a tornadic event. Each DOD has a range of estimated wind speeds that forecasters can use as guidance in assigning an EF rating. The overall EF rating for the damage track is assigned using the top EF rating assigned to any DI associated with that track. This assignment method can be subject to errors resulting from 1) the incorrect assignment of a rating to one or more DIs associated with the highest rating or
OCTOBER 2015
KINGFIELD AND LADUE
1129
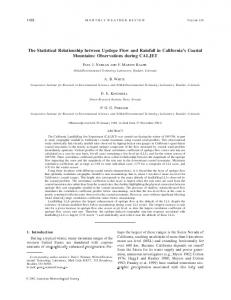
FIG. 1. Maps of detections from (top) MDA and (bottom) TDA. Detections not falling within the spatiotemporal matching window or having a base above 2 km are marked in gray while detections meeting these criteria are in red.
2) inadequate coverage of DIs to document the tornado track. The latter reason likely results in the underestimation of tornado strength because the lack of adequate DIs means there is a greater chance of the strongest portion of a tornado being missed by surveyors, a likely problem that increases as population decreases. In addition, any DI that is
destroyed can only give a lower-bound threshold of the estimated wind speed (Doswell 2003). Even in rural areas containing widespread DIs, most likely they consist of structures that are destroyed by even modestly strong tornadoes, thus denying surveyors the ability to estimate stronger winds.
1130
WEATHER AND FORECASTING
VOLUME 30
FIG. 2. Two examples of tornado tracks (white line) with a 5–7.5-km spatial uncertainty buffer (yellow circles) layered with the gridded LandScan dataset. Cooler (warmer) colors indicate lower (higher) population counts. (a) An EF1 tornado on 9 Jun 2012 with an estimated population of three people. (b) An EF3 tornado on 2 Mar 2012 with an estimated population of 52 192 people.
Under this assumption that tornadoes occurring in low-population areas could yield an underestimate of EF rating, an estimate of affected population was assigned to each tornado event in the dataset. The estimate was evaluated by accumulating the raw population counts within the variable spatial buffer (used in the quality control procedure above) around the track (Fig. 2). The population dataset comes from the LandScan 2008 population distribution grid (Bhaduri et al. 2007). This grid provides an estimate of ambient population (population over a 24-h period) at 1-km2 grid spacing. Minimum population counts of 0, 1000, and 10 000 people were used as exploratory values to threshold which events were retained for data analysis.
f. Evaluating skill at discriminating intensity We were motivated to determine whether any of the peak MDA or TDA low-level velocities has any forecast skill in discriminating tornado strength. To investigate this, we iterated each velocity parameter by 1 m s21, setting that value as the threshold for discriminating between a weak and a strong tornado. Using peak LLDV from MDA as an example, a contingency matrix was built (Table 1) at threshold values between 10 and 80 m s21 in 1 m s21 step increments. For example, assuming a velocity threshold for a strong tornado is 45 m s21, strong tornadoes occurring in the dataset with an LLDV greater than or equal to 45 m s21 would be classified as a hit X. All
OCTOBER 2015
1131
KINGFIELD AND LADUE
TABLE 1. The 2 3 2 contingency table used to forecast a strong tornado by comparing max velocity Vmax against a variable threshold T and EF rating.
TABLE 2. The percentage of weak and strong tornadoes associated with multiple detections from the WSR-88D MDA and TDA broken down by storm mode. QLCS
Observed
Forecast
Yes
No
Yes
X V $ T and EF2–5
Z V $ T and EF0–1
No
Y V # T and EF2–5
W V # T and EF0–1
strong tornadoes with an LLDV less than 45 m s21 would be classified as a miss Y. All weak tornadoes with an LLDV greater than or equal to 45 m s21 would be classified as a false alarm Z. All weak tornadoes with a peak LLDV less than 45 m s21 would be classified as a correct null W. To provide an estimate of the distribution of skill at each threshold, the parameters in the contingency table were resampled at 50 000 iterations using a nonparametric ordinary bootstrap technique (Efron 1979). At each iteration, the Heidke skill score (HSS) is calculated as it provides the fractional improvement (proportion correct) for the forecast over the proportion correct due to random chance when using the specified threshold value to infer a general tornado strength: HSS 5
2(XW 2 YZ) . (X 1 Y)(Y 1 W) 1 (X 1 Z)(Z 1 W)
(3)
3. Results a. Algorithm detection frequency and efficiency From the original 1975 tornado events classified by the convective mode, 1655 were classified as supercell and 320 were classified as QLCS. Around 62.4% of the supercells in our database were associated with weak tornadoes while the remaining 37.6% were associated with strong tornadoes. Weak tornadoes accounted for 81.25% of the QLCS events in our database while the remaining 18.75% were classified as strong tornadoes. Adding a population threshold lowered our supercell (QLCS) datasets down to 1281 (277) and 456 (119) at the respective 1000- and 10 000-person thresholds. With each subsequent threshold, a higher percentage of strong tornadoes were retained for analysis compared to weak tornadoes for both convective modes. For supercell events, 34.0% (23.6%) of strong (weak) tornadoes occurred in areas with an estimated population greater than 10 000 people. For QLCS events at this population threshold, 40.0% (36.5%) of strong (weak) tornadoes were retained. Overall, 65.5% (73.8%)
Weak tornadoes Strong tornadoes
Supercell
MDA
TDA
MDA
TDA
38.1 66.6
22.7 45.5
45.7 66.6
35.2 57.1
of strong (weak) tornadoes occurred with less than 10 000 people affected as estimated within the spatial buffer. This lends supporting evidence to the hypothesis that lower-populated areas are less likely to have higher EF ratings because of the lack of DIs in the region. In both convective modes, a higher percentage of the events associated with strong tornadoes had multiple algorithm detections from both MDA and TDA, allowing for a peak LLDV or LLRV to be extracted (Table 2). A total of 66.6% (57.1%) of strong tornadoes from supercells had multiple MDA (TDA) detections along their tracks compared to 45.7% (35.2%) of weak tornadoes. In addition, 66.6% (45.5%) of strong tornadoes from QLCS modes had multiple MDA (TDA) detections compared to 38.1% (22.7%) of weak tornadoes. From our analysis, 46.4% (56.5%) of supercell events and 56.6% (73.1%) of QLCS events were not tracked by MDA (TDA) even though they were sampled below 2 km two or more times during the tornado life cycle. Similar percentages were observed when the dataset was thresholded by population. The observation that stronger tornadoes, particularly from supercells, are more likely to have multiple algorithm detections along the track for forecaster interpretation could also be due to stronger tornadoes persisting for a longer duration (Brooks 2004). Calculating the mean tornado duration spawned from all QLCS and supercell events in the database yields 7.97 and 12.11 min, respectively. Segmenting out by storm mode and strength, weak tornadoes generated from QLCS modes persisted on average for 7.62 min compared to 9.55 min for strong tornadoes. Weak tornadoes generated from supercells persisted on average for 8.87 min compared to 17.48 min for strong tornadoes. Supercell tornadoes on average persisted for longer durations than did QLCS events, and stronger tornadoes were on the ground on average longer than were their weaker counterparts.
b. Peak low-level velocity by EF rating Binning the peak LLRV and LLDV values by EF rating for QLCS (Fig. 3) and supercell events (Fig. 4) and thresholding by population shows broad regions of overlap between the individual EF ratings. For QLCS
1132
WEATHER AND FORECASTING
VOLUME 30
FIG. 3. Bivariate histograms comparing EF rating and (top) max MDA LLRV, (middle) MDA LLDV, and (bottom) TDA LLDV in 5 m s21 range bins for QLCS events. Shown is the full dataset (left) and only events with at least 10 000 people affected (right) as derived from LandScan imagery. Thresholding by population removes cases almost at random, leaving a distribution with substantial overlapping of low-level velocities across each EF rating.
events, the overall sample size is lower, with no EF4 or EF5 events occurring in our database. Thresholding these events to only include those with an estimated 10 000 people does little to clarify any positive trend between low-level velocity and EF rating. Low-level velocities observed within supercells have a much wider range of values identified across all EF ratings. The overall trend between EF rating and maximum low-level velocity is more positive compared to QLCS events but there is still a substantial amount of overlap. Thresholding the supercell dataset by population narrows the distributions, particularly removing low samples of higher-velocity signatures
associated with weaker tornadoes and lower-velocity signatures associated with stronger tornadoes. For example, the range of MDA LLDV values for supercell EF1 events goes from 10–85 m s21 with no population threshold to 10–65 m s21 when an estimated 10 000 people are affected. These weaker events on record with higher calculated low-level velocities in sparsely populated areas could be indicative of an underestimation in the EF rating due to a low frequency of available DIs for surveying. Even after thresholding by population, wide windows of overlap exist for supercells as well, particularly between EF1 and EF2.
OCTOBER 2015
KINGFIELD AND LADUE
1133
FIG. 4. As in Fig. 3, but for supercell events. Thresholding by population filters out several extreme cases of high low-level velocity associated with lower EF ratings but overlap between individual EF ratings remains clear.
Calculating the bootstrapped skill scores for identifying a strong tornado through a range of low-level velocities from both MDA and TDA shows a broad area of maximum skill across all algorithms and convective modes (Fig. 5). For supercell events, thresholding by population did increase the highest overall skill observed by each algorithm. The 10 000 population dataset performs with a better discrimination skill for a majority of the velocity windows. For QLCS events, the highest skill observed varied by algorithm and population threshold. For events occurring in areas with at least 10 000 people, the best median skill in discriminating between
weak and strong tornadoes associated with supercells occurs when the MDA LLRV is 23 m s21. In a similar vein, the highest HSS for the MDA LLDV is 30 m s21 and the TDA LLDV exhibits a peak HSS at 43 m s21. For QLCSs and a minimum 10 000 population filtering, the peak median HSS for the MDA LLRV, MDA LLDV, and TDA LLDV occurred at 20, 42, and 45 m s21, respectively. At this level of comparison for both convective modes, the MDA LLDV contains several other velocity thresholds that have nearly equivalent skill (,0.05) to the peak threshold. While there are certain distinct peaks of skill observed at specific velocity thresholds, the significant
1134
WEATHER AND FORECASTING
VOLUME 30
FIG. 5. Plots of HSS in the forecast of a strong tornado by convective mode and population threshold at a range of low-level velocity thresholds. The horizontal dashed lines correspond to the peak mean bootstrapped skill achieved. The vertical bars indicate the range of values within the 95% confidence interval. The overlap in the confidence intervals across velocities limits the extraction of a single velocity threshold for optimal tornado strength discrimination.
OCTOBER 2015
KINGFIELD AND LADUE
overlap in the bootstrapped 95% confidence intervals over wide ranges of low-level velocity ultimately provides a higher amount of uncertainty in choosing a single low-level velocity value as guidance in discrimination between a weak and strong tornado. This overlap exists with all WSR-88D algorithms used and these intervals become wider as the sample size decreases with an increasing minimum population threshold. Evaluating the supercell dataset with no population threshold, the range of velocity confidence intervals that overlap the peak median HSS spans from 22 to 29 m s21 for MDA LLRV, 31 to 48 m s21 for MDA LLDV, and 43 to 56 m s21 for TDA LLDV. Within each parameter, there is a range of values greater than or equal to 7 m s21 that could yield the same performance skill of around 35%–38% improvement over random chance depending on the low-level velocity calculation utilized. These ranges become larger with subsequent population thresholding as a result of a lower sample size with each algorithm and, in the case of supercells, also provide a higher percentage improvement in performance skill over random chance.
4. Discussion a. Skill scores This study shows that there is some skill in differentiating weak (EF0 and EF1) from strong (EF2–5) tornadoes using the vortex attributes provided by MDA and TDA for supercells observed at 0–2 km above radar level (ARL). In fact, the HSS results in Fig. 5 for MDA (LLRV and LLDV) or TDA (LLDV) for tornadoes with this storm mode in the highest population category are similar to the findings of others (Stumpf et al. 1998; Mitchell et al. 1998) or exceed still others (WDTB 2002; Jones et al. 2004) in differentiating tornadic versus nontornadic storm-scale vortex signatures measured by the same algorithms. In other words, discriminating weak from strong tornadoes just by using these parameters is at least as skillful as discriminating tornadic from nontornadic vortex signatures. This level of skill exists despite the unknown fraction of MDA and TDA detections that may have been degraded because of radar quality control problems such as improper velocity dealiasing. For QLCS tornadoes, there is much less skill compared to supercells in differentiating between weak and strong tornadoes with any of the MDA or TDA parameters we have studied. This drop in skill originates from the lower sample size of strong tornadoes, with 81.25% of the 320 QLCS tornadoes categorized as weak. This finding may also be a result of the typically smaller
1135
diameters, and shallower maximum extents (Atkins et al. 2004), exhibited by QLCS mesovortices thus limiting the ability of MDA and TDA to extract a strong relationship with tornado intensity. Yet both MDA LLRV and TDA LLDV exhibit well-defined peak HSS values (at 20 and 45 m s21, respectively), suggesting some skill exists to discriminate weak from strong tornadoes. Pursuing a larger sample size of QLCS events should help to narrow down the 95% confidence interval and improve the skill.
b. Radar considerations Certainly the results from this study indicate that forecasters could potentially use the low-level MDA and TDA velocity differences to discriminate weak from strong tornadoes associated with supercells as long as the forecaster is aware of the limitations in determining tornado intensity that include the random variations in beam offset, range limitations, and the imperfections of the ground truth. The random variations of beam offset could be mitigated by taking the maximum observed vortex signature strength (LLDV and LLRV) from MDA or TDA out of more than one low-level scan. Our study imposed a lower limit of two scans with an MDA–TDA detection while Toth et al. (2013) were even more stringent in setting a minimum tornado duration of 20 min, equivalent to five scans of 4-min volume coverage patterns. However, these constraints limit the ability of a forecaster to quickly assess the strength of a tornado and tune the warning message accordingly. Either a forecaster must accept even more uncertainty in estimated vortex strength by using only one scan or wait for longer periods of time in order to gather enough data to take the maximum scan. By then, according to our tornado duration statistics, most tornadoes would have already dissipated, leaving this whole discussion moot from a warning messaging perspective. Increasing sampling frequency helps to mitigate the negative outcome of this constraint. The WSR-88D network has instituted a volume coverage option called Automated Volume Scan Evaluation and Termination (AVSET; Chrisman 2009), where volume scan times can be reduced once the beam exceeds the height of the tallest precipitating cloud. AVSET’s advantage is in its ability to stop scanning at the lowest elevation angle without any precipitation detected, thereby allowing the radar to begin scanning at low levels more quickly. However, since the best relationship between LLRV and LLDV and tornado intensity likely exists close to the radar, AVSET is not likely to significantly reduce the low-level scanning interval instituted when it is needed.
1136
WEATHER AND FORECASTING
Instead, a rapid scan volume coverage pattern called Supplemental Adaptive Intravolume Low-Level Scan (SAILS) has been implemented that allows 2-min scans of the lowest elevation angle (Crum et al. 2013) and perhaps gives a forecaster the ability to choose the maximum strength of LLRV or LLDV from MDA– TDA out of two scans within 4 min. An additional proposed low-level scanning frequency update, called mesoSAILS, would enable the WSR-88D to create lowlevel scans potentially once every minute, allowing for additional improvements to low-level vortex strength diagnoses in real time. While the temporal scanning frequency has improved, range continues to limit the ability for anyone to assess tornado intensity using this method much in the same way that range degrades the strength of vortex signatures shown by Wood and Brown (1997). This has been demonstrated by Smith et al. (2012a), as their relationship between manually derived LLRV and tornado intensity diminished as the beam height exceeded 2.5 km ARL. A fully in-depth investigation into the degradation with range is outside the scope of this study; however, we only sampled tornadoes where the lowest scan was #2 km ARL. Therefore, the results in this paper would not be applicable for any beam height .2 km ARL. No attempts have been made to account for velocity errors due to the differences between air and scatterer motion. While this effect may be more apparent in close proximity mobile radar velocity data (e.g., Burgess et al. 2002; Dowell et al. 2005; Wakimoto et al. 2012), scatterer centrifuging can cause underestimations in peak velocity in WSR-88Ds (Wood et al. 2009). Strong tornadoes are also likely to be associated with more significant reductions in LLRV and LLDV due to more extensive large debris dominating the returned signal relative to weaker tornadoes and thereby weakening the skill in discriminating between weak and strong tornadoes. Finally, there is the question as to whether or not manual estimation of LLRV and LLDV, as is done in Smith et al. (2012a), is an improvement over this automated analysis.
c. Ground truth considerations The quality of the results also depends on the ground truth as Storm Data only provides one EF-scale rating for a tornado track segment; there is no way of precisely attributing an instantaneous LLRV or LLDV from any algorithm output to a tornado intensity at the same time. The peak intensity of a tornado could easily occur at a different time than the peak strength of a vortex signature depicted by radar. Of the few high-resolution surveys documented to date, the maximum EF-scale rating of the tornado has sometimes persisted as the vortex
VOLUME 30
signature strength decreased (LaDue et al. 2012). The reasons for this may have to do with either the contraction of the vortex diameter or the less than optimal viewing angle of a vortex with an asymmetric velocity distribution about its center. Decreasing signature width allows the degradations of range and beam offset to play a bigger role. A more significant finding with respect to Storm Data concerns the positive relationship that exists between the tornado intensity estimations, population, and the peak HSS. As population increases from a no-threshold (no population thresholding applied) to that of 10 000, both the ratio of strong to weak tornadoes, and the peak skill score in discriminating them by WSR-88D, increase. The increased ratio may be simply a reflection of the positive relationship between tornado pathlength and intensity, as found by Brooks (2004). However, the higher peak HSS also suggests that increasing the number of available DIs may also result in more accurate tornado strength assessments, and that increased accuracy often results in tornadoes being rated higher. This is consistent with the proposition by Alexander and Wurman (2008) that tornadoes were systemically rated with lower estimated wind speeds than nearby mobile Doppler radar. Most of the tornadoes in their sample have come from rural areas in the Great Plains, where it is likely there was an insufficient number of DIs available to adequately document their intensity. Thus at this point, we cannot refute our original hypothesis that the quality of the tornado ratings improves with higher population within, and in the vicinity of, the tornado tracks.
5. Conclusions A 4-yr climatology of 1975 tornado events of at least 4-min duration from 2009 to 2012 was compared to peak low-level velocity values from the WSR-88D MDA and TDA measured during each event. These events themselves were categorized from their EF-scale ratings as being either weak (EF0 and EF1) or strong (EF2–5) and grouped by minimum estimated population impacted using ambient population estimates from the LandScan dataset employing exploratory thresholds of 0, 1000, and 10 000 people. Peak algorithm-derived low-level velocity values were extracted from MDA and TDA using a moving window with a variable search radius of 5– 7.5-km spatial resolution and 1-min temporal resolution for all rotational features below a fixed-height threshold of 2 km AGL. From these data, we observed that stronger tornadoes were more likely to have multiple detections from MDA and/or TDA when compared to weak tornadoes. This could be potentially due to the fact that stronger tornadoes
OCTOBER 2015
KINGFIELD AND LADUE
had a longer mean duration compared to weak tornadoes for both supercell and QLCS convective modes. Thresholding by population revealed that a higher number of strong tornadoes occurred and persisted in highly populated areas. It is found that 73.8% of weak tornadoes impacted less than 10 000 people using our spatial population estimates compared to 65.4% of strong tornadoes. Because of the lower population affected, it is possible these weak tornado ratings could have been underestimated as a result of a lack of DIs in the impact area. The significantly increased peak HSS as the minimum 10 000 population threshold was imposed, particularly for supercell tornadoes, supports this contention. Comparing peak values of low-level velocity at discriminating tornado strength showed fluctuating optimal skill with peak HSS values varying by algorithm, population threshold, and convective mode. Thresholding the events by population did improve the overall skill for all three algorithm-derived products for supercell events. For QLCS events, thresholding by population did not generate the highest median skill for every algorithm because of a lower overall sampling frequency and a greatly diminished sample size with each subsequent population threshold. Furthermore, lower sample sizes increase the uncertainty in confidently identifying a single velocity threshold that discriminates best between a weak and a strong tornado. The bootstrapped distributions of QLCS and supercell events in this dataset highlight this uncertainty as the widths of the confidence intervals increase with each subsequent population threshold. With or without population thresholding, all three algorithm-derived velocity calculations applied to both convective modes show a wide range of velocity thresholds that have equivalent skill when discriminating between a weak and a strong tornado. The future holds promise as new strategies and systems are deployed in operations. As of this writing, the AVSET system is fully deployed across the NWS and the first tornado cases utilizing SAILS are being collected at various WSR-88D sites across the nation. Faster and more frequent low-angle scans (around 0.58) with SAILS (and AVSET, depending on the areal coverage and vertical extent of the precipitation) could provide a forecaster with additional opportunities to diagnose rotational features at these levels. In an attempt to mitigate the range issues associated with singleradar detection, gridded analyses of blended multiradar calculations of azimuthal shear (Elmore et al. 1994) at 500-m resolution within the multiradar/multisensor (MR/MS) framework (Lakshmanan et al. 2007) may provide a more representative calculation of low-level velocity compared to automated single-radar metrics of
1137
LLRV and LLDV for circulation identification and tracking. The MR/MS framework is currently in its operational transition to the NWS, with some offices already receiving a subset of the initial operating capability products. Depending on the amount of enhancement azimuthal shear or other velocity diagnostics could have in interrogating rotational features, now may be the time to explore new rotational algorithms to augment the outputs provided by MDA and TDA. Furthermore, the addition of auxiliary short-range boundary layer radar networks could mitigate overshooting the low-level velocity signature and resolution degradation in regions with poor WSR-88D coverage (Committee on Weather Radar Technology Beyond NEXRAD 2002). The Engineering Research Center for Collaborative Adaptive Sensing of the Atmosphere (CASA; McLaughlin et al. 2009) is one entity that is exploring the utility of these shorter-wavelength radars through the operation of dense networks in different parts of the country. A case study analysis of the 13 May 2009 tornado occurring in a CASA network of four X-band radars highlights several benefits of adding information from ancillary radars into warning operations (Mahale et al. 2014). The CASA radars were able to provide very high spatiotemporal updates over the neighboring WSR-88Ds, and the regions of overlapping coverage provided the ability to perform dual-Doppler analyses, allowing for more accurate estimates of true wind speed and vertical vorticity. In addition to future radar enhancements, the quality of damage surveying will need some improvement in order to mitigate spatiotemporal and magnitude estimation errors from propagating into the official record. Further adoption and proper use of geographical information systems and analog guidance tools such as the Damage Assessment Toolkit (Camp 2008) can streamline this process. Together, a more robust dataset of remotely sensed data and ground truth would further improve the benchmarks observed today for application on the storms of tomorrow. Acknowledgments. We thank Bob Lee, Rich Murnan, Jessica Schultz, and Dave Zittel from the Radar Operations Center and Kimberly Elmore from NSSL for their feedback and contributions to this research. The authors also thank Don Burgess, Rich Thompson, and one anonymous reviewer for their feedback that greatly improved the content and structure of the paper. Funding was provided by NOAA/Office of Oceanic and Atmospheric Research under NOAA–University of Oklahoma Cooperative Agreement NA11OAR4320072, U.S. Department of Commerce. The views expressed in this paper are those of the authors and do not necessarily represent those of the NOAA, NSSL, or CIMMS.
1138
WEATHER AND FORECASTING REFERENCES
Alexander, C. R., and J. Wurman, 2008: Updated mobile radar climatology of supercell tornado structures and dynamics. Preprints, 24th Conf. on Severe Local Storms, Savannah, GA, Amer. Meteor. Soc., 19.4. [Available online at https://ams.confex.com/ ams/pdfpapers/141821.pdf.] Atkins, N. T., J. M. Arnott, R. W. Przybylinski, R. A. Wolf, and B. D. Ketcham, 2004: Vortex structure and evolution within bow echoes. Part I: Single-Doppler and damage analysis of the 29 June 1998 derecho. Mon. Wea. Rev., 132, 2224–2242, doi:10.1175/ 1520-0493(2004)132,2224:VSAEWB.2.0.CO;2. Bhaduri, B., E. Bright, P. Coleman, and M. L. Urban, 2007: LandScan USA: A high-resolution geospatial and temporal modeling approach for population distribution and dynamics. GeoJournal, 69, 103–117, doi:10.1007/s10708-007-9105-9. Brooks, H. E., 2004: On the relationship of tornado path length and width to intensity. Wea. Forecasting, 19, 310–319, doi:10.1175/ 1520-0434(2004)019,0310:OTROTP.2.0.CO;2. Brotzge, J., and W. Donner, 2013: The tornado warning process: A review of current research, challenges, and opportunities. Bull. Amer. Meteor. Soc., 94, 1715–1733, doi:10.1175/BAMS-D-12-00147.1. ——, S. E. Nelson, R. L. Thompson, and B. T. Smith, 2013: Tornado probability of detection and lead time as a function of convective mode and environmental parameters. Wea. Forecasting, 28, 1261–1276, doi:10.1175/WAF-D-12-00119.1. Brown, R. A., L. R. Lemon, and D. W. Burgess, 1978: Tornado detection by pulsed Doppler radar. Mon. Wea. Rev., 106, 29–39, doi:10.1175/1520-0493(1978)106,0029:TDBPDR.2.0.CO;2. ——, V. T. Wood, and D. Sirmans, 2002: Improved tornado detection using simulated and actual WSR-88D data with enhanced resolution. J. Atmos. Oceanic Technol., 19, 1759–1771, doi:10.1175/1520-0426(2002)019,1759:ITDUSA.2.0.CO;2. ——, B. A. Flickinger, E. Forren, D. M. Schultz, D. Sirmans, P. L. Spencer, V. T. Wood, and C. L. Ziegler, 2005: Improved detection of severe storms using experimental fine-resolution WSR-88D measurements. Wea. Forecasting, 20, 3–14, doi:10.1175/WAF-832.1. Burgess, D., and L. R. Lemon, 1991: Characteristics of mesocyclones detected during a NEXRAD test. Preprints, 25th Int. Conf. on Radar Meteorology, Paris, France, Amer. Meteor. Soc., 39–42. ——, R. J. Donaldson Jr., and P. R. Desrochers, 1993: Tornado detection and warning by radar. The Tornado: Its Structure, Dynamics, Prediction, and Hazards, Geophys. Monogr., Vol. 79, Amer. Geophys. Union, 203–221. ——, M. A. Magsig, J. Wurman, D. C. Dowell, and Y. Richardson, 2002: Radar observations of the 3 May 1999 Oklahoma City tornado. Wea. Forecasting, 17, 456–471, doi:10.1175/ 1520-0434(2002)017,0456:ROOTMO.2.0.CO;2. Camp, P. J., 2008: Integrating a geographical information system into storm assessment: The southeast Alabama tornado outbreak of 1 March 2007. Preprints, 24th Conf. on Interactive Information Processing Technologies, New Orleans, LA, Amer. Meteor. Soc., P1.4. [Available online at http:// ams.confex.com/ams/pdfpapers/134401.pdf.] Chrisman, J. N., 2009: Automated Volume Scan Evaluation and Termination (AVSET): A simple technique to achieve faster volume scan updates. Preprints, 34th Conf. on Radar Meteorology, Williamsbug, VA, Amer. Meteor. Soc., P4.4. [Available online at https://ams.confex.com/ams/pdfpapers/155324.pdf.] Committee on Weather Radar Technology Beyond NEXRAD, 2002: Weather Radar Technology beyond NEXRAD. National Academy Press Tech. Rep., National Research Council, National Academy of Science, 83 pp.
VOLUME 30
Crum, T., S. D. Smith, J. N. Chrisman, R. E. Saffle, R. W. Hall, and R. J. Vogt, 2013: WSR-88D Radar Projects—Update 2013. Proc. 29th Conf. on Environmental Information Processing Technologies, Austin, TX, Amer. Meteor. Soc., 6B.1. [Available online at https://ams.confex.com/ams/93Annual/ webprogram/Paper221461.html.] Doswell, C. A., III, 2003: A guide to F-scale damage assessment. NOAA/NWS, Silver Spring, MD, 94 pp. [Available online at http://www.wdtb.noaa.gov/courses/ef-scale/lesson2/FinalNWSFscaleAssessmentGuide.pdf.] Dowell, D. C., C. R. Alexander, J. M. Wurman, and L. J. Wicker, 2005: Centrifuging of hydrometeors and debris in tornadoes: Radar-reflectivity patterns and wind-measurement errors. Mon. Wea. Rev., 133, 1501–1524, doi:10.1175/MWR2934.1. Efron, B., 1979: Bootstrap methods: Another look at the jackknife. Ann. Stat., 7, 1–26, doi:10.1214/aos/1176344552. Eilts, M. D., and S. D. Smith, 1990: Efficient dealiasing of Doppler velocities using local environment constraints. J. Atmos. Oceanic Technol., 7, 118–128, doi:10.1175/1520-0426(1990)007,0118: EDODVU.2.0.CO;2. Elmore, K. M., E. D. Albo, R. K. Goodrich, and D. J. Peters, 1994: NASA/NCAR airborne and ground-based wind shear studies. NCAR Final Rep., Contract NCC1-155, 343 pp. Jing, Z., and G. Wiener, 1993: Two-dimensional dealiasing of Doppler velocities. J. Atmos. Oceanic Technol., 10, 798–808, doi:10.1175/1520-0426(1993)010,0798:TDDODV.2.0.CO;2. Jones, T. A., K. M. McGrath, and J. T. Snow, 2004: Association between NSSL Mesocyclone Detection Algorithm–detected vortices and tornadoes. Wea. Forecasting, 19, 872–890, doi:10.1175/ 1520-0434(2004)019,0872:ABNMDA.2.0.CO;2. Kingfield, D. M., and J. G. LaDue, 2013: Performance of WSR88D severe storm algorithms in detecting tornadoes using the operational two-dimensional velocity dealiasing algorithm. Preprints, 38th Annual Meeting of the National Weather Association, Charleston, SC, NWA, 9.4. [Available online at http://www.nwas.org/ meetings/nwa2013/presentations/9.4.Kingfield_MDATVS.pptx.zip]. LaDue, J. G., K. Ortega, B. Smith, G. Stumpf, and D. M. Kingfield, 2012: A comparison of high resolution tornado surveys to Doppler radar observed vortex parameters: 2011–2012 case studies. Preprints, 26th Conf. on Severe Local Storms, Nashville, TN, Amer. Meteor. Soc., 6.3. [Available online at https:// ams.confex.com/ams/26SLS/webprogram/Paper212627.html.] Lakshmanan, V., T. Smith, G. J. Stumpf, and K. Hondl, 2007: The Warning Decision Support System—Integrated Information. Wea. Forecasting, 22, 596–612, doi:10.1175/WAF1009.1. Mahale, V. N., J. A. Brotzge, and H. B. Bluestein, 2014: The advantages of a mixed-band radar network for severe weather operations: A case study of 13 May 2009. Wea. Forecasting, 29, 78–98, doi:10.1175/WAF-D-13-00024.1. McLaughlin, D., and Coauthors, 2009: Short-wavelength technology and the potential for distributed networks of small radar systems. Bull. Amer. Meteor. Soc., 90, 1797–1817, doi:10.1175/ 2009BAMS2507.1. Miller, M. L., V. Lakshmanan, and T. Smith, 2013: An automated method for depicting mesocyclone path and intensities. Wea. Forecasting, 28, 570–585, doi:10.1175/WAF-D-12-00065.1. Mitchell, E. D., S. V. Vasiloff, G. J. Stumpf, A. Witt, M. D. Eilts, J. T. Johnson, and K. W. Thomas, 1998: The National Severe Storms Laboratory tornado detection algorithm. Wea. Forecasting, 13, 352–366, doi:10.1175/1520-0434(1998)013,0352: TNSSLT.2.0.CO;2. NOAA, 2011a: NWS Central Region service assessment: Joplin, Missouri, tornado—May 22, 2011. NOAA, Kansas City, MO,
OCTOBER 2015
KINGFIELD AND LADUE
41 pp. [Available online at http://www.nws.noaa.gov/om/ assessments/pdfs/Joplin_tornado.pdf.] ——, 2011b: NWS service assessment: The historic tornadoes of April 2011. NOAA, Silver Spring, MD, 76 pp. [Available online at http:// www.nws.noaa.gov/om/assessments/pdfs/historic_tornadoes.pdf] NWS, 2007: Storm Data preparation. National Weather Service Instruction 10-1605, 97 pp. [Available online at https://www. ncdc.noaa.gov/stormevents/pd01016005curr.pdf.] ——, 2013: National Weather Service Weather-Ready Nation Roadmap. NOAA/NWS, Silver Spring, MD, 81 pp. [Available online at http://www.nws.noaa.gov/com/weatherreadynation/ files/nws_wrn_roadmap_final_april17.pdf.] OFCM, 2006: Doppler radar meteorological observations: Part C: WSR-88D products and algorithms. Federal Meteorological Handbook 11, FCM-H11C-2006, Washington, DC, 390 pp. [Available online at http://www.ofcm.gov/fmh11/fmh11partc/ pdf/FMH-11-PartC-April2006.pdf.] Polger, P. D., B. S. Goldsmith, R. C. Przywarty, and J. R. Bocchieri, 1994: National Weather Service warning performance based on the WSR-88D. Bull. Amer. Meteor. Soc., 75, 203–214, doi:10.1175/ 1520-0477(1994)075,0203:NWSWPB.2.0.CO;2. Smith, B. T., R. L. Thompson, H. E. Brooke, A. R. Dean, and K. L. Elmore, 2012a: Diagnosis of Conditional Maximum Tornado Damage Probabilities. Proc. 26th Conf. on Severe Local Storms, Nashville, TN, Amer. Meteor. Soc., P2.20. [Available online at https://ams.confex.com/ams/26SLS/webprogram/Paper211807.html.] ——, ——, J. S. Grams, and C. Broyles, 2012b: Convective modes for significant severe thunderstorms in the contiguous United States. Part I: Storm classification and climatology. Wea. Forecasting, 27, 1114–1135, doi:10.1175/WAF-D-11-00115.1. Stumpf, G. J., A. Witt, E. D. Mitchell, P. L. Spencer, J. T. Johnson, M. D. Eilts, K. W. Thomas, and D. W. Burgess, 1998: The National Severe Storms Laboratory Mesocyclone Detection Algorithm for the WSR-88D. Wea. Forecasting, 13, 304–326, doi:10.1175/1520-0434(1998)013,0304: TNSSLM.2.0.CO;2. Torres, S. M., and C. D. Curtis, 2007: Initial implementation of super-resolution data on the NEXRAD network. Preprints, 23rd Conf. on Information Processing Systems, San Antonio, TX, Amer. Meteor. Soc., 5B.10. [Available online at https:// ams.confex.com/ams/pdfpapers/116240.pdf.] Toth, M., R. J. Trapp, J. Wurman, and K. A. Kosiba, 2013: Comparison of mobile-radar measurements of tornado intensity with corresponding WSR-88D measurements. Wea. Forecasting, 28, 418– 426, doi:10.1175/WAF-D-12-00019.1.
1139
Trapp, R. J., and R. Davies-Jones, 1997: Tornadogenesis with and without a dynamic pipe effect. J. Atmos. Sci., 54, 113–133, doi:10.1175/1520-0469(1997)054,0113:TWAWAD.2.0.CO;2. ——, E. D. Mitchell, G. A. Tipton, D. W. Effertz, A. I. Watson, D. L. Andra Jr., and M. A. Magsig, 1999: Descending and nondescending tornadic vortex signatures detected by WSR-88Ds. Wea. Forecasting, 14, 625–639, doi:10.1175/1520-0434(1999)014,0625: DANTVS.2.0.CO;2. ——, G. J. Stumpf, and K. L. Manross, 2005: A reassessment of the percentage of tornadic mesocyclones. Wea. Forecasting, 20, 680– 687, doi:10.1175/WAF864.1. ——, D. M. Wheatley, N. T. Atkins, R. W. Przybylinksi, and R. Wolf, 2006: Buyer beware: Some words of caution on the use of severe wind reports in postevent assessment and research. Wea. Forecasting, 21, 408–415, doi:10.1175/WAF925.1. Wakimoto, R. M., P. Stauffer, W. Lee, N. T. Atkins, and J. Wurman, 2012: Finescale structure of the LaGrange, Wyoming, tornado during VORTEX2: GBVTD and photogrammetric analyses. Mon. Wea. Rev., 140, 3397–3418, doi:10.1175/MWR-D-12-00036.1. WDTB, 2002: Tornado warning guidance: Spring 2002. Warning Decision Training Branch, 14 pp. [Available online at http:// www.wdtb.noaa.gov/modules/twg02/TWG2002.pdf.] Witt, A., M. D. Eilts, G. J. Stumpf, E. D. Mitchell, J. T. Johnson, and K. W. Thomas, 1998: Evaluating the performance of WSR-88D severe storm detection algorithms. Wea. Forecasting, 13, 513–518, doi:10.1175/1520-0434(1998)013,0513: ETPOWS.2.0.CO;2. ——, R. A. Brown, and Z. Jing, 2009: Performance of a new velocity dealiasing algorithm for the WSR-88D. Preprints, 34th Conf. on Radar Meteorology, Williamsburg, VA, Amer. Meteor. Soc., P4.8. [Available online at https://ams.confex.com/ ams/pdfpapers/155951.pdf.] Wood, V. T., and R. A. Brown, 1997: Effects of radar sampling on single-Doppler velocity signatures of mesocyclones and tornadoes. Wea. Forecasting, 12, 928–938, doi:10.1175/ 1520-0434(1997)012,0928:EORSOS.2.0.CO;2. ——, ——, and D. C. Dowell, 2009: Simulated WSR-88D velocity and reflectivity signatures of numerically modelled tornadoes. J. Atmos. Oceanic Technol., 26, 876–893, doi:10.1175/ 2008JTECHA1181.1. WSEC, 2006: A recommendation for an enhanced Fujita scale (EFscale). Wind Science and Engineering Center, Texas Tech University, Lubbock, TX, 95 pp. [Available online at http:// www.spc.noaa.gov/faq/tornado/ef-ttu.pdf.]