RESEARCH ARTICLE
The relationship between context, structure, and processes with outcomes of 6 regional diabetes networks in Europe Mahdi Mahdavi1,2☯, Jan Vissers2☯*, Sylvia Elkhuizen2, Mattees van Dijk3, Antero Vanhala4‡, Eleftheria Karampli5‡, Raquel Faubel6,7‡, Paul Forte8‡, Elena Coroian9‡, Joris van de Klundert2☯
a1111111111 a1111111111 a1111111111 a1111111111 a1111111111
1 National Institute of Health Research, Tehran University of Medical Sciences, Tehran, Iran, 2 Institute of Health Policy and Management, Erasmus University Rotterdam, Rotterdam, The Netherlands, 3 Hook of Holland, Rotterdam, The Netherlands, 4 HEMA Institute, Aalto University, Aalto, Finland, 5 National School of Public Health, Alexandras, Athens, Greece, 6 Joint Research Unit in ICT applied to Healthcare Process Re-engineering (eRDSS), Valencia, Spain, 7 University of Valencia, Valencia, Spain, 8 The Balance of Care Group, London, United Kingdom, 9 Institute for Learning Innovation, Friedrich-Alexander-University Nuremberg-Erlangen, Nuremberg, Germany ☯ These authors contributed equally to this work. ‡ These authors also contributed equally to this work. *
[email protected]
OPEN ACCESS Citation: Mahdavi M, Vissers J, Elkhuizen S, van Dijk M, Vanhala A, Karampli E, et al. (2018) The relationship between context, structure, and processes with outcomes of 6 regional diabetes networks in Europe. PLoS ONE 13(2): e0192599. https://doi.org/10.1371/journal.pone.0192599 Editor: Albert Lee, The Chinese University of Hong Kong, HONG KONG Received: July 2, 2017 Accepted: January 28, 2018 Published: February 15, 2018 Copyright: © 2018 Mahdavi et al. This is an open access article distributed under the terms of the Creative Commons Attribution License, which permits unrestricted use, distribution, and reproduction in any medium, provided the original author and source are credited. Data Availability Statement: All relevant data are within the paper and its Supporting Information files. Funding: Over the years 2011-2014, the cost of contributions of all researchers have been fully covered by the European Commission 7th Framework Programme for Research and Technological Development, project Managed Outcomes. This also holds true for the cost of the private organization ‘Balance of Care’. Cost from 2015 onwards for the final analysis and writing of
Abstract Background While health service provisioning for the chronic condition Type 2 Diabetes (T2D) often involves a network of organisations and professionals, most evidence on the relationships between the structures and processes of service provisioning and the outcomes considers single organisations or solo practitioners. Extending Donabedian’s Structure-Process-Outcome (SPO) model, we investigate how differences in quality of life, effective coverage of diabetes, and service satisfaction are associated with differences in the structures, processes, and context of T2D services in six regions in Finland, Germany, Greece, Netherlands, Spain, and UK.
Methods Data collection consisted of: a) systematic modelling of provider network’s structures and processes, and b) a cross-sectional survey of patient reported outcomes and other information. The survey resulted in data from 1459 T2D patients, during 2011–2012. Stepwise linear regression models were used to identify how independent cumulative proportion of variance in quality of life and service satisfaction are related to differences in context, structure and process. The selected context, structure and process variables are based on Donabedian’s SPO model, a service quality research instrument (SERVQUAL), and previous organization and professional level evidence. Additional analysis deepens the possible bidirectional relation between outcomes and processes.
Results The regression models explain 44% of variance in service satisfaction, mostly by structure and process variables (such as human resource use and the SERVQUAL dimensions). The
PLOS ONE | https://doi.org/10.1371/journal.pone.0192599 February 15, 2018
1 / 17
Relationship between context, structure, and processes with outcomes of diabetes networks
this manuscript have been covered by the employer organisations of the researchers involved. The funder provided support in the form of salaries for all authors and material costs, but did not have any additional role in the study design, data collection and analysis, decision to publish, or preparation of the manuscript. The specific roles of these authors are articulated in the ‘author contributions’ section. Competing interests: The Balance of Care group has contributed equally and similarly to the project, when compared to all other organisations involved. Their interests do not alter our adherence to PLOS ONE policies on sharing data and materials.
models explained 23% of variance in quality of life between the networks, much of which is related to contextual variables. Our results suggest that effectiveness of A1c control is negatively correlated with process variables such as total hours of care provided per year and cost of services per year.
Conclusions While the selected structure and process variables explain much of the variance in service satisfaction, this is less the case for quality of life. Moreover, it appears that the effect of the clinical outcome A1c control on processes is stronger than the other way around, as poorer control seems to relate to more service use, and higher cost. The standardized operational models used in this research prove to form a basis for expanding the network level evidence base for effective T2D service provisioning.
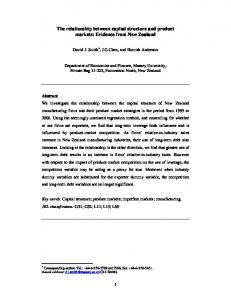
Introduction Diabetes is amongst the leading causes of morbidity around the world. The prevalence of diabetes amounted to 435 million in 2015 globally [1], of which around 90% was Type 2 Diabetes (T2D) [2]. In Europe, 55.4 million of individuals 20 years or older have T2D requiring more than 100 billion USD for treatment [1]. Over the course of the chronic condition T2D, the services delivery to a patient typically involve multiple provider organisations at various locations in the region in which the patient lives [3, 4]. Below, we will refer to such regional collections of provider organisations as T2D networks. T2D networks can be formally and explicitly established, e.g. through contracts between organisations, or through public administration in a public health sector. Alternatively, a T2D network can be defined implicitly as the collection of health service provider organisations jointly visited by the population of T2D patients in a region. Either way, clinical outcomes (such as A1c level), functional outcomes (such as quality of life), and experience outcomes (such as service satisfaction) depend to a large extent on the joint performance of the organisations in the T2D network [5]. Previous studies have indeed shown that these outcomes vary among T2D networks [6–9]. A seminal and often applied conceptual framework to develop understanding of factors that explain outcomes is the Structure-Process-Outcome (SPO) model proposed by Donabedian [10]. First, structures refer to attributes of settings where services are provided, which include facilities and equipment, human resources, and policies. Second, processes refer to attributes (such as completeness, continuity, functional quality) of activities for diagnosis and treatment. The SPO model posits that appropriate structures facilitate service processes that are more likely to result in desired (high quality) outcomes. Additionally, one may expect that the outcomes produced in a T2D network affect the health service use, i.e. the processes [6]. Moreover, when considering regional T2D networks, one should take into account that the regional context, other than structures, (e.g. geography or demography) also impacts the outcomes. The full conceptual model that we propose for studying T2D networks is therefore as depicted in Fig 1. Systematic literature review has revealed that very few studies consider how outcomes relate to service structures and processes within the contexts defined by regional T2D networks [11]. The research question that we address therefore is: How do structures, processes, and context
PLOS ONE | https://doi.org/10.1371/journal.pone.0192599 February 15, 2018
2 / 17
Relationship between context, structure, and processes with outcomes of diabetes networks
Fig 1. The extended Structure-Process-Outcome (SPO) model proposed for T2D networks. https://doi.org/10.1371/journal.pone.0192599.g001
of regional provider networks relate to T2D outcomes? As our main interest is to advance understanding of the network design, we will be particularly interested in the network structures and processes, and consider context predominantly as a set of covariates. While this question has received little attention for T2D networks, there is evidence at the levels of provider organisations and (solo) practitioners within these networks. Collins et al. state that the quality of life of T2D patients varies with the structure of organisations [12]. In fact, structures which more heavily use nurses–and therefore make less use of GPs and/or medical specialists—have been associated with higher service satisfaction [13]. Other resources, such as equipment, are known to impact outcomes as well [14]. Moreover, structures which improve access to care have been reported to positively affect service satisfaction and the health state of T2D patients [15, 16]. Process characteristics which have been investigated for single provider organisations and solo practitioners in relation to outcomes of T2D care include frequency, duration, and comprehensiveness of services for both diagnosis and treatment [17]. Moreover, patient reported process characteristics such as perceived waiting time, responsiveness, and empathy have been considered in relation to service satisfaction [18, 19]. Furthermore, evidence suggests a relationship between service frequency and health outcomes [20]. Given the complexity of regional T2D provider networks, it is likely that outcomes relate to structures, processes, and context in complex and interacting ways. Given the lack of evidence on these relationships we aim to contribute to an initial evidence base by exploring
PLOS ONE | https://doi.org/10.1371/journal.pone.0192599 February 15, 2018
3 / 17
Relationship between context, structure, and processes with outcomes of diabetes networks
independent relationships of structures, processes, and context with outcomes. Primarily, we assess the independent cumulative proportion of variance in service satisfaction and quality of life by structure, process, and context variables. The main approach will be to verify whether the evidence found for solo practitioners and/or single provider organisations extends to the T2D network level. The importance of developing understanding on these relationships not only stems from the scientific relevance of building an evidence base that considers the network level, but also from the societal need to effectively and affordably address the ever more prevalent condition of T2D. This manuscript builds on the EU FP7 project MANAGED OUTCOMES, which aimed to develop such understanding for a variety of highly prevalent conditions [21]. All data collection and modelling was funded through MANAGED OUTCOMES.
Materials and methods Study settings Within MANAGED OUTCOMES, we conducted a cross sectional study involving T2D networks and patients from six regions: Keski-Suomi (Finland); Bamberg (Germany); Herakleion (Greece); NieuweWaterwegNoord & DelftWestlandOostland (NWN & DWO) (The Netherlands); Valencia (Spain); and Tower Hamlets (United Kingdom). S1 Appendix provides detailed background information on the regions. The network structures and processes were modelled using the MANAGED OUTCOMES network model, depicted in S1 Framework as well. Many of the variables in this model describe features of the network as a whole. Likewise, some of the context and outcome variables regard the (whole) population of T2D patients living in the region. Other variables however, regard individual patients. Hence, below we speak of network level variables (and network level data) and patient level variables (and patient level data). The patient population studied consists of the individuals diagnosed with T2D registered and serviced by primary care providers in the regions. While there is no requirement that patients are exclusively serviced by primary care providers, we have excluded patients primarily treated in secondary or tertiary care. Individuals in a pre-diabetes stage are also not considered. Below, we first specify the variables included in the analysis, and then further outline the research design and analysis methods.
Ethics statement The study was approved in each country involved in the study. The Keski Suomi study was approved by the Ethics Committee of the Central Finland Health Care District. The Bamberg study was approved by the Ethics Committee of the Medical Faculty of the FriedrichAlexander University in Erlangen-Nu¨rnberg. The Herakleion study was approved by the Scientific Committee of the hospital in Herakleion. The NieuweWaterwegNoord & DelftWestlandOostland study was approved by the board of directors of the Primary Care Group ZEL. The Valencia study was approved by the Hospital La Fe Ethical Committee. The Tower Hamlets study was approved by the NHS National Research Ethics Service. Permission for use of data was received from the Ethics Committee of the Central Finland Health Care District (statistical data at aggregate level), the Ethics Committee of the Medical Faculty of the Friedrich-Alexander University in Erlangen-Nu¨rnberg (statistical data at aggregate level), the Scientific Committee of the hospital in Herakleion (statistical data and access to patient records), the Scientific Council of the IPCI system of the department of Medical Information of the Erasmus Medical Centre (statistical data at aggregate level), the Hospital La Fe Ethical
PLOS ONE | https://doi.org/10.1371/journal.pone.0192599 February 15, 2018
4 / 17
Relationship between context, structure, and processes with outcomes of diabetes networks
Committee (statistical data at aggregate level) and the NHS National Research Ethics Service (statistical data and access of patient records through the clinicians of the local diabetes research network).
Variables Outcomes. The analysis includes three commonly investigated outcome variables representing the three domains clinical outcomes, functional outcomes, and experiential outcomes. The clinical outcome variable is effective coverage of diabetes care, the functional outcome is quality of life, and the experiential outcome is service satisfaction. Quality of life was measured in terms of EQ5D at patient level through the five dimensions: mobility, self-care, usual activity, pain/discomfort, and anxiety/depression [22]. On each dimension, valid responses for items were: having no problems, having some or moderate problems, being unable to do/having extreme problems. The Utility index score of EQ5D per subject was calculated from all five dimensions using the Dolan Utility Index [23]. Service satisfaction was measured at the patient level as the overall/global satisfaction with the T2D network service performance on a Likert scale from 1 (extremely dissatisfied) to 7 (extremely satisfied). For the purpose of comparison, it was subsequently rescaled to a percentage (0% for lowest satisfaction to 100% for highest). The effective coverage percentage is defined as the percentage of T2D patients for which service provisioning has resulted in an A1c level below 53 mmol/mol [24, 25]. For feasibility of data collection, the clinical outcome variable A1c was not considered at patient level, but at network level. Structure. Following our conceptual framework and the evidence reviewed in the introduction, we considered structural characteristics regarding resources—both human resources and equipment—and accessibility of the locations [10]. The human resources considered included practice nurses, diabetes nurses, physicians, and specialists. More specifically, we distinguished three human resource models: 1) a model in which medical specialists played a leading role in the service delivery, 2) a model in which the GP/Family doctor played a central role, and 3) a model in which a nurse plays a central role (henceforth referred to as the nursebased model) [13, 26]. Per region, these models don’t differ from patient to patient, and hence these models apply to the network level. The resource concept of equipment is operationalized through the (patient reported) service quality dimension ‘tangibles’ from the SERVQUAL model [18, 19]. Accessibility of locations is measured in terms of physical distance (between patient home and service facilities) and in terms of travel time (between patient home and service facilities). Both variables are measured at patient level. Process. Process variables were also selected based on our conceptual model and earlier evidence for single provider organization studies and solo practitioner studies as mentioned in the introduction. We included average annual hours of care provided per patient, average annual cost per patient, annual number of follow up visits, comprehensiveness of consultation, outpatient waiting time, and a selection of reportedly most influential SERVQUAL variables. Hours of care are measured at the network level. More specifically, it measures the average hours of care at network level by summing over all patients, the time the delivered service activities take per year. Based on these breakdowns of service processes into activities, average cost per patient are calculated by calculating activity based costs for these activities as on average delivered to patients [27]. Costs are adjusted by purchasing power parity (PPP) for 2011 [28].
PLOS ONE | https://doi.org/10.1371/journal.pone.0192599 February 15, 2018
5 / 17
Relationship between context, structure, and processes with outcomes of diabetes networks
The annual number of visits is measured at the patient level, as is the case for comprehensiveness of consultation (referring to the degree to which all questions of the patient are addressed and discussed within a single consultation visit), and outpatient waiting time. The patient level SERVQUAL process variables included are responsiveness, timeliness, empathy, caring, and communication [29], so as to understand the relationship between wellestablished service process quality determinants and the outcome service satisfaction [30, 31]. Context. Contextual characteristics included demographic aspects of the T2D patient population. Following our conceptual framework and earlier evidence on T2D services, we included the patient level variables age, gender, education, time since diagnosis of T2D, stage of T2D [32, 33], and patient behavior [34]. Patients were classified to either have minimum required education, or higher. Patient behavior included smoking, physical activity habits, and knowledge of A1c value. Patients were either current smoker or past/non-smoker. Physical activity is measured as the number of days the patient has at least 30 minutes of moderate or intensive physical activity, average over the last four weeks (at time of survey). To operationalize stage of T2D, we distinguished three segments of T2D diabetes patients: 1. T2D diagnosed, treatment is mainly in primary care and consists of life style intervention (lifestyle segment), 2. T2D diagnosed, treatment is mainly in primary care and consists of life style intervention in combination with oral diabetic drugs (medication segment), 3. T2D diagnosed, treatment is mainly in primary care and consists of life style intervention, oral drugs, and/or insulin injections (insulin segment).
Data collection Data collection took place in 2011–2012. Network level data mostly originate from administrative databases, and were collected using the structured operational model templates developed in MANAGED OUTCOMES, as described in S2 Appendix. As an example, S3 Appendix provides a description of the network level data for the Dutch network NWN & DWO. Patient level data were collected by patient survey. Over the six regions, 5972 questionnaires were distributed to patients, predominantly by mail. Except for number of follow up visits (which had a one-year recall period), all variables had a one-month recall period. Provider organisations within the T2D networks assisted in selecting survey respondents.
Analysis methods Differences between the networks with regard to EQ5D and service satisfaction were analysed using analysis of variance (ANOVA), Levene’s test for equality of variance, and Welch F test [35]. Comparison between the countries with regard to effective coverage percentage was performed using Chi-square test. As a main analysis model, we consider how variance in patient level outcomes relates to structure, process, and context variables. Analysis methods apply to the outcome variables service satisfaction and quality of life. The analysis considers 3 models for the outcomes service satisfaction and quality of life. Model 1 only includes context variables which we consider as covariates henceforth. Model 2 includes context and structure variables. Model 3 includes context, structure and process variables. These models are built using linear regression models. For each model, we report R2 and significance of change in R2 to define statistically significant increase in the proportion of explained variance in the outcomes. The relationship between
PLOS ONE | https://doi.org/10.1371/journal.pone.0192599 February 15, 2018
6 / 17
Relationship between context, structure, and processes with outcomes of diabetes networks
the context, structure and process variables with outcomes is also determined by its coefficient value. The analysis for the outcome measure effective coverage percentage necessarily uses a different method as this variable is measured at the network level. We inspect the relationships graphically, especially in relation to the process measures hours of care and costs, for which we conjecture that the relationship is bidirectional. To minimize exclusion of cases from the regression model attributable to missing values we used imputation. Except for the missing values of EQ5D, which were imputed differently, the missing values were imputed using multiple imputations using a default Markov Chain Monte Carlo method. Imputation was iterated five times which thus produced five datasets [36]. Missing values of EQ5D dimensions are imputed only if at most one dimension was missing. Statistical analyses were performed using the IBM SPSS statistical package version 20.
Results Out of the total of 5972 questionnaires distributed in the six regions, 1638 were returned. The 179 questionnaires returned by respondents who indicated inability to master the language of the country in which they lived were excluded, resulting in a total of 1459 participants to be included in the analyses (a 24.4% response rate). Response rates ranged from 61.9% in Germany to 15.5% in the UK. The percentage of missing values, excluding EQ5D dimensions, was on average 9.1%. The missing values ranged from 2.0% for smoking to 17.1% for physical activities. S4 Appendix includes a summary of the contextual differences between the patient populations from the six regions with regard to age, gender, and disease stage. Network level data were collected in all regions, except for Bamberg, Germany.
Differences in outcomes between provider networks Descriptive statistics on the outcome variables effective coverage, EQ5D, and service satisfaction from the six regional T2D networks are presented in Table 1. After briefly reviewing the outcome data, we firstly present the main analysis results on the outcome variables service satisfaction and EQ5D, and subsequently, the coarser results on effective coverage percentage. Keski-Suomi has the largest number of patients with effective coverage (77%), followed by NWN & DWO. Herakleion has the lowest level of this outcome (42%). Valencia and Tower Hamlets are in between with 60% and 56% respectively. From a Chi-square test, we conclude that the levels of effective coverage significantly differ between these regions (p