Asian Social Science; Vol. 10, No. 14; 2014 ISSN 1911-2017 E-ISSN 1911-2025 Published by Canadian Center of Science and Education
The Relationship between Enterprise Resource Planning, Total Quality Management, Organizational Excellence, and Organizational Performance-the Mediating Role of Total Quality Management and Organizational Excellence Hassan Saleh Al-Dhaafri1,2, Rushami Zien Bin Yusoff3 & Abdullah Kaid Al-Swidi3 1
Dubai Police, Dubai, United Arab Emirates
2
Othman Yeop Abdullah Graduate School of Business, College of Business, University Utara Malaysia, Malaysia
3
College of Business, University Utara Malaysia, Sintok, Malaysia
Correspondence: Hassan Saleh Al-Dhaafri, Othman Yeop Abdullah Graduate School of Business, College of Business, University Utara Malaysia, Malaysia. Tel: 971-50-882-8812. E-mail:
[email protected] Received: April 12, 2014
Accepted: May 19, 2014
doi:10.5539/ass.v10n14p158
Online Published: June 24, 2014
URL: http://dx.doi.org/10.5539/ass.v10n14p158
Abstract Purpose: This study was set up to examine the mediating effect of TQM and organizational excellence between ERP and organizational performance. Design/methodology/approach: To examine the model of the study, design of survey questionnaire was employed through data collected from Dubai Police Departments. Out of 565 questionnaires, 320 only usable returned. Partial Least Square (PLS) structural equation modelling was employed to analyze the data. Findings: Based on statistical results, the effect of ERP on TQM, organizational excellence, and organizational performance were confirmed. In addition, the effect of TQM and organizational excellence on organizational performance was also confirmed. Moreover, TQM was found to partially mediate the effect of ERP on organizational performance, whereas organizational excellence was found to fully mediate the effect on the same relationship. Practical implications: The results of this study have several practical implications. This study will help managers and decision makers to take the proper decision when implementing ERP system. Due to that, TQM and organizational excellence are the most important practices to ease the ERP implementation. Originality/value: This study is considered as the only empirical study that examines the collective effect of ERP, TQM, and organizational excellence on organizational performance. Keywords: enterprise resource planning (ERP), total quality management (TQM), organizational excellence (OE), organizational performance (OP), Dubai Police (DP) 1. Introduction The current global competitive environment compels organizations around the world to enhance and increase their performance through implementing innovative strategies in order to sustain their business and remain competitive. To assist the process of development, organizations have to adopted different philosophies and approaches including Total Quality Management, business excellence (Oakland, 1999), and Enterprise Resource Planning (ERP) (Uwizeyemungu & Raymond, 2010). The resource-based view theory (RBV) of the firm has been used in IT business research to investigate and theorize the effect of rare IT capabilities on sustainable competitive advantages (Masli, Richardson, Sanchez, & Smith, 2010). ERP effects on operations such as in supply chain based on RBV and contingency theories (Hwang & Min, 2013). Previous research has empirically reported a positive relationship between superior IT capabilities and organizational performance. One of those superior IT systems in the last few years is ERP system. The implementation of ERP as an innovative system with large business organizations, and later expanded to cover other organizations such as small and medium-sized organizations (SMEs) (Everdingen, 158
www.ccsenet.org/ass
Asian Social Science
Vol. 10, No. 14; 2014
Hillegersberg, & Waarts, 2000) and organizations of public sector (Kumar, Maheshwari, & Kumar, 2002). While some organizations reported potential benefits from ERP implementation, others reported horror stories about ERP system (Barker & Frolick, 2003; Shang & Seddon, 2000). Therefore, the decision of using the most appropriate system is not an easy task. Organizations have to implement a system that can help them to achieve their goals with low risks. ERP as a complicated system can lead to achieve high performance and competitive advantages if supported by other factors inside and outside the organizations. Total Quality Management (TQM) as a management philosophy can be one of those factors that can help ERP system to achieve the desired goals. It has been argued that TQM is a pre-requisite practice before implementing ERP system (Ghadilolaee, Aghajani, & Rahmati, 2010). Excellence as a desired outcome for any strategy and practice can be also considered as a practice that can help organizations to implement the proposed practice in excellent ways to achieve ultimately the best organizational performance. As a result, organizations that demonstrate IT excellence should generate the greatest values from spending in their IT strategy (Masli et al., 2010). In addition, while most of practices in TQM are moving in way, but there are still lacking of the significance of employee role in developing quality improvement for the sake of accomplishing business excellence (Rashid & Aslam, 2012). This study examined the relationship between ERP and organizational performance. Due to the inconclusiveness findings in the previous literature of the relationship between ERP and organizational performance, this study is an attempt to investigate the mechanism of TQM and organizational excellence as mediator variables that can explain that relationship through implementing quantitative research based on questionnaire survey. 2. Related Literature and Research Hypotheses The literature review is presented in seven sections. As a base for understanding the other following relationships, the first section presents the relationship between ERP and organizational performance. The other followed sections discussed the relationships between variables in the proposed framework. As a result of the thorough discussion of the previous studies in the literature, several hypotheses are proposed for these relationships to be tested in the following parts of this research. 2.1 ERP and Organizational Performance In the literature there are many definitions for ERP system, however, there is no agreement among researchers on an agreed definition. One of the important definition in the previous literature was defined by Davenport (2002) “ERP as an advanced technological solution system that integrate critical information within organization such as supply chain, finance and accounting, human resource, and customer relationships”. In addition, ERP is an information system that integrates the data of the organizations that are used in their operation (Pacheco-Comer & González-Castolo, 2012). There are many reasons and motivations behind implementation of ERP systems such as technical and business driven implementations (Botta-Genoulaz & Millet, 2006; Velcu, 2007). The relationship between ERP system and organizational performance has been examined by many researchers. There are conflicting results in their relationship (Kang, Park, & Yang, 2008). Some of them reported a positive and significant relationship between ERP and organizational performance (Bendoly & Kaefer, 2004; da Silveira, Snider, & Balakrishnan, 2013; Fang & Lin, 2006; HassabElnaby, Hwang, & Vonderembse, 2012; Hayes et al., 2001; Hwang & Min, 2013; Peffers & Dos Santos, 1996; Velcu, 2007). However, on the other hand, there are some other researchers who reported adverse results (Hitt & Brynjolfsson, 1996; Weill, 1992; Wier, Hunton, & HassabElnaby, 2007). The mixed results in the previous literature of the effect of ERP on organizational performance encourage us to do this study and examine that relationship with the existing of other variables that may help in increasing the positive and significant effect. But before investigating the mediating effect of TQM and organizational excellence, the direct effect of ERP on organizational performance can be examined to compare with other results. Therefore, the following hypothesis is proposed: H1: Enterprise Resource Planning has a positive and significant effect on the organizational performance. 2.2 ERP and TQM Implementation of innovative initiatives such as ERP and TQM are considered the most important practices to enhance performance and gain competitive advantages (Abdinnour & Groen, 2009). There are few studies, such as Laframboise & Reyes (2005) that discuss the collective effective of both TQM and ERP (Abdinnour & Groen, 2009). Their study used a qualitative method through interviews in the aerospace industry. In addition, Ghadilolaee, Aghajani, and Rahmati (2010) argued in their study that implementation of ERP should be 159
www.ccsenet.org/ass
Asian Social Science
Vol. 10, No. 14; 2014
preceded by implementation of TQM practice for the reason that TQM could bring continuous improvement and problem solving that enable organizations to implement ERP successfully. Most of critical success factors of TQM and ERP are identical such as business process reengineering, culture, learning, training, top management support, open communication, etc. In their contribution to the same field, Jha and Joshi (2007) reported in their study that ERP and TQM practices are considered significant resources for any organization to gain competitive advantage. Additionally, Marc and Gyu (2003) argued that implementation of ERP not always success because of some critical success factors such as TQM, culture, and business process reengineering. From the above discussion, the following hypothesis is postulated: H2: Enterprise Resource Planning has a positive and significant effect on Total Quality Management 2.3 ERP and Organizational Excellence The main purpose of implementing ERP in organizations is to achieve the maximum performance and gain competitive advantages over competitors. In order to achieve that, the ERP system should be implemented in excellent ways either through internal or external processes. Organizational excellence is the practice of making organizations better in excellence path and growth (Attafar, Forouzan, & Shojaei, 2012). According to Moghadami (2005), excellent organizations have different characteristics in terms of customer, employees, leadership, capital owner, learning, future generation, globalization, change or transformation, and suppliers. Each one of these characteristics plays an important role in achieving excellence that leads to achieve the desired performance. When implementing ERP as a technological system, implementers or business owners should focus on the previous characteristics to help ERP to achieve what is planned to be at the earlier stages. To discover the effect of ERP on organizational excellence, the following hypothesis is proposed to be examined: H3: Enterprise Resource Planning has a positive and significant effect on the organizational Excellence 2.4 TQM and Organizational Performance Total Quality Management (TQM) is a management philosophy that has been obtained attention by many research (Ehigie & McAndrew, 2005), and confirms the role of internal and external suppliers, customer, and employees in pursuing continuous improvement (Kanji, 2002). There are a bulk in the literature that show the significance of TQM strategy in manufacturing organizations (Arawati, 2005; Sohal & Terziovski, 2000), service organizations (Yasin, Kunt, & Zimmerer, 2004), SMEs organizations (Sohail & Hoong, 2003), and public organizations (Nor Hazilah, 2004). However, there are plenty of studies on TQM practices, most of them in developed countries and only there are six studies out of 347 were conducted in the Middle East including Saudi Arabia, Qater, and UAE (Sila & Ebrahimpour, 2002). Therefore, this study is an attempt to fill this gap in the literature. The relationship between TQM and organizational performance has been examined by many researchers, however, some of them found that TQM can affect and enhance the performance positively and significantly (Abebe, 2014; Barh, Tee, & Rao , 2002; Dada & Watson, 2013; Demirbag et al., 2006; Feng, Prajogo, Tan, & Sohal, 2006; Fotopoulos & Psomas, 2010; Gadenne & Sharma, 2009; Hendricks & Singhal, 1997; Lee , 2004; Salaheldin, 2009; Tang & Tang, 2012; Wang & Yen, 2012; Zhang & Zhang, 2012). On the other hand, other researchers found that TQM has no effect on organizational performance and sometimes may affect the performance negatively (Dooyoung, Kalinowski, & El-Enein, 1998). The inconsistent findings in the previous literature urge for more researches to be conducted in this area. Therefore this study is a response to those calls from previous researchers to do more researches through including other variables. For this purpose, the following hypothesis is proposed to be tested: H4: Total Quality Management has a positive and significant effect on the organizational performance. 2.5 TQM and Organizational Excellence As has been mentioned earlier, TQM is considered as one of the important strategic instrument that helps organizations to achieve optimal performance. In addition, TQM core essentials are to encourage business practice to increase customers’ satisfaction, productivity, reduce cost, and enhance quality output. In other words, TQM is a strategy that helps organizations to enhance business excellence (Lee, 2002). According to Ionica and Baleanu (2010), the history of TQM from inspection to business excellence has gone through different stages such as quality control. There are some studies that investigated the relationship between TQM and organizational excellence such as Sharma and Kodali (2008) who argued that TQM is considered as a fundamental standard to achieve excellence in manufacturing industry. In addition, Ioncia and Baleanu (2010) reported that the underlying principles of 160
www.ccsenet.org/ass
Asian Social Science
Vol. 10, No. 14; 2014
EFQM Excellence Model are connected with basic TQM’s principles. Moreover, Lyons, Acsente, and Waesberghe (2008) examined the relationship between TQM and knowledge management to integrate a sustainable excellence framework. Lee (2002) investigated how business excellence can be sustained through TQM. In conclusion, the area of how TQM can enhance organization performance through excellence is still rare in the literature; therefore this study tries to investigate more about this relationship. To achieve this purpose, the following hypothesis is proposed: H5: Total Quality Management has a positive and significant effect on the organizational Excellence. 2.6 Organizational Excellence and Organizational Performance Antony and Bhattacharyya (2010) examined the relationship between organizational excellence and organizational performance where they found that organizational excellence could be figured base on relationship of performance indicators. They found also that organizational excellence enables managers to evaluate their organizations better than organizational performance method. In addition, Ooncharoen and Ussahawanitchakit (2008) in their study found that organizational excellence has a positive and significant effect on performance. Therefore the following hypothesis is postulated to be tested: H6: Organizational Excellence has a positive and significant effect on the organizational performance. 2.7 The Mediating Role of TQM and Organizational Excellence As has been stated earlier, the direct effect of ERP on organizational performance has been studied by many researchers. However the abundant studies on this relationship, there are still inconclusiveness about the effect of ERP on organizational performance. Therefore, many researchers call for more researches in this area to be conducted by involving other variables that may affect the relationship positively and significantly. For this purpose, TQM and organizational excellence have been intervened in the relationship as mechanisms to explain in a better way the effect of ERP on organizational performance. Through implementing TQM practices and organizational excellence concepts, ERP may has the power to achieve the desired objectives and enhance performance. TQM and organizational excellence have many dimensions such as leadership, continuous improvement, innovation, customer focus, strategic planning, benchmarking, service design, etc. By practicing these strategies and practices inside the organization, ERP as a new system can benefit in all implementation stages to gain the proposed organizational performance. Logically, TQM and organizational excellence can bring the advantage to organizations because of their involving the elements of success. According to Mele and Colurcio (2006) organizational excellence when linked with TQM has different aspects such as development of partnership, public responsibility, coherence with objectives, leadership, continuous improvement, innovation, and learning. TQM and excellence can complement each other (Adebanjo, 2001), and therefore can bring a powerful management tools to facilitate the implementation of ERP system for the sake of achieving high organizational performance. In addition, the mediation of TQM as a strategic resource was examined by Prajogo and Sohal (2006) between differentiation strategy and performance where they found a partial mediation. For this purpose, the following hypotheses are preoposed to be examined in the next stage: H7: TQM mediate the relationship between ERP and Organizational Performance H8: Organizational Excellence mediate the relationship between ERP and Organizational Performance 3. Methodology The main purpose of this study is to examine the effect of variables on each other’s. To achieve that a quantitative methodology approach was employed. Questionnaire survey is considered as one of the important instruments to collect the primary data from respondents (Kerlinger & Lee, 2000). The data collected through cross-sectional research design which is suitable for this study to collect the data at the point of time. The survey questionnaires were distributed in January, 2014 and collected end of February, 2014 through hard copy and emails. The source of data was Dubai Police where the first author works. Because of the nature of this study’s variables, sections of Dubai Police have been selected to fill the questionnaire through Head section officers. Head section officers are the middle managers as a link between managers and employees. They know better than other on how these practices and strategies are working. Five hundred forty five questionnaires have been distributed and three hundred and twenty were returned completely. Dimensions and measurements have been adopted and adapted from previous studies. ERP measurements have been adopted from Stratman and Roth (2002), whereas measurements of TQM from different sources: Brah, Wong, and Rao (2000), Anderson and Sohal (1999), Terziovski & Samson (1999), and Rao (2000). Measurements of organizational excellence have been adopted from Pinar and Girard (2000), and organizational performance from Kaplan and Norton (1992; 2000). Structural Equation Modeling (SEM) is the technique that used to analyze the data and test the proposed 161
www.ccsenet.org/ass
Asian Social Science
Vol. 10, No. 14; 2014
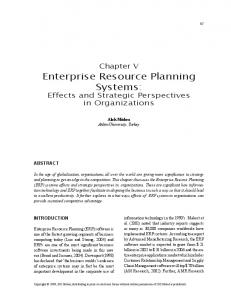
hypothesis through Smart-PLS statistical software. 4. Statistical Analysis and Results Partial Least Square (PLS) is used to confirm the reliability and validity of the outer. As confirmed by many researchers, reliability and validity are the initial tests before doing the hypotheses testing. The model of this study contains the variables: ERP, TQM, organizational excellence and organizational performance. In order to examine the relationships between these variables, this study follows the two-step approach suggested by Chin (1998).
Figure 1. The research framework In the literature of Structural Equation Modeling (SEM) the construct validity and reliability of the model should be approved before examining the hypothesized relationships. 4.1 The Outer Model (Measurement) The following sections test the validity and reliability of the constructs before establishing the goodness of the measurement model. The construct validity and reliability was tested through the content validity, the discriminant validity, and the convergent validity as illustrated in the next sections. 4.1.1 The Content Validity In multivariate analysis literature, the content validity of the construct compared with the other model’s constructs. Therefore, Chin (1998) and Hair et al. (2010) suggested the using of factor loading to examine the content validity. To do that, the items will be deleted if are loaded high with other constructs than their respective ones. Table 1 and 2 showed that all the constructs are significantly loaded higher in their respective variables. Therefore, these results confirmed that the measurement model of this study has content validity. Table 1. Factor loading significance Construct Benchmarking
Continuous Improvement
ERP-Business Process Skills
Items B1 B2 B3 CI1 CI2 CI3 CI4 ERPB1 ERPB2 ERPB3
Loadings 0.928 0.884 0.877 0.902 0.926 0.867 0.875 0.851 0.876 0.873 162
Standard Error 0.015 0.021 0.025 0.012 0.007 0.020 0.016 0.018 0.012 0.016
T Value 61.945 43.071 34.795 76.117 127.912 43.058 55.424 46.642 71.143 55.122
P Value 0.000 0.000 0.000 0.000 0.000 0.000 0.000 0.000 0.000 0.000
www.ccsenet.org/ass Construct
ERP-Change Readiness
ERP-Executive Commitment
ERP-IT Skills
ERP-Learning
ERP-Project Management
ERP-Strategic IT Planning
ERP-Training
Excellence-Customer Focus
Excellence-Innovation
Excellence-Personnel Commitment
HRM
Asian Social Science Items ERPB4 ERPB5 ERPC1 ERPC2 ERPC3 ERPC4 ERPC5 ERPE1 ERPE2 ERPE3 ERPE4 ERPE5 ERPI1 ERPI2 ERPI3 ERPI4 ERPI5 ERPL1 ERPL2 ERPL3 ERPL4 ERPL5 ERPP1 ERPP2 ERPP3 ERPP4 ERPP5 ERPS1 ERPS2 ERPS3 ERPS4 ERPS5 ERPT1 ERPT2 ERPT3 ERPT4 ERPT5 EXC1 EXC2 EXC3 EXI1 EXI2 EXI3 EXP1 EXP2 EXP3 EXP4 HRE1 HRE2 HRE3 HRI1
Loadings 0.919 0.763 0.861 0.932 0.880 0.942 0.888 0.861 0.909 0.925 0.911 0.714 0.840 0.880 0.891 0.934 0.817 0.778 0.811 0.851 0.894 0.842 0.903 0.905 0.895 0.895 0.755 0.840 0.887 0.901 0.904 0.862 0.825 0.766 0.850 0.847 0.805 0.927 0.951 0.933 0.884 0.908 0.910 0.855 0.862 0.837 0.802 0.862 0.785 0.785 0.793 163
Vol. 10, No. 14; 2014 Standard Error 0.011 0.030 0.018 0.014 0.012 0.006 0.013 0.023 0.012 0.009 0.013 0.033 0.023 0.015 0.015 0.008 0.031 0.024 0.027 0.015 0.010 0.022 0.013 0.012 0.014 0.013 0.032 0.015 0.012 0.012 0.013 0.018 0.020 0.032 0.016 0.018 0.021 0.011 0.008 0.009 0.014 0.015 0.013 0.017 0.020 0.025 0.028 0.015 0.020 0.020 0.028
T Value 84.528 25.113 46.858 65.883 72.873 150.155 70.955 37.969 77.958 99.169 70.299 21.507 35.784 60.673 59.710 114.491 26.168 31.882 30.497 57.700 85.273 38.850 69.904 76.008 64.196 67.671 23.421 55.988 77.035 72.709 69.108 46.898 41.460 24.074 54.514 47.484 37.848 84.758 119.483 99.535 61.997 62.436 68.133 50.163 43.673 33.668 28.481 57.933 38.587 39.039 28.688
P Value 0.000 0.000 0.000 0.000 0.000 0.000 0.000 0.000 0.000 0.000 0.000 0.000 0.000 0.000 0.000 0.000 0.000 0.000 0.000 0.000 0.000 0.000 0.000 0.000 0.000 0.000 0.000 0.000 0.000 0.000 0.000 0.000 0.000 0.000 0.000 0.000 0.000 0.000 0.000 0.000 0.000 0.000 0.000 0.000 0.000 0.000 0.000 0.000 0.000 0.000 0.000
www.ccsenet.org/ass
Asian Social Science
Construct
Items HRI2 HRI3 HRT2 HRT3 HRTI IA1 IA2 IA3 IA4 IA5 ML1 ML2 ML3 ML4 OPC4 OPC5 OPC6 OPC7 OPF1 OPF2 OPF3 OPI10 OPI11 OPI8 OPI9 OPL12 OPL13 OPL14 OPL15 SD1 SD2 SD3 SP1 SP2 SP3 SP4
Information and Analysis
Management Leadership
Customer
Financial
Internal Process
Learning and Growth
Service Design
Stratgic Planning
Loadings 0.844 0.889 0.776 0.905 0.860 0.801 0.910 0.848 0.888 0.902 0.924 0.892 0.938 0.920 0.799 0.824 0.830 0.777 0.866 0.740 0.762 0.794 0.719 0.822 0.823 0.771 0.803 0.754 0.869 0.892 0.943 0.890 0.841 0.884 0.894 0.846
Vol. 10, No. 14; 2014 Standard Error 0.020 0.013 0.026 0.011 0.014 0.024 0.011 0.022 0.014 0.010 0.010 0.017 0.009 0.012 0.010 0.020 0.033 0.027 0.020 0.027 0.013 0.042 0.044 0.033 0.023 0.024 0.022 0.019 0.020 0.014 0.007 0.009 0.018 0.014 0.011 0.015
T Value 42.946 69.151 30.201 82.948 61.412 32.802 82.811 38.033 64.433 86.148 93.907 51.406 104.723 78.487 85.559 40.056 21.607 28.825 40.355 28.253 64.619 17.748 17.473 24.584 35.240 34.033 35.931 44.190 41.264 63.562 140.834 96.015 46.320 63.567 81.630 56.679
P Value 0.000 0.000 0.000 0.000 0.000 0.000 0.000 0.000 0.000 0.000 0.000 0.000 0.000 0.000 0.000 0.000 0.000 0.000 0.000 0.000 0.000 0.000 0.000 0.000 0.000 0.000 0.000 0.000 0.000 0.000 0.000 0.000 0.000 0.000 0.000 0.000
ERPS
IA
ML
OPC
OPF
OPI
OPL
SD
SP
ERPT Custome r Innovatio n Commit ment HRI
ERPP
CI2
ERPL
CI1
ERPI
Continu ous Improv ement
ERPE
B3
ERPC
B2
ERPB
Benchm arking
CI
B1
B
Constr uct
Items
Table 2. Factor analysis results
0.
0.
0.
0.
0.
0.
0.
0.
0.
0.
0.
0.
0.
0.
0.
0.
0.
0.
0.
0.
0.
0.
9
8
55
37
72
53
5
45
73
5
45
49
28
75
71
47
35
16
32
35
72
61
0.
0.
0.
0.
0.
0.
0.
0.
0.
0.
0.
0.
0.
0.
0.
0.
0.
0.
0.
0.
0.
##
9
74
56
36
57
56
45
42
7
47
32
47
3
76
73
46
26
17
29
35
71
#
0.
0.
0.
0.
0.
0.
0.
0.
0.
0.
0.
0.
0.
0.
0.
0.
0.
0.
0.
0.
0.
0.
9
73
52
27
59
52
4
4
71
41
36
51
36
67
71
52
25
16
3
38
68
58
0.
0.
0.
0.
0.
0.
0.
0.
0.
0.
0.
0.
0.
0.
0.
0.
0.
0.
0.
0.
0.
0.
76
9
62
57
75
63
61
59
75
6
53
6
5
77
86
55
41
39
48
52
82
66
0.
0.
0.
0.
0.
0.
0.
0.
0.
0.
0.
0.
0.
0.
0.
0.
0.
0.
0.
0.
0.
0.
77
9
61
47
74
58
52
61
78
49
41
61
49
78
81
67
33
37
45
49
8
69
164
ERPB
ERPC
ERPE
ERPI
ERPL
ERPP
ERPS
IA
ML
OPC
OPF
OPI
OPL
SD
SP
0.
0.
0.
0.
0.
0.
0.
0.
0.
0.
0.
0.
0.
0.
0.
0.
0.
0.
0.
0.
9
44
44
68
44
4
53
64
45
4
55
49
79
75
58
3
37
45
34
64
56
0.
0.
0.
0.
0.
0.
0.
0.
0.
0.
0.
0.
0.
0.
0.
0.
0.
0.
0.
0.
0.
0.
81
9
56
37
71
56
47
37
7
47
3
48
3
76
73
52
22
2
38
36
71
59
ER PB1
0.
0.
0.
0.
0.
0.
0.
0.
0.
0.
0.
0.
0.
0.
0.
0.
0.
0.
0.
0.
0.
0.
44
48
9
66
52
86
76
5
58
73
25
45
26
49
5
3
25
12
29
38
52
48
ER PB2
0.
0.
0.
0.
0.
0.
0.
0.
0.
0.
0.
0.
0.
0.
0.
0.
0.
0.
0.
0.
0.
0.
6
57
9
6
64
84
74
53
64
68
42
49
25
55
5
3
39
14
31
43
57
54
ER PB3
0.
0.
0.
0.
0.
0.
0.
0.
0.
0.
0.
0.
0.
0.
0.
0.
0.
0.
0.
0.
0.
0.
51
5
9
56
55
71
64
49
54
61
51
47
36
56
52
25
51
07
27
43
48
39
ER PB4
0.
0.
0.
0.
0.
0.
0.
0.
0.
0.
0.
0.
0.
0.
0.
0.
0.
0.
0.
0.
0.
0.
52
58
9
64
57
76
71
58
65
68
41
52
34
63
59
31
38
2
34
42
59
44
ER PB5
0.
0.
0.
0.
0.
0.
0.
0.
0.
0.
0.
0.
0.
0.
0.
0.
0.
0.
0.
0.
0.
0.
49
57
8
61
52
59
58
45
55
67
31
49
32
6
56
33
25
25
31
35
49
35
0.
0.
0.
0.
0.
0.
0.
0.
0.
0.
0.
0.
0.
0.
0.
0.
0.
0.
0.
0.
0.
0.
41
52
68
9
54
73
79
67
43
67
39
43
48
43
55
5
47
4
24
46
5
56
0.
0.
0.
0.
0.
0.
0.
0.
0.
0.
0.
0.
0.
0.
0.
0.
0.
0.
0.
0.
0.
0.
26
39
63
9
4
63
77
61
33
68
38
41
44
37
47
37
38
36
24
33
37
42
0.
0.
0.
0.
0.
0.
0.
0.
0.
0.
0.
0.
0.
0.
0.
0.
0.
0.
0.
0.
0.
0.
34
45
57
9
47
61
75
58
39
68
34
39
4
4
47
4
24
36
21
25
4
43
0.
0.
0.
0.
0.
0.
0.
0.
0.
0.
0.
0.
0.
0.
0.
0.
0.
0.
0.
0.
0.
0.
29
48
68
9
5
69
81
63
38
72
37
44
46
41
51
41
32
34
24
34
46
42
0.
0.
0.
0.
0.
0.
0.
0.
0.
0.
0.
0.
0.
0.
0.
0.
0.
0.
0.
0.
0.
0.
4
49
65
9
57
64
8
61
46
72
33
41
38
44
53
5
32
37
21
36
51
5
ER PE1
0.
0.
0.
0.
0.
0.
0.
0.
0.
0.
0.
0.
0.
0.
0.
0.
0.
0.
0.
0.
0.
0.
57
7
6
54
9
6
52
5
73
56
35
48
35
63
58
63
29
38
36
39
62
67
ER PE2
0.
0.
0.
0.
0.
0.
0.
0.
0.
0.
0.
0.
0.
0.
0.
0.
0.
0.
0.
0.
0.
0.
66
77
63
48
9
59
55
48
78
6
41
45
31
7
65
59
37
26
37
44
68
65
ER PE3
0.
0.
0.
0.
0.
0.
0.
0.
0.
0.
0.
0.
0.
0.
0.
0.
0.
0.
0.
0.
0.
0.
73
74
57
41
9
49
49
53
79
5
48
46
31
7
63
58
48
28
38
48
69
68
ER PE4
0.
0.
0.
0.
0.
0.
0.
0.
0.
0.
0.
0.
0.
0.
0.
0.
0.
0.
0.
0.
0.
0.
69
67
5
39
9
45
41
48
73
49
44
5
35
62
57
6
42
34
37
48
65
67
ER PE5
0.
0.
0.
0.
0.
0.
0.
0.
0.
0.
0.
0.
0.
0.
0.
0.
0.
0.
0.
0.
0.
0.
46
61
52
56
7
51
55
79
61
42
53
47
5
49
58
55
43
46
3
47
68
57
ER PI1
0.
0.
0.
0.
0.
0.
0.
0.
0.
0.
0.
0.
0.
0.
0.
0.
0.
0.
0.
0.
0.
0.
53
62
72
77
61
8
74
68
6
61
4
48
45
5
63
53
37
38
24
49
65
59
ER PI2
0.
0.
0.
0.
0.
0.
0.
0.
0.
0.
0.
0.
0.
0.
0.
0.
0.
0.
0.
0.
0.
0.
49
46
71
57
42
9
68
45
56
64
21
45
24
48
51
3
23
15
33
41
49
48
ER PI3
0.
0.
0.
0.
0.
0.
0.
0.
0.
0.
0.
0.
0.
0.
0.
0.
0.
0.
0.
0.
0.
0.
58
59
75
59
54
9
67
48
56
7
34
41
28
58
59
31
34
15
35
44
57
53
ER PI4
0.
0.
0.
0.
0.
0.
0.
0.
0.
0.
0.
0.
0.
0.
0.
0.
0.
0.
0.
0.
0.
0.
57
59
87
71
62
9
8
53
61
8
43
49
29
58
6
31
4
16
35
5
6
54
ER PI5
0.
0.
0.
0.
0.
0.
0.
0.
0.
0.
0.
0.
0.
0.
0.
0.
0.
0.
0.
0.
0.
0.
39
43
79
57
46
8
7
49
56
68
29
52
3
44
44
25
25
16
34
39
47
42
ER PL1
0.
0.
0.
0.
0.
0.
0.
0.
0.
0.
0.
0.
0.
0.
0.
0.
0.
0.
0.
0.
0.
0.
45
43
69
6
48
73
8
47
54
74
3
37
23
47
51
27
29
14
24
37
5
49
ER PL2
0.
0.
0.
0.
0.
0.
0.
0.
0.
0.
0.
0.
0.
0.
0.
0.
0.
0.
0.
0.
0.
0.
5
54
77
6
57
76
8
44
57
68
23
38
23
58
57
31
31
13
29
44
59
45
ER PL3
0.
0.
0.
0.
0.
0.
0.
0.
0.
0.
0.
0.
0.
0.
0.
0.
0.
0.
0.
0.
0.
0.
35
48
66
86
49
64
9
57
44
68
31
35
32
41
46
41
29
41
16
32
41
4
CI4
ER PC 1 ER PC 2 ERPC
ER PC 3 ER PC 4 ER PC 5
ERPE
ERPI
ERPL
ERPT Custome r Innovatio n Commit ment HRI
CI 0.
69
CI3
ERPB
Vol. 10, No. 14; 2014
0.
Items
Constr uct
Asian Social Science
B
www.ccsenet.org/ass
165
ERPP
ERPS
IA
ML
OPC
OPF
OPI
OPL
SD
SP
ERPT Custome r Innovatio n Commit ment HRI
ERPL
EXP
ERPI
EXI
ERPE
EXC
ERPC
ERPT
ERPB
ERPS
CI
ERPP
Vol. 10, No. 14; 2014
ER PL4
0.
0.
0.
0.
0.
0.
0.
0.
0.
0.
0.
0.
0.
0.
0.
0.
0.
0.
0.
0.
0.
0.
39
44
62
8
44
67
9
59
4
64
28
3
26
39
46
32
26
24
09
28
45
42
ER PL5
0.
0.
0.
0.
0.
0.
0.
0.
0.
0.
0.
0.
0.
0.
0.
0.
0.
0.
0.
0.
0.
0.
43
47
6
78
45
65
8
53
39
6
28
29
3
38
53
35
25
2
05
26
49
41
ER PP1
0.
0.
0.
0.
0.
0.
0.
0.
0.
0.
0.
0.
0.
0.
0.
0.
0.
0.
0.
0.
0.
0.
36
48
55
59
52
59
55
9
43
37
4
6
65
47
54
59
44
46
43
54
59
56
ER PP2
0.
0.
0.
0.
0.
0.
0.
0.
0.
0.
0.
0.
0.
0.
0.
0.
0.
0.
0.
0.
0.
0.
45
55
49
62
56
55
56
9
45
41
39
55
57
51
58
6
41
49
42
54
63
61
ER PP3
0.
0.
0.
0.
0.
0.
0.
0.
0.
0.
0.
0.
0.
0.
0.
0.
0.
0.
0.
0.
0.
0.
45
51
56
66
64
56
64
9
52
43
51
48
49
42
5
54
5
48
33
53
6
58
ER PP4
0.
0.
0.
0.
0.
0.
0.
0.
0.
0.
0.
0.
0.
0.
0.
0.
0.
0.
0.
0.
0.
0.
46
54
55
61
59
54
54
9
49
41
49
52
55
55
59
55
53
51
36
52
59
54
ER PP5
0.
0.
0.
0.
0.
0.
0.
0.
0.
0.
0.
0.
0.
0.
0.
0.
0.
0.
0.
0.
0.
0.
35
51
44
53
47
4
41
8
43
42
45
58
64
49
56
5
4
56
35
45
48
37
ER PS1
0.
0.
0.
0.
0.
0.
0.
0.
0.
0.
0.
0.
0.
0.
0.
0.
0.
0.
0.
0.
0.
0.
71
67
63
44
73
58
52
49
8
53
39
38
19
63
57
44
35
18
28
39
62
58
ER PS2
0.
0.
0.
0.
0.
0.
0.
0.
0.
0.
0.
0.
0.
0.
0.
0.
0.
0.
0.
0.
0.
0.
7
71
65
37
76
63
51
52
9
52
45
52
34
7
66
48
38
19
34
46
72
59
ER PS3
0.
0.
0.
0.
0.
0.
0.
0.
0.
0.
0.
0.
0.
0.
0.
0.
0.
0.
0.
0.
0.
0.
67
69
56
3
69
54
44
41
9
42
28
45
27
67
63
54
14
24
29
34
67
6
ER PS4
0.
0.
0.
0.
0.
0.
0.
0.
0.
0.
0.
0.
0.
0.
0.
0.
0.
0.
0.
0.
0.
0.
71
72
65
43
76
6
52
5
9
54
36
5
34
74
73
52
22
25
31
37
72
63
ER PS5
0.
0.
0.
0.
0.
0.
0.
0.
0.
0.
0.
0.
0.
0.
0.
0.
0.
0.
0.
0.
0.
0.
68
74
54
39
76
56
48
42
9
57
25
5
3
66
64
55
11
25
3
35
65
6
ER PT1
0.
0.
0.
0.
0.
0.
0.
0.
0.
0.
0.
0.
0.
0.
0.
0.
0.
0.
0.
0.
0.
0.
38
47
67
69
48
71
67
38
46
8
28
39
28
42
51
3
2
17
28
38
48
48
ER PT2
0.
0.
0.
0.
0.
0.
0.
0.
0.
0.
0.
0.
0.
0.
0.
0.
0.
0.
0.
0.
0.
0.
37
43
59
59
47
53
58
36
41
8
41
47
33
45
4
21
3
15
31
3
34
27
ER PT3
0.
0.
0.
0.
0.
0.
0.
0.
0.
0.
0.
0.
0.
0.
0.
0.
0.
0.
0.
0.
0.
0.
43
46
59
62
5
57
61
36
49
8
38
41
3
46
47
22
26
12
29
33
41
32
ER PT4
0.
0.
0.
0.
0.
0.
0.
0.
0.
0.
0.
0.
0.
0.
0.
0.
0.
0.
0.
0.
0.
0.
41
41
68
68
44
68
72
38
48
8
24
31
16
43
49
23
22
16
19
34
46
38
ER PT5
0.
0.
0.
0.
0.
0.
0.
0.
0.
0.
0.
0.
0.
0.
0.
0.
0.
0.
0.
0.
0.
0.
55
54
68
57
55
72
69
44
55
8
29
42
24
54
57
27
22
1
26
4
55
42
EX C1
0.
0.
0.
0.
0.
0.
0.
0.
0.
0.
0.
0.
0.
0.
0.
0.
0.
0.
0.
0.
0.
0.
39
42
36
33
51
33
29
48
38
33
9
58
61
39
44
37
68
41
45
55
41
54
EX C2
0.
0.
0.
0.
0.
0.
0.
0.
0.
0.
0.
0.
0.
0.
0.
0.
0.
0.
0.
0.
0.
42
47
42
41
51
39
36
48
37
38
66
67
39
49
39
72
49
48
62
42
5
EX C3
0.
0.
0.
0.
0.
0.
0.
0.
0.
0.
0.
0.
0.
0.
0.
0.
0.
0.
0.
0.
0.
0.
41
4
46
38
41
36
3
49
37
38
9
71
73
4
46
38
62
4
48
55
36
44
EXI 1
0.
0.
0.
0.
0.
0.
0.
0.
0.
0.
0.
0.
0.
0.
0.
0.
0.
0.
0.
0.
0.
0.
46
54
52
44
49
52
37
61
47
46
58
9
71
59
53
49
57
5
71
62
49
51
EXI 2
0.
0.
0.
0.
0.
0.
0.
0.
0.
0.
0.
0.
0.
0.
0.
0.
0.
0.
0.
0.
0.
0.
48
54
48
36
48
44
32
53
5
39
65
9
73
54
56
48
47
5
59
6
5
47
EXI 3
0.
0.
0.
0.
0.
0.
0.
0.
0.
0.
0.
0.
0.
0.
0.
0.
0.
0.
0.
0.
0.
0.
51
62
53
46
49
49
41
55
48
47
65
9
71
57
58
46
46
44
56
57
48
49
EX P1
0.
0.
0.
0.
0.
0.
0.
0.
0.
0.
0.
0.
0.
0.
0.
0.
0.
0.
0.
0.
0.
0.
32
49
34
44
32
37
3
57
27
28
53
78
9
45
52
53
42
58
65
55
46
46
EX P2
0.
0.
0.
0.
0.
0.
0.
0.
0.
0.
0.
0.
0.
0.
0.
0.
0.
0.
0.
0.
0.
0.
34
48
31
41
39
34
34
56
28
29
68
73
9
42
51
52
54
59
6
54
44
5
EX P3
0.
0.
0.
0.
0.
0.
0.
0.
0.
0.
0.
0.
0.
0.
0.
0.
0.
0.
0.
0.
0.
0.
21
32
2
33
36
2
16
53
27
21
67
6
8
23
4
54
57
58
38
54
32
44
EX P4
0.
0.
0.
0.
0.
0.
0.
0.
0.
0.
0.
0.
0.
0.
0.
0.
0.
0.
0.
0.
0.
0.
26
38
34
43
36
31
28
56
27
28
51
53
8
37
44
63
52
32
33
44
37
53
Items
Constr uct
Asian Social Science
B
www.ccsenet.org/ass
166
1
ERPB
ERPC
ERPE
ERPI
ERPL
ERPP
ERPS
IA
ML
OPC
OPF
OPI
OPL
SD
SP
0.
0.
0.
0.
0.
0.
0.
0.
0.
0.
0.
0.
0.
0.
0.
0.
0.
0.
0.
0.
0.
0.
66
71
52
24
58
48
34
4
66
45
28
48
28
9
71
31
15
13
43
27
66
38
HR E2
0.
0.
0.
0.
0.
0.
0.
0.
0.
0.
0.
0.
0.
0.
0.
0.
0.
0.
0.
0.
0.
0.
68
78
64
54
67
6
55
52
74
51
46
58
46
8
72
57
34
29
35
34
65
56
HR E3
0.
0.
0.
0.
0.
0.
0.
0.
0.
0.
0.
0.
0.
0.
0.
0.
0.
0.
0.
0.
0.
0.
6
74
5
43
58
54
47
56
63
45
29
44
43
8
81
46
28
34
43
4
74
52
HR I1
0.
0.
0.
0.
0.
0.
0.
0.
0.
0.
0.
0.
0.
0.
0.
0.
0.
0.
0.
0.
0.
0.
68
67
48
34
63
37
36
58
65
37
41
61
42
8
61
52
34
25
55
36
61
58
HR I2
0.
0.
0.
0.
0.
0.
0.
0.
0.
0.
0.
0.
0.
0.
0.
0.
0.
0.
0.
0.
0.
0.
72
73
53
35
65
45
44
51
64
43
31
56
35
8
68
45
29
23
48
34
69
51
HR I3
0.
0.
0.
0.
0.
0.
0.
0.
0.
0.
0.
0.
0.
0.
0.
0.
0.
0.
0.
0.
0.
0.
78
76
62
43
61
61
55
49
68
52
36
57
4
9
75
48
35
21
5
37
7
55
HR T2
0.
0.
0.
0.
0.
0.
0.
0.
0.
0.
0.
0.
0.
0.
0.
0.
0.
0.
0.
0.
0.
0.
56
64
42
28
58
37
28
35
54
45
3
44
27
8
66
28
25
26
5
32
63
41
HR T3
0.
0.
0.
0.
0.
0.
0.
0.
0.
0.
0.
0.
0.
0.
0.
0.
0.
0.
0.
0.
0.
0.
67
71
63
38
62
49
49
41
63
5
36
52
32
9
69
37
32
2
47
32
65
42
HR TI
0.
0.
0.
0.
0.
0.
0.
0.
0.
0.
0.
0.
0.
0.
0.
0.
0.
0.
0.
0.
0.
0.
71
74
58
4
54
52
52
33
62
53
36
49
31
9
7
34
24
15
44
23
64
46
0.
0.
0.
0.
0.
0.
0.
0.
0.
0.
0.
0.
0.
0.
0.
0.
0.
0.
0.
0.
0.
0.
56
68
51
49
54
54
4
55
56
56
52
58
57
67
8
46
39
35
56
53
67
54
0.
0.
0.
0.
0.
0.
0.
0.
0.
0.
0.
0.
0.
0.
0.
0.
0.
0.
0.
0.
0.
0.
76
78
55
48
61
56
53
47
67
56
47
54
47
75
9
52
31
3
37
33
76
61
0.
0.
0.
0.
0.
0.
0.
0.
0.
0.
0.
0.
0.
0.
0.
0.
0.
0.
0.
0.
0.
0.
74
75
46
36
55
45
49
54
64
35
36
48
44
73
8
49
31
27
35
36
78
55
0.
0.
0.
0.
0.
0.
0.
0.
0.
0.
0.
0.
0.
0.
0.
0.
0.
0.
0.
0.
0.
0.
7
81
55
49
6
55
57
52
67
53
32
49
42
75
9
49
21
36
35
41
79
52
0.
0.
0.
0.
0.
0.
0.
0.
0.
0.
0.
0.
0.
0.
0.
0.
0.
0.
0.
0.
0.
0.
68
83
63
63
73
66
64
68
65
62
48
6
54
77
9
53
4
43
48
51
81
63
ML 1
0.
0.
0.
0.
0.
0.
0.
0.
0.
0.
0.
0.
0.
0.
0.
0.
0.
0.
0.
0.
0.
0.
53
68
36
46
67
41
39
59
6
33
34
54
6
53
59
9
34
47
36
48
62
73
ML 2
0.
0.
0.
0.
0.
0.
0.
0.
0.
0.
0.
0.
0.
0.
0.
0.
0.
0.
0.
0.
0.
0.
48
53
21
32
54
27
26
52
47
14
29
43
53
41
46
9
3
53
32
41
49
72
ML 3
0.
0.
0.
0.
0.
0.
0.
0.
0.
0.
0.
0.
0.
0.
0.
0.
0.
0.
0.
0.
0.
0.
48
58
36
51
66
38
41
62
53
34
44
5
65
45
51
9
46
47
27
44
51
75
ML 4
0.
0.
0.
0.
0.
0.
0.
0.
0.
0.
0.
0.
0.
0.
0.
0.
0.
0.
0.
0.
0.
0.
46
6
35
5
63
37
4
6
5
29
4
47
62
48
53
9
44
49
24
39
49
72
OP C4
0.
0.
0.
0.
0.
0.
0.
0.
0.
0.
0.
0.
0.
0.
0.
0.
0.
0.
0.
0.
0.
0.
19
25
33
43
37
27
33
47
16
19
61
44
59
18
28
43
8
41
23
46
21
41
OP C5
0.
0.
0.
0.
0.
0.
0.
0.
0.
0.
0.
0.
0.
0.
0.
0.
0.
0.
0.
0.
0.
0.
11
14
3
29
22
25
22
45
06
11
48
4
51
18
17
33
8
31
39
53
17
37
OP C6
0.
0.
0.
0.
0.
0.
0.
0.
0.
0.
0.
0.
0.
0.
0.
0.
0.
0.
0.
0.
0.
0.
39
33
37
21
44
32
29
31
28
3
62
49
42
29
3
26
8
34
44
62
33
41
OP C7
0.
0.
0.
0.
0.
0.
0.
0.
0.
0.
0.
0.
0.
0.
0.
0.
0.
0.
0.
0.
0.
0.
35
4
35
33
43
33
26
48
36
32
61
45
46
43
42
35
8
51
49
63
37
4
OP F1
0.
0.
0.
0.
0.
0.
0.
0.
0.
0.
0.
0.
0.
0.
0.
0.
0.
0.
0.
0.
0.
0.
13
34
15
33
32
19
18
46
18
12
49
48
63
23
36
52
57
9
53
57
32
45
OP F2
0.
0.
0.
0.
0.
0.
0.
0.
0.
0.
0.
0.
0.
0.
0.
0.
0.
0.
0.
0.
0.
0.
06
22
16
29
29
19
23
44
2
15
24
37
37
18
23
3
2
7
28
24
23
23
OP F3
0.
0.
0.
0.
0.
0.
0.
0.
0.
0.
0.
0.
0.
0.
0.
0.
0.
0.
0.
0.
0.
0.
24
31
12
35
34
18
26
47
24
16
3
39
41
25
33
39
29
8
27
35
29
32
OPI 10
0.
0.
0.
0.
0.
0.
0.
0.
0.
0.
0.
0.
0.
0.
0.
0.
0.
0.
0.
0.
0.
0.
25
34
17
11
34
19
05
34
21
26
47
5
48
4
36
21
35
39
8
48
35
4
OPI 11
0.
0.
0.
0.
0.
0.
0.
0.
0.
0.
0.
0.
0.
0.
0.
0.
0.
0.
0.
0.
0.
0.
26
44
37
3
42
36
27
4
34
36
37
61
43
45
36
29
33
48
7
55
35
32
IA1 Inform ation and Analysi s
IA2 IA3 IA4 IA5
Manage ment Leaders hip
Custom er
Financi al
Internal Process
ERPT Custome r Innovatio n Commit ment HRI
CI
HRM
Vol. 10, No. 14; 2014
HR E1
Items
Constr uct
Asian Social Science
B
www.ccsenet.org/ass
167
ERPB
ERPC
ERPE
ERPI
ERPL
ERPP
ERPS
IA
ML
OPC
OPF
OPI
OPL
SD
SP
0.
0.
0.
0.
0.
0.
0.
0.
0.
0.
0.
0.
0.
0.
0.
0.
0.
0.
0.
0.
0.
0.
22
35
27
17
26
29
14
3
22
19
29
48
38
41
38
17
44
37
8
56
4
29
OPI 9
0.
0.
0.
0.
0.
0.
0.
0.
0.
0.
0.
0.
0.
0.
0.
0.
0.
0.
0.
0.
0.
0.
34
46
31
22
29
31
17
33
32
22
45
6
59
5
43
36
43
3
8
47
41
5
OP L12
0.
0.
0.
0.
0.
0.
0.
0.
0.
0.
0.
0.
0.
0.
0.
0.
0.
0.
0.
0.
0.
0.
31
42
51
46
48
47
43
55
43
48
57
54
48
31
4
38
59
48
52
8
43
44
OP L13
0.
0.
0.
0.
0.
0.
0.
0.
0.
0.
0.
0.
0.
0.
0.
0.
0.
0.
0.
0.
0.
0.
18
27
26
28
3
29
21
49
2
26
43
49
51
27
33
34
59
49
54
8
36
32
OP L14
0.
0.
0.
0.
0.
0.
0.
0.
0.
0.
0.
0.
0.
0.
0.
0.
0.
0.
0.
0.
0.
0.
51
47
48
31
47
57
44
4
44
44
42
51
37
42
46
33
46
17
45
8
48
44
OP L15
0.
0.
0.
0.
0.
0.
0.
0.
0.
0.
0.
0.
0.
0.
0.
0.
0.
0.
0.
0.
0.
0.
31
41
29
21
44
35
24
45
35
23
53
57
59
29
4
45
59
5
58
9
44
45
0.
0.
0.
0.
0.
0.
0.
0.
0.
0.
0.
0.
0.
0.
0.
0.
0.
0.
0.
0.
0.
0.
72
73
55
42
62
59
52
61
69
48
39
51
47
7
82
51
27
28
39
43
9
63
0.
0.
0.
0.
0.
0.
0.
0.
0.
0.
0.
0.
0.
0.
0.
0.
0.
0.
0.
0.
0.
0.
69
77
59
47
73
6
58
62
69
5
4
49
41
71
79
49
36
32
42
52
9
6
0.
0.
0.
0.
0.
0.
0.
0.
0.
0.
0.
0.
0.
0.
0.
0.
0.
0.
0.
0.
0.
0.
72
78
55
47
74
56
5
58
71
52
37
49
42
77
78
57
3
38
49
49
9
61
0.
0.
0.
0.
0.
0.
0.
0.
0.
0.
0.
0.
0.
0.
0.
0.
0.
0.
0.
0.
0.
0.
48
52
3
33
52
39
36
46
48
27
34
36
49
43
5
66
36
35
35
38
53
8
0.
0.
0.
0.
0.
0.
0.
0.
0.
0.
0.
0.
0.
0.
0.
0.
0.
0.
0.
0.
0.
0.
52
62
48
54
69
52
53
49
57
47
39
48
5
49
57
75
41
43
41
45
59
9
0.
0.
0.
0.
0.
0.
0.
0.
0.
0.
0.
0.
0.
0.
0.
0.
0.
0.
0.
0.
0.
0.
61
65
56
46
74
6
48
57
69
43
56
57
52
56
58
7
55
32
45
52
62
9
0.
0.
0.
0.
0.
0.
0.
0.
0.
0.
0.
0.
0.
0.
0.
0.
0.
0.
0.
0.
0.
0.
61
63
42
46
64
51
43
6
61
42
51
47
48
55
63
64
39
44
42
41
59
8
SD1 Service Design
SD2 SD3 SP1
Stratgic Plannin g
ERPT Custome r Innovatio n Commit ment HRI
CI
Learnin g and Growth
Vol. 10, No. 14; 2014
OPI 8
Items
Constr uct
Asian Social Science
B
www.ccsenet.org/ass
SP2 SP3 SP4
4.1.2 The Convergent Validity The convergent validity is the degree of a group of items converges to measure a specific variable (Hair et al., 2010). In SEM literature, it can be confirmed by testing the composite reliability, the loading, and the average variance extracted (AVE). To consider the items are highly loaded and statistically significant, factor loading should at least 0.7, AVE is at least 0.5, and the composite reliability is at least 0.7. Table 3 shows that all these criteria have been achieved and confirmed. Therefore, the results of the outer model (measurement model) have suitable convergent validity (Bagozzi & Yi, 1988). Table 3. The convergent validity analysis Construct Benchmarking
Continuous Improvement
ERP-Business Process Skills
ERP-Change Readiness
Items B1 B2 B3 CI1 CI2 CI3 CI4 ERPB1 ERPB2 ERPB3 ERPB4 ERPB5 ERPC1
Loadings 0.928 0.884 0.877 0.902 0.926 0.867 0.875 0.851 0.876 0.873 0.919 0.763 0.861
168
Cronbach's Alpha
CRa
AVEb
0.852
0.917
0.724
0.915
0.940
0.797
0.909
0.933
0.736
0.942
0.956
0.812
www.ccsenet.org/ass Construct
ERP-Executive Commitment
ERP-IT Skills
ERP-Learning
ERP-Project Management
ERP-Strategic IT Planning
ERP-Training
Excellence-Customer Focus
Excellence-Innovation
Excellence-Personnel Commitment
HRM
Asian Social Science Items ERPC2 ERPC3 ERPC4 ERPC5 ERPE1 ERPE2 ERPE3 ERPE4 ERPE5 ERPI1 ERPI2 ERPI3 ERPI4 ERPI5 ERPL1 ERPL2 ERPL3 ERPL4 ERPL5 ERPP1 ERPP2 ERPP3 ERPP4 ERPP5 ERPS1 ERPS2 ERPS3 ERPS4 ERPS5 ERPT1 ERPT2 ERPT3 ERPT4 ERPT5 EXC1 EXC2 EXC3 EXI1 EXI2 EXI3 EXP1 EXP2 EXP3 EXP4 HRE1 HRE2 HRE3 HRI1 HRI2 HRI3 HRT2
Loadings 0.932 0.880 0.942 0.888 0.861 0.909 0.925 0.911 0.714 0.840 0.880 0.891 0.934 0.817 0.778 0.811 0.851 0.894 0.842 0.903 0.905 0.895 0.895 0.755 0.840 0.887 0.901 0.904 0.862 0.825 0.766 0.850 0.847 0.805 0.927 0.951 0.933 0.884 0.908 0.910 0.855 0.862 0.837 0.802 0.862 0.785 0.785 0.793 0.844 0.889 0.776 169
Vol. 10, No. 14; 2014 Cronbach's Alpha
CRa
AVEb
0.915
0.938
0.752
0.922
0.941
0.763
0.892
0.921
0.699
0.920
0.941
0.761
0.926
0.944
0.773
0.877
0.911
0.671
0.930
0.956
0.878
0.883
0.928
0.811
0.860
0.905
0.704
0.945
0.954
0.696
www.ccsenet.org/ass Construct
Information and Analysis
Management Leadership
Customer
Financial
Internal Process
Learning and Growth
Service Design
Stratgic Planning
Asian Social Science Items HRT3 HRTI IA1 IA2 IA3 IA4 IA5 ML1 ML2 ML3 ML4 OPC4 OPC5 OPC6 OPC7 OPF1 OPF2 OPF3 OPI10 OPI11 OPI8 OPI9 OPL12 OPL13 OPL14 OPL15 SD1 SD2 SD3 SP1 SP2 SP3 SP4
Loadings 0.905 0.860 0.801 0.910 0.848 0.888 0.902 0.924 0.892 0.938 0.920 0.799 0.824 0.830 0.777 0.866 0.740 0.762 0.794 0.719 0.822 0.823 0.771 0.803 0.754 0.869 0.892 0.943 0.890 0.841 0.884 0.894 0.846
Vol. 10, No. 14; 2014 Cronbach's Alpha
CRa
AVEb
0.920
0.940
0.758
0.938
0.956
0.844
0.823
0.882
0.653
0.715
0.833
0.625
0.799
0.869
0.625
0.813
0.877
0.641
0.894
0.934
0.826
0.889
0.923
0.751
a: CR = (Σ factor loading) 2 / {(Σ factor loading) 2) + Σ (variance of error)} b: AVE = Σ (factor loading) 2 / (Σ (factor loading) 2 + Σ (variance of error)} 4.1.3 The Discriminant Validity The literature of SEM defined the discriminant validity as the degree of items can distinguish a construct from other model’s constructs. According to Compeau et al. (1999), items of each construct should have variances among them more than with other constructs in the model. Table 4 shows that the diagonal line of values that contain the square root of AVE and below it there are the correlations of the constructs. To examine the discriminant validity, the values of the diagonal line should be compared with other off diagonal ones. As we can see in the table, the values of the diagonal line are higher than others in their respective columns and rows and therefore confirmed the discriminant validity of the model based on Fornell and Larcker’s (1981) criterion.
170
www.ccsenet.org/ass
Asian Social Science
Vol. 10, No. 14; 2014
B
0. 85
CI
0. 84
0. 89
Commit ment Custom er
0. 34
0. 50
0. 84
0. 43
0. 46
0. 72
0. 94
ERPB
0. 60
0. 63
0. 36
0. 44
0. 86
ERPC
0. 38
0. 52
0. 48
0. 40
0. 71
0. 90
ERPE
0. 72
0. 81
0. 42
0. 51
0. 65
0. 55
0. 87
ERPI
0. 59
0. 62
0. 36
0. 39
0. 86
0. 74
0. 61
0. 87
ERPL
0. 51
0. 57
0. 32
0. 34
0. 80
0. 87
0. 59
0. 83
0. 84
ERPP
0. 47
0. 59
0. 66
0. 51
0. 60
0. 69
0. 64
0. 61
0. 62
0. 87
ERPS
0. 79
0. 81
0. 33
0. 40
0. 69
0. 44
0. 84
0. 66
0. 56
0. 53
0. 88
ERPT
0. 52
0. 57
0. 32
0. 39
0. 78
0. 77
0. 60
0. 79
0. 80
0. 47
0. 59
0. 82
HRI
0. 81
0. 81
0. 44
0. 42
0. 66
0. 46
0. 73
0. 60
0. 54
0. 56
0. 77
0. 56
0. 83
IA
0. 79
0. 71
0. 56
0. 49
0. 62
0. 56
0. 70
0. 64
0. 61
0. 64
0. 74
0. 60
0. 85
0. 87
Innovat ion
0. 54
0. 63
0. 79
0. 70
0. 57
0. 47
0. 54
0. 54
0. 41
0. 62
0. 54
0. 49
0. 63
0. 62
0. 90
ML
0. 53
0. 65
0. 65
0. 40
0. 35
0. 49
0. 68
0. 39
0. 40
0. 64
0. 58
0. 30
0. 51
0. 57
0. 53
0. 92
OPC
0. 33
0. 36
0. 61
0. 72
0. 42
0. 39
0. 46
0. 37
0. 34
0. 53
0. 28
0. 29
0. 34
0. 37
0. 55
0. 42
0. 81
OPF
0. 18
0. 38
0. 62
0. 46
0. 18
0. 41
0. 40
0. 23
0. 27
0. 57
0. 25
0. 17
0. 28
0. 39
0. 53
0. 53
0. 49
0. 79
OPI
0. 34
0. 50
0. 59
0. 50
0. 36
0. 25
0. 41
0. 37
0. 20
0. 43
0. 35
0. 32
0. 55
0. 48
0. 69
0. 33
0. 49
0. 49
0. 79
OPL
0. 40
0. 48
0. 62
0. 61
0. 47
0. 39
0. 52
0. 51
0. 40
0. 59
0. 43
0. 43
0. 39
0. 49
0. 66
0. 47
0. 70
0. 53
0. 65
0. 80
SD
0. 78
0. 84
0. 48
0. 43
0. 62
0. 50
0. 77
0. 64
0. 59
0. 66
0. 77
0. 55
0. 80
0. 88
0. 55
0. 58
0. 34
0. 36
0. 48
0. 53
0. 91
SP
0. 64
0. 70
0. 57
0. 52
0. 52
0. 52
0. 75
0. 59
0. 52
0. 62
0. 68
0. 46
0. 59
0. 66
0. 55
0. 79
0. 50
0. 44
0. 48
0. 51
0. 68
SP
SD
OPL
OPI
OPF
OPC
ML
Innovation
IA
HRI
ERPT
ERPS
ERPP
ERPL
ERPI
ERPE
ERPC
ERPB
Customer
CI
B
Constru ct
Commitment
Table 4. Correlation and discriminant validity
0. 87
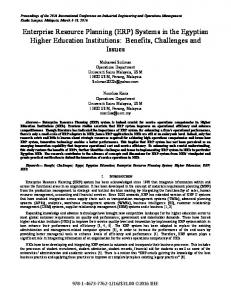
4.2 The Inner Model (Structural Model), and Hypotheses Testing 4.2.1 Testing the Direct Hypotheses After testing the validity and reliability of the construct, the next step is to examine in the inner model through hypotheses testing by running Algorithm and Bootstrapping in PLS. Figure 2 and Table 5 illustrated the results.
171
www.ccsenet.org/ass
Asian Social Science
Vol. 10, No. 14; 2014
Figure 2. Hypotheses testing results Table 5. Hypotheses testing results No H1 H2 H3 H4 H5 H6
Hypothesis ERP-> Performance ERP-> TQM ERP-> Excellence TQM-> Performance TQM-> Excellence Excellence-> Performance
Path Coefficient 0.579*** 0.841*** 0.634*** 0.605*** 0.684*** 0.825***
Standard Error 0.038 0.019 0.041 0.047 0.047 0.024
T Value 15.293 44.301 15.337 12.973 14.422 34.747
P Value 0.000 0.000 0.000 0.000 0.000 0.000
Decision Supported Supported Supported Supported Supported Supported
***:p