bapa untuk anak-anak mereka dan prestasi mental anak-anak. ... who achieved
higher IQ scores had appropriate play materials and parents .... manual
byWeschsler (1963). ... TABLE 5. Mean scores and standard deviations of
subscales ofWPPSI. Subscales. Mean. SD ... The WPPSI test generated three
scores, namely ...
ISSN: 0128-7702 © Universiti Pertanian Malaysia Press
PertanikaJ. Soc. Sci. & Hum. 2(1): 21-28 (1994)
The Relationship between Quality of Home Environment and Mental Scores of Children attending the UPM Laboratory Preschool* ROHANI ABDULlAH, SITI NOR YAACOB, ROZUMAH BAHARUDIN Department of Family Developmen t Studies, Universiti Pertanian Malaysia, 43400 UPM Serdang, Selangor Darnl Ehsan, Malaysia.
Keywords: preschool children, mental performance, home environment, family background ABSTRAK
Kajian ini bertujuan untuk menentukan perkaitan di antara kualiti persekitaran rumah yang disediakan oleh ibu bapa untuk anak-anak mereka dan prestasi mental anak-anak. Kajian ditumpukan kepada 64 orang kanak-kanak berumur eli an tara 5 hingga 6 tahun, yang menghadiri Makmal Prasekolah Universiti Pertanian Malaysia. Hasil kajian menunjukkan secara keseluruhannya kanak-kanak yang terlibat di dalam kajian ini mempunyai keluarga yang menyediakan persekitaran rumah yang menggalakkan. Selaras dengan kajian-kajian yang lalu, kualiti persekitaran rumah responden mempunyai perkaitan dengan latarbelakang keluarga. Kedua-dua pendidikan dan pendapatan ibu bapa mempunyai perkaitan dengan kualiti persekitaran rumah. Kualiti persekitaran rumah juga elidapati mempunyai perkaitan yang signifikan dengan prestasi mental kanak-kanak. Kanak-kanak daripada persekitaran rumah yang meransang kognitif memperolehi skor yang lebih tinggi di dalam semua sub-skala Weschler Preschool and Primary Scales of Intelligence daripada kanak-kanak lain dalam kajian. ABSTRACT
The purpose of this study was to determine the relationship between the quality of home environment that parents provide for their children and the children's mental performance. The study focused on 64 children, aged 5 to 6 years, from the Universiti Pertanian Malaysia Laboratory Preschool. Results of the study show that, generally, most of the children came from a relatively supportive home environment. Consistent with past research, the quality of home environment correlated with family background. Both parents' education and income correlated with the quality of the home environment. The quality of the home environment correlated significantly with the children's mental performance. Children from a cognitively stimulating home environment achieved higher scores on all the subscales of the Weschler Preschool and Primary Scales of Intelligence.
INTRODUCTION Of the various environmental factors that influence development during early childhood, the family and home environment represents one of the most significant factors in a young child's life. Previous studies have provided evidence that a secure child who has had a harmonious and positive relationship with his parents tends to become a competent, responsible and productive adult (Belsky et al. 1984; Maccoby and Martin, 1983). Findings from recent studies also support the association between home environment and a child's level of development during early childhood (Beckwith and Cohen, 1988; Bradley and
Caldwell, 1989; Bradley and Casey, 1984; Bradley et al., 1989; Bullock and Pennington, 1988; Ninio and Rinott, 1988; Rozumah and Luster, 1992). These studies revealed that a home with appropriate tools for stimulation and a warm, facilitative relationship between parents and children made up the best combination that would encourage optimal learning in children. Bee (1985) in her review of past studies summarized that the home environment of children who achieved higher IQ scores had appropriate play materials and parents who were democratic, emotionally and verbally responsive and had realistic goals for their children. A study by Rohani
• An earlier version of this paper was presented at the 'Seminar Toward Enhancing the Quality of Life', Universiti Pertanian Malaysia, Serdang, Selangor, 18th December 1989.
Rohani Abdullah, Siti NorYaacob and Rozumah Baharudin
et al. (1989) reported similar findings. The mental abilities of the children were associated with the availability of appropriate play materials, variety of stimulation, organization of the physical environment and availability of language and academic stimulation within the home environment. Bradley et al. (1989) reported a collaborative study which also provided similar evidence. The study found that measures of specific aspects of the child's home environment such as parental responsitivity and availability of stimulating play materials were more strongly related to children's cognitive development than global measures of environmental quality such as family socio-economic status. The importance of certain aspects of the home environment on children's achievement was also investigated by Rozumah (1992). The study found that children who did well on achievement tests had mothers who provided more cognitively stimulating home environments. Children whose parents had a higher level of education and a higher family income were also found to perform better on the tests. The effect of the early home environment is not transient. Longitudinal studies have indicated that children who had experienced a stimulating home environment during their childhood years tended to thrive better at schools (Bradley and Caldwell, 1984a; Bradley et al., 1988a; Bradley et al., 1988b). The early home environment is therefore a valuable indicator of the learning environment available to the child early in life and the potential performance of the child when he enters formal schooling. The present study was designed to determine the relationship between the quality of home environment and the children's level of mental tests performance with three specific objectives in mind: 1) To determine the quality of the home environment available to the preschool child; 2) To determine the relationship between family background and the quality of the children's home environment; and 3) To determine the relationship between the quality of the home environment and the children's mental performance. METHODOLOGY
Sample Subjects for the study were 64 children aged 5 to 6 years from the Universiti Pertanian Malaysia 22
Laboratory Preschool. Most (90%) of the children were Malays, and the rest were Indians and Chinese. Fifty-two percent were males, and 48% were females. Instrument
a.
Home Inventory
The quality of the children's home environmen t was assessed using the Preschool Version of the HOME (Home Observation for Measurement of the Environment) Inventory by a trained research assistant. The HOME has been shown to be a highly reliable and valid measure, and a strong predictor of child outcomes (Bradley and Caldwell, 1984a; Gottfried, 1984; Suriani, 1988). Suriani found an alpha coefficient of .89 for the HOME in her study on Malaysian children. The preschool HOME Inventory is an observation/interview technique that assesses the quality of physical, cognitive, social and emotional stimulation available to the child within the home environment. The Preschool Version of the HOME Inventory (henceforth HOME) is composed of eight subscales. These subscales include: 1) toys, games and reading materials; 2) language stimulation; 3) physical environment; 4) pride, affection and warmth; 5) stimulation of academic behavior, 6) modeling and encouragement of social maturity; 7) variety of experience; and 8) acceptance. Each item of the subscales is scored by giving 1 point for the presence of stimulation or 0 for the absence ofstimulation for the child within the horne. The total HOME is determined by adding scores ofthe 8 subscales of HOME. High scores indicate high quality home environment. Caldwell and Bradley (1984) reported an internal consistency of .93 for HOME. HOME was translated into Bahasa Melayu (the national Malaysian Language) and retranslated into English. A ninety-five percent agreement was calculated between the original and the retranslated versions. b.
Weschler Preschool and Primary Scales of Intelligence (WPPS1).
The WPPSI, designed to assess the intellectual abilities of preschool children, are divided into 10 major components: 1) information; 2) vocabulary; 3) arithmetic; 4) similarities; 5) comprehension; 6) animal house; 7) picture completion;
PertanikaJ. Soc. Sci. & Hum. Vol. 2 No.1 1994
The Relationship between Quality of Home Environment and Mental Scores of Preschool Children
8) mazes; 9) geometric design; and 10) block design. Each component of the WPPSI is scored according to specific criterion as described in the manual byWeschsler (1963). Weschsler found a strong correlation between the WPPSI and the Stanford-Binet Intelligence Scale indicating that the WPPSI is a reliable measure of children's mental performance. The first five components (1-5) are calculated to make up the Verbal IQ while the second group of five components (6-10) make up the Performance IQ. The scores of all ten components are combined to calculate the Full IQ. The WPPSI was administered in Bahasa Melayu.
Procedure The WPPSI test was individually administered to the children in their preschool setting. A home visit was then arranged. The parents were allowed to choose the time at their own convenience. During the home visit, the research assistant conversed with the parents on topics related to the family background, the target child's abilities and how parents usually spend their time with the target child. At the same time the research assistant would mark her checklist on the HOME Inventory, questioning the parents on the items which she could not observe herself. The visit lasted, on an average, about an hour. To determine the relationships between the independent and dependent variables the Pearson Correlation analysis was used. RESULTS
Family Background The education level of the respondents' parents ranged from primary education to doctoral degrees in specific fields. Table 1 indicates that 22% of the children's fathers had masters degrees and 24% had the Malaysian Certificate of Education. Twenty-three percent of the mothers had the Malaysian Certificate of Education. In addition, 81 % of the mothers involved in the study were employed outside the home. The parents' monthly income ranged from below RM500 to above RM3000 (Table 2). Most (34%) of the fathers earned between RM500 to RM999 while most of the mothers (37%) earned less than RM500 per month. Almost one quarter of the fathers earned more than RM2000.
TABLE 1 Percentage distribution of parents' educational background Level of education
Father
N Primary education 4 Lower Certificate of 6 Education/SRP Malaysian Certificate 16 of Education/SPM Higher School 4 Certificate/STPM Diploma 2 Degree 3 Masters 14 Ph.D 5 Not available 10
%
Mother N %
6.0 10.8
6 5
9.4 7.8
24.1
15
23.4
4.8
15
23.1
3.1 4.7 21.8 7.8 15.6
4 9 10 5 8
6.3 14.0 15.6 7.8 12.5
64 100.0
64 100.0
TABLE 2 Percentage distribution of parent's monthly income
Income (RM)
Father N %
Mother N %
Less than RM500 500 - 999 1000 -1499 1500 - 1999 2000 - 2499 2500 - 2999 Above 3000 Not available
10 22 10 4 7 3 5 3
24 16 5 5 8 1 4 1
TOTAL
64 100.0
15.6 34.4 15.6 6.3 10.9 4.7 7.8 4.7
37.4 25.0 7.8 7.8 12.5 1.6 6.~~
LEi
64 100.0
In terms of family size, a majority of the respondents came from a family of four to six members (Table 3). This is a relatively average family size, that is, a family of two to four children. The largest family size among the respondents was 10 persons. TABLE 3 Percentage distribution offamily size Family size
N
%
Less than 4 4-6 Above 7
1 56 7
1.6 87.5 10.9
TOTAL
64
100.0
PertanikaJ. Soc. Sci. & Hum. Vol. 2 No.1 1994
23
Rohani Abdullah, Siti NorYaacob and Rozumah Baharudin
HOME and Mental Scores
Table 4 presents the results of the assessment of the quality of the children's home environment. In comparison to Caldwell and Bradley's (1984) report on the preschool version of the HOME Inventory, the respondents scored relatively high on three subscales of the HOME: verbal stimulation, academic stimulation and modeling of social maturity. The mean for the rest of the subscales (toys, game and materials; physical environment; warmth and affection; and acceptance) was about the same. However, the respondents scored much lower in the variety of experience subscale when compared to the mean reported by Caldwell and Bradley (1984).
Toys, games and reading Verbal stimulation Physical environment Warmth and affection Academic stimulation Modeling Variety of experiences Acceptance Total HOME (P)
Mean
SD
Information Vocabulary Arithmetic Similarities Cornprehension Animal house Picture completion Mazes Geometric design Block design
10.50 9.42 11.09 12.95 9.05 10.64 12.92 12.58 12.75 14.05
2.44 1.86 2.47 2.70 2.25 2.65 2.31 2.16 2.63 1.78
IQ scores
Mean
SD
6.02 7.60 5.97 6.12 4.66 3.92 6.48 3.18
0.60 0.55 0.23 0.80 0.67 0.86
43.95
3.69
1.12
0.59
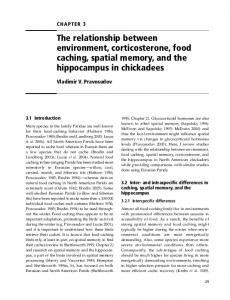
The results of the children's scores on the WPSSI test are shown in Table 5. As noted earlier, the WPPSI was used to assess the preschool children's intellectual abilities. The WPPSI results showed that the respondents had lower means for five of the subscales than those reported by Weschler (1967). With reference to Table 5, the respondents in this study had lower means for information, vocabulary, comprehension, animal house and picture completion. Mean scores for arithmetic, similarities, mazes, geometric design and block design did not differ much from those reported by Weschler (1967). The WPPSI test generated three scores, namely, Verbal IQ, Performance IQ, and Full IQ. A majority of the respondents (72%), obtained above average scores (110-129) on Performance IQand a large proportion (48%) obtained above average scores on Full IQ (Table 6). 24
Subscales
TABLE 6 Percentage distribution of WPPSI lQ scores
TABLE 4 Mean scores and standard deviations for pre-school home inventory HOME
TABLE 5 Mean scores and standard deviations of subscales ofWPPSI
Verbal Performance Overall
%
%
Below 90 (learning 6.3 disability) 90 - 109 (average) 68.7 110 - 129 (above 25.0 average) Above 130 (superior) 0.0
4.7
3.1
10.9 71.9
45.3 48.4
12.5
3.1
%
Relationship between HOME and Family Background
The results of the study indicated that the total HOME and one subscale of the HOME ( toys, games, and materials) were significantly related to four of the family variables: father's education, mother's education, father's income and mother's income. Table 7 shows that toys, games and reading materials were significantly related to all the fourvariabes, i.e. father's education (r =.75, p < .01), mother's education (r = .64, P < .01), father's income (r = .64, P < .01), mother's income (r = .50, P < .01). The total HOME was related significantly to all the four family variables: Father's education (r= .68, p < .01), mother's education (r = .59, P < .01), father's income (r = .57, P < .01) and mother's income (r = .46, P < .01). Variety of experience was significantly related to father's education (r = .40, P < .01) and acceptance was significantly related to mother's income (r = .33, P < .01). Other subscales of the HOME were also related to the family background variables;
PertanikaJ. Soc. Sci. & Hum. Vol. 2 No.1 1994
The Relationship between Quality of Home Environment and Mental Scores of Preschool Children TABLE 7 Correlations between selected family background and preschool HOME family background
HOME Toys, games and materials Verbal stimulation Physical environment Warmth and affection Academic stimulation Modeling Variety of experiences Acceptance Total HOME (P)
Father's education
Mother's education
Father's income
Mother's mcome
.64*
50*
.75*
.64*
.14
.11
-.03
-.20
.09
.09
.07
.12
.12
.20
.21
.28
.16 .28
.27 .24
.17 .26
.16
.40* .27 .68*
.25 .29 .59*
.32 .15 .57*
.11 .33* .46*
.~',Q
* p < .01 however, the relationships were not significant at the .05 level.
TABLE 8 Correlation between selected family background factors and selected subscales of WPPSI
Relationship between Mental Scores and Family Background Correlational analyses computed between the children's WPPSI scores and family background produced several significant findings. The subscales of WPPSI tended to correlate significantly with mother's education, father's income and mother's income (Table 8). Mother's education correlated significantly with vocabulary (r = .35, P < .01) and verbal (r =.33, p < .01). Mother's income was found to correlate significantly with information (r =.37, p < .01), vocabulary (r=.47, p < .01), animal house (r =.35, p < .01) and Verbal IQ (r =.40, p < .01). Father's income correlated significantly with information (r = .34, P < .01), block design (r = .36, P < .01), and Verbal IQ (r = .38, P < .01). These findings suggest that the more educated the parents are, the more likely they will structure their home environment in ways that encourage children's intellectual development. In addition, parents with higher income may be more able financially to provide educational resources that promote positive development in children.
family background
WPPSI
Mother's education
Information Vocabulary Animal house Block design VerbalIQ
.28 .35* .16 .31 .33*
Father's Income
Mother's income
.34* .36* .22 .36* .38*
.37* .47* .35 .28 .40*
* p < .01 Relationship between HOME and Children's Mental Performance Correlational analyses to determine the relationships between the quality of the children's home environment and their performance on the WPPSI showed that three HOME subscales correlated significantly with WPPSI subscales. Table 9 shows that toys, games and materials correlated significantly with information (r =.45, p < .01), similarities (r =.36, p < .01), block design (r =.33, p < .01), Verbal IQ (r =.42, p < .01) and Full IQ (r =.43, p < .01). Warmth and affection correlated
PertanikaJ. Soc. Sci. & Hum. Vol. 2 No.1 1994
25
Rohani Abdullah, Siti Nor Yaacob and Rozumah Baharudin
TABLE 9 Correlations between selected subscales of WPPSI and Preschool HOME HOME
WPPSI
toys, games and materials
warmth and affection
academic stimulation
Total HOME
.45* .20 .36* .31 .15 .33* .42* .43*
.04 .47* .18 .36* .34* .01 .39* .34*
.21 .22 .04 .34* -.01 .II .23 .17
.32 .28 .29 .35* .08 .25 .38* .30
Information Vocabulary Similarities Comprehension Picture completion Block design VerbalIQ Full IQ *p