The Repeatability of System Level ESD Test and Relevant ESD Generator Parameters Jayong Koo, Qing Cai, and David Pommerenke Electrical and Computer Engineering Missouri University of Science and Technology Rolla, MO, U.S.A.
[email protected] Abstract— Some system level ESD tests do not repeat well if different ESD generators are used. For improving the test repeatability, ESD generator specifications were considered to be changed and a world wide Round Robin test were performed in 2006 to compare the modified and unmodified ESD generators. The test results show the failure level variations up to 1:3 for an EUT among eight different ESD generators. Multiple ESD parameters including discharge currents and transient fields have been measured. This paper tries to find which parameters would predict the failure level the best in general. The transient fields show large variations among different ESD generators. The voltage induced in a semi-circular loop and the ringing after first discharge current peak show the best correlation to failure levels. The regulation on the transient field is expected to improve the test repeatability. Keywords- Electrostatic Discharge; ESD, Round Robin test, correlations, failure levels, ESD parameters
I. INTRODUCTION The objective of system level ESD testing is two fold: ensuring adequate robustness of electronic systems against real world ESD and passing a standardized test as this is often a legal or company’s internal requirement for selling a product. When passing a legal requirement an unambiguous pass/fail determination is required. However, it is well known that all EMC tests suffer from reproducibility problems. This is especially true for ESD testing [1]-[4]. Owing to the large variation nature of the natural ESD phenomena, a reference ESD event has been introduced in the standard, IEC 61000-4-2 [5]. This document describes the discharge current waveform. In the early 1990’s testing has been moved from air discharge to contact mode testing to avoid the effect of arc length variations in air discharge [6] to improve reproducibility. In spite of this and other steps taken to improve the reproducibility of test results, variations as much as by a factor of 2 in passing test voltage are common. Thus, the site-to-site variation of test result often leads to regulatory problems and may cause redesigns for improving the product’s immunity if an EUT turns out to be especially sensitive to a specific model of ESD generators used at that test site. A standard needs to regulate the parameters that determine the severity of the tests. However, there has been and still is considerable confusion about which parameters determine the severity of ESD testing. Traditionally the effort to improve the
Kai Wang*, John Mass**, Masayuki Hirata***, and Andy Martwick* * Intel Corporation, Hillsboro, OR, U.S.A. ** IBM Corporation, Rochester, MN, U.S.A. *** Fuji Xerox, Kanagawa, Japan test repeatability has been focused on defining the right discharge current [7], [8]. This thought guided the standard formulation in its early stage, resulting in the four parameters that define the discharge current specification [5]: rise time, peak current, current at 30 ns and current at 60 ns. However, an ESD event by an ESD generator has critically different characteristics from the human ESD model. • The ESD energy is stored in a small discrete capacitor. • A ground strap is used for the current return path. • The pulse shaping network is used to smooth the discharge current. It is true that the transient field variation is partially due to the discharge current variation, however, the differences listed above also cause other uncertainties in the transient field. Therefore, even if all ESD generators could have identical discharge current, the transient fields may be significantly different. Then what would be the correct way to represent the field radiation? It has been known that the transient fields are different among ESD generators from different manufacturers [2], [6]. The voltage induced in a small loop was used as a simple indicator of the transient field and a correlation to the failure levels was found in some limited conditions [9], [10]. In spite of numerous factors that would possibly affect the severity of ESD generators, TC77B, the technical group in charge of IEC 64000-4-2, investigated adding another discharge current specification. The specification states that the width is measured at 60% of the first discharge current peak and should be 1.5 to 3.5 ns. A Round Robin test was initiated to test the effect of this change on different EUTs, at three locations (EHC Tokushima lab. in Japan, Missouri University of Science and Technology in Rolla, and IBM in Minnesota) using the same ESD generators. Various EUTs, such as desk top computers, laptop computers, printers, wireless routers, and projectors, were used. The measurements were performed in accordance with the standards [5]. The contact mode using direct discharge was used to minimize test’s uncertainty. The detailed test methods are described in [4]. The first objective of the Round Robin test was to evaluate the impact that the modified current waveform has on the
978-1-4244-1699-8/08/$25.00 ©2008 IEEE
Authorized licensed use limited to: University of Missouri. Downloaded on December 2, 2008 at 13:16 from IEEE Xplore. Restrictions apply.
reproducibility of the ESD test results on the EUTs subject to testing. Besides EUT testing we characterized the ESD generators with respect to their discharge current and fields. These parameters can be used to study the correlation of the failure levels to the ESD parameters. Section ΙI introduces the failure levels and the variations of various EUTs. Section III presents the measured ESD parameters, including the discharge currents and voltages induced in a semi-circular loop. Section IV discusses the general correlation between the ESD parameters and the failure levels over all EUTs and Section V compares the modified and unmodified ESD generators.
II.
EUT FAILURE LEVELS
The failure levels of desktop and laptop computers, servers, routers, etc. were determined using the contact mode. Some EUTs had multiple test points spaced far from each other. In this case we assumed that the coupling path and failure cause was different, allowing us to regard each new test point as an independent EUT. A charge voltage of 10 kV was the maximum for most ESD generators. A few EUTs didn’t fail up to 10 kV. In this case we assumed a failure level of 12kV. Each of the recorded failure levels for an EUT using eight different ESD generators was normalized to the lowest failure level such that the relative failure level variations could be seen. Fig. 1 shows the normalized failure level for the positive and negative voltage discharge respectively. The variations were strongly dependent on the EUT, ranging from 1:3 down to 1:1.5. The data is sorted such that the EUTs having large variations in the failure level are shown on the left side.
Fig. 1. Normalized failure levels for fourteen EUTs while (a) positive voltage discharges and (b) negative voltage discharges were performed using eight ESD generators. The lowest failure level for each EUT was used for normalization. EUT 10 (rarely failed up to 10kV) and EUT 13 (indirect discharge) were excluded.
III. ESD PARAMETERS Five of the ESD generator manufacturers supported the Round Robin test by providing ESD generators which meet the proposed new current requirement specifying the width of first discharge current; These generators are denoted by capital letters, ‘Generator A’ to ‘Generator E’, in the measurement results. Three of these manufacturer’s also provided their old versions, ‘Generator a’ to ‘Generator c’, which didn’t meet the new current requirement. ‘Generator D’ and ‘Generator E’ don’t have corresponding old versions because they have already met the new current specifications. We measured the discharge currents, the induced voltages in a semi-circular loop, and the electric fields. Under the assumption that a EUT fails if the peak noise level induced into some circuit exceeds a certain threshold level, various peak-topeak values of ESD parameters were extracted from the measured data for the correlation analysis. A. ESD parameter measurements The discharge currents were measured in accordance with the standard. They meet the four parameters of the discharge current specification in general. However, the current waveforms after the first peak deviate significantly. The measured waveforms and the spectrums are shown in [4]. To observe the transient field from the ESD generators during discharge, the induced voltages in a small loop have been measured. The measurement setup is depicted in Fig. 2.
Authorized licensed use limited to: University of Missouri. Downloaded on December 2, 2008 at 13:16 from IEEE Xplore. Restrictions apply.
measured for the induced voltage in the semi-circular loop. The transient electric fields also show a variation over rotation angles, but the variation is not as strong as that of the voltage induced in a semi-circular loop. The E-field sensor has a flat frequency response from about 2 MHz – 2 GHz, while the loop emphasizes the stronger varying high frequency content. Typical waveforms of the transient electric field are shown in [9].
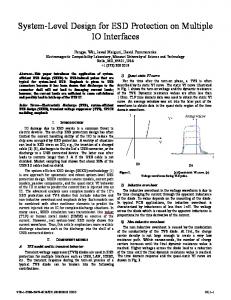
Fig. 2. Measurement setup for the induced voltages in a semi-circular loop. The ESD generators that were used were rotated around the discharge tip. The induced loop voltage was measured at four angles.
A semi-circular loop (28 mm diameter, 0.7 mm wire diameter) was placed on a ground plane and connected to an oscilloscope (6 GHz of bandwidth). The discharge location is 10 cm from the center of the semi-circular loop. The ground strap was pulled back to its midpoint. The ESD generators that were used were rotated around the discharge tip, as can be seen in the right side of Fig. 2, maintaining the overall shape of the ground strap. The current of the ESD generator is hardly affected by rotating it. However, the transient fields are, as most ESD generators do not form bodies of revolution. For capturing the effect of these asymmetries we recorded the induced loop voltage for four orientations of the ESD generators. Fig. 3 shows how strong the spectra of the induced voltage vary among different ESD generators. As expected, the variation is larger in the high frequency ranges.
B. ESD parameter extractions for correlation analysis Obvious parameters are the peak current and the discharge current derivative. The ESD generator current waveforms often differ in a highly visible fashion during the decay after the initial peak [3]. The currents may fall very fast or ring. The ringing is often caused by structural resonances leading to frequencies in the middle range from 200 to 800 MHz. Enforcing a smooth current decay after the first discharge current peak has been introduced into the discussion of the standardization as a measure of improving the test result repeatability. To test if this frequency range of the current correlates to failure levels we defined the peak-to-peak of a band-passed current (200-800 MHz) as a parameter. The transient fields will induce noise in the loop or monopole like structures. Based on this and previous publications [9], the standardization committee introduced the voltage in a ground plane mounted semi-circular loop as a way to characterize the transient fields of ESD generators [5]. Besides the simplicity of the test setup, other arguments for including this specification had been the availability of the data not only on ESD generators, but of the human-metal ESD event, which forms the event that the standard tries to reproduce. Transient field magnitudes have also been selected as a parameter. However they do not describe the nature of the induction process as well as the voltage induced in a loop. The problem of the large variation of ESD test results had been known prior to the Round Robin and it initiated the maintenance work on IEC 61000-4-2 that eventually led to the Round robin testing. If we assume a linear relationship between parameters and the reciprocal failure levels it is logical to search for parameters that differ strongly between ESD generators. For example, test result variations of 1:3 had been observed prior [4], but the peak currents of different ESD generators that fulfill the standard vary only by +/-10%. Thus, the peak current is not a suitable parameter to explain the observed variation ratio of 1:3.
Fig. 3. Spectrums of measured induced voltages in a semi-circular loop for eight ESD generators at 0 degree of revolution-angle.
A broad-band electric ground plane at a distance and the transient electric generators were held at 4
field sensor was placed on the of 0.1 m from the discharge point fields were measured. The ESD different angles, the same as was
The spectrum of the discharge current derivatives, the electric fields and the induced voltages in a semi-circular loop shows larger variation in the higher frequency range than in the low frequency range (