STEPHEN McADAMS ... ing to his or her footsteps (Li, Logan, & Pastore, 1991), a process .... t- 18. 12. 92. 68. Width (mm). 55. 44. Figure 3. The width and height ...
Perception & Psychophysics 1997,59 (8), 1180-1190
The representation of auditory source characteristics: Simple geometric form STEPHEN LAKATOS Institut de Recherche et de Coordination AcoustiquelMusique, Paris, France STEPHEN McADAMS Laboratoire de Psychologie Experimentale (CNRS), Uniuersite Rene Descartes, EPHE Paris, France and Institut de Recherche et de Coordination AcoustiquelMusique, Paris, France and RENECAUSSE Institut de Recherche et de Coordination AcoustiquelMusique, Paris, France Two experiments examined listeners' ability to discriminate the geometric shape of simple resonating bodies on the basis of their corresponding auditory attributes. In cross-modal matching tasks, subjects listened to recordings of pairs of metal bars (Experiment 1) or wooden bars (Experiment 2) struck in sequence and then selected a visual depiction of the bar cross sections that correctly represented their relative widths and heights from two opposing pairs presented on a computer screen. Multidimensional scaling solutions derived from matching scores for metal and wooden bars indicated that subjects' performance varied directly with increasing differences in the width/height (WIH) ratios of both sets of bars. Subsequent acoustic analyses revealed that the frequency components from torsional vibrational modes and the ratios of frequencies of transverse bending modes in the bars correlated strongly with both the bars' WIH ratios and bar coordinates in the multidimensional configurations. The results suggest that listeners can encode the auditory properties of sound sources by extracting certain invariant physical characteristics of their gross geometric properties from their acoustic behavior. The human auditory system possesses a remarkable ability to differentiate acoustic signals on the basis of the behavior of their sound-producing sources. For instance, we can recognize the gender of a human walker by listening to his or her footsteps (Li, Logan, & Pastore, 1991), a process undoubtedly similar in complexity to the visual identification of gender through the detection of coordinated movement of discrete points oflight distributed on a walker's body (Johansson, 1973). We can also often determine, to a coarse approximation, the extensity of a sonic object by listening to it under different conditions of excitation, such as a hollow metal cylinder that is tapped with the finger at different locations and with different levels offorce. Our ability to perform such acts of recognition and discrimination suggests that the auditory system is highly adept at encoding the spectral and temporal
This research was supported in part by a CogniSciences postdoctoral fellowship from the Centre National de la Recherche Scientifique to S.L. and a grant from the Ministere de l'Environnement to S.M. We thank the author Bennett Smith for his design of the PsiExp computer program, Michel Ducourau for his assistance in fabricating the bars, and Koei Kudo for her help in analyzing the data. Correspondence should be addressed to S. Lakatos, Washington State University, 14204 N.E. Salmon Creek Ave., Vancouver, WA 98686 (e-mail: lakatos@ vancouver.wsu.edu).
Copyright 1997 Psychonomic Society, Inc.
properties of sound events into mental representations that reflect aspects of the physical and spatial properties of the sound sources themselves (McAdams, 1993). Several studies have examined the psychophysical relation between the perceptual characteristics ofsound events and the physical/acoustic properties of their sources, with the aim of discovering acoustic features ofsounds that humans can use to recognize and distinguish natural sources. Warren and Verbrugge (1984) demonstrated that higher order temporal properties correlated with specific physical source characteristics allow listeners to discriminate between the "breaking" and "bouncing" sounds of glass bottles. Repp (1987) was able to correlate the spectra from clapping hands with specific hand configurations; for example, relative levels oflow-to-mid- and high-frequency spectral peaks were found to correlate strongly with particular palm-to-palm and fingers-to-palm resonances, respectively.Similarly, Freed (1990) identified four such parameters that listeners compare when judging the relative hardness of different percussive mallets used to strike metallic resonators: the mean and the slope of the curve describing the evolution of energy over time, and the mean and the time-weighted average of the curve describing the evolution of the spectral centroid over time. (Freed's analysis is somewhat problematic, however, since his parameters do not give results that are invariant
1180
AUDITORY SOURCE CHARACTERISTICS across the resonators, as are the judgments of mallet hardness by the subjects.) Such studies strongly suggest that the auditory system can distinguish the physical components of auditory events through specific spectral and temporal features. What exactly do we represent when we recognize, for instance, that a number of different sounds emanate from the same physical source, as opposed to two different sources? Gibson (1966, p. 89) proposed that we distinguish and identify sounds on the basis of natural classes, subclasses, and instances ofmechanical interactions, such as rubbing, scraping, and colliding. In this sense, the auditory system "picks up" on ambient cues that specify the physical properties of source interactions in the environment. However, Gibson did not go beyond a general description of such potentially relevant acoustic cues, and few other psychologists since have attempted to quantify them. In a more formal quantification of Gibson's ecological perspective, Shepard (1981, 1984) has proposed that the most pervasive ecological constraints governing external objects and events have come to be mirrored in our internal perceptual mechanisms. For visual and haptic perception, these constraints include the fact that (1) our environment is locally three-dimensional and Euclidean, (2) most objects are compact, rigid, or semirigid and frequently possess symmetrical or near-symmetrical features, and (3) transformations ofthese objects can be defined by six degrees of spatial freedom (three rotational and three translational components). Although the existence of such constraints has been demonstrated primarily for vision, it is quite possible that the auditory system also represents salient spatial and temporal features of resonating objects and the means by which they are set into vibration. The question then becomes one of which features become encoded auditorially and what might be their appropriate level of description. Sound-producing objects exhibit certain systematic modes of vibration that might be represented auditorially. A sound source of rigid material shape-especially one with a high degree of spatial symmetry (e.g., a rectangular block of wood, or a hollow aluminum tube open at both ends}--tends to vibrate in three characteristic orthogonal modes. A metal bar, for example, can vibrate transversely (by bending about the longitudinal axis), longitudinally (by expanding or contracting in length), and torsionally (by twisting and deforming about the longitudinal axis). These vibrationalmodes are determined by the physical dimensions and properties of the source (i.e., size, shape, elasticity, density, mass, etc.), so that a resonator that is set into motion by a variety of different exciters will always conform to one or more of its characteristics modes, even though the resulting sounds reaching the listener may possess strongly differing pitch and timbral properties. The auditory system may represent these invariant resonant properties in order to derive a unique source for a collection of timbrally disparate sounds. One consideration complicating this hypothetical perspective is that, despite the existence of independent vi-
1181
brational modes corresponding to specific spatial dimensions, the relative contribution of each mode depends as much on the manner in which a sound source is excited as it does on its physical attributes. The sound resulting from striking a bar at one of its ends will arise primarily from the bar's longitudinal vibrations; a wellplaced strike in its middle, however, will excite principally its transverse and torsional modes. One would, therefore, presumably need to include in a mental model the way the source was excited, in order to be able to perceive the properties of the source independently of its exciter. In addition, the potential coupling of a source to other sound-producing objects in the environment (i.e., as found in most exciter-resonator couplings) is often highly complex and nonlinear (Fletcher & Rossing, 1991). Therefore, it would seem difficult to isolate and separate experimentally the auditory consequences of changes in source shape, on the one hand, and exciter-resonator interactions, on the other, for all but the simplest cases. An initial approach, in this light, might consist of varying the most salient spatial dimensions of a very simple acoustic resonator in which the interaction between exciter and resonator is kept constant. The aim of the present study was to investigate the extent to which listeners could distinguish the geometric features ofsimple sound sources on the basis of their auditory attributes. For this purpose, we fabricated sets of solid metal and wooden bars that varied systematically in both width and height (length was held constant within sets), and we recorded mallet strikes for each bar under acoustically controlled conditions. A cross-modal matching paradigm was employed during the listening tasks. On each trial, we presented a pair of these sounds to listeners and asked them to select a visual depiction of shapes that corresponded to the ordering of the sources for each sound pair. We anticipated not only that listeners would be able to perform the matching task but that their performance would vary directly with differences in spatial dimensions of the bars-namely, their width/ height (W/H) ratios. In addition to the listening tasks, we carried out extensive acoustic analyses of both the recorded test sounds and the actual vibrating metal/wood bars themselves, in order to isolate potential acoustic cues that listeners might have utilized to differentiate these spatial dimensions. METHOD Subjects Sixty subjects (32 men, 28 women) between 18 and 34 years of age were recruited from the Paris area and paid for their participation. Potential subjects were contacted from a list of individuals who, at an earlier date, had expressed interest in participating in psychoacoustic tests at IRCAM. All of the subjects completed Experiments I and 2 in counterbalanced order. None reported any hearing problems. Stimuli General. All stimuli (12 steel bars and 16 wooden bars) were recorded individually in an anechoic chamber using two Schoeps microphones (Colette series MK6) and a Sony 670 DAr recorder
LAKATOS, McADAMS, AND CAUSSE
1182
L
x-
--r
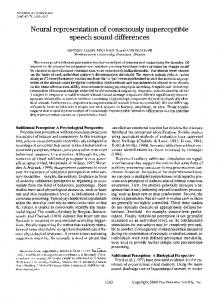
down-sampled to a rate of 44.1 kHz and transferred to a computer hard disk. Experiment 1. Twelve steel bars of varying width (40, 60, and 80 mm) and height (10,20,30, and 40 mm), each 30 em long, were cut and prepared for use as stimuli (Figure 2). Hooks were welded to the end of each bar in order to permit lengthwise suspension; a steel hammer served as mallet. Sounds were trimmed to a duration of 2,500 msec, with a 50-msec linear decay ramp. Experiment 2. Sixteen bars of Norwegian spruce (widths, 44, 55,68, and 92 mm; heights, 12, 18,27, and 44 mm) were selected for their relatively uniform texture and consistency and used as stimuli (Figure 3). Bar length was kept constant at 75 em. Each bar was recorded during the same session and under the same conditions as the metal series, except that screw hooks were used to suspend them, and a hard resin mallet was substituted for the metal one. Sounds were trimmed to 250 msec, with a 25-msec linear decay ramp. Trimmed durations were considerably shorter than those for the metal bars, since the greatly increased internal damping and reduced resonance of soft wood, relative to metal, yielded shorter sound durations overall.
z
y
x
Figure 1. Schematic illustration of bars used in the study. Each bar was struck in the middle ofthe surface parallel to the x-z plane.
(sampling rate of 48 kHz, l6-bit resolution). The microphones were positioned about 30 em apart on an adjustable boom at a distance ofapproximately I m from the center ofeach bar. During the recording session, each bar was suspended lengthwise from a rectangular metal frame via a steel wire (i.e., so as not to excite the frame) and struck at its center with a mallet (Figure I). Final sound stimuli were selected from multiple recordings for each bar on the basis of uniform strike clarity (i.e., sounds containing artifacts from imprecise strikes were rejected) and were matched in loudness by author S.L. The final sounds were digitally edited and
E E o oCP
Procedure General. A single-interval, two-alternative forced-choice (2AFC) procedure was employed. On each trial, the subjects heard two sounds presented in sequence. Concurrently with the onset of the first sound, the subjects also saw two pairs of rectangles on the computer screen before them; each pair represented the exact W/H ratios (scaled to a size appropriate for the screen) of the two bars whose sounds were being played, and each corresponded to one of their two possible orderings (Figure 4). The subjects performed a cross-modal match in which they determined which visual ordering (A or B in Figure 4) corresponded to the geometric shapes of the sources heard in the sound sequence (one of the two visual pairs was always the correct response). The subjects were told to use any available timbral cues present in the two sounds to perform the matching task. An unlimited number of stimulus repetitions was permitted to reach a decision.
40
30
C JiC:
.2
.c
I-
20
10
80
60
40
Width (mm) Figure 2. The width and height dimensions of the 12 steel bars used in Experiment 1. All bars were 30 em long.
AUDITORY SOURCE CHARACTERISTICS
1183
_44
E
E UJ UJ
CD 27
~ .~
.c
t-
18
12
92
55
68
44
Width (mm) Figure 3. The width and height dimensions of the 16 wooden bars used in Experiment 2. All bars were 75 em long.
We selected a cross-modal matching task instead of a relatively more straightforward auditory discrimination paradigm because pilot testing revealed the sounds for both metal and wood bars to be nearly perfectly discriminable. The matching task measured the subjects' ability to correctly match a given acoustic change to a given visually presented geometric change. Therefore, our task measured not discriminability but rather a relative identification consistency across bars. Experiment 1. Prior to the experiment, the subjects were given the opportunity to strike five sample metal bars in order to familiarize themselves with the type of mallet-bar interactions presented in the experiment; the five bars were common to all subjects. The sample bars were of different dimensions than those used in the experiment, though the mallet was the same. After this brief period of focused listening (approximately 5 min on average), a short session made up of20 randomly chosen practice trials was administered to familiarize the subjects with the judgment procedure; no feedback concerning response correctness was provided during either the practice trials or the test trials. The subjects then completed one block of 132 trials. All possible pairings of the 12 bars, excluding identities, were presented randomly in both A~B and B~A order. The trials were administered in a single listening session that lasted approximately 25 min. Experiment 2. The experimental procedure was the same as that for Experiment 1. The subjects were allowed to familiarize themselves with sample wooden bars of differing dimensions before the experiment. The subjects completed one block of 240 trials that lasted approximately 40 min.
RESULTS Experiment 1 The data for 5 subjects were excluded from the analyses because of the subjects' inability to reach a 75% performance criterion for the 2AFC task across all trials, even for those pairs of bars whose geometric differences were the greatest. Matching responses were pooled across the remaining 55 subjects for each pair of bars and for both A-B and B-A presentations, to yield an average percent correct score for each pair. Our aim was to transform global matching rates into measures of dissimilarity, since we were interested in the perceptual dimensions that contributed to matching performance. We therefore constrained percent correct scores to fall between 50% (chance performance, or a dissimilarity score of 0.0) and 100% (perfectly consistent matching, or a dissimilarity score of 1.0) by "folding across" the 50% level scores that fell below this value. A given pair of sounds for
A
Apparatus
The reproduction of the sounds, the presentation and timing of stimuli, and the entering of subject responses were controlled by the psychoacoustic test program PsiExp (Smith, 1994) designed at IRCAM and run on a NeXT computer with integrated digital-toanalog converters. Converted sounds were amplified by means of an MB Systems 105a power amplifier and reproduced on a Philips 544 loudspeaker situated in front of the subject at a distance of approximately 0.5 m from the head. The subjects were tested individually in a Soluna SN I double-walled sound-isolation booth.
c'
.'
B
tc:
~
(
tc
C:
Figure 4. Two examples of pairs of visua! sequences presented to
subjects.
1184
LAKATOS, MCADAMS, AND CAUSSE
which the subjects made consistent matches, except that they consistently chose the incorrect order, would fall significantly below 50%. Only 2 of 66 pairs (3%) were of this type (bar pairs 1/5 and 1/9 were below the binomial significance criterion of 0.46 for 110 trials), and the scores were above 40% in both cases. The cross-modal matching consistency measure should not be equated directly with discrimination ability, since scores in the matching task are interpreted on an "inconsistent-consistent" continuum, rather than as a measure of correct performance. Overall performance in matching consistency across all cells in the matrix averaged 77.6%. The triangular dissimilarity matrix without diagonal was analyzed with a quasi-nonmetric multidimensional scaling (MDS) program, EXSCAL (Winsberg & Carroll, 1989). In addition to computing a set of common dimensions for a set of n stimuli, the EXSCAL algorithm also provides the option of calculating a metric of specificity for each stimulus, denoted as the square of the coordinate (s in Equation 1) along a dimension that has a nonzero value only for a particular stimulus. The algorithm establishes a monotone relation between dissimilarities and model distances. The latter are defined as (1)
where dij is the estimated distance between stimuli i and}, x ir is the coordinate along the dimension r for stimulus i, and Si is the specificity for stimulus i. The specificity metric provides a measure of the "uniqueness" of each stimulus, to the extent that the variance component associated with the specificity magnitude is not associated with any ofthe dimensions shared by all stimuli in the MDS space. The information criterion BIC, based on maximum likelihood estimations, was used to choose the appropriate spatial model (number of dimensions and presence or absence ofspecificities; see Schwarz, 1978, for a description of this test statistic). A two-dimensional solution without specificities was found to be the most appropriate configuration for the metal bars (see Table 1). Since this is an unweighted spatial model, the configuration is invariant under rotation. Since the two dimensions appeared to be related to the W/H ratio ofthe bars and spectral centroid, the configuration was rotated to maximize the fit to a twodimensional physical space within which each bar was represented by these values. A procrustian rotation procedure was used that maintains all relative distances in the original configuration and minimizes the sum of the squared distances between points in the two configurations. This procedure gave the rotated configuration shown in Figure 5. To examine more directly any possible grouping effects, a hierarchical clustering solution (farthest neighbor method) was also obtained from the dissimilarity matrix (shown also in Figure 5). In the scaling solution, Dimension 1 differentiates the width-height ratio of each bar (Figure 6). As predicted, the subjects' ability to discriminate the visual depictions
of any two bars on the basis oftheir timbres increased directly with increasing differences in the bars' W/H ratios (r 2 = .88). In addition to the W/H ratio, we found that the subjects also discriminated the bars on the basis of their spectral centroids (i.e., the center of gravity of the sound spectrum, expressed as amplitude-weighted mean frequency). The spectral centroid (SC) for the attack portion of each sound was computed using the following formula (after Krimphoff, McAdams, & Winsberg, 1994): N
SC=
LAnFn n=!
(2)
N
LAn n=l
where An and F; are the amplitude and frequency of spectral component n. Spectral plots were obtained by performing a fast-Fourier transform (FFT) on each ofthe sounds. Values for An were calculated using two different types of spectral information: (1) all spectral components within 50 dB of the maximum signal amplitude, averaged separately for four time periods, and (2) the 7-8 components with the largest peaks, each calculated as the mean frequency across consecutive 5-msec time frames during the first 100 msec of each sound (see Table 2). Only centroid values computed from peak spectral information correlated strongly with the second dimension of the EXSCAL solution. A graph of the correlation between this measure of spectral centroid and Dimension 2 (see Figure 7) shows that the subjects were better at matching source shape changes when large differences in centroid were involved. Bar 9 was removed from the correlation calculation as an outlier, because its inclusion reduced r 2 from. 75 to .51. (Given its unusually low centroid [5500 Hz] with respect to those of bars that cluster around it [e.g., 1 and 5] and the fact that it has a square cross-section, we suspect that the way the bar was struck may have resulted in the mutual canceling of transverse modes due to the height and width since they are nearly identical in frequency.) Table 1 Log Likelihood (LogL) and Values of Information Criterion HIC for Spatial Models Derived From Percent Correct Scores for 55 Subjects in Comparisons of 12 Metal Bars Without Specificities Dimension
LogL
SIC
1 2 3 4
17.2 64.9 75.3 80.1
Experiment I 15.9 -37.6 -20.7 3.3
I 2 3
61.9 94.5 101.2
Experiment 2 -47.2 -45.4 3.5
With Specificities LogL
SIC
41.1 72.1 79.5 79.1
18.3 -2.3 21.1 55.4
89.7 97.5 102.5
-26.2 25.1 77.5
Note-The model with the lowest value for each criterion (in italic) is considered to be the most appropriate.
AUDITORY SOURCE CHARACTERISTICS 0.6
0.4
C\I c:::::
0.2
0
·W c:::::
0.0
Q)
E
Ci
.Q.2
-0.4
-0.6 ........._ -0.6
........_ -0.4
......._ -0.2
...._ _...._ _............1 0.0
0.2
0.4
0.6
Dimension 1 Figure 5. MDS solution (EXSCAL) obtained for the 12 metai bars. Dimension 1 correlates strongly with the relative widthfheight ratios of the bars. The variation along Dimension 2 is consistent with each bar's spectral centroid. A hierarchical cluster solution (farthest neighbor, or complete linkage) is superimposed on the space, and it reveals a general distinction between large and thick "blocks" and the more thin and "plate-like" bars.
Spectral centroid is known to correlate strongly with the perception of "sharpness" (Bismarck, 1974) and "brightness" (Grey & Gordon, 1978), and several MDS studies of timbre have isolated spectral center of gravity as one of the principal physical dimensions defining timbre space (Grey & Gordon, 1978; Iverson & Krumhansl, 1993; McAdams, Winsberg, Donnadieu, De Soete, & Krimphoff, 1995). As mentioned above, Freed (1990) has found significant correlations between mallet-resonator interactions and the steady-state and time-varying properties of centroids. A particularly intriguing feature of Figure 5 is the apparent clustering of bars into two general categories, despite uniform changes in their dimensions across the stimulus matrix of Figure I: the comparatively thick and heavy "blocks," on the one hand, and the thinner, more "plate-like" ones, on the other. Within each ofthese clusters, there appear to be further clusterings that reinforce this categorical trend at a more local level: (1) Bar 2, although clustered with Bar 10, lies fairly close to the platelike stimuli in the two-dimensional space, perhaps because its proportions are close to those of the plates, but its size nonetheless categorizes it as a block; and (2) Bars 4 and 8 cluster closely and lie relatively far from the other plates, suggesting a separate subcategory of "thin plates." As shown in Figure 5, the hypothetical boundary between blocks and plates seems to cut across both Dimensions 1 and 2 and thus depends equally on differences in W/H ratios and values of spectral centroid.
1185
Experiment 2 Ten subjects did not meet a 75% performance criterion for even the largest differences in wood bar geometry; their results were subsequently excluded from the analyses. As in Experiment 1, matching Scores for the remaining 50 subjects were transformed into proximity measures ranging from 0.0 to 1.0. The average matching consistency across all pairs was somewhat lower than for the metal bars (73.8%). One potentially troubling feature of this data set is the relatively large number of cells whose values fell below 50% prior to the "fold-over" adjustment. For 100 binary trials, percentages correct below 0.42 are significantly different by an exact binomial test. Ten pairs of bars of 120 pairs (8.3%) fall below this criterion. The majority of these reversals are concentrated among the narrower bars, but there is no clear pattern to suggest that this result is related to the geometry. Wewill return to the reversal issue in the acoustic analysis section below. The BIC statistic from the EXSCAL analysis (see Table 1) suggested a stable solution in one dimension without specificities (Figure 8). The coordinates for bars along this dimension correlated moderately well (r 2 = .72) with the bars' respective W/H ratios, again suggesting that information concerning simple geometric features can be conveyed by an acoustic signal. Most subjects commented that they found the bars in this experiment considerably more difficult to discriminate than those in Experiment 1, a sentiment reflected in a lower overall performance level and a higher percentage of those who failed to meet the 75% performance criterion. A contributing factor may have been the considerably shorter stimulus durations used in this experiment (i.e., 250 vs. 2,500 msec).
10
8 +-'
..c:
Ol
'Q)
I
6
X
..c: +-'
'0
4
~
2
0
-2
-1
0
2
3
Dimension 1 Figure 6, Correlation between coordinates on Dimension 1 and width x thickness ratio for metal bars.
1186
LAKATOS, McADAMS, AND CAUSSE Table 2 WidtblHeight (WIH) Ratios and Various Measures of Spectral Centroid (in Hertz) for the Metal Bars
Bar 1 2 3 4 5 6 7 8 9 10 11 12
W/H
2.00 2.67 4.00 8.00 1.50 2.00 3.00 6.00 1.00 1.33 2.00 4.00
0-30 msec 6165 5088 6464 5471 5946 5110 5153 5567 5304 5836 5650 6980
30-100 msec 8847 7496 8566 6875 8276 7741 4605 8111 7969 7495 7874 8459
ACOUSTIC ANALYSES
4. Longitudinal modes along the z axis (Fd that depend on the length (L). Their relation to L is defined by
Acoustic Cues for W IH Ratio We carried out acoustic analyses of both the recorded stimuli and the vibrating metal and wood bars themselves in order to identify the characteristic vibration modes that might serve to differentiate the spatial dimensions of the bars and to correlate the frequencies of these modes with the perceptual data reported earlier. Two types of analysis were performed: one based on FFTs of the original recorded sounds and, in some cases, additional accelerometry analyses directly on the bars. For the latter analyses, the bars were suspended as for the original recordings. This configuration offers a firstorder approximation to a bar with free or unsupported extremities. Four principal vibration modes can be discerned in bars of this type (refer to Figure 1) and can be derived from acoustic theory (Fletcher & Rossing, 1991, chap. 2, chap. 19): I. Transverse bending modes in the y-z plane ofthe bar that depend on the height (H). We will denote the frequencies ofthese modes F H' Their relation to H is defined by n1rH FH () n =~ 2-v12
f!
- , n=3.011 2 ,5 2 ,7 2 , ... , P
Spectral Centroid 100-500 msec 500-1,000 msec Peaks 0-100 msec 8125 7971 7808 7788 6118 6602 5402 6741 5170 5932 3646 698 7012 6854 6249 8015 6494 7459 6128 5288 5234 8357 4732 6043 5524 7296 5538 8315 7190 5713 5546 6991 5346 6304 6971 4576
Fdn)=~
-
where E is Young's modulus (a constant related to the elasticity of the material), and p is the density of the material.
'ec
(J)
o
3. Torsional modes around the longitudinal axis of the bar, which depend on both height and width (FT ) . Their relation to W/H is defined by
en
where v is the Poisson ratio that is 0.3 for most materials, and a is a constant that depends on the W/H ratio as described below.
0
"0
2. Transverse bending modes in the x-z plane ofthe bar that depend on the width (W). We will denote the frequencies of these modes F w . Their relation to W is defined by Equation 3, replacing H with W.
(4)
8000
N
:c
FT(n) = na [-(E-)' n=I,2,3, ... , 2L ~ 2p t r v
(5)
Note that since the material and length are held constant for a given set of bars, L, E, p, and v are relatively constant; the only factors that affect F H' F w, and F T are thus H, W, and W/H, respectively. For the two transverse bending modes, the wave velocity is dispersive (i.e., it depends on frequency and the relations among the modes are thus nonharmonic: frequency ratios 3.011 2:5 2:72: ••• ). In contrast, the torsional and longitudinal modes have wave velocities that are independent of frequency and thus are harmonic. Weanalyzed the recorded sounds ofall wood and metal bars by digital Fourier transform and determined the lower frequency components for each mode type. Fre-
(3)
8L
rK, n=I,2,3,...
2L ~ P
(ij
.... t5 (J)
6000
0-
.,
o
2
Dimension 2 Figure 7. Correlation between coordinates on Dimension 2 and log (spectral centroid) for metal bars.
AUDITORY SOURCE CHARACTERISTICS 0.8
,---..----r---.----r-.......-----,,---..------,
• C/)
~c
:.eo
0.2
o
o c
o
·w
-0.2
C
Q)
E
(5
-0.4
-0.6 -0.8
I...-_~_..J__ ........._ .....L._---o._--'I...-_........ -----J
o
2
4
6
8
Width/Height Ratio Figure 8. Correlation between the widthlheight ratios of the 16 wooden bars and the coordinates obtained from a one-dimensional EXSCAL solution.
quencies corresponding to all mode types were found for each bar, with a few exceptions (in nearly all of these latter cases, additional acoustic analyses ofthe bars revealed the components). The agreement between predicted and measured frequencies was generally very good, with all correlations for each mode type across bars of a given material being above. 97. 1 The lowest frequencies for transverse and torsional modes for each bar are listed in Tables 4 and 5 for metal and wood, respectively. The longitudinal modes vary slightly over the bars of a given set. The fundamental frequency is approximately 8460 Hz (range, 8375-8500 Hz) for the metal bars and near 3600 Hz (range, 3150-3850 Hz) for the wood ones. Note that the variation for this mode is much greater for wood bars than for metal bars.
For the transverse vibration modes, if one reads the values of a given row of bars across the columns (i.e., varying width, while keeping height constant) in both tables, F H remains relatively constant «6% variation). On the other hand, if one reads down the columns (i.e., varying height, with constant width), F H varies linearlywith the change in height. In Table 4, for example, the frequencies from Bar 1 to Bar 3 decrease from 2190 to 1118 Hz (49% decrease), in direct proportion to the decrease in height from 40 to 20 mm (- 50%). Moreover, the frequencies for the transverse mode F w vary in proportion to changes in width; the frequencies from Bar 1 to Bar 9 decrease 45% from 3980 to 2175 Hz, this time in proportion to a 50% decrease in width. Interestingly, Fwand F H are nearly identical for Bar 9 in the metal set and for Bar 13 in the wood set, since their respective widths and heights are identical (i.e., square section). The torsional modes around the longitudinal axis vary nonlinearly with the W/H ratio. When this ratio is greater than 6, FT is directly proportional to W/H (a = W/H in Equation 4); when W/H < 6, F T deviates from this relation with a becoming .74 for W = 2H and .92 for W = H (Fletcher & Rossing, 1991, p. 55). The function is thus compressive at smaller W/H ratios. In the metal set, for example, W/H = 2 for Bars 1 (80/40),6 (60/30), and 11 (40/20), and the corresponding FTs equal 3960, 3962, and 4013 Hz, respectively. A doubling of the ratio from 2 to 4 results in a change in F T by a factor of 1.7; halving the ratio from 2 to 1 decreases F T by a factor of 0.8. In spite of this deviation, 1/F Tis nearly perfectly correlated with W/H in our stimuli (r = .99 for metal and .98 for wood) and represents a likely acoustic correlate for the W/H factor observed. The slightly weaker correlation for wood may reflect the anisotropy and inhomogeneity (e.g., grains and knots) of the materials, relative to metal. These imperfections also lead to a less harmonic relation among the higher order torsional modes in wood than in metal: For example, Metal Bar 11 gives 4013, 8020, 12100, ... Hz (ratios of 1:1.998:3.015),
Table 3 WidthlHeight (Will) Ratios and Various Measures of Spectral Centroid (in Hertz) for the Wood Bars Spectral Centroid Bar
W/H
0-30 msec
30-100 msec
I 2 3 4 5 6 7 8 9 10 II 12 13 14 15 16
2.09 3.41 5.11 7.67 1.54 2.52 3.78 5.67 L25 2.04 3.06 4.58 1.00 1.63 2.44 3.67
6238 6334 6382 6497 5899 6108 6666 6015 6729 6145 6792 6794 6574 6519 6717 7100
2041 2356 3547 3503 2519 3075 4394 3464 2691 3157 3653 3582 3608 3472 4760 4550
1187
100-500 msec 500-1,000 msec Peaks 0-100 msec 1291 1285 1528 2052 1679 2296 1945 2416 1432 1926 2556 2746 1591 2223 2420 3006
803 822 819 2634 896 2011 6752 4157 893 8342 1415 2262 3565 4047 7957 5731
1149 1726 1418 1602 1329 1740 1926 2005 1463 1776 1751 2451 1498 2205 2023 2570
1188
LAKATOS, McADAMS, AND CAUSSE
Table 4 Lowest Frequencies (in Hertz) of Each Mode Type for the 12 Metal Bars Width (in Millimeters) Height (in Millimeters)
40 30 20 10
Mode
FH
Fw FT FH
Fw
FT FH Fw FT FH
Fw FT
80 2190 3980 3960 1610 3900 3287 1118 3875 2398 550 3975 1275
60 2192 3075 4522 1613 3025 3967 1106 3000 3530 549 2965 1654
40 2182 2175 4939 1573 2175 4715 1115 2200 4013 546 2175 2356
Note-See text for description of modes. TableS Lowest Frequencies (in Hertz) of Each Mode Type for the 16 Wood Bars Height (in Millimeters)
44 27 18 12
Width (in Millimeters) Mode
FH Fw FT FH Fw FT FH Fw Fr
FH Fw FT
92 400 750 625 225 791 495 175 825 337 112 750 212
68 400 587 700 275 667 550 175 600 431 100 581 335
55 412 500 812 250 475 637 180 475 600 112 465 337
44 373 375 837 250 375 675 162 397 587 112 412 412
Note-See text for description of modes.
whereas Wood Bar 12 gives 337, 687, 1037, ... Hz (ratios of 1:2.037:3.073). It should be noted, however, that, for the wood bars, the frequency components corresponding to the torsional modes in the Fourier spectra of the recorded sounds were at times weak or absent. The high damping of soft wood, such as spruce, and the choice oflonger bars (75 em instead of 30 em, as for metal) necessitated additional vibratory analyses in order to identify these modes. We performed these analyses by mounting a small accelerometer directly on the bars and by striking them at positions that favor the stimulation of the torsional modes. Although torsional modes can be elicited in this manner, and this acoustic correlate of the WIH relation is a possible cue for the metal stimuli, it is less reliable a cue for the wood stimuli. Further examination of Tables 4 and 5 reveals another potential explanation for the apparent dependence of the subjects' matching performance on the W/H ratio. Since F w and F H are very linearly related to Wand H, respectively, another possible acoustic correlate for WIH might be the frequency interval between them: FwIF H . Although the series of frequencies associated with these transverse modes is inharmonic, the inharmonicity is
relatively constant, as is the frequency interval for each pair of partials of the same rank for the two vibration modes. The correlation of this ratio with the WIH ratio is also nearly perfect (r = .997 for metal and .991 for wood) and so would seem to offer an additional source of acoustic information related to the geometry of the bars under comparison. A note of caution is needed for the wood bars, however. As for the FTcue, the frequency components related to either Fw or FH are at times quite weak or absent in these bars. This is most true for F w. How do these acoustic variables correlate with the subjects' matching performance in Experiments 1 and 2? We calculated correlation coefficients between several vibrational modes and their derivatives-s-Fj, 11FT , 10g(FT ) , FwiF ~and coordinates along both Dimension I for the metal data and the single dimension for the wood data (for comparison, the correlations with W IH are also shown). The correlations are shown in Table 6. Note that both 10g(FT ) and FwlFH have the highest correlations with the metal data and are equivalent in their predictive power to the raw W/H ratio; both sources of information were available to the subjects in Experiment I. For the wood bars of Experiment 2, however, neither cue is completely reliable in all cases given the low level or absence in various stimuli of the F T-related and FwiF wrelated cues in this stimulus set. Acoustic Origins of Matching Reversals For 3% of the metal bar pairs and 8% of the wood bar pairs, the subjects matched the acoustic stimulus to the wrong visual stimulus at rates above chance. The rates varied from .05 to .09 below chance for metal and from .08 to .17 below chance for wood. This is to be contrasted with the variations from .05 to .45 above chance for metal and from .08 to .42 above chance for wood in pairs that are reliably matched above chance. We attempted to determine whether these reversals were due to systematic acoustic cues by examining relations of matching scores to the changes in FT and in FwlF H for each set of bars, as well as to the presence of prominent frequency components not related to the principal modes of vibration considered above.
Table 6 Correlations of Fundamental Frequencies of Torsional Vibration Modes (FT ) , Frequency Ratios Between Transverse Bending Modes (FwlF H)' and WidthIHeight Ratios With Coordinates of Bars Along Dimension 1 in the MDS Configurations Derived From Matching Performance Physical Parameter FT
11FT
10g(FT )
FwlFH W/H
Metal
Wood
-.92
-.76 .82 -.80 .82 .85
.93 -.94 .94 .94
Note-The correlations of acoustic measures with the wood data should be interpreted with caution, since the frequencies used to calculate each correlation were often not present in the spectra of the recorded stimuli, but rather were obtained with the accelerometry method described in the text.
AUDITORY SOURCE CHARACTERISTICS Correlations were computed between group matching scores and the change in FT and in Fw/FH . Change in F was computed both as the difference in F T and as the ratio of FT' Both signed change and absolute value of change were tested. For absolute change, the ratio between F T values was always greater than 1 (the largest value was always in the numerator). With metal bars, no correlations with signed change were significant. Correlations with absolute change were significant in all cases. All predictors were significantly correlated with wood data. The change in F T , expressed as a ratio larger than 1, was the best predictor for both sets (for metal, r 2 = .30, df= 64,p< .0001; forwood, r 2 = .24, df= 118, p < .0001), although the correlations are weak at best. However, a closer examination of the cases of matching reversal reveals that the degree of change in acoustic parameters is no lower for these stimuli than for a large portion of the correctly matched pairs. It is therefore unlikely that these cues are responsible for the reversals. We examined another possibility as well. Strong frequency components that are not related to the principal modes used by listeners are present in some of the stimuli. These components may have created timbral or pitchrelated changes between the two bars being compared that led the listeners to misjudge the geometric change. For this to occur systematically for a given pair, it would be necessary for the perceived change to be in the opposite direction of that created by the other main cues and the main cue should be relatively weak in one or both of the bars. Furthermore, such components should not appear frequently in bar pairs for which judgments were reliably correct. While such relations can be gleaned from the spectra of some of the reversals, the set of constraints developed here is not respected in the majority ofcases. Further research will be necessary to discover the acoustic cues that give rise to such judgment reversals. CONCLUSIONS The experiments described here present preliminary evidence that the auditory system possesses at least a rudimentary ability to distinguish the spatial dimensions of sound-generating sources and that such distinctions may be made on the basis of the characteristic vibration modes of such sources. The subjects were systematically better at matching sounds to visual depictions of their sources when the difference between the width/height ratios of the bars was greater with both metal and wood bars. They were able to make further distinctions on the basis of differences in the spectral centroids of sounds for the metal bars. Subsequent acoustic measurements indicated that the frequency components from both torsional and transverse bending modes in the metal bars correlated strongly with both the bars' width/height ratio and the subjects' matching performance and thus could serve as potential cues for perceiving the spatial dimensions of these bars. For the wood bar recordings, both transverse and torsional vibration modes were weak or absent in
1189
many stimuli, indicating that neither cue was completely reliable across the whole set, although a combined use of both apparently gave reasonable performance. Both sets of findings support the notion that certain acoustic features indicative of source dimensions are represented at some stage or series of stages of auditory processing and that these representations aid us in recognizing and distinguishing sources and the sounds they produce. For cases in which their presence is unsystematic, judgments concerning the geometric properties are not as reliable. A great deal of acoustic information is available in these natural stimuli, but the listeners seem to have selected a subset of cues in the cross-modal matching task. These cues are actually the ones most closely linked to the relational visual features presented on the screen rather than the raw dimensional features. For example, the listeners did not systematically use frequencies of the transverse modes by themselves, even though they are nearly perfectly correlated with Hand W Nor did they use any of a number of other frequencies present in the stimuli that are not related to the modes we have considered here. Future research will need to address the mechanism by which the task proposed to subjects affects their selection of relevant acoustic information in such complex natural sounds. REFERENCES BISMARCK, G. VON (1974). Sharpness as an attribute of the timbre of steady sounds. Acustica, 30,159-192. FLETCHER, N. H., & ROSSING, T. D. (1991). The physics ofmusical instruments. New York: Springer-Verlag. FREED, D. J. (1990). Auditory correlates of perceived mallet hardness for a set of recorded percussive sound events. Journal ofthe Acoustical Society ofAmerica, 87, 311-322. GIBSON, J. J. (1966). The senses considered as perceptual systems. Boston: Houghton Mifflin. GREY, J. M., & GORDON, J. W. (1978). Perceptual effects of spectral modifications on musical timbres. Journal ofthe Acoustical Society ofAmerica, 63,1493-1500. IVERSON, P., & KRUMHANSL, C. L. (1993). Isolating the dynamic attributes of musical timbre. Journal of the Acoustical Society of America, 94, 2595-2603. JOHANSSON, G. (1973). Visual perception of biological motion and a model for its analysis. Perception & Psychophysics, 14,201-211. KRIMPHOFF, J., McADAMS, S., & WINSBERG, S. (1994). Caracterisation du timbre des sons complexes: II. Analyses acoustiques et quantification psychophysique [Characterization of the timbre of complex sounds: Acoustical analyses and psychophysical quantification]. Journal de Physique, 4(C5), 625-628. LI, X., LOGAN, R. J., & PASTORE, R. E. (1991). Perception of acoustic source characteristics: Walking sounds. Journal of the Acoustical Society ofAmerica, 90, 3036-3049. McADAMS, S. (1993). Recognition of sound sources and events. In S. MeAdams & E. Bigand (Eds.), Thinking in sound: The cognitive psychology ofhuman audition (pp. 146-198). Oxford: Oxford University Press. McADAMS, S., WINSBERG, S., DONNADIEU, S., DE SOETE, G., & KRIMPHOFF, 1. (1995). Perceptual scaling of synthesized musical timbres: Common dimensions, specificities, and latent subject classes. Psychological Research, 58, 177-192. REPP, B. H. (1987). The sound of two hands clapping: An exploratory study. Journal ofthe Acoustical Society ofAmerica, 81, 1100-1109. SCHWARZ, G. (1978). Estimating the dimensions ofa model. Annals of Statistics, 6, 461-464.
1190
LAKATOS, MCADAMS, AND CAUSSE
R. N. (1981). Psychophysical complementarity. In M. Kubovy & J. R. Pomerantz (Eds.), Perceptual organization (pp. 279341). Hillsdale, NJ: Erlbaum. SHEPARD, R. N. (1984). Ecological constraints on internal representation: Resonant kinematics of perceiving, imagining, thinking, and dreaming. Psychological Review, 91, 417-447. SMITH, B. K. (1994). Psiexp, Version 1.3: A psychoacoustic experiment environment for the NeXT computer [Computer program]. Paris: IRCAM. WARREN, W. H., & VERBRUGGE, R. R. (1984). Auditory perception of breaking and bouncing events: A case study in ecological acoustics. Journal ofExperimental Psychology: Human Perception & Performance, 10, 704-712. WINSBERG, S., & CARROLL, J. D. (1989). A quasi-nonmetric method SHEPARD,
for multidimensional scaling via an extended Euclidean model. Psychometrika, 54, 217-229. NarE
I. Differences between theory and measurement are basically due to the constants used for elasticity (E) and density (p). If they are assumed constant for a given material across bars (which is reasonable for the homogeneous metal bars and a gross approximation for the wood bars), the ratios among frequencies are well respected for a given set of bars. (Manuscript received January 9, 1995; revision accepted for publication December 9, 1996.).