Takuya Yoshioka, Tomohiro Nakatani. NTT Corporation. Emanuël Habets ... Roland Maas. Univ. of Erlangen-Nuremberg. Sharon Gannot. Bar-Ilan Univ. Bhiksha ...
2013 IEEE Workshop on Applications of Signal Processing to Audio and Acoustics
October 20-23, 2013, New Paltz, NY
THE REVERB CHALLENGE: A COMMON EVALUATION FRAMEWORK FOR DEREVERBERATION AND RECOGNITION OF REVERBERANT SPEECH Keisuke Kinoshita, Marc Delcroix, Takuya Yoshioka, Tomohiro Nakatani NTT Corporation Armin Sehr Beuth Univ. of Applied Sciences Berlin
Reinhold Haeb-Umbach, Volker Leutnant Paderborn Univ.
Emanu¨el Habets Int. AudioLabs Erlangen
Walter Kellermann, Roland Maas Univ. of Erlangen-Nuremberg
Sharon Gannot Bar-Ilan Univ.
Bhiksha Raj Carnegie Mellon Univ.
ABSTRACT Recently, substantial progress has been made in the field of reverberant speech signal processing, including both single- and multichannel de-reverberation techniques, and automatic speech recognition (ASR) techniques robust to reverberation. To evaluate state-ofthe-art algorithms and obtain new insights regarding potential future research directions, we propose a common evaluation framework including datasets, tasks, and evaluation metrics for both speech enhancement and ASR techniques. The proposed framework will be used as a common basis for the REVERB (REverberant Voice Enhancement and Recognition Benchmark) challenge. This paper describes the rationale behind the challenge, and provides a detailed description of the evaluation framework and benchmark results. Index Terms— Reverberant speech, dereverberation, ASR, evaluation, challenge 1. INTRODUCTION Speech signals captured with distant microphones inevitably contain reverberation, which is known to severely degrade audible speech quality and the performance of automatic speech recognition (ASR) [1, 2]. Although a range of signal processing and speech recognition techniques are available for combating the effect of additive noise [1, 2], finding practical algorithms that can reduce the detrimental effect of reverberation has been one of the toughest challenges in the field of distant-speech enhancement and recognition research. In recent years, research on reverberant speech processing has achieved significant progress in both the audio processing and speech recognition fields [3, 4], mainly driven by multidisciplinary approaches combining ideas from room acoustics, optimal filtering, machine learning, speech modeling, enhancement, and recognition. Now these novel techniques seem to be ready to be evaluated for real-world speech enhancement and speech recognition applications. In this paper, we describe a common evaluation framework including datasets, tasks, and evaluation metrics for both speech enhancement (SE) and ASR techniques in reverberant environments. Note that, while the benchmark tasks and challenges in [5–7] mainly focus on the noise robustness issue, the proposed evaluation framework is carefully designed to attest robustness against reverberation. The proposed framework will be used as a common basis for the REVERB (REverberant Voice Enhancement and Recognition Benchmark) challenge [8]. A unique feature of the proposed evaluation framework and the challenge is that it aims to create synergy between the SE and ASR communities by defining SE and ASR tasks based on a common dataset. By evaluating SE algorithms in terms of both SE measures and ASR scores, researchers from both communities may acquire important insights into how
978-1-4799-0972-8/13/$31.00 ©2013IEEE
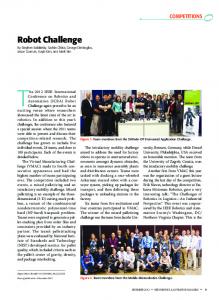
Figure 1: Target scenarios of the REVERB challenge.
their methods can interact with each other to improve ASR performance. In addition, it will clarify the way in which SE measures are related to perceptual quality and ASR improvement. Consequently, we believe that the findings of the REVERB challenge will help both the SE and ASR communities to draw potential future research directions for reverberant speech enhancement and recognition. The structure of the rest of the paper is as follows. In Section 2, we describe the datasets in detail. In Section 3, we introduce regulations for processing the datasets to ensure that the challenge task is as close to a realistic scenario as possible. Section 4 describes the speech enhancement and ASR tasks including their evaluation criteria. Section 5 summarizes benchmark results for the dataset in terms of the defined evaluation criteria, and the paper is concluded in Section 6. 2. DATASET The challenge assumes a scenario in which utterances spoken by a single stationary speaker are captured with 1-channel (1ch), 2channel (2ch) or 8-channel (8ch) circular microphone arrays, as shown in Fig. 1. As a part of the evaluation framework, we provide a dataset that consists of a training set, a development test set, and a (final) evaluation test set. Reverberant utterances in all the datasets will be provided as 1-channel, 2-channel, and 8-channel recordings. We describe each dataset in detail in the following subsections. 2.1. Development test and evaluation test set It is important to note that the proposed dataset consists of real recordings (RealData) and simulated data (SimData), part of which has similar characteristics to RealData in terms of reverberation time and microphone-speaker distance. This setup allows us to perform evaluations in terms of both practicality and robustness in various reverberant conditions. Specifically, the development (Dev.) test set and the final evaluation (Eval.) test set each consists of the following SimData and RealData: 1 The
clean and multi-condition training datasets are the same size.
2013 IEEE Workshop on Applications of Signal Processing to Audio and Acoustics
October 20-23, 2013, New Paltz, NY
Table 1: Quantity of data for Dev. and Eval. set of SimData and RealData and for training dataset1 .
# of sentences # of speakers
SimData Dev. Eval. 1484 (∼ 3 hr.) 2176 (∼4.8 hrs.) 10 28
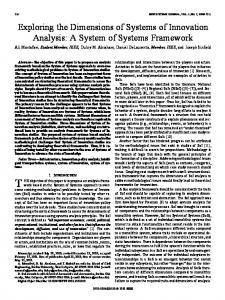
• SimData comprises reverberant utterances generated based on the WSJCAM0 corpus [9]. They are artificially distorted by convolving clean WSJCAM0 signals with measured room impulse responses (RIRs) and subsequently adding measured noise signals with a fixed signal-to-noise ratio (SNR). SimData captures a broad range of reverberation conditions thus allowing evaluations to be mode under various reverberation conditions. SimData simulates 6 different reverberation conditions: 3 rooms with different volumes (small, medium and large), 2 types of distances between a speaker and a microphone array (near=50 cm and far=200 cm). The reverberation times (T60) of the small, medium, and large-size rooms are about 0.25, 0.5, 0.7 s, respectively. The RIRs are measured in 3 different rooms with an 8-ch circular array with diameter of 20 cm as shown in Fig. 22 . The array is equipped with omni-directional microphones. Stationary background noise, which is mainly caused by air conditioning systems in the room, is measured under the same conditions with the arrays used for RIR measurement. Noise is added to the reverberant speech with an SNR3 of 20 dB. The sampling frequency for SimData is 16 kHz. • RealData comprises utterances from the MC-WSJ-AV corpus [10], which consists of utterances recorded in a noisy and reverberant room. RealData aims at evaluating the robustness against variations that are not reproducible by simulation. RealData contains a set of real recordings made in a reverberant meeting room that are different from those used for SimData. The reverberant meeting room has reverberation time of 0.7 s [10]. RealData contains 2 reverberation conditions: 1 room, 2 types of distances between the speaker and the microphone array (near∼100 cm and far∼250 cm). Judging by the reverberation time and distance between the microphone array and the speaker, SimData in the large room with the “far” condition is expected to have similar characteristics to RealData. Each speaker uttered WSJCAM0 prompts from certain locations in the corresponding room. They remained still while they were uttering a sentence. Recordings are measured with an array that has the same geometry as those used for SimData. The recordings contain a certain amount of stationary ambient noise. The sampling frequency for RealData is also 16 kHz. Note that the text prompts of the utterances used in RealData and part of the SimData are the same, but the utterances are spoken by different British English speakers. The prompts are based on the WSJ 5K [11] corpus. Therefore, we can use the same language and acoustic models for both SimData and RealData, and a comparison of the results obtained with SimData and RealData is expected to provide some novel insights.
2 Since
the RIRs measurements for SimData and real recordings for RealData are made separately at different locations, we had no choice but to use 3 microphone arrays with the same array geometry but different microphones. 3 In this case, ”S” stands for the power of a direct signal and early reflections up to 50 ms. ”N” stands for the power of the additive noise component.
RealData Dev. Eval. 179 (∼0.3 hr.) 372 (∼0.6 hr.) 5 10
Training Data 7861 (∼17.5 hrs.) 92
Figure 2: Microphone array used for measuring RIRs.
For SimData and RealData, it can be assumed that the speakers stay in the same room for each test condition4 . However, within each condition, the relative speaker-microphone position changes from utterance to utterance. The total size and number of speakers for the SimData, RealData and training datasets are summarized in Table 2. For SimData, we divided the original development and evaluation sets of the WSJCAM0 into three subsets. Each subset was allocated to one of the three rooms. For each room, we generated near and far condition data based on the same allocated subsets. Consequently, the total size of the SimData is twice that of the original WSJCAM0 dataset. For RealData, we equally divided the development and evaluation sets of the original MC-WSJ-AV into near and far conditions, according to the speaker-microphone distance of the spoken utterances. 2.2. Training dataset The training dataset consists of the clean WSJCAM0 training set and a multi-condition (MC) training set, which is generated from the clean WSJCAM0 training data by convolving the clean utterances with measured room impulse responses and adding recorded background noise. The reverberation times of the measured impulse responses range roughly from 0.2 to 0.8 sec. Note that the recording rooms used for the SimData, RealData and multi-condition training data are all different. 3. INSTRUCTIONS FOR PROCESSING THE DATA We provide a set of regulations/instructions as follows to keep the challenge task as close to real application scenarios as possible, avoid involuntary overfitting and allow systems to be broadly comparable. The following summarizes the instructions, namely the information that is and is not allowed to be utilized to process the data. See [8] for more details about the regulations. • Information that is allowed to be utilized - No room changes within a single test condition (room type and near/far position in the room). It can be assumed that 4 A test condition in this paper refers to 1 of 8 reverberatoin conditions (2 conditions for RealData, and 6 conditions for SimData).
2013 IEEE Workshop on Applications of Signal Processing to Audio and Acoustics
the speakers stay in the same room for each test condition. • Information that is not allowed to be utilized - Speaker identity: We assume that the speaker identity is unknown during test. Note that a speaker identity can be used during training. - Room parameters: The parameters of the room are assumed to be unknown. These parameters include the reverberation time, and parameters that describe the relation between direct sound and reverberation, e.g. the directto-reverberation ratio, D50, C50, the room impulse response(s). Note that these parameters can be used during training. - Speaker position: We assume that the speaker can move from one position to another within a single test condition. However, the position of the speaker is fixed within each utterance and this can be assumed for system development.
4. TASKS FOR THE REVERB CHALLENGE The REVERB challenge consists of two tasks: one for speech enhancement (SE) and the other for automatic speech recognition (ASR). In the following subsections, we describe the details of each task including the evaluation metric(s) we employed. Note that the dataset and instructions mentioned in the previous sections are intended to be common to both tasks. 4.1. SE task For the SE task, researchers can use either or both 1ch, 2ch, and/or 8ch speech enhancement algorithms. Any approach can be used to to achieve the best results as long as the regulations described in Section 3 are respected. For the SE task, we perform both objective and subjective evaluations and use several different objective measures. We take this evaluation approach because a) the applications of dereverberation algorithms are diverse, ranging from hearing aids to automatic speech recognition, and b) a universally accepted set of objective quality measures has not yet been fully established for evaluating dereverberation algorithms. The goal of the SE task is to reveal the relative merits and demerits of different approaches and also to elucidate the characteristics of each objective quality measure, which may facilitate future research and development of speech enhancement algorithms. The details of the objective measures employed and the subjective evaluation procedure can be summarized as follows. • Objective measures - Cepstrum distance (CD): The CD represents a distance between cepstra calculated from the target (i.e., observed or processed) and clean reference signals, and is an estimate of a smoothed spectral distance between the target and reference. For each test utterance, the corresponding clean signal is used as the reference. Thus, the CD is used only for SimData. The CD scores are calculated as in [12]. To ignore as far as possible the impact of coloration, cepstral mean normalization is applied before calculating the distances. Smaller values are assumed to indicate better speech quality. - Log likelihood ratio (LLR): The LLR is a conventional LPC-based measure and represents the degree of discrepancy between smoothed spectra of the target (i.e., observed or processed) and reference signals. For each
October 20-23, 2013, New Paltz, NY
test utterance, the corresponding clean signal is used as the reference. Thus, the LLR is used only for SimData. The LLR scores are calculated as in [12]. Smaller values are assumed to indicate better speech quality. - Frequency-weighted segmental SNR (FWSegSNR): The FWSegSNR is also a reference-based speech quality measure and known to have a good correlation with perceptual quality of enhanced speech [12]. For each test utterance, the corresponding clean signal is used as the reference. Thus, the FWSegSNR is used only for SimData. The FWSegSNR scores are calculated as in [12]. Larger values are assumed to indicate better speech quality. - Speech-to-reverberation modulation energy ratio (SRMR): The SRMR can be calculated only from target (i.e., observed or processed) signals. Thus, the SRNR scores are used for both SimData and RealData. The SRMR scores are calculated as in [13]. Larger values are assumed to indicate better speech quality. - PESQ: The enhanced speech signals can also be evaluated in terms of Perceptual Evaluation of Speech Quality (PESQ). Since PESQ requires reference signals, this can only be used for SimData [14]. Larger values are assumed to indicate better speech quality. • Subjective measures - A MUSHRA test [15] will be conducted focusing on perceptual attributes such as perceived distance and overall speech quality. Note that, in addition to the above measures, a speech enhancement algorithm can also be evaluated in terms of speech recognition score (i.e., word error rate). 4.2. ASR task For the ASR task, any approach can be used to achieve the best recognition results that are in accordance with the regulations described in Section 3. This means that researchers can create their own ASR system, which may use, for example, different features, different acoustic models, different training criteria, different decoding strategies, and advanced multi-channel front-end processing. As an evaluation metric, the word error rate (WER) is employed. 5. BASELINE RESULTS 5.1. Baseline results for the SE task To obtain baseline results for the SE task, we calculated scores for the observed noisy reverberant signals in terms of the objective measures described in Section 4.1. The results summarized in Table 2 were obtained by taking the average value for each test condition. With our preliminary experiments, we confirmed that we could obtain a consistent improvement for all the objective measures by using different speech enhancement algorithms. 5.2. Baseline results for the ASR task To have a common basis for evaluating different approaches, we provide a baseline speech recognition system [8], which is based on the hidden Markov model tool kit (HTK) [16]. The baseline system uses Mel-frequency cepstral coefficients (MFCCs) including Delta and Delta-Delta coefficients as features. As acoustic models, it employs tied-state HMMs with 10 Gaussian components per state trained according to the maximum-likelihood criterion. We
2013 IEEE Workshop on Applications of Signal Processing to Audio and Acoustics
October 20-23, 2013, New Paltz, NY
Table 2: Baseline results for SE task in terms of each SE evaluation criterion, obtained based on the development test set SimData RealData Room1 Room2 Room3 Ave. Room1 Ave. Near Far Near Far Near Far Near Far Cepstral distance(dB) 1.96 2.65 4.58 5.08 4.20 4.82 3.88 SRMR 4.37 4.63 3.67 2.94 3.66 2.76 3.67 4.06 3.52 3.79 Log likelihood ratio 0.34 0.38 0.51 0.77 0.65 0.85 0.58 Freq-weighted seg. SNR(dB) 8.10 6.75 3.07 0.53 2.32 0.14 3.48 PESQ 2.09 1.35 1.39 1.16 1.36 1.16 1.42 -
Input Obs. Obs. Obs. Obs.
Table 3: Baseline results for ASR task: WER obtained based on the development test set ASR system details SimData RealData (Acoustic model, Room1 Room2 Room3 Ave. Room1 Adaptation method) Near Far Near Far Near Far Near Far clean model 15.29 25.29 43.90 85.80 51.95 88.90 51.81 88.71 88.31 clean model +CMLLR 12.93 17.72 24.11 72.57 30.44 79.65 39.53 83.16 84.48 MC model 15.49 18.90 23.51 42.40 27.25 46.07 28.92 52.96 51.61 MC model +CMLLR 13.27 17.08 20.80 36.83 23.54 39.44 25.14 47.91 46.55
prepared both a clean acoustic model and a multi-condition acoustic model that we created based on the provided multi-condition training data. To evaluate the effect of typical unsupervised adaptation methods, the baseline system employed constrained MLLR (CMLLR) with regression classes. Regression coefficients are optimized in an unsupervised manner using whole data assigned to a test condition. The results we obtained are summarized in Table 4.1. The first column shows the type of input signal to the ASR system, and “Obs.” stands for (unprocessed) observed signal. The second column shows the details of the ASR systems including type of acoustic model and adaptation method used. MC model refers to the multi-condition model generated based on the multi-condition training data. The summarized results suggest that multi-condition training is a great help in improving the ASR performance. In addition, the unsupervised adaptation can successfully reduce the WER even further. 6. SUMMARY In recent years, research on reverberant speech processing has achieved significant progress in both the audio processing and speech recognition fields. To evaluate novel and established speech enhancement and recognition techniques in reverberant environments, we proposed a common evaluation framework including dataset and evaluation metrics, with the aim of helping advance the research field, providing new insights into the problem and facilitating a clear understanding of the state of the art. The proposed evaluation framework will serve as a common basis for the REVERB challenge. In this paper, we described the data and evaluation metrics in detail and reported some benchmark results. 7. ACKNOWLEDGEMENT We would like to thank the IEEE AASP Technical Committee for supporting this challenge, Christian Hofmann (University of Erlangen-Nuremberg) for his help in measuring room impulse responses, and Dr. Tiago Falk (INRS) for providing his SRMR code. We would also like to acknowledge Dr. Erich Zwyssig, Dr. Mike Lincoln and Prof. Steve Renals (University of Edinburgh), for letting us use the MC-WSJ-AV data and their effort to make it available through the LDC.
Ave. 88.51 83.81 52.28 47.23
8. REFERENCES [1] X. Huang, A. Acero, and H.-W. Hong, “Spoken Language Processing: A Guide to Theory, Algorithm and System Development,” Prentice Hall, 2001. [2] M. W¨olfel and J. McDonough, “Distant Speech Recognition,” Wiley, 2009. [3] P. A. Naylor and N. D. Gaubitch, “Speech Dereverberation,” Springer, 2010. [4] T. Yoshioka, A. Sehr, M. Delcroix, K. Kinoshita, R. Maas, T. Nakatani, and W. Kellermann, “Making Machines Understand Us in Reverberant Rooms: Robustness Against Reverberation for Automatic Speech Recognition,” IEEE Sig. Proc. Mag., 29(6), pp. 114–126, 2012. [5] D. Pearce and H.-G. Hirsch, “The Aurora experimental framework for the performance evaluation of speech recognition systems under noisy conditions,” in Proc. ICSLP, 4, pp. 29–32. 2000. [6] E. Vincent, S. Araki, F. J. Theis, G. Nolte, et al., “The Signal Separation Evaluation Campaign (2007–2010): Achievements and remaining challenges,” Signal Processing, 92, pp. 1928–1936, 2012. [7] J. Barker, E. Vincent, N. Ma, C. Christensen, and P. Green, “The PASCAL CHiME speech separation and recognition challenge” Computer Speech and Language, 27(3), pp. 621–633 (doi:10.1016/j.csl.2012.09.001), 2013. [8] http://reverb2014.dereverberation.com/. [9] T. Robinson, J. Fransen, D. Pye, J. Foote and S. Renals, “WSJCAM0: A British English Speech Corpus For Large Vocabulary Continuous Speech Recognition,” in Proc. ICASSP, pp. 81–84, 1995. [10] M. Lincoln, I. McCowan, J. Vepa and H. K. Maganti, “The multichannel Wall Street Journal audio visual corpus (MC-WSJ-AV): Specification and initial experiments,” IEEE Workshop on Automatic Speech Recognition and Understanding, pp. 357–362, 2005. [11] J. Garofalo, D. Graff, D. Paul, and D. Pallett “CSR-I (WSJ0) Complete,” Linguistic Data Consortium, Philadelphia, 2007. [12] Y. Hu and P. C. Loizou, “Evaluation of objective quality measures for speech enhancement,” IEEE T-ASLP, 16(1), pp. 229–238, 2008. [13] T. H. Falk, C. Zheng, and W.-Y. Chan et al., “A non-intrusive quality and intelligibility measure of reverberant and dereverberated speech,” IEEE T-ASLP, 18(7), pp. 1766-1774, 2010. [14] “ITU-T Recommendation P.862: Perceptual evaluation of speech quality (PESQ): An objective method for end-to-end speech quality assessment of narrow-band telephone networks and speech codecs” [15] “ITU-R recommendation BS.1534: Method for the subjective assessment of intermediate quality levels of coding systems,” [16] S. J. Young, G. Evermann, M. J. F. Gales, T. Hain, D. Kershaw, G. Moore, J. Odell, D. Ollason, D. Povey, V. Valtchev and P. C. Woodland, “The HTK Book, version 3.4”, Cambridge, UK: Cambridge University Engineering Department, 2006