Professora Dra. Hélia Cristina de Oliveira Neves (FMUL) ..... compartments (
Alves, Huntington, Rodewald, & Di Santo, 2009; G Anderson & E J Jenkinson,.
2001 ...
Universidade de Lisboa/Faculdade de Ciências Departamento de Biologia Animal
The Role of Notch Signaling in Thymic Epithelium Development
Marta Sofia Carvalho Teles de Figueiredo
MESTRADO EM BIOLOGIA EVOLUTIVA E DO DESENVOLVIMENTO 2011
Universidade de Lisboa/Faculdade de Ciências Departamento de Biologia Animal
The Role of Notch Signaling in Thymic Epithelium Development Marta Sofia Carvalho Teles de Figueiredo MESTRADO EM BIOLOGIA EVOLUTIVA E DO DESENVOLVIMENTO
Dissertação orientada por Professora Dra. Rita Maria Pulido Garcia Zilhão (DBV/FCUL) Professora Dra. Hélia Cristina de Oliveira Neves (FMUL)
2011 II
Acknowledgments
Para que tudo isto fosse possível, e como ninguém “é sozinho”, houve uma série de pessoas que fizeram parte deste meu caminho e que deixaram a “sua marca”. Quero agradecer, em primeiro lugar, à Hélia, que acreditou no meu potencial, desde que me conheceu numa rotação laboratorial do curso, e que me levou e guiou nesta jornada, não só intelectual como também psicológica. Deu-me a conhecer mais do mundo à minha volta (e do mundo da Ciência) mas também do mundo dentro de mim. Acreditou e investiu em mim, mesmo quando o cenário parecia negro, e deu-me força para continuar, e não desistir. Aceitoume de braços abertos e fez por me pôr à vontade nesta nova fase da minha vida. Ganhei uma amiga. Pela sua paciência, dedicação, e exigência, um muito obrigada. Sem ela, e sem a sua paixão pela biologia e por este tema, este trabalho não seria possível. Um obrigada à Prof. Rita Zilhão, por todo o seu conhecimento, apoio, e também pelo seu entusiasmo único, que é contagiante. Existem poucas pessoas assim, e fico contente por ter oportunidade de aprender e partilhar momentos com uma delas. Queria agradecer também ao meu grupo da Unidade de Biologia da Hematopoiese do Instituto de Histologia e Biologia do Desenvolvimento da FMUL por me acolherem de braços abertos e por toda a ajuda que me ofereceram durante este trabalho. Em especial, à Isabel e ao Vítor, que estiveram mais perto, e que sempre me apoiaram e me ofereceram sorrisos. Dentro do nosso grupo de trabalho, queria agradecer também ao Rafael, por toda a sua companhia, paciência, dedicação e gentileza, principalmente durante a fase inicial de integração no laboratório, que não teria sido tão agradável ou fácil como foi, se ele não tivesse estado presente. Um obrigada também pela amizade. Mais recentemente, a Carlota tornou-se um membro presente do grupo na recta final deste trabalho, e tal como o Rafael, a sua companhia e simpatia fizeram toda a diferença. Queria deixar um agradecimento especial ao Filipe, da UBD, que nos sugeriu a estratégia de electroporação in vivo do tubo neural de embriões de galinha para testarmos as nossas construções. Obrigada pela sugestão que se revelou muito útil, por todo o ensinamento da técnica e paciência. Fica também um agradecimento à Joana Neves pela sua ajuda na técnica e pela simpatia. Quero agradecer também ao Domingos Henrique, por nos ceder as sondas do grupo de investigação dele, que foram também uma peça vital para o nosso estudo. Um enorme obrigada a todos os amigos que acompanharam esta fase de mudança da minha vida, uns mais de perto do que outros (mas deixando, todos, o seu contributo). Aqui destaco somente alguns. À Anita e à Marta, pelos bons momentos (cheios de sorrisos) passados dentro e fora de casa, e pelo apoio incondicional nas horas negras. Ao Diogo, que é quase o positivismo em pessoa, e que sempre tentou que eu acreditasse mais em mim própria (ou própia?). À Ana, que mesmo estando a km de distância, esteve sempre por perto. Principalmente, pelas palavras certas à hora certa; naqueles momentos em que mais precisava de força, lá estava ela, como se III
soubesse miraculosamente, a dizer-me as palavras que me faziam levantar outra vez. Obrigada por toda a força, pela transmissão da força que lhe é característica. Pela sua dedicação às coisas, pela esperança no futuro, e principalmente por acreditar em mim (mais do que eu própria). À Inês, presente desde os meus 4 meses de idade, amiga desde que tenho memória, até aos dias de hoje. Inseparáveis, caminhámos lado a lado desde o infantário até à universidade, e a verdade é que isso é algo raro. Obrigada pelo ombro amigo, pela força, pelos conselhos, e pela calma que me tenta transmitir quando eu não a sei ter. Ao Marco, que entrou na minha vida como uma lufada de ar fresco, e que me ajudou nas fases mais complicadas desta jornada, tanto a nível pessoal, como profissional. Obrigada pela companhia, pelos sorrisos e gargalhadas, pela compreensão, pelo esforço e ajuda preciosa, pelo positivismo, por sonhar acordado, pela diferença (diferença essa que nos une e que me equilibra, de vez em quando), e por acreditar em mim. Finalmente, aos meus pais, que são a razão pela qual estou no mundo. Foram eles que fizeram de mim quem sou. Um muito obrigada pela boa educação, pelo incentivo ao sorriso e à aprendizagem, pelo amor aos livros e ao conhecimento. Obrigada pelo apoio e amor incondicional. Por me incentivarem a procurar mais, a acreditar que é possível chegar mais longe e por acreditarem no meu potencial. Obrigada ao resto da família, que constitui, também, o ambiente que me tornou aquilo que sou hoje. Todos fizeram a sua parte ou deixaram a sua marca para sempre naquilo que me define. Fica aqui um agradecimento eterno ao Marco, à Inês e à Carlota pelo apoio inacreditável da recta final, que só nós sabemos.
IV
Abstract The thymus generates central immune tolerance by producing self-restricted and selftolerant T-cells as a result of interactions between developing thymocytes and thymic epithelial cells (TECs). While the functional importance of TECs is well established, the mechanisms that direct their embryonic development are unclear. The Notch pathway is a major signaling pathway involved in cell-fate determination. Recently, H. Neves group observed that, during chicken embryogenesis, Notch signaling-related molecules are expressed in the endoderm of the pharyngeal pouches, prior to their specification into TECs, suggesting the involvement of Notch signaling in this process. In this work we aimed to study the role of Notch signaling in early stages of thymic development in chicken. To modulate Notch signaling in vivo, two new plasmids were generated with either the constitutively active form of Notch1 (intracellular domain of Notch1, ICN1) (pT2KICN1eGFP), or the dominant-negative (DN) form of Mastermind-like1 (MAML1) (transcriptional co-activator Notch signaling) (pT2K-DNMAML1eGFP). pT2K-ICN1eGFP and pT2K-DNMAML1eGFP were integrated in a “Tol2-mediated gene transfer” and “Tet-On” combined system of vectors developed by Y. Takahashi and collaborators, allowing the study of gain- and loss-of-function of Notch signaling, respectively. Our results show that pT2KDNMAML1eGFP plasmid in this system, is capable of blocking Notch signaling. Conversely, further assays are required to confirm the functionality of pT2K-ICN1eGFP plasmid. Future studies of gain- and loss-of-function of Notch signaling in early thymic development will be performed by the genetic modification of isolated endodermal tissues of the presumptive territory of TECs with this system. The manipulated tissues will then be grafted into the body wall of a chicken embryo and thymic development followed by in situ observation. In vitro assays of pharyngeal region explants of E3.5 and E4 chicken embryos were performed to study the effect of Notch signaling inhibition during epithelial-mesenchymal interactions in early thymic development. Thymus and parathyroid glands development was assessed by Foxn1 and Gcm2 expression, respectively. We observed that Notch signaling inhibition by a γ-Secretase inhibitor (DAPT) interferes in Foxn1 expression in an apparent random fashion, making inconclusive its role in early thymic development. On the other hand, Gcm2 expression is down-regulated when Notch signaling is inhibited. This data suggests that Notch signaling is required in early stages of parathyroid development. Further studies are essential to unravel the role of Notch signaling in early thymic development.
Keywords: Notch, thymus, thymic epithelial cells, pharyngeal pouch, endoderm, Foxn1
V
Resumo O timo gera tolerância imunitária ao produzir células-T “auto-restritas” e “autotolerantes”, cuja geração depende das interacções das suas células precursoras, os timócitos, com células especializadas do nicho tímico, as células epiteliais tímicas (CET). Embora a importância funcional das CET esteja bem estabelecida, os mecanismos moleculares responsáveis pelo seu desenvolvimento embrionário são ainda desconhecidos. O desenvolvimento do timo é acompanhado de perto pelo desenvolvimento das glândulas paratireóides. Os domínios presuntivos do timo e das glândulas paratireóides foram identificados na endoderme da 3ª e 4ª bolsas faríngicas pela expressão de Foxn1 e Gcm2, respectivamente. A especificação das CET depende de interacções entre a endoderme da 3ª e 4ª bolsas faríngicas e o mesênquima circundante - interacções epitélio-mesenquimais. Algumas destas interacções epitélio-mesenquimais começam agora a ser reveladas, nomeadamente através do trabalho do grupo de H. Neves, que demonstra que factores de transcrição como o Bmp4 e o Fgf10 são expressos sequencialmente no mesênquima e são essenciais para a especificação da endoderme da 3ª e 4ª bolsas faríngicas em CET. Outras vias de sinalização têm sido sugeridas como prováveis intervenientes neste processo. A sinalização Notch é uma delas, sendo uma via altamente conservada no reino animal, envolvida nos processos de decisão do destino celular, no desenvolvimento embrionário e no adulto. Esta via de sinalização regula vários processos biológicos, incluindo a hematopoiese, miogénese, neurogénese, vasculogénese, desenvolvimento da pele e outros processos de organogénese. Em 2001, o grupo de L. Parreira descreveu pela primeira vez, num contexto de um nicho estromal, a importância da formação de um microambiente Notch para a correcta especificação de progenitores hematopoiéticos nas diferentes linhagens linfóides. Este e outros grupos também observaram que os genes envolvidos na sinalização Notch são expressos de forma distinta nos diferentes territórios do timo adulto, reforçando a importância desta via de sinalização na função do mesmo. Recentemente, o grupo de H. Neves também observou, em embriões de galinha, que os genes envolvidos na sinalização Notch (receptores, ligandos e genes-alvo) estão diferencialmente expressos na endoderme das bolsas faríngicas, em estádios prévios à formação do rudimento tímico. Também observaram, usando um novo sistema in vitro de associações heteroespecíficas de tecidos embrionários, que a sinalização Notch interfere com a expressão normal de Foxn1 (marcador de CET) na endoderme das bolsas faríngicas. Este sistema de cultura permite uma análise funcional das moléculas envolvidas nas interacções epitélio-mesenquimais e também determinar a dinâmica temporal destas moléculas durante o desenvolvimento do timo. Este sistema recapitula in vitro os acontecimentos precoces do desenvolvimento tímico in vivo, uma vez que, quando enxertadas na membrana corioalantóide do embrião de galinha, estas associações de tecidos desenvolvem um timo funcional. Estes dados sugerem que a sinalização Notch está envolvida na especificação da endoderme das bolsas faríngicas em epitélio tímico. Neste projecto, tivemos como objectivo estudar a sinalização Notch na especificação da endoderme das bolsas faríngicas em epitélio tímico. Para isso, desenvolvemos estratégias in vivo e in vitro de ganho e perda-de-função da sinalização Notch em embriões de galinha. Para a VI
abordagem in vivo, dois plasmídeos novos foram construídos, para expressar a forma constitutivamente activa de Notch1 (domínio intracelular de Notch1, ICN1) (pT2K-ICN1eGFP) ou a forma dominante-negativa de Mastermind-like1 (MAML1) (co-activador transcricional de sinalização Notch) (DNMAML1) (pT2K-DNMAML1eGFP). Estes plasmídeos foram integrados num sistema de vectores desenvolvido por Y. Takahashi e colaboradores, que combina a “transferência génica mediada por Tol2” e a “expressão condicional dependente de tetraciclina”. Assim, este sistema de vectores oferece uma abordagem experimental única para uma análise temporal, e específica de tecido, dos efeitos de ganho e perda-de-função da sinalização Notch durante a especificação/diferenciação das CET. Para realizar esses estudos, células endodérmicas do território gerador do epitélio tímico serão modificadas geneticamente com os plasmídeos pT2K-ICN1eGFP ou pT2K-DNMAML1eGFP (neste sistema de vectores) para activar ou bloquear a sinalização Notch, respectivamente, e serão enxertadas na parede do embrião de galinha, para acompanhar in situ o desenvolvimento do timo quimérico. Os nossos resultados mostram que o plasmídeo que expressa a forma DNMAML1, pT2KDNMAML1eGFP, neste sistema de vectores, tem a capacidade de inibir a sinalização Notch. O trabalho poderá assim prosseguir para os estudos de perda-de-função da sinalização Notch na endoderme das bolsas faríngicas, antes da sua especificação em CET. Por outro lado, o plasmídeo que expressa o ICN1, pT2K-ICN1eGFP, neste sistema de vectores, necessita de mais experimentação para comprovar a sua funcionalidade. A abordagem in vitro consistiu na realização de ensaios de cultura de explantes da região faríngica de embriões de galinha com 3.5 e 4 dias de desenvolvimento para estudar o efeito da inibição farmacológica da sinalização Notch (com um inibidor da γ-Secretase – DAPT) durante as interacções epitélio-mesenquimais no desenvolvimento inicial do timo. Tanto a especificação da endoderme faríngica em epitélio tímico como a manutenção do domínio das glândulas paratireóides nos explantes em cultura foram avaliadas através da expressão in situ de Foxn1 e Gcm2, respectivamente. Os nossos ensaios in vitro revelaram que a inibição da sinalização Notch, em fases iniciais do desenvolvimento tímico, interfere com a expressão de Foxn1 de forma aparentemente aleatória, mostrando elevada heterogeneidade de resultados. Assim, o papel da sinalização Notch em fases iniciais do desenvolvimento do timo continua por precisar. Por outro lado, a expressão de Gcm2 é bloqueada com a inibição da sinalização Notch nessas mesmas fases de desenvolvimento. Portanto, os nossos dados in vitro sugerem um papel da sinalização Notch no desenvolvimento das glândulas paratireóides, pelo menos em fases iniciais do desenvolvimento. Novas experiências in vitro usando explantes da região faríngica de embriões de galinha em estádios de desenvolvimento diferentes (tanto mais precoces como mais tardios) daqueles estudados, e a realização dos estudos in vivo com o nosso sistema de vectores, serão essenciais para compreender estes resultados e também para estudar o papel da sinalização Notch na especificação/desenvolvimento das CET. Com este projecto esperamos contribuir para o conhecimento do papel da sinalização Notch no desenvolvimento normal das células epiteliais tímicas, um passo fundamental na compreensão dos eventos responsáveis pela manutenção de um timo saudável ao longo da vida VII
e pela reparação da sua função em situações patológicas. Mais, o conhecimento de elementos chave envolvidos na especificação das CET poderá no futuro permitir a criação de novos sistemas in vitro para gerar células epiteliais tímicas, as quais, por sua vez, poderão abrir novas possibilidades de produção in vitro de repertórios de células-T e novas oportunidades para restaurar a função tímica em indivíduos atímicos ou imunodeficientes e, também, melhorar as terapias de transplantação de órgãos. Palavras-chave: Notch, timo, células epiteliais tímicas, bolsa faríngica, endoderme, Foxn1
VIII
Index Acknowledgments .............................................................................................................................III Abstract ............................................................................................................................................. V Resumo ............................................................................................................................................ VI Abbreviations .....................................................................................................................................1 I. Introduction ....................................................................................................................................2 I.1. Thymus Development ..............................................................................................................2 I.2. Notch signaling ........................................................................................................................4 I.3. “Tol2-mediated gene transfer system” and “tetracycline-dependent conditional expression” system for the study of Notch signaling .........................................................................................7 I.4. Chicken model for developmental studies................................................................................9 II. Objective .....................................................................................................................................10 III. Materials and Methods ...............................................................................................................11 III.1. Molecular Biology procedures ............................................................................................11 III.2. Cellular Biology procedures ................................................................................................16 III.3. Developmental Biology procedures.....................................................................................18 IV. Results .......................................................................................................................................21 IV.1. In vivo modulation of Notch signaling in the 3/4PP endoderm ...........................................21 IV.1.1. Production ....................................................................................................................21 IV.1.2. Functional analysis .......................................................................................................23 IV.2. Expression of Notch signaling related genes in chicken embryos at stages of development prior to thymic epithelium specification .......................................................................................27 IV.2.1. Expression of Notch1 and MAML1 in chick embryos at E3 and E4 .............................27 IV.2.2. Expression of Notch signaling-related genes in the 3/4PP region (at E3 and E4) .........29 IV.3. In vitro assays: inhibition of Notch signaling in the pharyngeal region of the 3/4PP .........30 V. Discussion ...................................................................................................................................34 V.1. In vivo modulation of Notch signaling. Production of Notch Constructs: pT2K-ICN1eGFP (gain-of-function) and pT2K-DNMAML1eGFP (loss-of-function) .............................................34 V.2. Expression of Notch signaling related genes in chicken embryos at stages of development prior to thymic epithelium specification .......................................................................................36 V.2.1. Expression of Notch1 and MAML1 in chick embryos at E3 and E4 ...............................36 V.2.2. Expression of Notch signaling related genes in the 3/4PP region (E3 and E4) ..............36 IX
V.3. In vitro assays: inhibition of Notch signaling in the pharyngeal region of the 3/4PP. ..........37 VI. Conclusion .................................................................................................................................39 VII. References ................................................................................................................................40 APPENDIX I – BUFFERS, MEDIA AND OTHER SOLUTIONS .................................................48 APPENDIX II – PROTOCOLS .......................................................................................................51 APPENDIX III – CODING SEQUENCES OF ICN1 and DNMAML1 ...........................................55
X
Abbreviations aa – amino acid bp – base pairs DAPI – 4',6-diamidino-2-phenylindole DAPT – N-[N-(3,5-Difluorophenacetyl-L-alanyl)]-S-phenylglycine t-Butyl Ester DMEM – Dulbecco's Modified Eagle Medium DMSO – Dimethyl sulfoxide DN – Dominant Negative DNA – Deoxyribonucleic Acid E – Embryonic day EDTA – Ethylenediaminetetraacetic Acid FACS – Fluorescence Activated Cell Sorter FBS – Fetal Bovine Serum GFP – Green Fluorescence Protein h, min, sec, ms – hour, minute, second, milisecond ICN – Intra-cellular domain of Notch m/v – mass/volume ng/mL – nanogram/milliliter o.n. – overnight PA – Pharyngeal Arch PBS – Phosphate Buffered Saline Pen/Strep – Penicillin/Streptomycin PFA – Paraformaldehyde PP – Pharyngeal Pouch RNA – Ribonucleic Acid rpm – Revolutions per minute RT-PCR – Reverse Transcriptase-Polymerase Chain Reaction SSC-H– Side light scatter-height U/µL – units/microliter v/v – volume/volume
1
I. Introduction I.1. Thymus Development The thymus is a specialized organ of the adaptive immune system, responsible for the development of thymocytes into T lymphocytes. This organ is found in all jawed vertebrates and co-evolved with VDJ recombination mechanism which is used to somatically diversify antigen receptors (Thomas Boehm & Bleul, 2007). Although its existence was known for centuries, its immunologic function was only discovered in 1961 by Jacques Miller, when he observed a deficit in a specific type of lymphocytes (later called T-lymphocytes), after performing thymectomies in mice (Miller, 1961). Thymus organogenesis is a highly dynamic process that is initiated during fetal life and can be divided in two main temporal phases; an initial thymocyte-independent phase, where cellular interactions between the endoderm and the surrounding mesenchyme direct thymic epithelial cells (TECs) specification, followed by a thymocyte-dependent phase. At this latter stage, the thymic enlagen depends on the colonization by lymphoid progenitor cells (LPCs) for further maturation of thymic epithelium into cortical (cTECs) and medullar (mTECs) compartments (Alves, Huntington, Rodewald, & Di Santo, 2009; G Anderson & E J Jenkinson, 2001; Auerbach, 1960; C Clare Blackburn & Nancy R Manley, 2004; N M Le Douarin, Dieterlen-Lièvre, & Oliver, 1984; Klug, Carter, Gimenez-Conti, & Richie, 2002; Nehls et al., 1996). TECs are a specialized subset of thymic cells required for all stages of thymocyte differentiation (Anderson et al. 1993; Anderson, Owen, Moore, & Jenkinson, 1994; Oosterwegel et al. 1997; Klug et al. 1998; Ge & Chen, 2000; Bennett et al. 2002); specific TECs subtypes mediate particular aspects of thymopoiesis: cTECs are involved in positive selection (Cosgrove, Chan, Waltzinger, Benoist, & Mathis, 1992) and mTECs in tolerance induction (Gotter, Brors, Hergenhahn, & Bruno Kyewski, 2004). In 1975, Le Douarin & Jotereau, using the chick–quail chimera system, showed that TECs derive from the pharyngeal pouches (PP) endoderm (N M Le Douarin & Jotereau, 1975). This single, endodermal germ layer origin, of the thymic epithelium was further supported by other studies in mouse (Bleul et al., 2006; Rossi, W. E. Jenkinson, Graham Anderson, & Eric J Jenkinson, 2006). Thymic epithelium development is intimately linked to the development of the parathyroid glands, as their rudiments derive from the common embryonic structure of the PP [3rd and 4th PP (3/4PP) in chicken and humans, 3rd PP in mouse]. The pharyngeal pouches are bilateral transient structures that arise as outpocketings of the lateral foregut endoderm. The PP, along with the opposing pharyngeal clefts (PC) (invaginations of surface ectoderm) form the separation between pharyngeal arches (PA), the bilateral bulges that comprise the pharyngeal region (Fig. 1) (J. Gordon & N. R. Manley, 2011; Patel, Julie Gordon, Mahbub, C Clare Blackburn, & Nancy R Manley, 2006; Rodewald, 2008). In the mouse, the prospective thymic epithelium was identified by the expression of Foxn1 (forkhead box N1) transcription factor (J Gordon, Bennett, C C Blackburn, & N R 2
Manley, 2001), a product of the nude locus, which is required cell-autonomously for thymic epithelium differentiation and colonization by LPCs (Nehls et al., 1996; C C Blackburn et al., 1996; Bleul et al., 2006). The parathyroid rudiment was defined by the expression of Gcm2 (Glial Cell Missing 2) transcription factor (J Gordon et al., 2001); when Gcm2 is deleted, no parathyroid glands are formed (Günther et al., 2000; Z. Liu, Yu, & Nancy R Manley, 2007).
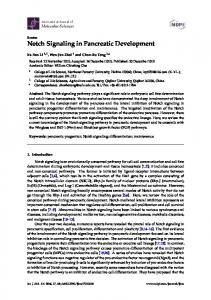
Figure 1. Scheme representing coronal section through the pharyngeal zone. Pharyngeal arches, consist of mesenchymal and mesodermal cells bounded by an outer layer of surface ectoderm (blue) and inner layer of pharyngeal endoderm (yellow). The ectoderm forms invaginations, the pharyngeal clefts, which separate the arches, whereas the endoderm forms the opposing outpocketings, the pharyngeal pouches.
In chicken, the transcription factors Foxn1 and Gcm2 are also expressed in the endodermal rudiments of the thymus and parathyroid glands, respectively. Specifically, Foxn1 domain of expression was identified as the emergent domain of thymic epithelium in the most dorsal portion of the 3/4 PP endoderm in chicken embryo at E4.5 (Fig. 2A and B) (Neves et al., 2011 in press). Conversely, parathyroid rudiments were identified in a more ventral position in the 3/4 PP by Gcm2 domain of expression (Fig. 2B) (Neves et al., 2011 in press). The initial phase of thymic organogenesis is characterized by cellular interactions between the endoderm and the surrounding neural crest-derived mesenchyme to TECs specification (Rodewald, 2008). The importance of epithelial-mesenchymal interactions was demonstrated by Le Douarin, using the chick-quail chimera system. The 3/4PP endoderm isolated from early quail embryos was able to develop into thymic epithelium with the cooperation of a heterologous mesenchyme such as the somatopleure or splanchnopleure of E3 chicken embryos, which thus could be considered “permissive” to endoderm development. Furthermore, the grafted endoderm was capable of inducing the heterologous mesenchyme to participate in the formation of a fully developed thymus (N. Le Douarin, 1967; Le Douarin, N., Bussonnet, C., Chaumont, 1968; N. M. Le Douarin & Jotereau, 1975). In contrast, mesenchymal environments of the somite and limb bud were non-permissive to 3/4PP endoderm development (N. Le Douarin, 1967; Le Douarin, N., Bussonnet, C., Chaumont, 1968). These data provided the first evidence that epithelial-mesenchymal reciprocal interactions are essential for early thymic development; moreover, they revealed that some 3
heterologous mesenchymal tissues are able to mimic the role played by neural crest-derived mesenchyme during normal development of the thymus in the pharyngeal region.
A
B
Neves et al., 2011 Figure 2. Expression of Foxn1 and Gcm2 during thymic and parathyroid glands development in chick embryos. A) In situ hybridization showing Foxn1 expression in PP3/4 endoderm isolated by microsurgery in E4.5 chicken embryos. B) Schematic 3D-representation of Foxn1 and Gcm2 expression domains in the 3rd PP endoderm of E4.5 chicken embryos. (A, anterior; D, dorsal; c, chicken; P, posterior; PP, pharyngeal pouch; V, ventral).
Recently, H. Neves work unraveled some of the early molecular events occurring at the initial thymocyte-independent stage of thymic development. Her results showed that cellular interactions between the endoderm and adjacent mesenchyme involved a sequential expression of Bmp4 and Fgf10 in the mesenchymal compartment, fundamental for the development of the 3/4PP endoderm into of thymic and parathyroid glands epithelia. Also, a temporal regulation of Bmp4 expression in the mesenchymal compartment was observed, suggesting that the Bmp4 levels need to be tightly regulated in the developing pouches (Neves et al., 2011 in press). Another signaling pathway known to be involved in epithelial cell development (dependent on mesenchymal interactions) in other organs like the skin and the gut is Notch signaling (Hu et al., 2010; T.-H. Kim, B.-M. Kim, Mao, Rowan, & Shivdasani, 2011).
I.2. Notch signaling Notch signaling is a major signaling-pathway, highly conserved in the animal kingdom, which regulates biological processes in the development of the embryo and in the adult. Notch signaling has been shown to control hematopoiesis (Jaleco et al. 2001; Neves et al. 2006; Santos et al. 2007; Parreira et al. 2003; Eric J Jenkinson et al. 2006), myogenesis (Luo, Renault, & Rando, 2005), neurogenesis (Lasky & H. Wu, 2005), vasculogenesis (L. M. Anderson & Gibbons, 2007), skin development (Estrach, Cordes, Hozumi, Gossler, & Watt, 2008) and other aspects of organogenesis. Notch receptors (Notch1-4 in mammals, Notch1-2 in birds) and their ligands (Delta1, 3 and 4; Jagged1-2 in mammals, Serrate1-2 in birds) are evolutionary conserved transmembrane proteins that regulate cell-fates, cell numbers and cell position via
4
effects on proliferation and survival (Lai, 2004). These effects depend on dose, timing, and context of the Notch signal (Lai, 2004; Maillard, Fang, & Pear, 2005). Notch-mediated transcriptional activation involves the activation of Notch receptors by their ligands that are expressed on neighboring cells. This receptor-ligand interaction will lead to the proteolytic cleavage of the intracellular domain of Notch (ICN), catalyzed by the γsecretase complex. Thus, the ICN is released from the membrane and is translocated into the nucleus, where it cooperates with the DNA-binding protein CSL and co-activators to form the transcriptional activation complex, which will activate target gene expression (W. R. Gordon, Arnett, & Stephen C Blacklow, 2008). One important co-activator is Mastermind-like (MAML) protein (L Wu et al., 2000), which appears to function as a scaffold for the formation of a large multiprotein transcriptional activation complex (Jeffries, Robbins, & Capobianco, 2002) (Fig. 3). The Mastermind protein was originally identified in D. melanogaster as a neurogenic protein genetically linked to the Notch signaling pathway (Xu, Rebay, Fleming, Scottgale, & Artavanis-Tsakonas, 1990), and the mammalian homologues that were found afterwards were named Mastermind-like proteins.
Figure 3. Schematic representation of Notch signaling pathway in chicken. Ligand (Serrate1,3 or Delta1,3,4) binding between neighboring cells induces proteolytic cleavage of Notch receptors (Notch1,2), catalyzed by the γ-secretase complex, producing the free intracellular domain of Notch (ICN). ICN translocates to the nucleus and binds to transcription factors, MAML1 being one of them. The transcription of Notch target genes (ex: Hairy1, Hes5-1 or Hes5-1) is then activated.
It is known that, when a cell is forced to express the ICN, Notch signaling is constitutively active in a ligand independent manner (G Weinmaster, 1997). On the other hand, in vitro experiments in mice have shown that truncated MAML1 proteins consisting of only the N-terminal ICN-binding domain have potent dominant negative effects, presumably due to their inability to recruit other components of the Notch transcriptional activation complex (Fryer, Lamar, Turbachova, Kintner, & K. A. Jones, 2002; Weng et al., 2003). Thus, when a
5
cell is forced to express the dominant-negative (DN) form of MAML1 protein (DNMAML1), Notch signaling is profoundly blocked. The activation of the Notch signaling induces a profound alteration of the cellular transcriptional program. The best-characterized Notch targets are the Hes genes. Hes genes are mammalian homologs of the Drosophila genes Hairy and Enhancer of split, characterized by basic helix–loop–helix proteins. Hes genes were shown to contribute to clocks that regulate somitogenesis, limb segmentation, and neural progenitor maintenance (Brend & Holley, 2009; Lewis, Hanisch, & Holder, 2009; Pascoal et al., 2007; Shimojo, Ohtsuka, & Ryoichiro Kageyama, 2008). One of the first Hes genes described in vertebrates was a homologue of Drosophila hairy in mouse, which was given the name of Hes1 (Sasai, R Kageyama, Tagawa, Shigemoto, & Nakanishi, 1992). Hes1, in general, maintains cells in the undifferentiated progenitor state, influences progenitor cell proliferation and differentiation, specifically it inhibits neuronal and muscle differentiation ( Sasai et al., 1992; Ishibashi et al., 1994). Other Hes genes have been found over the time. Hes6 proteins are known to regulate neurogenesis by contributing to release differentiating neurons from Notch signaling (Vilas-Boas & Domingos Henrique, 2010). Also, Hes6 has been shown to regulate muscle differentiation (Cossins, Vernon, Zhang, Philpott, & P. H. Jones, 2002). Furthermore, Hes5-1 is known to be a direct target of Notch signaling in the developing nervous system; Hes5-1 transcription is severely reduced when Notch signaling is blocked (De La Pompa et al., 1997; Lütolf, Radtke, Aguet, Suter, & Taylor, 2002) and its promoter is directly regulated by Notch (Nishimura et al., 1998). Previous work from L. Parreira and collaborators shown the importance of specific Notch microenvironments for the commitment of hematopoietic progenitors into different lymphoid lineages (Jaleco et al., 2001), for the expansion and lineage-differentiation of earlymyeloid progenitors (Neves et al., 2006) and for the generation of plasma cells and the amount of antibodies secreted by them, in terminal B-cell maturation (Santos et al., 2007). They also observed that Notch-related genes are differentially expressed in the adult thymic microenvironments, stressing the importance of this signaling pathway in thymic function (Jenkinson et al., 2006; Parreira et al., 2003). Notch signaling is known to play a role during late stages of thymic organogenesis. At the thymocyte-dependent phase, TECs provide Notch ligands to neighboring developing thymocytes, promoting their development (Alves, Goff, et al., 2009; Feyerabend et al., 2009; Hozumi et al., 2008; Koch et al., 2008; Tsukamoto, Itoi, Nishikawa, & Amagai, 2005). Specifically, Notch signaling activation mediated by Delta1 induced the appearance of a normal thymic architecture in murine fetal thymic organ cultures (Masuda et al., 2009). In contrast, only few evidences point to a role of Notch at early-phase of thymus formation. Preliminary results of H. Neves and collaborators suggest a role of Notch signaling during chicken thymus development. They observed Notch signaling-related genes (receptors, ligands and target genes) expressed in the prospective thymic domain and surrounding mesenchyme. In particular, the expression of Hes1, in the endoderm of the 3/4PP at E3 and E4, suggests active Notch signaling in the prospective territory of TECs. Furthermore, using a 6
novel in vitro system (developed by Neves & Le Douarin, 2009) to study early-stages of thymus development, they observed that blocking Notch signaling interferes with the normal expression of Foxn1 in the endoderm of the pharyngeal-pouches. This in vitro culture system, with heterospecific associations of embryonic tissues, allows the functional analysis of molecules involved in epithelial-mesenchymal interactions and to determine the temporal dynamics of those molecules during thymus development. These heterospecific associations of embryonic tissues, when grafted in the chorioallantoic membrane of a chick embryo, develop into a functional thymus, showing the ability of this in vitro system to recapitulate the early events of thymic development in vivo. These observations suggest that Notch signaling is involved in the specification of TECs from the endoderm of 3/4PP. To investigate how Notch signaling affects early stages of thymus organogenesis we aim to modify in a stable and cell-autonomous manner the quail endodermal tissues of the presumptive territory of TECs. This tissue will be genetically modified to either express the constitutively-active form of Notch1 , ICN1, or a dominant-negative form of MAML1, DNMAML1, using a “Tol2-mediated gene transfer” and “Tetracycline-dependent conditional expression” combined system of vectors.
I.3. “Tol2-mediated gene transfer system” and “tetracycline-dependent conditional expression” system for the study of Notch signaling Y. Takahashi and collaborators developed a combined system of transposon-mediated transgene and tetracycline-induced conditional expression (Sato et al., 2007; Watanabe et al., 2007). This system has the advantage of allowing a stable integration and a conditional expression of a transgene in chicken embryos. The original system is composed of three plasmids: 1) pT2K-CAGGS-rtTA2SM2; 2) pT2K-BI-TREeGFP and 3) pCAGGS-T2TP (Fig. 1). Both 1 and 2 plasmids have a gene expression cassette surrounded by Tol2 transposable elements. After electroporation of the three plasmids, transient activity of transposase (plasmid 3) will induce the transposon construct containing either rtTA2S-M2 (plasmid 1) or TRE-eGFP (plasmid 2) to be integrated into the host genome. The reverse tet-controlled transcriptional activator (rtTA) (plasmid 1), ubiquitously expressed by the promoter-CAGGS, acts on the ciselement promoter, tetracycline responsive element (TRE). rtTA binds to TRE only in the presence of doxycycline (an analog of tetracycline; Dox) and activates transcription of the TRE-driven gene (“Tet-On expression system”). pT2K-BI-TREeGFP has a bidirectional TRE with two minimal promoters of cytomegalovirus in both directions. In one direction, it has an eGFP sequence and on the other one a polylinker region where one can clone the transgenes of interest (Fig. 4). Thus, this system allows stable integration of transgenes in the avian genome, which can be conditionally expressed in specific time-points of development, upon administration of Dox. Cells expressing the transgene will be identified by GFP expression, therefore the correlation between the time of Dox administration and GFP expression will determine the exact moment of transgene expression. As previously mentioned, the sequences coding for the ICN1, or for the DNMAML1, in fusion with GFP, were sub-clone into the pT2K-BI-TREeGFP plasmid, so that Notch signaling 7
can be constitutively activated or blocked, respectively, in a cell-autonomous manner. The reliability of the new constructs in activating or blocking Notch signaling was analyzed using the C2C12 myoblast differentiation assay.
Figure 4. “Tol2-mediated gene transfer system” and “tetracycline-dependent conditional expression” combined system. Transient activity of transposase (pCAGGS-T2TP) will induce the transposon construct containing either rtTA2S-M2 (pT2K-CAGGS-rtTA2SM2) or TRE-eGFP (pT2K-BI-TREeGFP) to be integrated into the host genome. Activation of transcription of the TRE-driven gene (“tet-on”) occurs only in the presence of doxycycline. Adapted from Sato et al., 2007.
Myoblast differentiation assay The myoblast differentiation assay is a classical culture assay that uses differentiation of C2C12 murine myoblast cell line to evaluate the activation/inhibition of Notch signaling (R Kopan, Nye, & Weintraub, 1994; Lindsell, Shawber, Boulter, & Gerry Weinmaster, 1995). Under rich-serum conditions, the murine myoblast line C2C12 remains undifferentiated with Notch signaling activated. If deprived of serum, C2C12 cells start to differentiate, fuse to form myotubes and switch-off Notch signals (Jaleco et al., 2001; Nofziger, Miyamoto, Lyons, & G Weinmaster, 1999). C2C12 cells will be genetically modified to express either ICN1 or DNMAML1. We expect that C2C12 cells expressing ICN1 (Notch1 constitutively-active) will maintain their undifferentiated phenotype even in conditions that normally promote differentiation (low-serum conditions). Conversely, C2C12 cells expressing DNMAML1 (Notch signaling blocked) are expected to start to differentiate and form myotubes even in richserum conditions. 8
I.4. Chicken model for developmental studies The chicken embryo has been a classic model in developmental biology since the time of comparative and experimental embryology, having the longest continuous history as an experimental model for studies in developmental biology. In the last 50 years, the chicken embryo has contributed to some of the most important general concepts in vertebrate developmental biology. The availability and low cost of fertilized eggs that can be incubated to specific, well characterized, stages of development; the easiness of tissue accessibility from pregastrulation throughout all developmental stages; the fact that chicken represents the model system which most resembles other higher vertebrates while still permitting experimental intervention in ovo, and the recent discovery that chicken share more than a half of its genes with human, stressing the fact that they share several biological processes, makes chicken embryo a powerful system for developmental biology (Bourikas & Stoeckli, 2003; BronnerFraser, 2008; Stern, 2004). The chick-quail chimera system, developed by Le Douarin in the 1970s, have taken advantage of their difference in the heterochromatin structure, that could be exploited to follow easily the fate of grafted quail cells in chicken embryo. These chick-quail manipulations significantly contributed to some of developmental biology’s most important findings concerning induction of various tissues, fate mapping, patterning, cell lineage, and differentiation, because of the s. The use of chick-quail grafts was motivated by the need to selectively label define groups of cells in order to follow their pathways of migration and identify interactions during morphogenesis and organogenesis. The recent development of the transgenic technique by electroporation applied to the avian embryo has been an important advantage for this model in developmental biology. The fact that gene gain- or loss-of-function experiments can be combined with the chimeric technique brings about even more precision in the analysis of the developmental events under study, reinforcing the usefulness of the quail/chick model (Teillet, Ziller, & N M Le Douarin, 1999).
9
II. Objective The main objective of this work was to study the role of Notch signaling in early stages of thymic development. For that, we developed in vivo and in vitro experimental approaches of gain- and loss-of-function of Notch signaling in chicken. To modulate in vivo Notch signaling in a stable and cell-autonomous manner, two new vectors were generated expressing either the constitutively active form of Notch1 (ICN1) or the dominant-negative form of MAML1 (DNMAML1). Future studies of gain- and loss-of-function of Notch signaling in thymic development will be performed using these two new vectors, integrated in a “Tol2-mediated gene transfer” and “Tetracycline-dependent conditional expression” combined system of vectors. Endodermal tissues of the presumptive territory of TECs will be genetically modified to either express ICN1 or DNMAML1; will be grafted into the body wall of a chick embryo and then thymic development will be followed by in situ observation. In vitro assays of pharyngeal region explants were performed to study the effect of Notch signaling inhibition during epithelial-mesenchymal interactions in early thymic development.
10
III. Materials and Methods III.1. Molecular Biology procedures
Bacteria preparation and transformation The DH5-α strain of E. coli was used for all transformations performed in this study. Before these cells can be transformed they need to go through a process that allows the intake of exogenous DNA. Non-competent bacterial cells from frozen glycerol stock were streak out onto LB plates, grown and one colony was selected for a starter culture. The next day a higher volume of LB was inoculated with 1/100 dilution of the starter culture and incubated until it reached 0.3 optical density at 600 nm (OD600). The cells were kept on ice and harvested by a series of centrifugations in the presence of CaCl2 to generate chemically competent DH5-α cells; the transformation of DH5-α cells was performed by heat shock treatment for 1 min. Detailed protocols for both preparation and transformation of DH5-α cells are shown in the Appendix1.
Plasmid DNA mini- and midi-preparation For mini-preparation of plasmid DNA, single colonies of transformed bacteria were collected and inoculated into 5 mL of liquid LB medium supplemented with ampicillin (100 μg/mL) and incubated in a 37°C shaker (225 rpm) o.n.. The purification of plasmid DNA was carried out using the QIAprep® Spin Miniprep Kit (QIAGEN) according to the protocol recommended by the manufacturer. For midi-preparation of plasmid DNA, single colonies of transformed bacteria were grown o.n. in 50 or 100 mL (high or low copy, respectively) of liquid LB medium supplemented with ampicillin (100 μg/mL) at 37°C (225 rpm) o.n.. The purification of plasmid DNA was carried out using the QIAfilter Plasmid Midi kit (QIAGEN) according to the protocol recommended by the manufacturer. DNA samples were stored at -20ºC.
Isolation of total RNA Total RNA extraction from chicken embryos with 3 days of development was performed using High Pure RNA Isolation Kit (Roche) according to the manufacturer specifications. Embryos were cut in pieces and resuspended in 200 µL PBS. After adding 400 µL of Lysis/Binding Buffer and mixing 15 sec with a vortex, the samples were maintained at 20ºC until performing to the RNA extraction protocol. The RNA pellet was eluted in 50 µL of Elution Buffer). RNA samples were stored at -80ºC.
11
Complementary deoxyribonucleic acid (cDNA) synthesis The synthesis of the first-strand cDNA from total RNA (previous section) was carried out using the SuperScript® III First-Strand Synthesis System for RT-PCR (Invitrogen), according to the manufacturer instructions. 2 μg of total RNA were used in each reaction. cDNAs were stored at -20ºC until needed. PCR amplification cDNA template synthesized from cE3 RNA (previous section) was amplified by PCR in a 25 µl reaction with a 0.5 µM final concentration of primers, using the Phusion™ Master Mix with HF Buffer (Finnzymes), according to instructions from the manufacturer. The cycling conditions were: 1 cycle of initial denaturation at 98ºC for 30 sec; 30 cycles of denaturation at 98ºC for 10 sec, annealing at optimal temperature (see below) for 30 sec, and extension at 72ºC for 15 sec per 1Kb; and 1cycle of final extension at 72ºC for 10 min. The optimal amplification conditions were obtained by testing several temperature gradients and the presence or absence of 3% of DMSO. The use of DMSO was suggested by Phusion™ Master Mix with HF Buffer manufacturer for situations of high %G/C, which was the case. The optimal conditions of each amplification were: ICN1 - annealing temperature = 64ºC, extension= 45 sec, PCR reaction with 3% of DMSO (2417 bp product); DNMAML1- annealing temperature = 63.4ºC, extension = 15 sec (205 bp product) and MAML1- annealing temperature = 60ºC, extension = 15 sec (989 bp product). Samples were stored at -20ºC. For the PCR reaction MyCycler™ Thermal Cycler (Bio-Rad) was used.
Primers selection for amplification of chicken ICN1, DNMAML1 and MAML1 sequences ICN1 sequence: The start position of ICN1 sequence was identified in the valine 1792 in chicken, when compared to the ICN1 start position in mouse (valine 1744) (Schroeter, Kisslinger, & Kopan, 1998). The comparison of ICN1 amino-acid (aa) sequences between Mus musculus and Gallus gallus is shown below (First valine of ICN1 in bold/underlined): Mus musculus ID: NP_032740.3 1690 AAFLGALASLGSLNIPYKIEAVKSEPVEPPLPSQLHLMYVAAAAFVLLFFVGCGVLLSRK 1749 AAFLGALASLG+LNIPYKIEAVKSE EP SQL+ MYV AA VLL F+G GVL+SRK 1738 AAFLGALASLGNLNIPYKIEAVKSETAEPARNSQLYPMYVVVAALVLLAFIGVGVLVSRK 1797
Gallus gallus ID: XP_415420.2 In the Gallus gallus Notch1 gene, the 1792 aa corresponds to the nucleotides 5376-78. The end of the ICN1 sequence coincides with the end of the Notch1 sequence (the 7770 nucleotide). Partial nucleotide sequence of Notch1 in Gallus gallus is shown below (the sequences chosen for primers construction are in bold, the ICN1 coding sequence is underlined and the stop codon that corresponds to the end of the Notch1 protein is in red):
12
Notch1 Gallus gallus Gene ID: XM_415420.2 … 5341 gcactggtct tgcttgcctt cattggagtg ggagtgctgg tgtcccgcaa gcggcgcagg 5401 gagcatggcc agctctggtt cccagagggc ttcaaagtga cggagtcgag caagaagaag 5461 cgccgggaac cacttgggga agattctgtt ggactgaaac ccctcaaaaa tgcttctgac (…) 7621 gaccacccct tcctcactcc ctctccggag tctccagacc agtggtcgag ctcctcgccc 7681 cactccaacg tgtccgactg gtccgagggc atctccagcc cccccaccag catgcagtcg 7741 cagatgggac acatccccga ggccttcaag tgagacccag tggggctcag ggactgcagc … To amplify the ICN1 sequence, and allow direct cloning and further expression of ICN1 the sequence of the 5’ primer was modified introducing a restriction site and a KOZAK sequence. The final primers were: forward 5’-GCTAGCCATGgtgctggtgtcccgcaag-3’ (the inserted sequences are in capital letter; the restriction sequence of NheI is underlined; the KOZAK sequence is in bold) and reverse 5’- ctgggtctcacttgaaggcctcg-3’. DNMAML1 sequence: The dominant negative form of MAML1 was first identified in mouse (Pear et al; Blood, 2004). This sequence (12-74 aa of MAML1) includes its exclusive binding domain to ICN1 and is sufficient to block Notch1-mediated transcriptional activation (Pear et al; Blood, 2004). Thus, we used this sequence to generate the DNMAML1 in chicken. The comparison of MAML1 aa sequences between Mus musculus and Gallus gallus is shown below (in bold the DNMAML sequence): Mus musculus ID: NP_780543.2 1 1
MVLPTCPMAEFALPRHSAVMERLRRRIELCRRHHSTCEARYEAVSPERLELERQHTFALH 60 MVLP CPMA +PRHSAVMER +RIELCRRHHS CE+ RY+ AVSPERLELERQ TFALH MVLPPCPMAHLVVPRHSAVMERPFQRIELCRRHHSACESRYQAVSPERLELERQQTFALH 60
Gallus gallus Gene ID: XP_414607.2 Mus musculus ID: NP_780543.2 61 QRCIQAKAKRAGKHRQPPAAATAP--------VAAPAPASAPAAARLDAADGPEHGR--P 110 QRC+QAKAKRAGKHRQPP A P VA A S +AA G +HGR 61 QRCLQAKAKRAGKHRQPPPAPPPPAPPPPAAAVAGSAERSGANGLDGEAASGEQHGRSST 120
Gallus gallus ID: XP_414607.2 In the Gallus gallus MAML1 gene the 12 aa corresponds the 36-38 nucleotides and the 74 aa corresponds to the 222-224 nucleotides. The nucleotide sequence of MAML1 Gallus gallus is shown below (the sequences chosen for primers are in bold, the DNMAML1 sequence is underlined):
13
MAML1 Gallus gallus ID: XM_414607.2 1 atggtgctgc ccccctgccc catggcccat ttagtggtgc cgcggcacag cgcggtgatg 61 gagcggccct ttcagcgcat cgagctctgc cggcggcacc acagcgcctg cgagtcccgc 121 taccaggccg tgtccccgga gcgcctggag ctggagcgcc agcaaacctt cgccctgcac 181 cagcgctgcc tgcaggccaa ggccaagcgg gccggcaagc accgccagcc gcccccggcc … To amplify the DNMAML1 sequence, and allow direct cloning and further expression of DNMAML1 the sequence of the 5’ primer was modified introducing a restriction site and a KOZAK sequence. The final primers were: forward 5’- GCTAGCCATGgtggtgccgcggcacagc3’ (the inserted sequences are in capital letter; the restriction sequence of NheI is underlined; the KOZAK sequence is in bold) and reverse 5’- TCATCAgtgcttgccggcccgcttgg-3’ (the inserted sequence of two stop codons is in capital letter). MAML1 sequence: To generate a 989 bp riboprobe for chicken MAML1 gene (GenBank database sequence ID: XM_414607.2), the following primers were used: forward 5’cctgtgaggacaagcagtca- 3’ and reverse 5’-aacaggtgcaaaggaaatgg-3’. The product amplified corresponds to the sequence of the gene containing nucleotides 907-1895.
Restrictions Digestions Enzymatic restriction of DNA was performed for approximately 2 h using commercially available restriction enzymes and respective buffers (Promega, New England Biolabs). The volume of reaction depended on the quantity of DNA (as a rule final volume should be 10x higher (in µL) than the quantity of DNA (in µg)). The volume of enzyme used in each reaction never exceeded 10% of the total reaction volume. In all cases the temperature of reaction was 37ºC.
TOPO II PCR cloning PCR products were cloned in TOPO II PCR vector using Zero Blunt® TOPO® PCR Cloning Kit (Invitrogen) according to manufacturer instructions. Afterwards, the mix was used to transform competent DH5α bacteria. Then 250 μL of S.O.C. medium (TOPO® PCR Cloning Kit) was added and transformed cells were incubated in a 37°C shaker for 45 min (200 rpm). Bacteria were plated (20 μL and 100 μL) on solid LB agar medium supplemented with ampicillin (50µg/mL) (Sigma) and 30 μL of X-Gal (50mg/mL) (Promega) and were incubated. at 37ºC o.n.. Plasmid DNA was extracted as described (section Plasmid DNA Mini Preparation and Midi Preparation). Restriction analysis and DNA sequencing was performed to confirm the correct construction and correct sequence of the insert (PCR amplification product).
14
Cloning of ICN1 and DNMAML1 into the pT2K-BI-TREeGFP to generate pT2KICN1eGFP and pT2K-DNMAML1eGFP A second cloning reaction was performed to create the final recombinant plasmids. TOPO-ICN1, TOPO-DNMAML1 and pT2K-BI-TREeGFP were digested with EcoRV and NheI restriction enzimes. 3 μg of TOPO-ICN1 and 8 μg of TOPO-DNMAML1 were digested, each in a total reaction volume of 80 μL. For pT2K-BI-TREeGFP vector, 2 μg of DNA was digested in a total reaction volume of 30 μL. Afterwards, reaction products were loaded on an agarose gel (see section Agarose gel electrophoresis) and DNA fragments of interest were recovered and purified (see section Qiaquick gel extraction kit). The ligation reaction of the linearized vector and insert (with the correct termini) was performed according to the formula: μg of vector/vector’s dimension = 10x (μg of insert/insert’s dimension). For the ligation reactions we used 50 ng of pT2K-BI-TREeGFP (8.7kb). For the ICN1 construct we used 150 ng of the insert (ICN1 insert with 2417bp) in a total volume of 20 μL and for the DNMAML1 construct we used 12.5 ng of the insert (DNMAML1 insert with 205bp) in a total volume of 15 μL. The reactions were made in 1X Buffer for T4 DNA Ligase (Biolabs), with 1-2 μL T4 DNA ligase (Biolabs 400U/μL) at room temperature (22ºC) o.n.. The reaction product was directly used to transform DH5-α competent cells. Plasmid DNA was extracted and isolated. The correct orientation of the inserts (ICN1 and DNMAML1) into the vector (pT2K-BI-TREeGFP) was confirmed using single and double digestion with EcoRV and KpnI. Sequencing analysis was performed to verify the insert sequences.
Qiaquick gel extraction kit DNA extraction from agarose gel was carried out using the QIAquick Gel Extraction Kit (QIAGEN), according to manufacturer instructions. DNA was eluted with 50 μL of sterile distilled water.
DNA and RNA quantification The concentration of nuclear acids was determined by spectrophotometry using the NanoDrop® ND-1000 Spectrophotometer (Thermo Scientific). One A260 unit corresponds to 50 μg/ml of double-stranded DNA and to 40 μg/ml of single-stranded RNA. Samples purity was evaluated based on A260/A280 ratio (pure preparations of DNA and RNA, i.e., without significant amounts of proteins or phenol contaminants, show ratio values of 1.8 and 20, respectively).
Preparation of riboprobes for in situ hybridization To generate the antisense and sense transcripts, TOPO II PCR plasmids containing the sequence of interest, were linearized with the appropriate restriction enzyme (see appendix I). The digestion reaction was performed in a total volume of 150 μL containing 20 μg of DNA, 15 15
μL of 10X enzyme buffer, 5 μL of restriction enzyme (6 U-20 U/μL) and RNase-free water. After digestion, linearized plasmid DNA was purified using phenol:chloroform extraction and ethanol precipitation (see appendix II). The synthesis of digoxigenin (DIG) -labelled antisense and sense RNA probes was carried out by in vitro transcription at 37°C for 2h. The reaction contained 8 μL of Transcription Optimized 5X Buffer (Promega), 4 μL of 0.1M DTT (Promega), 2 μL of each rGTP, rATP, rCTP (10 mM) (Roche), 1,3 μL of rUTP (10 mM) (Roche), 0,7 μL of Digoxigenin-11-UTP (10 mM) (Roche), 2 μL of RNasin® Ribonuclease Inhibitor (Promega) and 8 μL of RNAse free water. To this mixture solution and 2 μL of the appropriate RNA polymerase (see appendix I), 2 μL (2g) of the linearized templates were added. After incubation for riboprobe synthesis, the sample was treated with 6 μL of DNase I recombinant RNase-free (10 U/μL) (Roche) at 37°C for 15 min. Purification of the probe was performed using illustra MicroSpin G-50 Columns (GE Healthcare) according to manufacturer instructions. To check for probe quality and success of transcription reaction, 2 μL of reaction product were analyzed by agarose gel electrophoresis (see below).The samples were stored at 80ºC.
Agarose gel electrophoresis Agarose gel electrophoresis was used to confirm PCR amplification products and the complete digestions with restriction enzymes, to recover and purify specific DNA fragments using extraction kit and to check riboprobe and DNA samples integrity. UltraPure TM Agarose (Invitrogen) was dissolved by heating in 1X TAE buffer (composition provided in Appendix I) to a final concentration of 0.8-1.5% (according to the required resolution for DNA fragment). To check for the presence of nuclear acids, GelRed TM Nucleic Acid Gel Stain (Biotium) or SYBR® Safe DNA Gel Stain (Invitrogen) were added to this solution in a 1:10 proportion. Samples were mixed with 6X MassRuler™ DNA Loading Dye (Fermentas) in 6:1 proportion and were loaded into the gel. Electrophoresis was performed in 1X TAE at 5-10 V/cm of gel lenght. Samples were observed under UV light and images acquired with AlphaImager HP (Alpha Innotech). The size of the fragments was estimated by comparison with the DNA ladders (FastRuler™ Low Range DNA Ladder, FastRuler™ Middle Range DNA Ladder or O'GeneRuler™ 1 kb DNA Ladder, Fermentas) run along with DNA samples.
III.2. Cellular Biology procedures Maintenance of C2C12 murine cell line The murine C2C12 cell line (provided by Christel Brou from Alain Israel’s group, Unité de Biologie Moléculaire de l’Expression Génique, Institut Pasteur, Paris, France) was maintained undifferentiated in medium containing DMEM (Invitrogen) supplemented with 20% of FBS (Invitrogen) and 1x Pen/Strep (Invitrogen). The cells were cultured on T25, T75 or T175 flasks (Nunc) using a media volume to surface area ratio of 0.1-0.2 mL/cm2. All cultures 16
were grown in a humidified incubator (Heraeus® HERAcell®) at 37ºC with 5% of CO2. C2C12 cell line aliquotes were taken from the liquid azote and put in a 37ºC bath, without immerging, long enough to start to thaw. Immediately after, the cells were resuspended in maintenance medium and plated onto a T75 flask. The medium was changed regularly until cells reached 20% confluence (higher cell confluence induces differentiation). For this, the media was removed and the cells were washed with PBS. In order to detach the cells, prewarmed 1-2 mL of 0.25% Trypsin/EDTA (Sigma) was added and the cells were incubated at 37ºC for about 5 min. When cells detached, trypsin was inactivated by addition of medium. For dilutions the appropriate volume was taken and plated. Differentiation assay C2C12 cell differentiation was induced with DMEM medium (Invitrogen) containing 2% of Horse Serum (Invitrogen) and 1x Pen/Strep (Invitrogen). Cells from two T175 flasks with 10% confluence of C2C12 were trypsinized, recovered by centrifugation at 1200 rpm for 5 min using Sorvall RT7 Plus RTH-750. Cells from each flask were resuspended in 4 mL of medium (cells from one flask resuspended in maintenance medium and cells from the other flask in differentiation medium). For each medium condition, 2 mL of cell suspension was plated in one well of a 6-well, flat-bottomed plate (TPP) covered with10x10 mm cover slips pretreated with 0.1% gelatin (m/v) in water (Sigma). After 24h, Troponin T expression was assessed by immunocytochemistry in cultured cells (see next section). Immunocytochemistry for Troponin-t To perform the immunocytochemistry for Troponin-T, C2C12 cells were fixed in 3.7% PFA/PBS, o.n.. Cells were then permeabilized with 0.5% TritonX-100 (Sigma) in PBS for 15 min, and washed 3 times with PBT (composition in appendix I) for 5 min. Then, the primary antibody (Monoclonal Mouse anti Troponin-t, CT3 - Developmental Studies Hybridoma Bank, 1:10 in PBS) was added and incubated in a humidity chamber at 37ºC for 30 min. Three washes of 5 min with PBT were followed by the addition and incubation of the secondary antibody (Policlonal Goat Anti-Mouse IgG + IgM (Jackson Immunoresearch Labs)) in a humidity chamber at 37ºC for 30 min. Three final washes of 5 min with PBT were performed and the cover slips were plated upside-down in slides with 15µL of VECTASHIELD® Mounting Medium (VectorLabs) (containing DAPI). The cover slips were sealed with nail polish and stored protected from light. The immunofluorescence data was acquired with Leica DM5000B Widefield Fluorescence Microscope. Electroporation of C2C12 C2C12 cells were electroporated with the pT2K-CAGGS-EGFP and pCAGGS-T2TP vectors (Sato et al., 2007) to assess the best electroporation conditions and efficiency rate of the procedure. Electroporation of C2C12 was performed using Gene Pulser® II Electroporation System device (Bio-Rad). To assess the best electroporation conditions, several conditions from 1 to 3 pulses of 500 V to 1650 V were tried. Cells were harvested from the flasks by trypsinization and centrifugation (procedures mentioned above), and resuspended in a proper 17
volume of PBS (800 µL/2 mm electroporation cuvette). Cell numbers from 1x10 5 to 1x10⁶ and 20 µg of each vector were added slowly through the wall of each cuvettes avoiding bubble formation. The cuvette walls were dried and placed in contact with the electrodes. After, the pulsed cells were plated in T75 flasks with maintenance medium. The next day the medium was replaced to remove dead cells and a preliminary quantification of GFP positive C2C12 cells was obtained by eye observation using Leica DMIL inverted microscope. At all times a negative control was employed, using the same conditions without DNA. The percentage of GFP positive C2C12 cells was obtained by Flow Cytometry. To do so, ≥1x10 4 cells were added to a cytometry tube and the fluorescence data was acquired in the FACSCalibur flow cytometer (Becton Dickinson).
Transfection of C2C12 C2C12 cells were transfected with the pT2K-CAGGS-EGFP and pCAGGS-T2TP vectors (Sato et al., 2007) using FuGENE 6 Transfection Reagent (Roche) according to manufacturer instructions. C2C12 cells grown until 20% confluence were trypsinized and 1x10⁵ cells were suspended in a 2 mL of maintenance medium and plated in a 6-well, flatbottomed plate (TPP). After 24 h of culture and 3 h prior to transfection, the media was changed to 1 mL of DMEM (medium without serum and antibiotics). Three concentrations of FuGENE reagent (3, 6 and 9 µL) were tested, as well as two DNA concentrations (1 and 2 µg of pT2K-CAGGS-EGFP and pCAGGS-T2TP each). After further 16h, the supernatant of the transfection mix (DMEM with DNA and FuGENE) was removed and the cells from each well were trypsinized, resuspended in maintenance medium and plated into T75 flasks (Nunc). After a few days in culture (with replating to maintain cell confluence ≤20%) GFP positive cells were quantified by Flow Cytometry, using the same method as mentioned in the previous section.
III.3. Developmental Biology procedures Chicken embryo manipulation Fertilized chicken eggs were obtained from Sociedade Agrícola Quinta da Freiria, S.A., Portugal, stored at 16ºC and incubated at 38ºC to initiate development. Embryos were staged according to Hamburger and Hamilton (Hamburger & Hamilton, 1951). At specific stages of development, embryos were dissected from the eggs, and the extra-embryonic membranes removed. Embryos were further processed differently depending on the method used subsequently: isolation of RNA, whole mount in situ hybridization or in vitro culture of branchial arch explants. In ovo electroporation of neural tube The neural tube of E2 chicken embryos was first injected with different combination of vectors (Fig. 5A), then electroporated and finally administrated with doxycycline to induce GFP and Notch construct expression in the vector system (Fig. 5B). Control conditions were performed by electroporating embryos with a mix of the four vectors: pT2K-CAGGS18
rtTA2SM2, pT2K-BI-TREeGFP, pCAGGS-T2TP (Sato et al., 2007) and pCAG-CherryNLS plasmid (encoding a nuclear form of a red fluorescent protein driven by the constitutive CAG promoter (Vilas-Boas, Fior, Swedlow, Storey, & Domingos Henrique, 2011). Plasmid pT2KBI-TREeGFP and pCAGGS-T2TP were at around 2 µg/µL; however pT2K-CAGGSrtTA2SM2 and pT2K-BI-TREeGFP were at 1:2 proportion as recommended by Watanabe and collaborators (Watanabe et al., 2007). The same proportions were used for all plasmids when injecting recombinant plasmids pT2K-ICN1eGFP and pT2K-DNMAML1eGFP (instead of pT2K-BI-TREeGFP). pCAG-CherryNLS plasmid was at a concentration of 0,1 µg/µL and was used as a control vector to assess the electroporation efficiency. Fast Green was used in the plasmid mix a 1:10 proportion to dye the DNA mix to visualize of the injection site and to follow the distribution of the injected solution in the embryo.
A
B
Figure 5. In ovo electroporation of the neural tube of chick embryos. A) Schematic representation of an HH13 embryo (E2) (adapted from Hamburguer & Hamilton,1951) injected with DNA solution into the neural tube’s lumen previous to electroporation. Electrodes position and polarity are shown by bars and by minus (-) and plus (+) signs, respectively. B) Schematic representation of the electroporation of a neural tube injected with DNA solution (blue) followed by DOX administration to induce gene expression. GFP (green) and CherryNLS (red) expression are expected in the right side of the neural tube, according to electrodes position; n:neural tube, n:notochord.
DNA solution was injected into the lumen of the neural tube of E2 chicken embryos with a microinjection capillary glass (Harvard Apparatus), using the Inject + Matic Microinjector (Inject + Matic) (Fig. 5A). Platinum electrodes (Nepagene), distanced 4 mm apart were placed parallel to the neural tube on the surface of the embryo, along the anteroposterior axis (Fig. 5A), and some drops of PBS with 1x Pen/Strep were added to the surface of the embryo. Using an ElectroSquare Porator ECM830 (BTX), 4 pulses of 25 V for 50 ms, spaced by 100 ms were applied twice. The side of the neural tube closer to the positive electrode was the experimental side (having directional entry of DNA into those cells), while the other was the control side (Fig. 5B). Immediately after electroporation, 500 µL of 0.1mg/mL doxycycline hyclate (doxycycline Sigma) in Hank’s Buffered Salt Solution (HBSS, Invitrogen) (Sato et al., 2007) were injected between the embryo and the yolk, using a 1 mL syringe and without penetrating the area opaca (Watanabe et al., 2007). For each experimental condition, embryos were electroporated with either the ICN1 or DNMAML1 DNA mix of
19
recombinant plasmids. In parallel, a set of embryos were electroporated with the control mix of DNA vectors. Embryo viability, CherryNLS and GFP expression were evaluated over time, at 16-24 h, 42-48 h and 66-72 h after electroporation, using Leica MZ10F Fluorescence stereomicroscope equipped with an Evolution™ MP 5.0 Mega-pixel Camera Kit (Media Cybernetics). Electroporated embryos were harvested and fixed in 3.7% PFA/PBS at 4ºC o.n. and further in situ hybridized with Hes5-1.
In vitro culture of pharyngeal region explants The region between the first and the fourth branchial arches was dissected from E3.5 or E4 embryos (Fig. 6A and B) on PBS, the dorsal zone was cut open vertically along the anteroposterior axis (along the notochord) and kept on ice until culture. Some dissected pharyngeal region explants (E4) were directly fixed to further analyze the expression patterns at day zero (d0) of culture by in situ hybridization. The explants were placed with the opened dorsal side down and in contact with the culture medium. Explants were grown on 24 mm Netwell™ Insert with 74 µm Mesh Size Polyester Membrane (Corning), for 48 h (E4 explants) or 60 h (E3.5 explants) in a humidified incubator at 37ºC with 5% CO2 (Fig. 6B). In control culture condition, explants were grown in RPMI-1640 Medium (Sigma) supplemented with 10% FBS (Invitrogen), 1x Pen/Strep (Invitrogen) and DMSO (Sigma). For Notch signaling inhibition, medium from control condition was supplemented with either 25 µM or 50 µM of DAPT – InSolution™ γ-Secretase Inhibitor IX (Calbiochem). After 48 h or 60 h of culture, explants were equilibrated in PBS and fixed in 3.7% PFA/PBS at 4ºC, o.n.. In the following day, fixed explants were hybridized with antisense riboprobes for Foxn1, Gcm2, Hes5-1 or Hes6-1 genes, as described in next section.
A
B
C
A L
R st
st
1 PA nd
2 PA rd
3 thPA 4 PA
1 PP
P
nd
2 PP rd
3 PP th
4 PP
culture with or without DAPT
Ventral View
Figure 6. Schematic representation of the in vitro culture assay. A) Dissection of the pharyngeal region of chicken embryo. B) Ventral view of the dissected explant with Pharyngeal Arches (PA) and Pharyngeal Pouches (PP) identified. C) Explant placed in culture in the presence or absence of Notch signaling inhibitorDAPT. (A, anterior; L, left; P, Posterior; R, Right).
20
Whole-mount and explant tissues in situ hybridization In situ hybridization of whole-mount and pharyngeal region explants of chicken embryos were performed as previously described (Henrique, 1995 and Etchevers, 2001) (detailed protocol in the appendix II). Whole-mount preparations and pharyngeal region explants were hybridized with several riboprobes: antisense and sense for ICN1, DNMAML1 and MAML1; antisense for Foxn1 (Hélia Neves et al., 2011 in press), Gcm2 (Hélia Neves et al., 2011 in press), Hes5-1 (Vilas-Boas et al., 2011) and Hes6-1 (Vilas-Boas & Domingos Henrique, 2010). Pictures were taken under a Leica Z6 APO equipped with a Leica DFC490 camera.
IV. Results IV.1. In vivo modulation of Notch signaling in the 3/4PP endoderm To modulate Notch signaling in the prospective thymic epithelium compartment we aimed to genetically modify 3/4PP endoderm using a combined system of transposon-mediated transgene and tetracycline-induced conditional expression (Sato et al., 2007; Watanabe et al., 2007). We started to generate two recombinant plasmids, having the intracellular domain of Notch1 (ICN1) or a dominant negative form of MAML1 (DNMAML1) into the pT2K-BITREeGFP vector, to constitutively activate or block Notch signaling, respectively. To clone the ICN1 and DNMAML1 sequences into pT2K-BI-TREeGFP, three steps were performed: PCR reaction to amplify the sequences of interest; cloning of the amplified sequences into TOPO II PCR Vector and then subcloning them into pT2K-BI-TREeGFP.
IV.1.1. Production To produce pT2K-ICN1eGFP vector, a 2417 bp cDNA product derived from PCR amplification of ICN1 (Fig. 7A, ICN1 lane) was cloned into TOPO II PCR (4 kb). As expected, the digestion of TOPO-ICN1 with EcoRV and NheI showed two DNA bands: one of 4 kb (TOPO II PCR) and another with 2417 bp (ICN1 insert) (Fig. 7A, TOPO-ICN1 lane). The second step consisted of subcloning the EcoRV/NheI ICN1 purified insert, from TOPO-ICN1, in the pT2K-BI-TREeGFP (8.7 kb) digested with EcoRV/NheI. Integrity of pT2K-BITREeGFP, was confirmed by the observation of an 8.7 kb DNA band when linearized with EcoRV (Fig. 7A, pT2K-BI-TREeGFP lane). The final construct obtained, the pT2KICN1eGFP, when digested with EcoRV and NheI showed two DNA bands: one of 8.7 kb (vector) and another with 2417 bp (ICN1 insert) (Fig. 7A, pT2K-ICN1eGFP lane).
21
A
6000 4000 3000 2500
5000
1000
850
2000
400
100
B
5000 2000 850
5000
3000 2000
1000 850
400 400
100
250
100
Figure 7. Agarose gels showing the several steps involved on the generation of Notch constructs. A) 0.8% (wt/vol) agarose gel showing the steps involved in the construction of pT2K-ICN1eGFP and B) 1.6% (wt/vol) agarose gel showing the steps involved in the construction pT2k-DNMAML1eGFP. Fragment sizes were determined by comparison with O'GeneRuler™ 1 kb DNA Ladder (L1) and FastRuler™ Middle Range DNA Ladder (L2). The corresponding band sizes and procedures are distinguished in the tables; DNA molecular weight markers are indicated (bp). The arrowhead in A) indicates star activity of EcoRV.
22
To produce the pT2K-DNMAML1eGFP vector, a 205 bp cDNA product derived from PCR amplification of DNMAML1 (Fig. 7B, DNMAML1 lane) was cloned into TOPO II PCR. When the plasmid TOPO-DNMAML1 was digested with EcoRV and NheI two DNA bands of 4 kb (vector) and 205 bp (DNMAML1 insert) were observed (Fig. 7B, TOPO-DNMAML1) as expected. Nextthe EcoRV/NheI DNMAML1 purified insert, obtained from TOPODNMAML1, was subcloned in the pT2K-BI-TREeGFP digested with EcoRV/NheI. Integrity of pT2K-BI-TREeGFP, was confirmed by the observation of an 8.7 kb DNA band when linearized with EcoRV (Fig. 7B, pT2K-BI-TREeGFP lane). The final construct obtained, the pT2K-DNMAML1eGFP, was confirmed by digestion with EcoRV and NheI: two DNA bands of 8.7 kb (vector) and 205 bp (DNMAML1 insert) were observed (Fig. 7B, pT2KDNMAML1eGFP lane). To confirm the correct sequence and orientation of ICN1 and DNMAML1 inserts into the pT2K-BI-TREeGFP, the final vectors, pT2K-ICN1eGFP and pT2K-DNMAML1eGFP were analysed by DNA sequencing at the insert region (full result in appendix III).
IV.1.2. Functional analysis
IV.1.2. a) Myoblast differentiation assay To evaluate the reliability of Notch constructs in this system (previous section) to modulate Notch signaling we used the functional C2C12 myoblast differentiation assay (R Kopan et al., 1994; Lindsell et al., 1995). We aimed to express in myoblast cells either a constitutively active form of Notch1 (ICN1) or a dominant negative form of MAML1 (DNMAML1) to promote the gain or loss-of-function of Notch signaling, respectively. It is known that when Notch signaling is activated, the C2C12 cells remain undifferentiated (even in differentiation medium) (Jaleco et al., 2001; Nofziger et al., 1999). In contrast, a down regulation of Notch signaling occurs when C2C12 cells start to differentiate into muscle. As previously described, we observed that C2C12 cell line grows as single cells and does not express troponin-t (Fig. 8AII) in maintenance medium. In differentiation medium, C2C12 cells start to fuse (white arrow head in Fig. 8AV) and to express troponin-t (Fig. 8AIV) (Jaleco et al., 2001). To stable integrate the Notch constructs into C2C12 cells we used two methods, electroporation and transfection with FuGENE reagent. To assess electroporation conditions and the efficiency of the procedure, we started to electroporate undifferentiated C2C12 cells with pT2K-CAGGS-EGFP and pCAGGS-T2TP. The highest percentage of GFP positive cells obtained (3.13%) with the electroporation method was using 1 pulse of 800 V (Fig. 8BII). The remaining conditions tested (see material and methods) always presented lower percentage of GFP positive cells. In parallel, C2C12 cells were transfected with pT2K-CAGGS-EGFP and pCAGGS-T2TP using FuGENE reagent. The highest percentage of GFP positive cells (3.75%) 23
was obtained with 6 µL of FuGENE and 1 µg of total DNA for both plasmids (Fig. 8BIV). The remaining conditions tested (see material and methods) always presented lower percentage of GFP positive cells. In the control conditions, C2C12 cells electroporated or transfected without DNA, any GFP positive cells were observed (Fig. 8BI and III, respectively). Together, our results showed a low efficiency in the electroporation and transfection of C2C12 cells. Thus, the functional evaluation of Notch constructs in the modulation of Notch signaling required a different experimental approach. AA
B II
Phase contrast
Troponin-t
III
IV
V
DAPI
Troponin-t
Merge
C2C12 (DM)
C2C12
I
Figure 8. C2C12 Differentiation Assay and Analysis of GFP expression on transfected C2C12 cells. A) Immunocytochemistry of C2C12 for Troponin-t and DAPI in maintenance and in differentiation medium. (C2C12, proliferating C2C12 cells; DM, differentiation medium.) Scale bars: 50 µm. B) Flow cytometry analysis of GFP expression on transfected C2C12 cells with pT2K-CAGGS-EGFP and pCAGGS-T2TP by Electroporation (II) or Transfection with FuGENE reagent (IV), and corresponding controls (without DNA) (I and III).
IV.1.2. b) In ovo electroporation A distinct experimental approach using in ovo electroporation was further used to test the functionality of the recently generated Notch constructs. It is known that in the developing nervous system, Hes5-1 is a direct target of Notch signaling (De La Pompa et al., 1997; Lütolf et al., 2002; Nishimura et al., 1998), when Notch signaling is blocked a downregulation of this target gene is observed (Vilas-Boas et al., 2011). Neural tubes of E2 embryos were electroporated with tree different plasmids combinations to assess the expression of either a constitutively active form of Notch1 (ICN1) or a dominant-negative form of MAML1 (DNMAML1). Embryos were coelectroporated with three combinations of vectors: pT2K-CAGGS-rtTA2SM2, pT2K-BI-TREeGFP and pCAGGST2TP plasmids (control condition); pT2K-CAGGS-rtTA2SM2, pT2K-ICN1eGFP and pCAGGS-T2TP plasmids (ICN1 condition); pT2K-CAGGS-rtTA2SM2, pT2K-DN1eGFP and pCAGGS-T2TP plasmids (DNMAML1 condition). 24
We started by assessing the electroporation outcomes: the viability of the electroporated embryos, the efficiency of electroporation (CherryNLS expression) and the efficiency of the system of vectors (GFP expression) at three distinct time points (at 16-24 h, 42-48 h and 66-72 h of development post-electroporation). The viability of electroporated embryos decreased over time and varied between DNA conditions (Table 3, viability column). For control condition, 81%, 40% and 38% of electroporated embryos were alive at 16-24 h, 40-48 h and 64-72 h, respectively (Table 1). Similarly, 82%, 74% and 9% of electroporated embryos with DNMAML1 condition were alive at the same time points (Table 1). Only 17% (N=2/12) of ICN1 electroporated embryos were alive at 40-48 h (Table 1), the only time point evaluated for this condition.
Table 1. Time course analysis of Viability and CherryNLS expression in the all experimental conditions (Control, DNMAML1 and ICN1) of the in vivo neural tube electroporation at the three distinct time points studied.
All time points indicate the hours post-electroporation. (N.D., Not Done).
Table 2. Time course analysis of GFP positive embryos in the all experimental conditions (Control, DNMAML1 and ICN1) of the in vivo neural tube electroporation at the three distinct time points studied.
All time points indicate the hours post-electroporation. (N.D., Not Done). * Isolated embryos for further manipulation for in situ hybridization with Hes5-1.
In control condition, the efficiency of electroporation (obtained at 16-24 h postelectroporation) was 100% (Table 1, CherryNLS expression column). Although expression was maintained over time in control embryos, a decrease in its intensity was observed (Fig. 9AII, VI and X). In contrast, the efficiency of electroporation in DNMAML1 condition was 77% and the percentage of embryos expressing CherryNLS increased over time (77%, 96% and 100%), as a result of death of electroporated embryos (Table 1). In the single experiment of electroporation with the ICN1 construct, only one of the 2 viable embryos showed CherryNLS expression at 40-48 h (Table 1).
25
*
*
Figure 9. In ovo electroporation of the neural tube of chick embryos. A) In vivo time course analysis of CherryNLS and GFP expression in embryos co-electroporated with pT2K-CAGGS-rtTA2SM2, pT2K-BITREeGFP, pCAGGS-T2TP and pCAG-CherryNLS (Control). Embryo stages adapted from Hamburguer & Hamilton, 1951. B) Expression of Hes5.1 detected by whole-mount in situ hybridization in the neural tube of electroporated chicken embryos. Hes5.1 expression in the neural tube of embryos at 64-72 h after coelectroporation with the control combination of plasmids (I, II) or with the DNMAML1 combination of plasmids (III, IV). Hes5.1 expression in the neural tube of embryos at 40-48 h after co-electroporation with the control combination of plasmids (V, VI) or the ICN1 combination of plasmids (VII, VIII). Electroporated side (arrow head) and non-electroporated side (asterisk). Scale bars: 500 µm.
To assess the efficiency of this vectors system the percentage of GFP positive embryos was calculated in relation to CherryNLS expressing embryos, at the three distinct time points (Table 2). In control condition, the percentage of GFP positive embryos was 9.6% at 16-24 h, and increased 4.5 folds (42.8%) after further 24 h of development (Fig. 9AIII and VII; Table 2). 26
This effect was due to the GFP expression in new and different embryos at 40-48 h and to some death of CherryNLS expressing embryos. At 64-72 h, the remaining control embryos continued to show GFP expression (Fig. 9AXI; Table 2). In the DNMAML1 condition, 2/22 (9%) CherryNLS expressing embryos showed GFP expression (data not shown) only at 40-48 h (Table 2). In ICN1 condition, no GFP expression was observed in CherryNLS expressing embryos at 40-48 h post-electroporation, the only time point analyzed (Table 2). Electroporated embryos from the three experimental conditions were isolated and in situ hybridized with antisense riboprobe for the Hes5-1 gene. In DNMAML1 condition, four CherryNLS expressing embryos were isolated, two embryos at 40-48 h showing weak GFP expression and two at 64-72 h with no GFP expression. Embryos isolated at 40-48 h showed normal Hes5-1 expression in the neural tube (data not shown), similar to control embryos (N=7/7, Fig. 9BI and II). Surprisingly, embryos isolated at 64-72 h showed an absence of Hes51 expression in the left side of the neural tube (electroporated side, arrow head in Fig. 9BIII and IV), when compared to the right side (non-electroporated side, asterisk in Fig. 9BIII and IV). As expected, control embryos isolated and hybridized at the same time point showed similar levels of Hes5-1 expression in both sides of the neural tube (Fig. 9BI, II, V and VI). The GFP negative embryo obtained from ICN1 condition at 40-48 h also showed similar levels of Hes5-1 expression in both sides of the neural tube (Fig. 9BVII and VIII). These data showed that cells of the neural tube when expressing DNMAML1 abolish the expression of the Notch target gene, Hes5-1. Further assays are required to evaluate the capacity of ICN1 to upregulate the expression of Hes5-1 in electroporated cells of the neural tube.
IV.2. Expression of Notch signaling related genes in chicken embryos at stages of development prior to thymic epithelium specification IV.2.1. Expression of Notch1 and MAML1 in chick embryos at E3 and E4
IV.2.1.1. Notch1 A new riboprobe for the intracellular domain of Notch1 gene was developed from the TOPO-ICN1. Antisense and sense (for control of probe quality) ICN1 riboprobes were synthesized and in situ hybridized into E3 and E4 chicken embryos. As expected, the pattern of Notch1 expression using the antisense ICN1 probe was similar to those observed when using probes for other regions of Notch1 gene (at http://geisha.arizona.edu/geisha/index.jsp). The pattern of Notch1 expression was similar in the two stages of development studied. We observed strong expression of Notch1 in the neural tube, cephalic vesicles (fore, mid and hindbrain) and otic vesicle (E3 in Fig. 10A-D and E4 in Fig. 10F-I). Furthermore, expression was observed in the optic vesicle (lens domain at E3, asterisk in Fig. 10B; boundaries of optic cup, asterisk in Fig. 10G), in the pharyngeal arches and ventral aorta (asterisks in Fig. 10C and H), in the boundaries of somites and in the distal portion of the limb (asterisks in Fig. 10D and I). 27
No detectable hybridization signals were observed in E3 and E4 embryos hybridized with ICN1 sense probe (Fig. 10 E and J).
B
Midbrain
D
st
1 PA
C
G H
*
Forebrain
2 PA
Hindbrain
*
OV
Midbrain
I
*
nd
Hindbrain
*
st
1 PA Forebrain
*
*
nd
OV 2 PA
*
L M
N
*
Midbrain
OV
Hindbrain
2 PA
*
*
st
1 PA nd
*
OV
Forebrain
Figure 10. Expression of Notch1 and MAML1 in chicken embryos prior to thymic epithelial cells specification (at E3 and E4). Notch1 expression (A, B, C, D, F, G, H, I) detected by whole-mount in situ hybridization with the ICN1 antisense riboprobe: in the head (B), in the pharyngeal region (C) and in the limb (D) at E3 (A to D) and E4 (F to I). In situ hybridization with ICN1 sense riboprobe at E3 (E) and E4 (J). MAML1 expression (K, L, M, N) was analyzed by whole-mount in situ hybridization with MAML1 antisense riboprobe: in the head (K), in the pharyngeal region (M) and in the limb (N) at E4. In situ hybridization with the MAML1 sense riboprobe at E4 (O). Asterisks indicate the optic vesicle (B, G and L), the ventral aorta (C and H), the limb (D, I and N) or the hind-brain (O); black arrow heads indicate the 3rd and 4th pharyngeal pouches; white arrow head indicate the otic vesicle. (O.V., Otic Vesicle; PA, Pharyngeal Arches; PP, Pharyngeal Pouches) Scale bars: 500 µm.
IV.2.1.2. MAML1 We first design a new riboprobe for the truncated form of MAML1 gene (205 bp, DNMAML1) from TOPO-DNMAML1. The antisense and sense DNMAML1 riboprobes were synthesized and in situ hybridized into E3 and E4 chicken embryos. Faint hybridization signals were observed in the pharyngeal arches and cephalic vesicles (data not shown). L M
N
28
In order to improve our riboprobe to a more specific one, we produced a riboprobe with a longer sequence of the gene (989 pb) and hybridized it into E4 embryos. We observed strong hybridization signals in similar regions to those previously reported when using DNMAML1 antisense probe. Specifically, strong expression of MAML1 was observed in the fore, mid and hind-brain, the lens of the optic vesicle (Fig. 10L; asterisk indicate the lens of the optic vesicle) and in the dorsal portion of the otic vesicle (asterisk in Fig. 10M). In the pharyngeal region, MAML1 expression was found in a narrow region between the 1st and 2nd PA (with arrowhead in Fig. 4M) and near the PP of the 3rd and 4th PA (black arrowheads in Fig. 10M). Additionally, weak expression of MAML1 was observed in the medial area of the limb (asterisk in Fig. 10N), somites (Fig. 10K and N) and neural tube (Fig. 10K and N). MAML1 sense probe showed faint hybridization signals in the hind-brain and otic vesicle (asterisk and arrowhead in Fig. 10O, respectively).
IV.2.2. Expression of Notch signaling-related genes in the 3/4PP region (at E3 and E4) The expression of Notch1, MAML1, Hes5-1 and Hes6-1 genes was evaluated using the antisense probes for each gene, in E3 and E4 chicken embryos. By E3, we observed uniform hybridization signals of Notch1 (using ICN1 probe) in the mesenchymal territory surrounding the 3/4PP (Fig. 11B). In E4 chicken embryos, hybridization signals were more restrict to the anterior domain of the 3/4PP (Fig. 11D) and mesenchyme of the 4th PA (Fig. 11D). MAML1 expression was present in the territory surrounding the 3/4PP of E4 chicken embryos (Fig. 11F). When we analyzed the expression of Notch target genes Hes5-1 and Hes6-1, we observed its presence in the 3/4PP region at the stages of development prior to thymic epithelium specification. In E3 chicken embryos, Hes5-1 showed a dotted expression in the mesenchyme surrounding the 3/4PP (Fig. 11H) and throughout the 3rd and 4th PA (Fig. 11H). By E4, Hes5-1 expression was observed in the 2nd and 3rd aortic arch artery (AA) (Fig. 11J) and in the anterior domain of the 3rd PP and 4th PP (Fig. 11J). In E3 chicken embryos, Hes6-1 was expressed in the 3/4PP, with stronger expression in the posterior domain of the 3rd PP and in the most ventral domain of the 4th PP (Fig. 11L). Some expression of Hes6-1 was also observed in the territory dorsally to the 3/4PP, the region of developing nodose ganglion (Fig. 11L). By E4, Hes6-1 continued to be expressed in the most dorsal/posterior domain of the 3/4PP and started to be expressed in the ventral/posterior domain of the 5th PP (Fig. 11N). Together, the data showed that Notch signaling receptor (Notch1), modulator (MAML1) and target genes (Hes5-1, Hes6-1) are expressed in the 3/4PP region of chick embryos at E3 and E4, suggesting a role of Notch signaling pathway in early stages of thymic development.
29
A
B
C
D
E
F J
G
H
I
J
K
L
M
N
Figure 11. Expression of Notch signaling-related genes during early-stages of thymus development in the pharyngeal region of chicken embryos. Whole-mount in situ hybridization and corresponding schemes showing Notch1 (A-D), MAML1 (E-F),, Hes5-1 (G-J), and Hes6-1 (K-N), in the pharyngeal region of chicken embryos at E3 and E4. Arrow heads indicate the pharyngeal region structures which show expression of the genes under study. (AA, Aortic Arch; PA, Pharyngeal Arch; PP, Pharyngeal Pouch). Scale bars: 500 µm.
IV.3. In vitro assays: inhibition of Notch signaling in the pharyngeal region of the 3/4PP In parallel to in vivo studies, we developed a new in vitro experimental approach to study Notch signaling in early stages of thymic development. Organotypic cultures of the pharyngeal region explants of E3.5 and E4 embryos were performed in the presence of a pharmacological inhibitor (DAPT) of Notch signaling. After 48 h of culture, Hes5-1 and Hes61 expression was analyzed in situ in E4 explants to evaluate Notch signaling inhibition. Furthermore, endoderm specification into thymic epithelium and maintenance of parathyroid domain in the cultured explants were analyzed by in situ expression of Foxn1 and Gcm2, respectively. Before culture, in situ hybridization of pharyngeal region explants of E4 embryos confirmed Notch1 (N=5/5) and Gcm2 (N=7/7) expression in the anterior domain of the 3/4PP endoderm (red and yellow arrow heads in Fig. 11B and C, respectively). Moreover, strong hybridization signals were also observed for Notch target genes, Hes5-1 (N=7/7, Fig. 12D) and Hes6-1 (N=8/8, Fig. 12G) in the 3/4PP. As previously reported (Hélia Neves et al., 2011 in
30
press), no Foxn1 expression was detected in the pouches at this stage of development (data not shown).
Figure 12. Expression of Notch1, Gcm2, Hes5-1, Hes6-1 and Foxn1 in the ventral side of the pharyngeal region explants of E4 chicken embryos. A) Schematic representation of the dissection of the pharyngeal zone of E4 chicken embryo and ventral view of the dissected explant with Pharyngeal Arches (PA) and Pharyngeal Pouches (PP) identified. Expression of Notch1 (B), Gcm2 (C), Hes5-1 (D), and Hes6-1 (G) in dissected explants at day zero (d0). Expression of Hes5-1 (E) and Hes6-1 (H), Gcm2 (J) and Foxn1 (N) in pharyngeal explants cultured in control condition. Expression of Hes5-1 (F) and Hes6-1 (I) in pharyngeal explants cultured in the presence of 50 µM of DAPT. Scale of expression levels for Gcm2 (K-M) and Foxn1 (O-R) in pharyngeal explants cultured in the presence of 50 µM of DAPT, compared with the expression patterns of pharyngeal explants cultured in control condition (J for Gcm2 and N for Foxn1). (A, Anterior; L, Left; P, Posterior; PA, Pharyngeal Arch; PP, Pharyngeal Pouch; R, Right). Scale bars: 500 µm.
We began to assess the dose of DAPT capable of inhibit Notch signaling in the organotypic cultures. Explants were cultured in the presence of 25 µM and 50 µM of DAPT or without DAPT (control condition). After 48 h, E4 explanted tissues grown in the presence of DAPT were viable and had similar morphology to control explants. However, in all conditions it was observed a change in the shape of the pharyngeal region with less defined borders 31
(comparison between Fig. 12C and J). As no morphological differences were observed for all culture conditions, further studies were performed using the highest DAPT concentration (50 µM), which revealed not to be toxic in other context of cell culture (ES cultures, personal communication Alcobia I.). E4 explants grown in the presence of DAPT showed no expression of Hes5-1 (N=7/7, Fig. 12F). Conversely, strong and dotted hybridization signals were observed in control conditions (N=5/5, Fig. 12E). When Hes6-1 expression was analyzed, a change in the pattern of expression was observed in explants grown with DAPT (Fig. 12I) when compared to control conditions (Fig. 12H). These results showed that, inhibition of Notch signaling with 50 µM of DAPT down-regulates the expression of Hes5-1 in pharyngeal explants. Conversely, a change of Hes6-1 expression pattern was observed in the same culture conditions. After establishing the conditions for Notch signaling inhibition, we analyzed the expression of Gcm2 and Foxn1 in the cultured explants. In all cultured explants, we observed a reduction in the size of the domain of Gcm2 expression (Fig. 12J, L and M) when compared to d0 (Fig. 12C). In addition, the majority of cultured explants showed only one pair of the domains of expression for Gcm2 (N=15/18, Fig. 12J, L and M) and Foxn1 (N=19/23, Fig. 12N, P-R) genes, instead of the expected two pairs. To evaluate the effects of Notch signaling inhibition in the expression of Gcm2 and Foxn1, a scale of expression levels was defined having control conditions as reference (Fig. 12J and N, respectively): negative (no expression) (Fig. 12K and O), lower (than control, Fig. 12L and P), equal (to control, Fig. 12M and Q), and higher (than control, Fig. 12R). The majority of E3.5 explants grown in the presence of DAPT were negative for Gcm2 expression (87.5%) and only 12.5% (N=1/8 explants) showed equal expression to control (N=9) (Table 3). In E4, 40% (N=4/10) of the explants were negative, 50% (N=5/10) showed lower expression and only 10% (N=1/10) of the explants showed equal expression to control (N=10) (Table 3). These results indicated that the inhibition of Notch signaling in the pharyngeal region blocks or reduces the expression of Gcm2 in the endoderm of the 3/4PP. Table 3 – Analysis of Gcm2 expression in pharyngeal explanted tissues grown in the presence of 50 µM of DAPT, in E3.5 and E4 developmental stages.
When we analyzed Foxn1 expression we noticed a more heterogeneous effect of Notch inhibition. In E3.5 explants cultured in DAPT condition, 2/12 (16.7%) explants were negative, 3/12 (25%) showed lower expression, 4/12 (33.3%) had equal expression and 3/12 (25%) showed higher expression than control (N=12) (Table 4). Similarly, in E4 explants, 1/11 (9.1%) was negative, 1/11 (9.1%) showed lower expression, 6/11 (54.5%) had equal expression and 3/11 (27.3%) showed higher expression than control (N=10) (Table 4). These results showed no 32
clear effect on Foxn1 expression in the 3/4PP endoderm when Notch signaling is inhibited in the pharyngeal region. Even, with refinement of embryonic stages according to Hamburger and Hamilton (HH20-24, detailed in Tables 3 and 4), we were unable to clarify the heterogeneity of the observed results. Table 4 – Analysis of Foxn1 expression in pharyngeal explanted tissues grown in the presence of 50 µM of DAPT, in E3.5 and E4 developmental stages.
33
V. Discussion The main objective of this work was to study the role of Notch signaling in early stages of thymic development. For that, we developed in vivo and in vitro experimental approaches of gain and loss-of-function of Notch signaling. To modulate in vivo Notch signaling in a stable and cell-autonomous manner, two new vectors were produced with either the constitutively active form of Notch1 (ICN1) or the dominant-negative form of MAML1 (DNMAML1). Using in ovo electroporation assay, we showed that pT2K-DNMAML1eGFP construct in this system was able to block Notch signaling, whereas pT2K-ICN1eGFP still needs confirmation to its ability to constitutively activate Notch signaling. In vitro assays of the pharyngeal region were performed to study the effect of Notch signaling inhibition during epithelial-mesenchymal interactions at early of thymic/parathyroid development. A down-regulation of Gcm2 expression was observed in the cultured explants suggesting that Notch signaling is required in early-stages of parathyroid development. Although Notch signaling receptor (Notch1), modulator (MAML1) and target genes (Hes5-1, Hes6-1) are expressed in the 3/4PP region of chick embryos at E3 and E4, no clear evidences were obtained for the role of Notch signaling in TEC specification when using our in vitro assay.
V.1. In vivo modulation of Notch signaling. Production of Notch Constructs: pT2K-ICN1eGFP (gain-of-function) and pT2K-DNMAML1eGFP (loss-of-function) To modulate Notch signaling in the prospective thymic epithelium compartment we aim to genetically modify 3/4PP endoderm using a combined system of transposon-mediated transgene and tetracycline-induced conditional expression (Sato et al., 2007; Watanabe et al., 2007). We started to design and generate two new plasmids, pT2K-ICN1eGFP (gain-offunction) and pT2K-DNMAML1eGFP (loss-of-function). These vectors were successfully obtained, as confirmed by sequencing analysis. In the next step, we tested the capacity of pT2K-ICN1eGFP and pT2K-DNMAML1eGFP to activate or inhibit Notch signaling, respectively. For that we used the classic C2C12 myoblast differentiation assay (Lindsell et al., 1995). To genetically modify C2C12 cells we used two methods, electroporation and transfection (with FuGENE reagent). These two strategies showed low efficiency in genetically modifying C2C12 cells, therefore, a different approach was used. We decided to do in vivo functional assays by electroporation of the developing neural tube of the chicken embryo. In ovo neural tube electroporation is known to be an accessible procedure and it would be an easy in vivo approach with direct results. Moreover, the sequences of our notch constructs derive from Gallus gallus Notch1 and MAML1 genes making this a more suitable assay (as opposed to the murine C2C12 assay). We began these experiments with the pT2KDNMAML1eGFP combination of vectors, as the sequence of DNMAML1 (205bp) is much 34
smaller than the sequence of ICN1 (2417bp), and so, it would be expected to be easier to integrate in the genome. In fact, we were able to confirm the functionality of pT2KDNMAML1eGFP by the lack of Hes5-1 expression in the electroporated side of the neural tube (assessed by in situ hybridization). However, and surprisingly, this result was observed in the GFP negative embryos of the DNMAML1 condition (whereas the two GFP positive embryos of DNMAML1 condition showed no differential expression of Hes5-1). Although, coexpression of GFP and DNMAML1 is expected we may hypothesis a delay in GFP expression in relation to DNMAML1 expression, in some of the cases. Other hypothesis that we may envisage is the saturation of hybridization signals of the GFP positive embryos. As to the pT2K-ICN1eGFP construct, we were unable, until the moment to verify its functionality. Only one GFP negative embryo was obtained in ICN1 condition and it showed similar levels of Hes5-1 expression in both sides of the neural tube. It is important to notice that the electroporation with ICN1 condition was only performed once, and the embryos were not in good conditions (of development), which made the electroporation procedure more difficult. The combination of these factors led to a very low viability. In addition, and as mentioned above, ICN1 insert is 2417bp long (10x DNMAML1 size), making its genomic integration more difficult. To overcome these difficulties, we repeat the electroporation with the ICN1 construct and assess its conditions for this vector. Also, there are some remarks regarding the electroporation procedure. The viability of electroporated embryos decreased over time, which was expected after aggressive manipulation of the embryos, as previously described (Sato et al., 2007). However, the more drastic decreased occurred between 24h and 48h after electroporation in control and DNMAML1 conditions [In the DNMAML1 condition, only 21 of the 38 of experimental embryos (Table 1) were monitored at 16-24h and 40-48h. We observed that 90.5% (19/21) and 57.9% (11/19) of electroporated embryos were alive at 16-24h and 40-48h, respectively.]. Therefore, some decreased of viability may be attributed to a kind of “checkpoint” during chicken development. Previous studies showed that GFP expression was expected at least 24h after electroporation and doxycycline administration (Sato et al., 2007). However, in our experiments, the emergence of GFP expression in control condition was asynchronous with only 50% of the embryos starting to express GFP at 16-24h after electroporation. Also, in the DNMAML1 experimental condition, GFP positive embryos were only detected at 40-48h postelectroporation. As, similar percentage of GFP positive embryos were observed at 16-24h in control condition and at 40-48h in DNMAML1 condition, it suggests a 24 h delay of GFP expression when embryos are electroporated with the system of vectors containing DNMAML1 construct. A hypothesis to explain this effect is a reduction in the efficiency of GFP transcription as the bicistronic promoter is also promoting DNMAML1 expression. Finally, as no new GFP positive embryos were observed at 64-72h for any experimental condition, our results suggest that GFP expression occurs in the first 48h after electroporation. To increase the percentage of GFP positive electroporated embryos, increasing concentrations and latter administration of doxycycline will also be tested in the future.
35
V.2. Expression of Notch signaling related genes in chicken embryos at stages of development prior to thymic epithelium specification V.2.1. Expression of Notch1 and MAML1 in chick embryos at E3 and E4 The pattern of Notch1 expression using the new antisense ICN1 probe was similar to those observed when using probes for other regions (or the full length) of Notch1 gene (at http://geisha.arizona.edu/geisha/index.jsp) at the two stages of development studied. As no hybridization signals were detected when using the sense ICN1 riboprobe, we concluded that the ICN1 probe is specific for Notch1 gene. As to the new probe for MAML1 gene, the MAML1 antisense probe revealed a very similar expression pattern at E4 to the one found in mouse at E9.5-10.5 (Lizi Wu et al., 2004) . The expression of MAML1 colocalized with the Notch1 expression in the cephalic vesicles, the optic and otic vesicle, as well as the limb. The presence of both mRNA in the same regions is in agreement with these genes coding for proteins belonging to Notch signaling transcriptional activation complex. Interestingly, in the limb of E4 chicken embryos, the expression of both genes does not colocalize. Notch1 expression is present in the distal portion of the limb (asterisk in Fig. 10I), whereas MAML1 is expressed in the medial area of the limb (asterisk in Fig. 10N). This suggests that at this stage the canonical pathway of Notch signaling may not be activated in the limb. Another hypothesis is that MAML1 is present in those regions working in other signaling pathways, as it is known that MAML1 proteins also have some regulatory functions in other signaling pathways, like Wnt signaling, for example(McElhinny, J.-L. Li, & L Wu, 2008).
V.2.2. Expression of Notch signaling related genes in the 3/4PP region (E3 and E4) The presumptive territories of thymus and parathyroid glands in E4.5 chicken embryos have been shown to be distinct and contiguous domains of PP3/4, with Foxn1 in the dorsal domain and Gcm2 in the median/anterior domain of the epithelial pouches (Hélia Neves et al., 2011 in press). The Notch signaling-related genes addressed in this work are expressed in the 3/4PP region before thymus development. In E3, Notch1, and target genes Hes5-1 and Hes6-1 are expressed in the surrounding mesenchyme of the 3/4PP (Fig. 11B, H and L), suggesting that Notch signaling is activated in this mesenchyme. In addition, the boundaries of 3/4PP express Notch1 (Fig. 11B) and the posterior domain of the 3rd PP and the ventral domain of the 4th PP express Hes6-1 (Fig. 11L). These data suggest a role of Notch signaling in thymic/parathyroid glands development, probably during epithelial-mesenchymal interactions prior to TEC development/specification. The assessment of MAML1 expression in E3 could add evidence for this hypothesis, so it should be studied at this stage. By E4, the 3/4PP starts to express all studied transcripts. MAML1 is expressed in the 3/4PP region (Fig. 11F), whereas Notch1 is restricted to their anterior domains (Fig. 11D). The posterior domain of 4th PP expresses Hes61(Fig. 11N) and Hes5-1 (Fig. 11J) and the surrounding mesenchyme Notch1 and MAML1 (Fig. 36
11 D and F, respectively). In addition, at this stage both Notch targets genes are expressed in the emerging 5th PP endoderm (Fig. 11J and N) and Hes5-1 is also being expressed in the 3rd and 4th AA (Fig. 11J). Again, the presence of these Notch signaling-related genes in both 3/4PP endoderm and surrounding mesenchyme suggest a role for Notch signaling in thymus/parathyroid glands development. However, it is curious to observe that Hes6-1 expression in the 3rd PP and Hes5-1 and Hes6-1 expression in the 4th PP are located in the posterior domain of the pouches (Fig. 11J and N). This domain seems to have no known fate, as neither Foxn1 nor Gcm2 are presented in it. This data suggest that Notch signaling in the posterior domain of the 3/4PP endoderm may regulate thymus/parathyroid development by restricting Foxn1 and Gcm2 expression domains.
V.3. In vitro assays: inhibition of Notch signaling in the pharyngeal region of the 3/4PP. While the in vivo assays for Notch signaling modulation were being developed, we performed in parallel in vitro assays. Explants of the pharyngeal region of E3.5 and E4 embryos were cultured in the presence of a pharmacological inhibitor of Notch signaling (DAPT) for 48 h/60 h. Endoderm specification into thymic epithelium and maintenance of parathyroid domain of the cultured explants were assessed by in situ expression of Foxn1 and Gcm2. Embryonic day 4 was first chosen for dissection and culture of pharyngeal region explants, as it is half-day prior to Foxn1 detection (E4.5) (Hélia Neves et al., 2011 in press). Also, 48 h of culture seem to be the reasonable culture time that would allow conservation of the explant’s viability and the normal establishment of Foxn1 expression. The analysis of Hes5-1 expression in the explanted tissues confirmed the efficient Notch inhibition by DAPT (Fig. 12E). Moreover, the complete inhibition of Hes5-1 expression/ablation of Hes5-1 expression further suggests that Hes5-1 is a direct target of the canonical Notch signaling pathway in the developing 3/4PP endoderm. It is interesting to observe that both in vivo and in vitro studies of inhibition/block of Notch signaling (by electroporation of DNMAML1 combination of vectors or by culture with DAPT) showed a decrease/ablation of Hes5-1 expression (Fig. 9III and IV), strongly supporting the hypothesis that Hes5-1 is a direct target of Notch signaling. On the other hand, Hes6-1 was not inhibited by γ-Secretase inhibition, suggesting it is not a direct target of the canonical Notch signaling pathway. A down-regulation of Gcm2 expression was observed in the E4 cultured explants grown in the presence of DAPT (Table 3), suggesting that Notch signaling is required in early-stages of parathyroid development. Accordingly, the results obtained with E3.5 explants supported this hypothesis, showing an even clearer trend for Gcm2 inhibition, with 87.5% of experimental explants showing negative Gcm2 expression compared to control (Table 3). Although it has been shown that Foxn1 and Notch signaling are mutually regulated during hair follicle development (Cai, Lee, Raphael Kopan, & Ma, 2009; Hu et al., 2010), we did not found clear evidences of Foxn1 regulation by Notch signaling during cellular interactions between the endoderm of the 3/4PP and surrounding mesenchyme (Table 4). 37
Similar data was obtained at E3.5 and E4 cultured explants in the presence of Notch inhibitor (DAPT condition) (Table 4). The expression of Foxn1 in half of explants in DAPT condition was similar to control. The remaining explants had either higher or lower expression levels when compared to control (Table 4). The decreased of Foxn1 expression in DAPT condition differed to previous data where mice with loss-of-function of Shh showed increased domain of Foxn1 at the expense of Gcm2 domain (Grevellec, Graham, & Tucker, 2011). On the other hand, the increased expression of Foxn1 in DAPT condition was also unexpected when evaluating previous preliminary data where Foxn1 expression was down-regulated in the 3/4PP endoderm cultured with mesenchyme in the presence of DAPT (data not shown, H. Neves group). The fact that 3/4PP endoderm development was study at different stages may contribute to this apparent discrepancy obtained in these in vitro experiments. To unravel this puzzling data, more assays must be performed. One possibility is to dissect and culture explants at younger and older stages. Furthermore, the in vivo modulation of Notch signaling by the genetic modification of 3/4PP quail endoderm (generating the gain- and loss-of-function of Notch signaling) will help to clarify the in vitro data, and ultimately, the role of Notch signaling in the specification/development of TECs.
38
VI. Conclusion With this work, we have shown that our pT2K-DNMAML1eGFP construct integrated in the “Tol2-mediated gene transfer” and “Tetracycline-dependent conditional expression” combined system of vectors was able to block Notch signaling. Therefore, we are now able to study the loss-of-function of Notch signaling in the 3/4PP endoderm during TECs specification/development. Prior to the loss-of-function study, we will characterize the original system of vectors on the chick-quail chimera system: electroporation conditions, efficiency, percentage of chimeric thymus obtained, survival, and the time interval between the administration of Doxycycline and expression of GFP, dependent of the developmental stage. On the other hand, the reliability of pT2K-ICN1eGFP construct in this system still needs to be confirmed. Thus, electroporation of chicken embryos with the combination of vectors containing the pT2K-ICN1eGFP will be repeated using higher concentrations of Doxycycline and maybe with latter administration of Doxycycline. After this confirmation, and also after the characterization of the original system of vectors, we will have a fully functional vector system that allows stable integration and inducible gain and loss-of-function of Notch signaling in the chicken. This system will allow the study of Notch signaling not only in TECs specification/development, but also in other developmental processes in the chicken model. Also, we have shown that Notch signaling receptor (Notch1), modulator (MAML1) and target genes (Hes5-1, Hes6-1) are expressed in the 3/4PP region of chick embryos at stages prior to TECs specification suggesting a role for Notch signaling in TEC specification/development.. The assessment of MAML1 expression in E3 chicken embryos will complement the information already gathered from analysis of the patterns of expression of receptor and target genes in the 3/4PP region at that stage. Our in vitro assays did not provide, until now, clear evidences for the role of Notch signaling in TECs specification/development. However, it provided evidences suggesting that Notch signaling is required in early-stages of parathyroid development. We will perform more assays to clarify our heterogeneous data for Foxn1 expression, dissecting and culturing pharyngeal explants at younger and older stages. Also, the gain- and loss-of-function studies mentioned above will help unravel our puzzling data. With the development of our in vivo and in vitro strategies, we expect to contribute for the unraveling of normal thymic development, a crucial step for understanding the events responsible for the maintenance of a healthy thymus function later in life, or for repairing its function in disease. Furthermore, this work may help to create new in vitro systems to generate T-cell repertoires thereby opening new opportunities to restore thymic function in athymic or immuno-compromised individuals, and improve organ transplantation therapies.
39
VII. References
Alves, N. L., Goff, O. R.-L., Huntington, N. D., Sousa, A. P., Ribeiro, V. S. G., Bordack, A., Vives, F. L., et al. (2009). Characterization of the thymic IL-7 niche in vivo. Proceedings of the National Academy of Sciences of the United States of America, 106(5), 1512-1517. National Academy of Sciences. Retrieved from http://www.ncbi.nlm.nih.gov/pubmed/19164539 Alves, N. L., Huntington, N. D., Rodewald, H.-R., & Di Santo, J. P. (2009). Thymic epithelial cells: the multi-tasking framework of the T cell “cradle”. Trends in Immunology, 30(10), 468-474. Retrieved from http://www.ncbi.nlm.nih.gov/pubmed/19781995 Anderson, G, & Jenkinson, E J. (2001). Lymphostromal interactions in thymic development and function. Nature Reviews Immunology, 1(1), 31-40. Nature Publishing Group. Retrieved from http://www.ncbi.nlm.nih.gov/pubmed/11905812 Anderson, L. M., & Gibbons, G. H. (2007). Notch: a mastermind of vascular morphogenesis. Journal of Clinical Investigation, 117(2), 299-302. American Society for Clinical Investigation. Retrieved from http://www.jci.org/cgi/content/abstract/117/2/299 Auerbach, R. (1960). Morphogenetic interactions in the development of the mouse thymus gland. Developmental Biology, 2, 271-284. Retrieved from http://www.ncbi.nlm.nih.gov/pubmed/13795076 Blackburn, C C, Augustine, C. L., Li, R., Harvey, R. P., Malin, M. A., Boyd, R. L., Miller, J. F., et al. (1996). The nu gene acts cell-autonomously and is required for differentiation of thymic epithelial progenitors. Proceedings of the National Academy of Sciences of the United States of America, 93(12), 5742-5746. National Acad Sciences. Retrieved from http://www.pubmedcentral.nih.gov/articlerender.fcgi?artid=39131&tool=pmcentrez&r endertype=abstract Blackburn, C Clare, & Manley, Nancy R. (2004). Developing a new paradigm for thymus organogenesis. Nature Reviews Immunology, 4(4), 278-289. Nature Publishing Group. Retrieved from http://hdl.handle.net/1842/706 Bleul, C. C., Corbeaux, T., Reuter, A., Fisch, P., Mönting, J. S., & Boehm, Thomas. (2006). Formation of a functional thymus initiated by a postnatal epithelial progenitor cell. Nature, 441(7096), 992-996. Nature Publishing Group. Retrieved from http://www.ncbi.nlm.nih.gov/pubmed/16791198
40
Boehm, Thomas, & Bleul, C. C. (2007). The evolutionary history of lymphoid organs. Nature immunology, 8(2), 131-5. doi:10.1038/ni1435 Bourikas, D., & Stoeckli, E. T. (2003). New tools for gene manipulation in chicken embryos. Oligonucleotides, 13(5), 411-419. Retrieved from http://www.ncbi.nlm.nih.gov/pubmed/15000832 Brend, T., & Holley, S. A. (2009). Expression of the oscillating gene her1 is directly regulated by Hairy/Enhancer of Split, T-box, and Suppressor of Hairless proteins in the zebrafish segmentation clock. Developmental dynamics an official publication of the American Association of Anatomists, 238(11), 2745-2759. Retrieved from http://www.ncbi.nlm.nih.gov/pubmed/19795510 Bronner-Fraser, M. (2008). Avian Embryology. Academic Press, 20-24. Cai, J., Lee, J., Kopan, Raphael, & Ma, L. (2009). Genetic interplays between Msx2 and Foxn1 are required for Notch1 expression and hair shaft differentiation. Developmental biology, 326(2), 420-30. Elsevier Inc. doi:10.1016/j.ydbio.2008.11.021 Cosgrove, D., Chan, S. H., Waltzinger, C., Benoist, C., & Mathis, D. (1992). The thymic compartment responsible for positive selection of CD4+ T cells. International Immunology, 4(6), 707-710. Retrieved from http://www.ncbi.nlm.nih.gov/entrez/query.fcgi?cmd=Retrieve&db=PubMed&dopt=Ci tation&list_uids=1352128 Cossins, J., Vernon, A. E., Zhang, Y., Philpott, A., & Jones, P. H. (2002). Hes6 regulates myogenic differentiation. Development Cambridge England, 129(9), 2195-2207. Retrieved from http://www.ncbi.nlm.nih.gov/pubmed/11959828 Le Douarin, N. (1967). Détermination précoce des ébauches de la thyroïde et du thymus chez l’embryon de Poulet. C.R. Acad. Sci., 264, 940-942. Le Douarin, N M, & Jotereau, F. V. (1975). Tracing of cells of the avian thymus through embryonic life in interspecific chimeras. The Journal of Experimental Medicine, 142(1), 17-40. The Rockefeller University Press. Retrieved from http://www.pubmedcentral.nih.gov/articlerender.fcgi?artid=2189865&tool=pmcentrez &rendertype=abstract Le Douarin, N M, Dieterlen-Lièvre, F., & Oliver, P. D. (1984). Ontogeny of primary lymphoid organs and lymphoid stem cells. The American journal of anatomy, 170(3), 261-299. Le Douarin, N., Bussonnet, C., Chaumont, F. (1968). Etude des capacités de différenciation et du rôle morphogène de l’endoderme pharyngien chez l'embryon d'Oiseau. Ann. Embryol. Morph., 1, 29-40.
41
Estrach, S., Cordes, R., Hozumi, K., Gossler, A., & Watt, F. M. (2008). Role of the Notch ligand Delta1 in embryonic and adult mouse epidermis. The Journal of investigative dermatology, 128(4), 825-32. doi:10.1038/sj.jid.5701113 Feyerabend, T. B., Terszowski, G., Tietz, A., Blum, C., Luche, H., Gossler, A., Gale, N. W., et al. (2009). Deletion of Notch1 converts pro-T cells to dendritic cells and promotes thymic B cells by cell-extrinsic and cell-intrinsic mechanisms. Immunity, 30(1), 67-79. Retrieved from http://www.ncbi.nlm.nih.gov/pubmed/19110448 Fryer, C. J., Lamar, E., Turbachova, I., Kintner, C., & Jones, K. A. (2002). Mastermind mediates chromatin-specific transcription and turnover of the Notch enhancer complex. Genes & Development, 16(11), 1397-1411. Cold Spring Harbor Laboratory Press. Retrieved from http://www.pubmedcentral.nih.gov/articlerender.fcgi?artid=186317&tool=pmcentrez &rendertype=abstract Gordon, J, Bennett, A. R., Blackburn, C C, & Manley, N R. (2001). Gcm2 and Foxn1 mark early parathyroid- and thymus-specific domains in the developing third pharyngeal pouch. Mechanisms of Development, 103(1-2), 141-143. Retrieved from http://www.ncbi.nlm.nih.gov/pubmed/11335122 Gordon, J., & Manley, N. R. (2011). Mechanisms of thymus organogenesis and morphogenesis. Development, 138(18), 3865-3878. doi:10.1242/dev.059998 Gordon, W. R., Arnett, K. L., & Blacklow, Stephen C. (2008). The molecular logic of Notch signaling--a structural and biochemical perspective. Journal of cell science, 121(Pt 19), 3109-19. doi:10.1242/jcs.035683 Gotter, J., Brors, B., Hergenhahn, M., & Kyewski, Bruno. (2004). Medullary epithelial cells of the human thymus express a highly diverse selection of tissue-specific genes colocalized in chromosomal clusters. The Journal of Experimental Medicine, 199(2), 155-166. The Rockefeller University Press. Retrieved from http://www.ncbi.nlm.nih.gov/pubmed/14734521 Grevellec, A., Graham, A., & Tucker, A. S. (2011). Shh signalling restricts the expression of Gcm2 and controls the position of the developing parathyroids. Developmental biology, 353(2), 194-205. Elsevier B.V. doi:10.1016/j.ydbio.2011.02.012 Günther, T., Chen, Z. F., Kim, J., Priemel, M., Rueger, J. M., Amling, M., Moseley, J. M., et al. (2000). Genetic ablation of parathyroid glands reveals another source of parathyroid hormone. Nature, 406(6792), 199-203. Retrieved from http://www.ncbi.nlm.nih.gov/pubmed/10910362 Hamburger, V., & Hamilton, H. L. (1951). A series of normal stages in the development of the chick embryo. Journal of morphology, 88(1), 49–92. Retrieved from http://homepage.univie.ac.at/~metschb9/Hamburger51_ChickStages.pdf 42
Hozumi, K., Mailhos, C., Negishi, N., Hirano, K.-I., Yahata, T., Ando, K., Zuklys, S., et al. (2008). Delta-like 4 is indispensable in thymic environment specific for T cell development. The Journal of Experimental Medicine, 205(11), 2507-2513. The Rockefeller University Press. Retrieved from http://discovery.ucl.ac.uk/144745/ Hu, B., Lefort, K., Qiu, W., Nguyen, B.-C., Rajaram, R. D., Castillo, E., He, F., et al. (2010). Control of hair follicle cell fate by underlying mesenchyme through a CSLWnt5a-FoxN1 regulatory axis. Genes & development, 24(14), 1519-32. doi:10.1101/gad.1886910 Ishibashi, M., Moriyoshi, K., Sasai, Y., Shiota, K., Nakanishi, S., & Kageyama, R. (1994). Persistent expression of helix-loop-helix factor HES-1 prevents mammalian neural differentiation in the central nervous system. the The European Molecular Biology Organization Journal, 13(8), 1799-1805. Retrieved from http://www.pubmedcentral.nih.gov/articlerender.fcgi?artid=395019&tool=pmcentrez &rendertype=abstract Jaleco, a C., Neves, H, Hooijberg, E., Gameiro, P, Clode, N, Haury, M., Henrique, D, et al. (2001). Differential effects of Notch ligands Delta-1 and Jagged-1 in human lymphoid differentiation. The Journal of experimental medicine, 194(7), 991-1002. Retrieved from http://www.pubmedcentral.nih.gov/articlerender.fcgi?artid=2193482&tool=pmcentrez &rendertype=abstract Jeffries, S., Robbins, D. J., & Capobianco, A. J. (2002). Characterization of a HighMolecular-Weight Notch Complex in the Nucleus of Notchic-Transformed RKE Cells and in a Human T-Cell Leukemia Cell Line. Molecular and Cellular Biology, 22(11), 3927-3941. American Society for Microbiology. Retrieved from http://www.ncbi.nlm.nih.gov/pubmed/11997524 Jenkinson, Eric J, Jenkinson, W. E., Rossi, S. W., & Anderson, Graham. (2006). The thymus and T-cell commitment: the right niche for Notch? Nature Reviews Immunology, 6(7), 551-555. Retrieved from http://www.ncbi.nlm.nih.gov/pubmed/16799474 Kim, T.-H., Kim, B.-M., Mao, J., Rowan, S., & Shivdasani, R. a. (2011). Endodermal Hedgehog signals modulate Notch pathway activity in the developing digestive tract mesenchyme. Development (Cambridge, England), 138(15), 3225-33. doi:10.1242/dev.066233 Klug, D. B., Carter, C., Gimenez-Conti, I. B., & Richie, E. R. (2002). Cutting edge: thymocyte-independent and thymocyte-dependent phases of epithelial patterning in the fetal thymus. The Journal of Immunology, 169(6), 2842-2845. Retrieved from http://www.ncbi.nlm.nih.gov/pubmed/12218095 Koch, U., Fiorini, E., Benedito, R., Besseyrias, V., Schuster-Gossler, K., Pierres, M., Manley, Nancy R, et al. (2008). Delta-like 4 is the essential, nonredundant ligand for 43
Notch1 during thymic T cell lineage commitment. The Journal of Experimental Medicine, 205(11), 2515-2523. The Rockefeller University Press. Retrieved from http://www.pubmedcentral.nih.gov/articlerender.fcgi?artid=2571927&tool=pmcentrez &rendertype=abstract Kopan, R, Nye, J. S., & Weintraub, H. (1994). The intracellular domain of mouse Notch: a constitutively activated repressor of myogenesis directed at the basic helix-loop-helix region of MyoD. Development Cambridge England, 120(9), 2385-2396. Retrieved from http://www.ncbi.nlm.nih.gov/pubmed/7956819 De La Pompa, J. L., Wakeham, A., Correia, K. M., Samper, E., Brown, S., Aguilera, R. J., Nakano, T., et al. (1997). Conservation of the Notch signalling pathway in mammalian neurogenesis. Development Cambridge England, 124(6), 1139-1148. COMPANY OF BIOLOGISTS LTD. Retrieved from http://www.ncbi.nlm.nih.gov/pubmed/9102301 Lai, E. C. (2004). Notch signaling: control of cell communication and cell fate. Development (Cambridge, England), 131(5), 965-73. doi:10.1242/dev.01074 Lasky, J. L., & Wu, H. (2005). Notch signaling, brain development, and human disease. Pediatric Research, 57(5 Pt 2), 104R-109R. Retrieved from http://www.ncbi.nlm.nih.gov/pubmed/15817497 Lewis, J., Hanisch, A., & Holder, M. (2009). Notch signaling, the segmentation clock, and the patterning of vertebrate somites. Journal of Biology, 8(4), 44. BioMed Central. Retrieved from http://www.pubmedcentral.nih.gov/articlerender.fcgi?artid=2688916&tool=pmcentrez &rendertype=abstract Lindsell, C. E., Shawber, C. J., Boulter, J., & Weinmaster, Gerry. (1995). Jagged: A mammalian ligand that activates notch1. Cell, 80(6), 909-917. doi:10.1016/00928674(95)90294-5 Liu, Z., Yu, S., & Manley, Nancy R. (2007). Gcm2 is required for the differentiation and survival of parathyroid precursor cells in the parathyroid/thymus primordia. Developmental Biology, 305(1), 333-346. Retrieved from http://www.pubmedcentral.nih.gov/articlerender.fcgi?artid=1931567&tool=pmcentrez &rendertype=abstract Luo, D., Renault, V. M., & Rando, T. A. (2005). The regulation of Notch signaling in muscle stem cell activation and postnatal myogenesis. Seminars in cell developmental biology, 16(4-5), 612-622. Retrieved from http://www.ncbi.nlm.nih.gov/pubmed/16087370 Lütolf, S., Radtke, F., Aguet, M., Suter, U., & Taylor, V. (2002). Notch1 is required for neuronal and glial differentiation in the cerebellum. Development Cambridge England, 129(2), 373-85. Retrieved from http://www.ncbi.nlm.nih.gov/pubmed/11807030 44
Maillard, I., Fang, T., & Pear, W. S. (2005). Regulation of lymphoid development, differentiation, and function by the Notch pathway. Annual review of immunology, 23(Figure 1), 945-74. doi:10.1146/annurev.immunol.23.021704.115747 Masuda, K., Germeraad, W. T. V., Satoh, R., Itoi, M., Ikawa, T., Minato, N., Katsura, Y., et al. (2009). Notch activation in thymic epithelial cells induces development of thymic microenvironments. Molecular immunology, 46(8-9), 1756-67. doi:10.1016/j.molimm.2009.01.015 McElhinny, a S., Li, J.-L., & Wu, L. (2008). Mastermind-like transcriptional co-activators: emerging roles in regulating cross talk among multiple signaling pathways. Oncogene, 27(38), 5138-47. doi:10.1038/onc.2008.228 Miller, J. F. (1961). Immunological function of the thymus. Lance, 2(7205), 748-749. Mumm, J. S., & Kopan, R. (2000). Notch signaling: from the outside in. Developmental Biology, 228(2), 151-165. Retrieved from http://www.ncbi.nlm.nih.gov/entrez/query.fcgi?cmd=Retrieve&db=PubMed&dopt=Ci tation&list_uids=11112321 Nehls, M., Kyewski, B, Messerle, M., Waldschütz, R., Schüddekopf, K., Smith, a J., & Boehm, T. (1996). Two genetically separable steps in the differentiation of thymic epithelium. Science (New York, N.Y.), 272(5263), 886-9. Retrieved from http://www.ncbi.nlm.nih.gov/pubmed/8629026 Neves, Hélia, Dupina, E., Parreira, Leonor, & Le Douarin, Nicole M. (2011). Modulation of Bmp4 signalling in the epithelial-mesenchymal interactions that take place in early thymus and parathyroid development in avian embryos. Neves, Hélia, Weerkamp, F., Gomes, A. C., Naber, B. a E., Gameiro, Paula, Becker, J. D., Lúcio, P., et al. (2006). Effects of Delta1 and Jagged1 on early human hematopoiesis: correlation with expression of notch signaling-related genes in CD34+ cells. Stem cells (Dayton, Ohio), 24(5), 1328-37. doi:10.1634/stemcells.2005-0207 Nishimura, M., Isaka, F., Ishibashi, M., Tomita, K., Tsuda, H., Nakanishi, S., & Kageyama, R. (1998). Structure, chromosomal locus, and promoter of mouse Hes2 gene, a homologue of Drosophila hairy and Enhancer of split. Genomics, 49(1), 69-75. Retrieved from http://www.ncbi.nlm.nih.gov/pubmed/9570950 Nofziger, D., Miyamoto, a, Lyons, K. M., & Weinmaster, G. (1999). Notch signaling imposes two distinct blocks in the differentiation of C2C12 myoblasts. Development (Cambridge, England), 126(8), 1689-702. Retrieved from http://www.ncbi.nlm.nih.gov/pubmed/10079231
45
Parreira, Leonor, Neves, Hélia, & Simões, S. (2003). Notch and lymphopoiesis: a view from the microenvironment. Seminars in Immunology, 15(2), 81-89. doi:10.1016/S1044-5323(03)00004-6 Pascoal, S., Carvalho, C. R., Rodriguez-León, J., Delfini, M.-C., Duprez, D., Thorsteinsdóttir, S., & Palmeirim, I. (2007). A molecular clock operates during chick autopod proximal-distal outgrowth. Journal of Molecular Biology, 368(2), 303-309. Retrieved from http://www.ncbi.nlm.nih.gov/pubmed/17346744 Patel, S. R., Gordon, Julie, Mahbub, F., Blackburn, C Clare, & Manley, Nancy R. (2006). Bmp4 and Noggin expression during early thymus and parathyroid organogenesis. Gene expression patterns GEP, 6(8), 794-799. Retrieved from http://www.ncbi.nlm.nih.gov/pubmed/16517216 Plotkin, J., Prockop, S. E., Lepique, A., & Petrie, H. T. (2003). Critical role for CXCR4 signaling in progenitor localization and T cell differentiation in the postnatal thymus. The Journal of Immunology, 171(9), 4521-4527. Retrieved from http://www.ncbi.nlm.nih.gov/pubmed/14568925 Rodewald, H.-R. (2008). Thymus organogenesis. Annual review of immunology, 26, 35588. doi:10.1146/annurev.immunol.26.021607.090408 Rossi, S. W., Jenkinson, W. E., Anderson, Graham, & Jenkinson, Eric J. (2006). Clonal analysis reveals a common progenitor for thymic cortical and medullary epithelium. Nature, 441(7096), 988-991. Nature Publishing Group. Retrieved from http://www.ncbi.nlm.nih.gov/pubmed/16791197 Santos, M. A., Sarmento, L. M., Rebelo, M., Doce, A. A., Maillard, I., Dumortier, A., Neves, Helia, et al. (2007). Notch1 engagement by Delta-like-1 promotes differentiation of B lymphocytes to antibody-secreting cells. Proceedings of the National Academy of Sciences of the United States of America, 104(39), 15454-9. doi:10.1073/pnas.0702891104 Sasai, Y., Kageyama, R, Tagawa, Y., Shigemoto, R., & Nakanishi, S. (1992). Two mammalian helix-loop-helix factors structurally related to Drosophila hairy and Enhancer of split. Genes & Development, 6(12B), 2620-2634. Retrieved from http://www.genesdev.org/cgi/doi/10.1101/gad.6.12b.2620 Sato, Y., Kasai, T., Nakagawa, S., Tanabe, K., Watanabe, T., Kawakami, K., & Takahashi, Y. (2007). Stable integration and conditional expression of electroporated transgenes in chicken embryos. Developmental biology, 305(2), 616-24. doi:10.1016/j.ydbio.2007.01.043 Shimojo, H., Ohtsuka, T., & Kageyama, Ryoichiro. (2008). Oscillations in notch signaling regulate maintenance of neural progenitors. Neuron, 58(1), 52-64. Retrieved from http://www.ncbi.nlm.nih.gov/pubmed/18400163 46
Stern, C. D. (2004). The chick embryo--past, present and future as a model system in developmental biology. Mechanisms of development, 121(9), 1011-3. doi:10.1016/j.mod.2004.06.009 Teillet, M. A., Ziller, C., & Le Douarin, N M. (1999). Quail-chick chimeras. Methods in molecular biology (Clifton, N.J.), 97, 305-07. doi:10.1385/1-59259-270-8:305 Tsukamoto, N., Itoi, M., Nishikawa, M., & Amagai, T. (2005). Lack of Delta like 1 and 4 expressions in nude thymus anlages. Cellular immunology, 234(2), 77-80. doi:10.1016/j.cellimm.2005.06.009 Vilas-Boas, F., & Henrique, Domingos. (2010). HES6-1 and HES6-2 Function through Different Mechanisms during Neuronal Differentiation. (E. Giniger, Ed.)PLoS ONE, 5(12), 15. Public Library of Science. Retrieved from http://www.pubmedcentral.nih.gov/articlerender.fcgi?artid=2996300&tool=pmcentrez &rendertype=abstract Vilas-Boas, F., Fior, R., Swedlow, J. R., Storey, K. G., & Henrique, Domingos. (2011). A novel reporter of notch signalling indicates regulated and random notch activation during Vertebrate neurogenesis. BMC biology (Vol. 9, p. 58). doi:10.1186/1741-70079-58 Watanabe, T., Saito, D., Tanabe, K., Suetsugu, R., Nakaya, Y., Nakagawa, S., & Takahashi, Y. (2007). Tet-on inducible system combined with in ovo electroporation dissects multiple roles of genes in somitogenesis of chicken embryos. Developmental biology, 305(2), 625-36. doi:10.1016/j.ydbio.2007.01.042 Weinmaster, G. (1997). The ins and outs of Notch signaling. Molecular and Cellular Neuroscience. Retrieved from http://www.sciencedirect.com/science?_ob=MImg&_imagekey=B6WNB-45TKY22101&_cdi=6958&_user=582538&_orig=search&_coverDate=12/31/1997&_sk=9999099 97&view=c&wchp=dGLbVlzzSkzS&md5=6b574c877351a088df392de8e087f6b2&ie=/sdarticle.pdf Wu, L, Aster, J. C., Blacklow, S C, Lake, R., Artavanis-Tsakonas, S., & Griffin, J D. (2000). MAML1, a human homologue of Drosophila mastermind, is a transcriptional co-activator for NOTCH receptors. Nature Genetics, 26(4), 484-9. doi:10.1038/82644 Wu, Lizi, Kobayashi, K., Sun, T., Gao, P., Liu, J., Nakamura, M., Weisberg, E., et al. (2004). Cloning and functional characterization of the murine mastermind-like 1 (Maml1) gene. Gene, 328, 153-65. doi:10.1016/j.gene.2003.12.007 Xu, T., Rebay, I., Fleming, R. J., Scottgale, T. N., & Artavanis-Tsakonas, S. (1990). The Notch locus and the genetic circuitry involved in early Drosophila neurogenesis. Genes & Development, 4(3), 464-475. 47
APPENDIX I – BUFFERS, MEDIA AND OTHER SOLUTIONS
48
BUFFERS FOR MULTIPLE USES 1X TAE EDTA (pH 8) Acetic acid Tris base
1 mM 20 mM 40 mM
PBS 1X NaCl 137 mM KCL 2.7 mM KCL 2.7 mM Na2HPO4 10 mM KH2PO4 2 mM Adjust pH to 7.4 with HCl
PBT 0.1% Triton PBS
0.1% to final volume
BACTERIAL GROWTH Lysogeny Broth (LB) medium Tryptone 1% Yeast extract 0.5% NaCl 1%
LB agar 7.5 g agar per 500 mL of LB medium
SOLUTIONS FOR WHOLE MOUNT IN SITU HYBRIDIZATION 3.7% Paraformaldehyde (PFA) in PBS 7.4% Paraformaldehyde (stock) 1:2 PBS 1:2
PBT 0.1% Triton PBS
0.1% to final volume
49
Hybridization Solution
Stock Solution
100 mL
50% Formamide
100%
50 mL
1.3X SSC pH=5
20X
7.5 mL
5 mM EDTA pH=8
500 mM
1 mL
50 µg/ml Yeast RNA
20 mg/mL
250 µL
0.2% Tween 20
100%
0.4 mL
0.5% CHAPS
10%
5 mL
100 µg/mL Heparine
50 mg/mL
0.2 mL 35.65 mL
H2 O
MAB pH=7,5
Stock Solution
100 mL
0.1 M Maleic Acid
2M
5 mL
0.15 M NaCl
5M
3 mL
NaOH
10 N
1.5+0.5 mL 90 mL
H2 O
Adjust pH to 7.5 with NaOH 10N MABT: 0.1% Tween 20/MAB
NTM pH=9.5
Stock Solution
100 mL
0.1 M Tris pH=9.5
1M
10 mL
0.1 M NaCl
5M
2 mL
MgCl2
2M
2.5 mL
H2O
Ribopribes ICN1 Sense linearized with EcoRV synthesized with SP6 Antisense linearized with HindIII synthesized with T7
85.5 mL
DNMAML1 linearized with EcoRV synthesized with SP6 linearized with HindIII synthesized with T7
MAML1 linearized with HindIII synthesized with T7 linearized with EcoRV synthesized with SP6
Table 5. Restriction enzymes and RNA Polymerases used to generate ICN1, DNMAML1 and MAML1 sense and antisense riboprobes.
50
APPENDIX II – PROTOCOLS
51
PREPARATION AND TRANSFORMATION OF COMPETENT DH5Α STRAIN OF E.COLI Non-competent bacterial cells from frozen glycerol stock were streak out onto LB plate and grown o.n.. Single colonies were selected for the starter culture with 3 mL of fresh LB without antibiotics and grown o.n. in a 37°C shaker (225 rpm).The next day 2 mL from the starter culture were diluted into 200 mL of fresh LB without antibiotics and incubated in a 37ºC shaker (225 rpm) for 3 h (until it reaches optical density at 600 nm (OD 600) of 0.4–0.6). The culture was collected and put on ice (it is important to keep the cells and solutions on ice for the rest of the protocol). The cells were harvested at 4000 rpm for 5 min at 4ºC and the supernatant removed. After adding half of the initial volume of cold MgCl2 0.1 M, cells were harvested again and the supernatant removed again. Afterwards, it was added half of the initial volume of cold CaCl 2 0.1 M and incubated on ice for 30 min. The cells were harvested again, the supernatant removed, and the pellet was resuspended in CaCl2 0.1 M/15% Glycerol to 1/15 of the original/initial volume. The final volume suspension was distributed in aliquots of 500 μL into 1.5 mL criotubes and stored at -80ºC. To transform DH5α cells, between 1-10 μL (15-20 μL from ligations) of circular plasmid DNA were incubated with 100-200 μL of competent bacteria (DH5α) for 20 min on ice. Then, they were exposed to a heat shock at 42ºC for 2 min followed by cooling on ice for 10 min. Next, 1 mL of LB medium was added and incubated in a 37°C shaker (225 rpm) for 45 min. Bacteria were plated (20-300 μL) on solid LB Agar medium containing ampicillin (100 μg/mL) (Sigma) and incubated o.n. at 37ºC to select the transformed bacteria.
PHENOL: CHLOROFORM EXTRACTION AND PRECIPITATION WITH ETHANOL This step was performed to remove proteins from a nucleic acid solution. It was added 150 μL of phenol: chloroform 1:1 (v/v) (Ambion) per sample and the lower phase (chloroform) was removed by pipetting with thin tips. After centrifuging at 11000 rpm for 5 min at 4ºC, the lower phase was removed again. Again, 150 μL of phenol: chloroform 1:1 (v/v) was added per sample, centrifuged at 11000 rpm for 10 min at 4ºC and then the lower phase removed. The aqueous phase, which contains nucleic acids, is the one that remains and 15 μL of sodium acetate (NaAC) 3 M and 450 μL of absolute ethanol were added per sample. After the precipitation of the DNA by incubating at -80ºC for 30 min, the mixture was centrifuged at 13000 rpm for 30 min at 4ºC. The supernatant was removed and the pellet dried and resuspended in 10 μL of RNase-free water.
WHOLE-MOUNT IN SITU HYBRIDIZATION PROTOCOL
1. Dissect embryos in PBS and remove as much of the extra-embryonic membranes as possible. 2. Fix the embryos in 3.7% Paraformaldehyde/PBS, leave in the roller for some time at room temperature and keep/store at 4°C o.n.. 3. Wash two times in PBT (0.1% Tween-20/PBS) for 5 min (Roller). 52
4. Dehydration: 4.1. Wash embryos in 50% Methanol/PBT for 5 min (Roller). 4.2. Wash two times in 100% Methanol (Roller) for 5 min and store at -20°C o.n. (it can be stored up to one month). This o.n. incubation can be replaced by an incubation at -80ºC for 1-2h. 5. Rehydrate embryos through Methanol series: 75%, 50%, 25% Methanol/PBT (Roller) for 5 min each. 6. Wash two times in PBT (Roller). 7. Permeabilize embryos with 20 μg/mL proteinase K in PBT (Roller) (1h30 and 2h for E3 and E4 embryos, respectively). 8. Transfer the permeabilized embryos directly to Post-Fixation solution: 3.7% Paraformaldehyde /0.1% Glutaraldehyde/PBT, for 20 min. 9. Rinse and wash once with PBT for 5 min (Roller). 10. Transfer the embryos to a proper/suitable hybridization tube. HYBRIDIZATION: 11. Rinse once with 1:1 hybridization solution/PBT mix; rinse with 2 mL of new hybridization solution/PBT and let embryos settle. 12. Rinse with hybridization solution. Rinse with 2 mL of new hybridization solution and let embryos settle. 13. Replace with 1 mL hybridization solution and prehybridize at 70ºC for 2 h. 14. Replace the hybridization solution by 1 mL of pre-warmed hybridization solution with ≈400ng/mL of DIG-labeled RNA probe and hybridize at 70ºC o.n. POST-HYBRIDIZATION WASHES: 15. Rinse twice with prewarmed (70°C) hybridization solution. 16. Wash twice with prewarmed (70ºC) hybridization solution for 40 min. 17. Wash with prewarmed (70ºC) hybridization solution: Maleic Acid Buffer (MABT) for 30 min. 18. Rinse twice with MABT. 19. Wash twice with MABT for 30 min. (Roller) IMUNO 20. Block with 2% Boehringer Blocking Solution (BBS)/20% heat treated Fetal Bovine Serum (FBS)/MABT for 2 h (Roller).
53
21. Incubate with 1:2000 Anti-Digoxigenin-AP, Fab fragments antibody (Roche) in 2% BBS/20% FBS/MABT o.n.. POST-ANTIBODY WASHES AND REVELATION 22. Rinse 3 times with MABT (Roller) for 1-2 h. In the second rinse, perforate cephalic vesicles of the embryos and transfer them to larger tubes. 23. Wash with MABT for 2-3 days with a 12 h frequency (Roller). 24. Wash twice with NTM for 10 min. 25. Reveal with 0.45µL NBT (nitro blue tetrazolium chloride) + 3,5µL BCIP (5-bromo-4-chloro-3indolyl-phosphate) in 1 mL NTM. Incubate at 37ºC protected from light. Follow regularly the revelation reaction. 26. When color has developed to the desired extent, stop reaction by washing 3 times with PBT. Replace the PBT for PBS and store at 4ºC until acquisition of pictures. Store indefinitely in 3.7% PFA/PBS at 4ºC.
54
APPENDIX III – CODING SEQUENCES OF ICN1 and DNMAML1
55
In bold and underlined is an unresolved region of the sequence (the results showed constantly differences between the predicted chicken sequence and our sequencing results, so it was not possible to precise the correct sequence). ICN1 GTGCTGGTGTCCCGCAAGCGGCGCAGGGAGCATGGCCAGCTCTGGTTCCCAGAGGGCTTCAAAGTGA CGGAGTCGAGCAAGAAGAAGCGCCGGGAACCACTTGGGGAAGATTCTGTTGGACTGAAACCCCTCAA AAATGCTTCTGACGGCACGCTGATGGACGACAACCAAAATGAGTGGGGTGACGAGGAGACCCTGGAC ACCAAGAAGTTCAGGTTCGAGGAGCAGGCGATGCTGCCCGACACGGATGACCAGACGGACCACAGGC AGTGGACTCAGCAGCACCTGGATGCTGCCGACCTCCGCATCTCCTCCATGGCCCCTACCCCACCACA GGGCGAGATCGATGCAGACTGCATGGATGTCAACGTACGAGGTCCAGACGGCTTCACGCCCCTCATG ATCGCCTCGTGCAGCGGAGGGGGGCTGGAGACTGGCAACAGCGAGGAGGAGGACGATGCCCCTGCAG TCATCTCAGATTTCATCTACCAAGGCGCCAGTTTGCACAACCAGACTGACCGCACCGGCGAGACCGC GCTGCACCTGGCTGCCCGCTACTCGCGCTCCGACGCTGCCAAACGCCTGCTGGAAGCCAGTGCTGAT GCGAACATTCAGGATAACATGGGCAGGACCCCTCTGCACGCCGCTGTCTCTGCTGATGCCCAAGGAG TCTTCCAGATCCTGATAAGGAACAGGGCGACTGATCTCGATGCCCGAATGCACGATGGGACGACCCC ACTGATCCTGGCTGCTCGCTTGGCTGTGGAGGGGATGCTGGAGGACCTCATCAACTGCCACGCAGAC GTCAACGCTGTGGATGATCTGGGCAAGTCAGCACTGCACTGGGCAGCTGCTGTGAACAATGTCGAAG CCGCTGTCGTCCTCCTGAAGAACGGTGCCAATAAGGATATGCAGAACAATAAGGAGGAGACCCCGCT GTTCCTCGCCGCCAGAGAAGGGAGCTACGAAACAGCCAAGGTTCTGCTGGACCACTTTGCGAACCGC GACATCACGGACCACATGGACCGGCTGCCGCGGGACATCGCGCAGGAGCGCATGCACCACGACATCG TGCGGCTGCTGGATGAGTACAACCTGGTGCGGAGCCCTCCGCTGCACAGCGGCCCTCTCGGGGCCCC CACGCTGTCCCCCCCGCTCTGCTCCCCCAGCAGTTACATCGGCAACCTGAAGCCGGCCGTGCAGGGC AAGAAGGCCAGGAAGCCGAGCACCAAGGGCCTGAGCTGCAACGGCAAGGATTCCAAAGACCTGAAAG CCCGGAGGAAAAAATCACAAGATGGAAAAGGCTGTCTGCTCGACAACTCCAGCGTGCTGTCCCCAGT GGACTCCCTGGAGTCACCCCACGGGTACCTGTCCGACGTCGCCTCCCCTCCGCTGATGACTTCTCCG TTCCAGCAGTCCCCTTCCATGCCTCTGAACCACCTGCCTGGCATGCCCGACGCCCACATGAGCATCA ACCACCTCAACATGGCAGGGAAGCAGGAGATGGCCCTGGGCGGCTCTGGCAGGATGGCCTTCGAGGC GGTGCCGCCGCGCCTCTCGCACCTCCCCGTCTCCAGCCCCAGCACGGCGATGAGCAACGCCCCGATG AATTTCTCCGTCGGCGGAGCTGCCGGCCTGAGCGGGCAGTGCGACTGGCTGAGCCGGCTGCAGAGCG GCATGGTGCAGAACCAGTACGGCGCCATGCGGGGCGGCATGCAGCCGGGCACGCACCAGCAAGCACA GAACCTGCAGCACGGCATGATGAGCTCCCTGCACAACGGGCTGCCCAGCACCAGCCTGTCGCAGATG ATGAGCTACCAGGCCATGCCCAGCACCCGGCTGGCCTCCCAGCCCCACCTGCTGCAGAACCAGCAGA TGCAGCAGATGCAGCAGCCCGGAATGCAGCCGCAGCCCGGAATGCAGCCGCAGCCCGGCATGCAGCA GCCTCAACAGCAGCCCCAGCAACAGCCCCAGCCGCAGCAGCACCACAACCCCGGCTCCAACGCCAGC GGCCACATGGGCCAAAATTTCCTCGGTACTGAGCTGAGCCAGCCCGACATGCAGCCGGTGAGCAGCA GCGCCATGGCGGTGCACACCATCCTGCCCCAAGATTCGCAGCTGCTACCCACCTCTCTGCCGTCCTC CCTCGCGCAGCCCATGACCACCACGCAGTTCCTGACCCCCCCTTCCCAGCACAGCTATTCCTCCCCG TTGGACAACACCCCCAGCCACCAGCTCCAGGTGCCCGACCACCCCTTCCTCACTCCCTCTCCGGAGT CTCCAGACCAGTGGTCGAGCTCCTCGCCCCACTCCAACGTGTCCGACTGGTCCGAGGGCATCTCCAG CCCCCCCACCAGCATGCAGTCGCAGATGGGACACATCCCCGAGGCCTTCAAGTGA 56
Underlined are the nucleotides that did not match with the predicted chicken MAML1 sequence. The double underlined nucleotides result in three amino-acids that differ from the predicted chicken MAML1 sequence but are the same found in the mouse sequence, suggesting that the predicted chicken sequence might not be correct in that segment, and that the our sequence is real. DNMAML1 GTGGTGCCGCGGCACAGCGCGGTGATGGAGCGGCTCCGTCGGCGCATCGAGCTCTGCC GGCGGCACCACAGCGCCTGCGAGTCCCGCTACCAGGCCGTGTCCCCGGAGCGCCTGGA GCTGGAGCGCCAGCAAACCTTCGCCCTGCACCAGCGCTGCCTGCAGGCCAAGGCCAAG CGGGCCGGCAAGCAC
57