The Scalable HeterOgeneous Computing (SHOC) Benchmark Suite Anthony Danalis‡† Gabriel Marin† Collin McCurdy† Jeremy S. Meredith† Philip C. Roth† Kyle Spafford† Vinod Tipparaju† Jeffrey S. Vetter† Computer Science & Mathematics Division† Oak Ridge National Laboratory Oak Ridge, TN 37831 {maring,cmcurdy,jsmeredith}@ornl.gov {rothpc,spaffordkl,tipparajuv,vetter}@ornl.gov
Department of Computer Science University of Tennessee Knoxville, TN 37996
[email protected]
‡
ABSTRACT
1.
Scalable heterogeneous computing systems, which are composed of a mix of compute devices, such as commodity multicore processors, graphics processors, reconfigurable processors, and others, are gaining attention as one approach to continuing performance improvement while managing the new challenge of energy efficiency. As these systems become more common, it is important to be able to compare and contrast architectural designs and programming systems in a fair and open forum. To this end, we have designed the Scalable HeterOgeneous Computing benchmark suite (SHOC). SHOC’s initial focus is on systems containing graphics processing units (GPUs) and multi-core processors, and on the new OpenCL programming standard. SHOC is a spectrum of programs that test the performance and stability of these scalable heterogeneous computing systems. At the lowest level, SHOC uses microbenchmarks to assess architectural features of the system. At higher levels, SHOC uses application kernels to determine system-wide performance including many system features such as intranode and internode communication among devices. SHOC includes benchmark implementations in both OpenCL and CUDA in order to provide a comparison of these programming models.
Graphics processing units (GPUs) first appeared in computers as specialized devices used to offload simple rendering operations from the central microprocessor. Over the years, GPUs have increased in performance, architectural complexity, and programmability, inching closer towards a general purpose computing device. In fact, vendors have facilitated this trend for general purpose computation on GPUs (GPGPU) by including both programmable stages and higher precision arithmetic in the GPU’s rendering pipelines. Modern GPUs are becoming a possible platform for accelerating scientific applications while recognizing the challenges of energy-efficiency. Clusters of heterogeneous architectures based on GPUs starting to appear in the TOP500 [5] list of the most powerful available computers in the world, and this trend is expected to continue due to their potential for improved energy-efficiency. More importantly, these scalable heterogeneous systems will place different demands on the node architecture than a stand-alone graphics system. In particular, the node design will have to effectively support intranode and internode communication: communication with the GPUs, communication with peer nodes through MPI, and IO to a disk. Aside from the Linpack benchmark in TOP500, there are few (if any) accepted benchmark suites that allow the community to characterize and compare the architectures and programming environments for these scalable heterogeneous systems. In this paper, we introduce SHOC: a suite of benchmarks for heterogeneous computing platforms designed to fulfill these requirements. To demonstrate the applicability of SHOC, we present results from an extensive set of commercially available graphic cards from both NVIDIA and AMD, as well as some of the current CPU architectures. We also highlight the differences across these devices based on the performance achieved in several SHOC benchmarks. Additionally, we also compare and discuss the performance differences observed between the relatively new OpenCL and equivalent CUDA implementations of some of the benchmarks.
Categories and Subject Descriptors B.8.0 [Hardware]: Performance and Reliability General; C.1.3 [Computer Systems Organization]: Heterogeneous Systems
General Terms Performance, Measurement, Reliability
Keywords Benchmarking, Performance, Graphics Processors, GPGPU
ACM acknowledges that this contribution was authored or co-authored by a contractor or affiliate of the U.S. Government. As such, the Government retains a nonexclusive, royalty-free right to publish or reproduce this article, or to allow others to do so, for Government purposes only. GPGPU ’10 March 14, 2010. Pittsburgh, PA, USA Copyright 2010 ACM 978-1-60558-935-0/10/03 ...$10.00.
1.1
INTRODUCTION
Programming Systems
Programming systems for contemporary heterogeneous architectures remains a quickly evolving field. NVIDIA’s CUDA dramatically improved the programmability of GPUs for non-graphics applications. OpenCL was ratified only re-
cently in order to provide a portable interface to software and applications developers.
1.1.1
OpenCL
In December 2008, the Khronos Group introduced OpenCL [12], an open standard for parallel computing on heterogeneous platforms. OpenCL specifies a language, based on C99, that allows a programmer to write parallel functions called kernels which can execute on any device with a supporting OpenCL implementation. OpenCL’s initial specification is oriented towards multi-core processors, GPUs, FPGAs, and IBM Cell. The most salient difference between these devices and traditional CPU architectures is parallelism. OpenCL is primarily focused on fine-grained data parallelism, but also provides support for task parallelism. In OpenCL, parallel kernels, functions which execute on the device, are divided into thousands of work items, which are organized into local work groups. For example, in matrix multiplication, a single work item might calculate one entry in the solution matrix, and a local work group might calculate a sub-matrix of the solution matrix. Another key feature of heterogeneous systems is the memory hierarchy, which can be radically different than a traditional cache architecture. OpenCL provides a set of abstractions for device memory hierarchies and an API for controlling memory allocation and data transfer. Device memory is divided into several distinct address spaces including global, local, constant, and image memory. In order to achieve high performance, the programmer must meticulously specify the location of each piece of data. OpenCL also provides a rich API for device interrogation. At run time, programs can query information about how many devices are available and the computational capabilities of those devices including available computational units, memory and cache sizes, clock speeds, and support for extensions to the OpenCL baseline specification such as support for double precision floating point operations.
1.1.2
CUDA
In addition to OpenCL, SHOC contains version of each benchmark in Compute Unified Device Architecture (CUDA). CUDA is NVIDIA’s C-like language environment for programming GPUs and is currently the most popular environment for GPGPU. CUDA is quite similar to OpenCL in many respects. They both focus on massively data-parallel kernels, which use tens of thousands of threads (or local work items in OpenCL) organized into a grid of thread blocks (or local groups). Also, they both abstract device memory hierarchies into several different address spaces. However, CUDA only supports NVIDIA GPUs, while OpenCL implementations already support GPUs from NVIDIA and ATI, as well as multi-core CPUs.
2.
RELATED WORK
Previous work on benchmarking GPUs has largely been targeted toward video game enthusiasts. Measuring the frames per second (FPS ) achieved by computationally demanding games such as Crysis [2] has been a common way to benchmark and compare GPUs. In addition to game performance, GPUs have also been compared using proprietary GPU benchmarking software such as Rightmark [3]
and 3DMark [1] designed to determine the DirectX performance of graphics cards. In terms of benchmarking GPUs as general purpose high performance computation engines, most previous work has been focused on NVIDIA GPUs using CUDA. First, Accelereyes has released GBench, a small set of benchmarks based on their Jacket product, which provides automatic CUDAbased acceleration of Matlab applications [7]. GBench is useful for comparing CPU and GPU performance for several common Matlab operations. Volkov and Demmel have also benchmarked NVIDIA GPUs using CUDA [13], with a primary focus on performance for linear algebra. Their study also includes a detailed characterization of the GPU memory system. Parboil [4] and Rodinia [8] are GPU benchmarks comprised of scientific applications and kernels. They are both written in CUDA and are aimed toward understanding the behavior of scientific applications on GPUs. SHOC is distinct from these works primarily because it is designed to be a truly scalable suite of benchmarks–one with the capability to test large clusters and large numbers of devices. All of the above mentioned GPU benchmarks are serial in nature and only test a single device. Furthermore, SHOC tests more than just performance. It also includes tests for system stability and contention of system resources, SHOC is also aimed at a scientific user base, includes support for the platform-independent OpenCL standard, and its benchmarks were chosen to be representative of real scientific applications.
3.
OVERVIEW
The SHOC benchmark suite was designed to provide a standardized way to measure the performance and stability of non-traditional high performance computing architectures. SHOC benchmarks are distributed using MPI and effectively scale from a single device to a large cluster. The SHOC benchmarks are divided into two primary categories: stress tests and performance tests. The stress tests use computationally demanding kernels to identify OpenCL devices with bad memory, insufficient cooling, or other device component problems. The other tests measure many aspects of system performance on several synthetic kernels as well as common parallel operations and algorithms. The performance tests are further subdivided according to their complexity and the nature of the device capability they exercise. In general, each benchmark has several versions: • Serial Serial versions of the benchmarks execute on a single node and use only one device. • Embarrassingly Parallel (EP) EP benchmarks execute tests on multiple devices or nodes of a cluster, but do not involve any communication between devices or nodes. • True Parallel (TP) TP benchmarks measure multiple nodes, with one or more devices per node, including all communication. These algorithms are decomposed among the parallel tasks and may include CPU computation time. In addition to OpenCL-based benchmarks, SHOC also includes a Compute Unified Device Architecture (CUDA) version of many of its benchmarks for comparison with the
OpenCL version. As both languages support largely the same constructs, kernels have been optimized the same for each language. Furthermore, while OpenCL does support CPU devices, the language itself is designed for devices such as GPUs, and so usage of exposed constructs such as local programmer-managed memory may naturally better exploit GPU-like devices than standard CPUs.
3.1
Level Zero
Level Zero tests are designed to measure low level hardware characteristics (the so called “feeds and speeds”). All Level Zero tests use artificial kernels, and results from these benchmarks represent an empirical upper bound on realized performance. As these are designed for consistency, they can be used not just as a comparative performance measure, but can also detect a variety of issues, such as lower than expected peak performance, chipsets with only eight PCI-Express (PCIe) lanes, or systems with large variations in kernel queueing delays. • Bus Speed Download and Readback Measures the bandwidth of the interconnection bus between the host processor and the OpenCL device (typically the PCIe bus) by repeatedly transferring data of various sizes to and from the device. • Device Memory Bandwidth Measures bandwidth for all device memory address spaces, including global, local, constant, and image memories. The global address space is benchmarked using both coalesced and uncoalesced memory accesses. In all cases, each thread generates 16 independent memory requests. • Kernel Compilation OpenCL kernels are compiled at runtime, and this benchmark measures average compilation speed and overheads for kernels of varying complexity. • Peak FLOPS Measures peak floating point (single or double precision) operations per second using a synthetic workload designed to fully exercise device functional units. Floating point execution rates are computed for different synthetic mixes of arithmetic operations, such as 1) only additions; 2) only multiplications; 3) an equal number of multiplications and additions; 4) a mix consisting of multiplications and additions in a ratio of 2 to 1. • Queueing Delay Measures the overhead of launching a kernel in OpenCL’s queueing system. • Resource Contention Measures contention on the PCIe bus between OpenCL data transfers and MPI message passing.
3.2
Level One
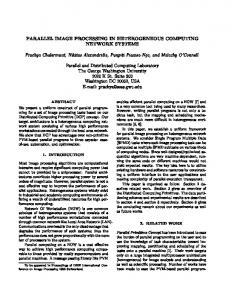
Level One benchmarks measure basic parallel algorithms, such as the Fast Fourier Transform (FFT) or the parallel prefix sum (a.k.a. scan)[11]. These algorithms represent common tasks in parallel processing and are commonly found in a significant portion of the kernels of real applications. These algorithms vary significantly in performance characteristics, and Figure 1 provides an illustration of their relative stress on a device’s memory subsystem and functional units. Several of the benchmarks are highly configurable and
can span a range of the spectrum based on problem size or other input parameters. • FFT Measures the performance of a two dimensional Fast Fourier Transform. The benchmark computes multiple FFTs of size 512 in parallel. The FFT implementation is based on the algorithm described by Volkov and Kazian [14]. • MD Measures the speed of a simple pairwise calculation of the Lennard-Jones potential from molecular dynamics. Each thread computes the acceleration for one particle based on the potential field generated by all particles into a cutoff area. The kernel uses coalesced global memory accesses. • Reduction Measures the performance of a sum reduction operation using single precision floating point data. The kernel performs first a partial reduction on a global input data array saving the partial results to the local shared memory. Next, a reduction is computed over the local data array and the result is saved into a global output memory array. • Scan Measures the performance of the parallel prefix sum algorithm (also known as Scan) on a large array of floating point data. • SGEMM This benchmark measures device performance on an OpenCL version of the single precision general matrix multiply (SGEMM) BLAS routine. • Sort Measures device performance for a very fast radix sort algorithm [10] which sorts key-value pairs of single precision floating point data. • Stencil2D Measures performance for a standard twodimensional nine point stencil calculation. First, each thread group copies their piece of the data from global memory to local shared memory, including an additional one element ghosting area for the group. Each thread computes the stencil for one matrix element accessing only data in the local memory. • Triad An OpenCL version of the STREAM Triad benchmark [9], which measures sustainable memory bandwidth for a large vector dot product operation on single precision floating point data. The benchmark uses a block-pipelined implementation to partially overlap the cost of the dot computation with the transfer of data from the host memory to the device and back.
3.3
Stability Test
The purpose of the stability test is to provide a mechanism for ensuring that device hardware is operating correctly. Because some OpenCL device memory, especially GPU memory, has historically lacked error correcting mechanisms, there is a particular need to ensure that the devices produce valid results. The basic notion is to run a computationally intensive kernel for a sufficiently long period of time to permit the occurrence of overheating and other transient effects, and periodically check to ensure that computation has been performed correctly.
Figure 1: This figure characterizes the L1 benchmarks’ relative stress on an OpenCL device’s memory subsystem and functional units. Several of the benchmarks can vary their performance requirements significantly based on problem size or other input parameters.
A signature feature of our stability test is that it divides device memory in half1 , and then performs the exact same computation on the two halves of memory. This allows the consistency check to be performed by the OpenCL device, on data that resides in the device memory. This is preferable to the alternative in which the host processor performs the consistency check, as a CPU-based check would allowing the device time to cool while data is transferred and the test is performed. Another feature of the stability test is its utilization of an invertible kernel. Alternately executing the kernel and its inverse reduces the need for data transfer during the test, while eliminating concerns about overflow of data values. The test potentially works with any kernel that can be inverted; however, we have found empirically that the FFT proves more effective than other kernels (e.g. DGEMM), at finding intentionally induced errors resulting from overclocking the GPU and/or its associated memory, in part as it is less susceptible to underflow hiding errors. This is consistent with the highly regarded “torture test” included with the Great Internet Mersenne Prime Search (GIMPS, a.k.a., Prime95) package [6], used by many in the enthusiast community to test overclocked hardware, which is also based on the FFT and its inverse. The algorithm for the parallel version of the test, which enables testing of an entire GPU cluster at the same time, is as follows. Each participating node first allocates its data, while node zero additionally determines start and finish times based on a user input parameter. All nodes then enter the outermost loop, copying fresh data from the CPU before entering the core of the test. In the core, each node performs a loop consisting of the forward kernel, a potential check, and then the inverse kernel. After performing a configurable number of forward/inverse iterations, along with a configurable number of checks, each node sends the number of failures it encountered to node zero. Node zero collects and reports the error counts, determines whether the test 1
In practice, it is not possible to allocate all of GPU memory as some is reserved by the operating system driver for page tables.
has run its course, and broadcasts the decision. If the decision is to proceed, each node begins the next iteration of the outer loop, copying fresh data and then performing the kernels and checks of the core loop.
3.4
Program Event Timing Mechanisms
The SHOC benchmarks designed for measuring performance (as opposed to testing stability) use timers to measure the latency of benchmark program events. On Linux systems, SHOC programs can be built to use the high-resolution per-process timer provided by the clock_gettime() function. On other UNIX-like systems such as Mac OS X, or on Linux systems where clock_gettime() is unavailable, the gettimeofday() is used as a lower-resolution timer. As a fallback, SHOC benchmarks can be built using ftime() but this is not recommended. Using these timers and knowledge of the amount of data transferred or the amount of computation performed, SHOC benchmarks derive bandwidths and computational rates, respectively. The clock_gettime()/gettimeofday() timers are accessible only from program code running on the host system. For some SHOC benchmark programs, these timers are sufficient and even desirable for measuring benchmark performance, because they are applicable to both OpenCL and CUDA versions of the benchmark. However, OpenCL defines an optional standardized mechanism for collecting finergrained timing data using the clGetEventProfilingInfo() function. Using this function, SHOC benchmarks can distinguish between the time actually spent executing a kernel on a device from overhead (e.g., the amount of time the kernel spent in a command queue). Such distinctions are not possible with the host-only timers such as clock_gettime(). The CUDA API contains no direct analogue to the OpenCL clGetEventProfilingInfo() function. NVIDIA distributes a profiler for CUDA programs that uses hardware counters built into NVIDIA GPUs, but no public API for accessing these counters is yet available. Therefore, SHOC programs with both OpenCL and CUDA versions use the host-only timers as their primary performance data collection mechanism, and may use the OpenCL profiling support for additional detail for the OpenCL version.
4.
EXPERIMENTAL TESTBED
4.1
NVIDIA GPUs
Hardware characteristics of the tested NVIDIA GPUs are listed in Table 1.
4.1.1
NVIDIA G80 Series
The NVIDIA G80 architecture shunned the traditional separation in graphics processors of vertex and pixel hardware pipelines in favor of a single category of processors, all of which could be tasked for computation. In this sense, it was a GPU which could devote almost its entire set of resources to general-purpose computation. The NVIDIA 8800GTX has 128 stream processors split among sixteen multiprocessors. The shader cores run at 1.35GHz, and are fed from 768MB of GDDR3 RAM through a 384-bit bus.
4.1.2
NVIDIA GT200 Series
The NVIDIA Tesla C1060 graphics processor was designed with high performance computing in mind. It is composed of thirty streaming multiprocessors, each of which contains eight stream processors for a total of 240 processor cores clocked at 1.3Ghz. Each multiprocessor has 16KB of shared memory, which can be accessed as quickly as a register under certain access patterns. The Tesla C1060 has 4GB of global memory, as well as supplementary cached constant and texture memory. The Tesla supports native double precision floating point operations, although a difference in functional units causes a significant gap between single and double precision performance.
4.1.3
NVIDIA ION
Originally targeted for the netbook and nettop market segment, NVIDIA’s ION platform has garnered some attention from the scientific community due to its extremely low power consumption. ION is not a discrete GPU – it pairs an Atom processor, Intel’s ultra low voltage, dual core x86-64 processor with NVIDIA’s GeForce 9400M GPU. The addition of the GeForce 9400M supplements the otherwise unimpressive performance of Atom, adding the raw FLOPS capability necessary for ION to be considered a candidate for low-power, scientific computing. We present ION performance results from the ASRock ION 330 platform with a 1.6Ghz dual core 45nm Atom processor and 2 GB DDR2-800 RAM.
4.2 4.2.1
ATI GPUs ATI Evergreen Series
In ATI’s “Terascale Graphics Engine” architecture, Stream processors are divided into groups of eighty, which are collectively known as SIMD cores. Each SIMD core contains four texture units, an L1 cache, and has its own control logic. SIMD cores can communicate with each other via an on-chip global data share. The Evergreen line of GPUs doubled the number of stream processors, texture units, and ROPs available in the previous generation. Evergreen GPUs all feature a 40nm fabrication process, with core counts ranging from 400 to 1600. We present results from the Radeon HD5770 (Juniper XT) and HD5870 (Cypress XT). Specific hardware characteristics are listed in Table 2.
4.3
Multicore CPUs
We present several results from current multicore CPUs using the OpenCL implementation in AMD’s Stream Computing SDK (v2.0). The most salient details for comparison are summarized in Table 3.
4.3.1
AMD Shanghai
Shanghai is AMD’s current quad core Opteron-based system. Shanghai features a 45nm process, with clock speeds ranging from 2.3Ghz to 2.9Ghz. Shanghai has a familiar cache organization, with a private L1 and L2 cache, and a large, shared L3 cache. We present results from a dual socket platform with a total of eight cores running at 2.6Ghz.
4.3.2
Intel Gainestown
Gainestown is Intel’s current quad core offering based on the Nehalem architecture. In striking contrast to the Core architecture, Nehalem adds a large, shared L3 cache and replaces the front side bus with the new QuickPath pointto-point interconnect between cores. Nehalem also saw the reintroduction of Hyper-Threading, Intel’s implementation of simultaneous multithreading.
4.3.3
Intel Harpertown
Intel Harpertown is the predecessor to Gainestown, featuring a quad core processor based on the Core architecture. We benchmark a dual socket, 2.8Ghz Harpertown system with 8GB of RAM. Harpertown features the same 32KB instruction and data cache as Gainestown, but features a large shared L2 cache instead of Nehalem’s private L2 cache.
4.4 4.4.1
Host Configurations Lens Configuration
Lens is a medium sized cluster primarily used for data visualization and analysis. It is composed of thirty-two nodes connected via Infiniband, with each node containing four AMD quad core Barcelona processors with 64GB of DDR2667 RAM. Each node also has two GPUs–one NVIDIA Tesla C1060 and one NVIDIA GeForce 8800GTX, connected to the host processor over a PCI Express 1.0 bus with sixteen active lanes. Lens runs Scientific Linux 5.0, and results were measured using NVIDIA’s GPU computing SDK, version 2.3 with the NVIDIA 190.29 driver.
4.4.2
Florence Configuration
Florence is a standard MacBook Pro, featuring an Intel Core 2 Duo processor at 2.4Ghz with 2GB of DDR2-667 RAM. Florence has one NVIDIA GeForce 8600M GT GPU connected via a 16 lane PCIe 1.0 bus. We provide results from Florence for two main reasons. First, to compare the relative strength of Snow Leopard’s OpenCL implementation (version 10.6.2), and second, to provide performance results of a “typical” laptop.
4.4.3
Athens Configuration
Athens serves primarily as a CUDA development machine, covering the moderate performance range with an NVIDIA GeForce 8600GT GPU, connected via a 16 lane PCIe 1.0 bus to a dual core Intel Pentium D 820 processor at 2.8Ghz, with 1 GB RAM. Athens currently runs Red Hat Enterprise Linux (RHEL) 4.3 and uses NVIDIA’s GPU computing SDK, version 2.3 with the NVIDIA 195.17 Beta driver.
GPU Units Tesla C1060 GeForce 8800GTX GeForce 8800GTS GeForce 8600GT ION (9400M)
GPU Units Radeon HD5770 Radeon HD5870
4.4.4
Table 1: Comparison of NVIDIA GPUs Peak FLOPS Peak Bandwidth Stream Processors GF GB/s # 933 102 240 518 86.4 128 403.2 64 128 114.2 22.4 32 54 21 16
Table 2: Comparison of ATI GPUs Peak FLOPS Peak Bandwidth Stream Processors GF GB/s # 1360 76.8 800 2720 153.6 1600
SP Clock Mhz 1300 1350 1200 1190 1100
Core Clock Mhz 850 850
Memory MB 4096 768 320 512 256
Memory MB 1024 GDDR5 1024 GDDR5
Paris Configuration
Paris is a workstation with dual 16 lane PCIe 2.0 slots, featuring a performance-limited engineering sample NVIDIA Tesla C1060 and an NVIDIA 8800GTS 320MB. The cards are fed through a Harpertown chipset with two quad-core Intel L5420 processors at 2.5GHz and 8 GB DDR2-667 RAM. Paris runs Ubuntu 8.04 LTS and uses NVIDIA’s GPU computing CUDA, version 2.3 with the NVIDIA 190.29 driver.
4.4.5
Naples Configuration
Naples is a typical gaming desktop and features an Intel Core 2 Duo at 2.66Ghz, 2GB DDR2-800 RAM, and an ATI Radeon HD5770 GPU. The GPU is connected to the host via a 16 lane PCIe 1.0 bus. Results were measured under Ubuntu 9.04 using the ATI Stream SDK 2.0 with the Catalyst 9.12 Hotfix 8.682.2RC1 driver.
4.4.6
Lyon Configurations
Lyon is an dual-socket, single-core 2.0 GHz AMD Opteron 246 system with a 16-lane PCIe 1.0 bus and 4GB of DDR1400 RAM, housing an ATI Radeon HD 5870 GPU. It runs Ubuntu 9.04 and uses the ATI Stream SDK 2.0 with the Catalyst 9.12 Hotfix 8.682.2RC1 driver.
5.
RESULTS AND DISCUSSION
SHOC provides an easy framework for the performance analysis of OpenCL compatible devices. At its most basic level, it measures the relative performance of single devices on important computational kernels. However, data collected from SHOC can make an important contribution to far more sophisticated analyses. We present a comparison of OpenCL devices, a power-performance analysis, an examination of CUDA versus OpenCL performance, and an exploration of resource contention as example results.
5.1
Figure 2: Kernel compile times on Lens and Paris.
OpenCL Device Comparison
Figures 2 and 3 shows results from the Level Zero Kernel Compilation benchmark across two systems with samegeneration GPUs, on both small and large kernels. While Lens’ 8800GTX and Paris’ 8800GTS are not of the same computational power, they have the same underlying chip and compute capability; similarly for the retail and sample Tesla C1060 across the two systems. We see that the
Paris host system, with Harpertown Xeons and local disk, results in somewhat faster OpenCL compile times and notably faster kernel extraction times. We also see the difference between the longer kernel (taken from the Level One Scan benchmark) and the shorter kernel (taken from the Level One Triad benchmark). And finally, we see a small but consistent increase in compilation time resulting from targeting the more advanced Tesla C1060 architecture. Figure 4 shows results from the Level One MD test. We see a large improvement in NVIDIA GPUs when moving past the 8000-series, where the older architecture is barely competitive with contemporary CPUs. Figure 5 shows the results from the FFT test, where we may see some impact from the greater maturity of the NVIDIA OpenCL implementation, with the NVIDIA Tesla outperforming the ATI HD 5870. Additionally, the beta NVIDIA driver apparently contains some optimizations which help performance, as seen by the 8600GT besting the 8800GTS. In these two tests, the CPU performance comes closest to the GPU performance. Figures 6 and 7 show straightforward results from the Level One Scan and Reduction benchmarks, respectively, both utilizing the high bandwidth and FLOPS of GPUs and showing a clean improvement when moving to higher-
CPU AMD Shanghai Intel Harpertown Intel Gainestown
Sockets 2 2 2
Table 3: Cores 8 8 8
Details of Benchmarked CPUs Clock L1 Cache L2 Cache L3 Cache 2.6Ghz 128 KB 512 KB 6 MB 2.8Ghz 32 KB 12 MB N/A 2.3Ghz 32 KB 256 KB 8 MB
RAM 8GB DDR2-800 8GB DDR2-667 24GB DDR3-1333
Figure 4: SHOC OpenCL Level One Molecular Dynamics benchmark results across test platforms.
Figure 3: Kernel extraction times on Lens and Paris.
best, with the recent Evergreen series ATI Radeons generally leading the older NVIDIA Tesla, which in turn leads the older NVIDIA 8000 and 9000 series. And we also see mobile parts typically outperformed by their desktop equivalents, showing architectural differences much greater than the name similarity would imply. These results also highlight the ability of the benchmark suite to discern how architectural differences between cards impact algorithms. For example, we note that the MD benchmark, which tests more of the functional unit subsystem than the memory subsystem, performs similarly on the Radeon HD5770 and the Tesla C1060, which have similar peak GFLOPS values. In contrast, we note that the FFT benchmark, which is more sensitive to the memory subsystem, performs better on the Tesla C1060, which has a higher peak memory bandwidth.
5.2 powered cards, and with all GPUs outperforming the CPUs. The results from the Stencil2D benchmark in Figure 8 are more complex – while the GPUs do outperform the CPUs by a large margin, we see some dependence on the platform supporting the GPU devices, such as the HD 5870 being hampered by the slow CPU and RAM of its host system. Some general patterns emerge from these results of running the Level One benchmarks on the test systems. First and foremost, the GPUs largely outperformed even the multi-core CPU systems, and often by a significant margin. Among the GPUs, the newest cards typically performed the
CUDA vs. OpenCL
When choosing to port a legacy scientific application to a heterogeneous computing platform, the choice of programming paradigm is critical. While CUDA enjoys an advantage in popularity and elegance, it confines codes to NVIDIA GPUs. OpenCL has tremendous potential for code portability, but is rather verbose and may not meet the performance requirements of all developers. SHOC provides an easy way to compare the relative performance of CUDA and OpenCL on a target platform, as all kernels have received the same optimizations on each platform. Figures 9, 10, and 11 detail CUDA and OpenCL performance for the Tesla C1060 GPU, using a single node of the Lens cluster. Performance is nearly identical for all Level
Figure 5: SHOC OpenCL Level One FFT benchmark results across test platforms.
Figure 9: Level Zero results for the Tesla C1060. CUDA and OpenCL performance is nearly identical.
Figure 10: Performance comparison of several L1 benchmarks on the Tesla C1060. OpenCL performance significantly trails CUDA.
Zero benchmarks. However, when nontrivial device kernels are used, OpenCL begins to trail CUDA performance significantly (especially in FFT). This demonstrates the immaturity of the OpenCL compiler and has dramatic consequences for potential application developers.
5.4
5.3
Power-Performance Analysis
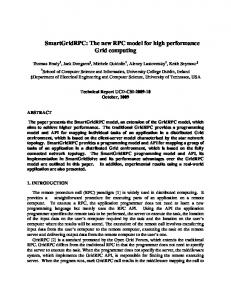
Figure 12 shows the measured peak single precision floating point operations per second of a variety of OpenCL compatible devices normalized by their respective power consumption. For this particular example, we use the manufacturer’s specified thermal design point (TDP). The ATI GPUs strongly dominate the results, and this is consistent with expectation. The Evergreen series is at least one generation ahead of any NVIDIA GPU tested and features a 40nm fabrication process. While they use less power, both AMD and Intel CPUs produce lower results due to the tremendous difference in the number of floating point units.
Resource Contention
Table 4: Simultaneous Device Usage, Tesla C1060 and GeForce 8800GTX on Lens. GPU Units ideal measured
Peak GFLOP 1046 941
Bandwidth GB/s 159.1 157.3
D->H GB/s 5.38 4.66
H->D GB/s 5.29 4.99
Due to their parallel nature, many of the SHOC benchmarks have the ability to test multi-GPU performance, even when run on a single node. Table 4 shows the results of several Level Zero benchmarks on one node of the Lens cluster, containing both an NVIDIA Tesla C1060 and GeForce 8800GTX. The first row shows the ideal results one could obtain by summing the contributions from each card run in
Figure 6: SHOC OpenCL Level One Scan benchmark results across test platforms.
Figure 11: Comparison of several benchmarks which stress the device memory hierarchy on the Tesla C1060. OpenCL trails CUDA when nontrivial device kernels are executed.
isolation. The second row shows the actual results, measured while running both devices concurrently. Note the penalties apparent from simultaneous usage, sometimes beyond 10% in this test. Beyond simple multi-GPU contention, the Resource Contention benchmark is specifically designed to test the effects of simultaneous data transfers both for sending data to a GPU and for MPI inter- and intra-node communication. It does this by allocating a number of MPI tasks, with some tasks performing GPU actions and some performing MPI actions. It measures the GPU performance and MPI performance under two conditions: first, with these two task categories running sequentially in turn so that they do not collide, and then with both categories of tasks running simultaneously, contending for system resources that one may see in actual scientific computing usage. This test targets
Figure 13: This figure shows the effect of simultaneous GPU data movement and pairwise MPI message passing on the average maximum latency of the MPI messages. The “sim” results were obtained with the GPU and MPI tasks running simultaneously, and “seq” results avoid contention by running each piece in turn sequentially.
the PCI-Express bus, running download speed tests for the GPU and random-pair latency for the MPI tests. We ran this test on one to four nodes of the Lens cluster. We utilized five tasks per node: four to participate in the MPI communication and one to test download speed of the Tesla C1060 GPU. In Figure 13 we see the behavior of the MPI latency in the test. First, as expected, the latency grows with the number of nodes in play in the random pairwise communication, and with the size of the message. More importantly, under contention, this latency generally increases when the GPU tasks are running simultaneously – and sometimes dramatically (note the logarithmic scale).
Figure 7: SHOC OpenCL Level One Reduction benchmark results across test platforms.
6.
Figure 14: This figure shows the effect of simultaneous GPU data movement and pairwise MPI message passing on the average minimum data transfer from the host to the GPU device. The “sim” results were obtained with the GPU and MPI tasks running simultaneously, and “seq” results avoid contention by running each piece in turn sequentially.
Figure 14 shows the behavior of the GPU host-to-device data transfer rate in this test. Again, we see an expected increasing data transfer speed with larger transfer sizes. Although we see some variation in the transfer speeds, we also see a consistent penalty of about 30% to the peak transfer speed when running simultaneously with the MPI tasks.
5.5
Results Repository
Results from the SHOC benchmark suite are aggregated and posted to the SHOC wiki at http://ft.ornl.gov/doku/ shoc/start.
CONCLUSIONS
The SHOC Benchmark suite is an effective tool, with a variety of uses applicable to high performance computing in heterogeneous environments. We show its ability to differentiate the performance characteristics of several systems, including highlighting differences of the GPUs themselves and their supporting infrastructure. We also show its ability to highlight strengths and weaknesses among different OpenCL implementations, including its performance relative to CUDA. In a parallel setting, the advantages grow. First, all benchmarks support a version which can run on multiple nodes and/or devices simultaneously, including a sensitive parallel stability test. More significant is the truly parallel support, including benchmarks designed to test parallel decomposition of problems, and to test the performance of both the GPU and parallel support architecture when fully utilizing the heterogeneous capabilities of these systems.
7.
ACKNOWLEDGMENTS
This research is sponsored in part by the Office of Advanced Computing Research; U.S. Department of Energy. The work was performed at Oak Ridge National Laboratory, which is managed by UT-Battelle, LLC under Contract No. DE-AC05-00OR22725. This research used resources of the National Center for Computational Sciences at Oak Ridge National Laboratory, which is supported by the Office of Science of the Department of Energy under Contract DE-AC05-00OR22725.
8.
REFERENCES
[1] 3DMark. http: //www.futuremark.com/benchmarks/3dmarkvantage. [2] Crysis. http://www.ea.com/games/crysis. [3] D3D RightMark. http://3d.rightmark.org/. [4] Parboil Benchmark suite. http://impact.crhc.illinois.edu/parboil.php.
Figure 8: SHOC OpenCL Level One Stencil2D benchmark results across test platforms. (lower is better)
[5] TOP500 Supercomputing Sites. http://www.top500.org/. [6] Great Internet Mersenne Prime Search (GIMPS), 2010. http://www.mersenne.org. [7] Accelereyes. Jacket GBENCH. http://www.accelereyes.com/gbench. [8] S. Che, M. Boyer, J. Meng, D. Tarjan, J. W. Sheaffer, S.-H. Lee, and K. Skadron. Rodinia: A benchmark suite for heterogeneous computing. In Proceedings of the 2009 IEEE International Symposium on Workload Characterization (IISWC ’09), pages 44–54, Austin, TX, USA, 2009. IEEE. [9] P. R. Luszczek, D. H. Bailey, J. J. Dongarra, J. Kepner, R. F. Lucas, R. Rabenseifner, and D. Takahashi. The HPC challenge (HPCC) benchmark suite. In SC ’06: Proceedings of the 2006 ACM/IEEE Conference on Supercomputing, New York, NY, USA, 2006. ACM. [10] N. Satish, M. Harris, and M. Garland. Designing efficient sorting algorithms for manycore GPUs. In Proceedings of the International Parallel and Distributed Processing Symposium (IPDPS 2009), Los Alamitos, CA, USA, 2009. IEEE Computer Society. [11] S. Sengupta, M. Harris, Y. Zhang, and J. D. Owens. Scan primitives for GPU computing. In GH ’07: Proceedings of the 22nd ACM SIGGRAPH/EUROGRAPHICS Symposium on Graphics Hardware, pages 97–106, Aire-la-Ville, Switzerland, 2007. Eurographics Association. [12] The Khronos Group. The OpenCL Specification, Version 1.0, Document Revision 43, 2009. [13] V. Volkov and J. W. Demmel. Benchmarking GPUs to tune dense linear algebra. In SC ’08: Proceedings of the 2008 ACM/IEEE conference on Supercomputing, pages 1–11, Piscataway, NJ, USA, 2008. IEEE Press. [14] V. Volkov and B. Kazian. Fitting FFT onto the G80 architecture, 2008. http://www.cs.berkeley.edu/~kubitron/courses/
cs258-S08/projects/reports/project6_report.pdf.
Figure 12: This chart shows the measured peak single precision flops normalized by device power consumption. All power consumption numbers used are the manufacturer’s specified thermal design point (TDP).