Almeria Province. Solonchaks. Gypsisols. Calcisols. Leptosols. Regosols. Arenosols. Cambisols. Luvisols. Page 11. AlmerÃa Properties of Georeferenced.
The Scale Invariance vs Non-Scale Invariance in Landscape Analysis and Biogeodiversity Studies Juan José Ibáñez, Rufino Pérez‐Gómez, Enrico Feoli, Cecilio Oyonarte go against… We will travel to the far southeastern Sorry by my functional deafness
Almeria Province
A dispute with archaeologists: Ostrich eggs
Almeria Province
Aridic Regime USDA-ST
Almeria Province: Syntaxonomic approach
Almeria Province: Soil, Water, Plants Landscape, Ramblas and Wadi
Sierra Nevada Mountain Range
Almeria Province
Ramblas Low-lying cliffs wide and flat river bed & the channel narrows
Almeria Province: Soils, Plants and Water Braided streams
waterholes
leeward
Almeria Province
aquifer aquitard aquifuge
Almeria Province Leptosols Regosols Arenosols Cambisols Luvisols Solonchaks Gypsisols Calcisols
Almería Properties of Georeferenced databases analysed
Almeria Province: two sampling designs: Drainage basins: from the sea to the high mountain tops crossing from the bottom to the top reaching fast the steepest slopes Bioclimate belts: fringes roughly parallel to the coastline and the high mountains ranges
Georeferenced data bases Potential Vegetation Analysis
Richness
Scale Map
Nº Polygons
(40) 42, 44
1: 10.000
Soils Major Soil Groups
20
1:100.000
Soil Types (2nd
44
1:100.000
Soil associations
302
1: 100.000
3566
Lithological Units
32
1: 400.000
355
Lithological associations
17
1: 400.000
19**
1: 400.000
Drainage Basis
WRB level)
(*) drainage delineations were supervised using Google Earth.
6749
19
Almeria Province
Almeria Province
Almeria Province Richness 4,9 10,3 8,3 9
Lithological associations
Shannon Index 1,03 1,88 1,66 1,43
3 ln S
Lithological Units Hortonian Rank 1 Hortonian Rank 2 Hortonian Rank 3 Hortonian Rank 4
2 1
y = 0,2022x + 0,7953 R² = 0,5658
0 0
2
4
6
8
10
ln A
Potential natural vegetation Richness (S)
4
Shannon Index (H’)
3 6,9 10 12,7 24
1,07 1,23 1,57 1,86
ln S
Potential Vegetation Hortonian Rank 1 Hortonian Rank 2 Hortonian Rank 3 Hortonian Rank 4
2 y = 0,2857x + 0,6769 R² = 0,6421
1 0 0
2
4
6
8
10
ln A (Basins Area)
Soil types Richness 11,8 20,7 23,3 29,0
Shannon Index 1,73 2,06 2,14 2,35
4 3 ln S
Soils Hortonian Rank 1 Hortonian Rank 2 Hortonian Rank 3 Hortonian Rank 4
2
y = 0,3259x + 1,0235 R² = 0,7703
1 0 0
2
4
6
ln A (Basins Area)
8
10
Almeria Province
Almeria Province
Almeria Province Table 6. Correlation Matrix of the variables analyzed in the study area
Basins
Basins Lithology (S) Vegetation (S) Soils (S) 2 Km
Lithology (S) Vegetation (S)
1 * 0,66 ** 0,79 ** 0,76 0,75**
1 * 0,47 ** 0,74 ** 0,76
Soils( S)
1 ** 0,81 ** 0,77
2
Km
1 ** 0,94
1
Spearman's correlation coefficient or Spearman's (*) P = 0,05: (**) P = 0,01
Lithology Soils Vegetation
System Temperature
Matrix Fill %
23,7 17,5 21,4
38,0 34,6 23.0
Category/Richness Dominant Abundant Frequent Minorities Endemic Idiosyncratic Other types
Lithotypes 1 (5,9%) 4 (23,5%) 0 0 4 (23,5%) 5 (29,4%) 6 (35,3)
P for the system temperature No > 99.9% > 95.0%
Pedotypes 5 (11,4%) 2 (4,5%) 6 (13,6) 8 (18%) 3 (6,8%) 15 (34,1%) 13 (29,5%)
P simulation Run 56,74ºC 64,18ºC 52.71ºC
Vegetation types 0 (0%) 2 (5%) 3 (7,5) 8 (20%) 13 (30%) 22 (55%) 12 (30%)
Almeria Province: Climate Belts Bioclimate belts Oromediterranean Supramediterranean (upper) Suprramediterranean (lower) Mesomediterranean (upper) Mesomediterranean (lower) Thermomediterranean (upper) Thermomediterranean (lower)
Syntaxonomy Geobotany Plant Associations
Area Km2 1.0 52.6 500.1 1909.2 2617.6 2072.3 1607.1
Berberido hispanicae‐Querceto rotundifoliae sigmetum: Betic Upper‐Mediterranean dry‐subhumid on soil rich nutrients of the evergreen oak (Quercus rotundifolia) Upper‐Mediterranean dry‐subhumid on soil rich nutrients serie
Soil & Parent Materials related PNV siliceous soils series nutrients rich soils series Limestone serie edaphohygrophilous serie limestone‐dolomitic edaphoxerophilous serie nutrient soils rich edaphohygrophilous serie siliceous soils edaphohygrophilous serie meso‐halophytic edaphohygrophilous serie nutrient rich soils rich edaphohygrophilous microgeoserie meso‐halophytic edaphohygrophilous microgeoserie hyper‐halophytic edaphohygrophilous microgeoserie
meso‐halophytic edaphohygrophilous microgeoserie siliceous soils riparian geoserie riparian geoserie nutrient soil rich edaphohygrophilous geoserie Edaphoxerophilous on gypsum vegetation complex Gypifeous edaphoxerophilous vegetation complex Subsaline marls polyteselar edaphoxerophilous c. Halophytic coastal Vegetation Coastal Dunes & Sand deposits Vegetation Brackish waters Edaphohygrophilous geoserie Salt marshes & Salinas Vegetation
Almeria Province 3,5 3 2,5 2 1,5
y = 0,4002x ‐ 0,0522 R² = 0,9908
1 0,5 0 ‐0,5 0
2
4 6 ln Area Climate Belts
8
10
Soil Richness‐Area by Climate Belts ln numer of soil Richness
ln Potential Vegetation Richness
Vegetarion Richness‐Area by Climate Belts
4 3,5 3 2,5 2 1,5 1 0,5 0
y = 0,1806x + 1,9816 R² = 0,9505 0
2
4
6
ln Area of Climate Bellt
8
10
Almeria Province BB NP
BB (km2)
Soils NP
Soils (km2)
Soils S
Soils H'
PNV Nº Polygons
PNV (km2)
PNV S
Upper Thermomediterranean
2 23 58 314 641 578
0.11 52.8 500.57 1910.4 2618.1 2074.2
4 54 205 648 904 775
0.1 52.6 500.1 1909.1 2617.6 2072.3
7 16 21 26 26 30
1.28 2.03 2.1 2.16 2.19 2.19
2 10 119 964 1574 1458
0.11 52.7 498.4 1439.2 2072.2 1732.0
2 4 13 21 25 20
0.22 0.33 1.11 1.4 1.97 1.86
Low Thermomediterranean
298 1612.9
976
1607.1
34
2.36
2622
1137.6
18
1.69
Climate Belt (BB) Oromediterranean Upper Supramederranean Low Supramediterranean Upper Mesomediterranean Low Mesomediterranean
PNV H'
BB = Climate belts; NP = Number of Polygons
System Temperature Soils Vegetation
Matrix Fill %
P for the system temperature 22.72 44.8 No 32.25 33,3 No Nested subset analysis by bioclimatic belts
P simulation Run 50.27ºC 48.44ºC
Climate belts doubtful nesting, unlike for watersheds
Almeria Land Cover PNV
Area km2
Climatophilous
Lithological
Edaphophylous
Total
3463.81
2980.36
488.06
6932.24
2819
1335
1710
5864
Dominant
0
0
0
0
Abundant
0
1
0
1
Common
0
3
1
4
Frequent
6
2
2
10
Rare
1
1
10
12
Endemic
0
3
10
13
Nº polygons
(*) climatophilous: PNV climate dependant ; (*) Lithological PNV parent material dependant; (*) Edaphophylous PNV soil taxa dependant
Almeria: Land Cover 1 0,9 0,8 0,7 0,6 0,5 0,4 0,3 0,2 0,1 0
% landcover Plant Communities (soils) % Landcover Plant comminities (lithology) % Landcover Plant comminities (Climate)
Oromediterranean Upper Supramederranean Low Supramediterranean Upper Mesomediterranean Low Mesomediterranean Upper Thermomediterranean Low Thermomediterranean
% land cover Plant Communities (soils)
% Land cover Plant communities (lithology)
% Land cover Plant communities (climate)
0 0
100 100
0 0
0
99.7
0.3
3.2
96.7
0.1
10
30
60
17.1
1.1
81.8
13
0.01
87.0
% of Land Cover by Potential Vegetation conditioned by soils, lithology and climate
Almeria Province: PNV diversity 16 14 12 10
Total
8
Climate
6
Rock
4
Soil
2 0
Nº PNV Macro‐types
PNV dependent properties Soil Rocks Climate
58.5% 24.5% 17%
Total
Dominant Abundant Common Frequent Rare Endemic
0 1 4 9 12 15
Climate
0 0 0 6 1 0
Rock
Soil
0 1 3 1 1 4
0 0 1 2 10 11
Protected Areas and natural Parks
•
PNV
• PNV
• • •
Biodiversity Soil: 58.5% Rocks: 24.5% Climate: 17%
Landscape • Climate: 50% • Rocks: 43% • Soils: 7%
Smallest Polygon = 0.01 m2
Almeria Province: Rank Abundance plots and Power Fits of Polygons Number vs area
500000000
All PNV Polygons: Rank Abundance Plot
450000000
Polygons Area
400000000 350000000 300000000 250000000 200000000 150000000 100000000 50000000 0 0
1000
2000
3000
4000
5000
6000
7000
Nº Polygons
Power Fit: Polygons Area Ln Area of Each Poygons
30 25 20 15 10 5 0 ‐5 ‐10
0
2
4
6
Ln Nº Polygons
8
PNV Power Fit Nº Polygons Powe Fit Gypifeous edaphoxerophilous vegetation complex 3 Minority Edaphoxerophilous on gypsum vegetation complex 37 Yes Subsaline marls polyteselar edaphoxerophilous vegetation complex 77 Yes Coastal Dunes & Sand deposits Vegetation 410 Yes Brackish waters Edaphohygrophilous geoserie 1 Endemic Meso‐Mediterranean on nutrient soil rich edaphohygrophilous geoserie 91 Yes Thermo‐Mediterranean on nutrient rich soils rich edaphohygrophilous geoserie 667 Yes Upper‐Meso‐Mediterranean on siliceous soils riparian geoserie 33 Yes Thermo‐Mediterranean semiarid riparian geoserie 3 Minority Oro‐Mediterranean on nutrient rich soils rich edaphohygrophilous microgeoserie 2 Minority Thermo‐Mediterranean hyper‐halophytic edaphohygrophilous microgeoserie 54 Yes Thermo‐Mediterranean meso‐halophytic edaphohygrophilous microgeoserie 7 Yes Salt marshes & salinas Vegetation 140 Yes Meso‐Thermo‐Mediterranean meso‐halophytic edaphohygrophilous serie 9 yes Meso‐Mediterranean on sandy siliceous soils edaphohygrophilous serie 23 Yes Meso‐Upper‐Mediterranean sub‐humid & humid edaphohygropilous serie 13 Yes Meso‐Upper‐Mediterranean subhumid & humid on nutrient soils rich edaphohygrophilous serie 9 Yes Upper‐Meso‐Mediterranean dry‐ sub‐humid on siliceous soils edaphohygrophilous serie 3 Minority Thermo‐Meso‐Mediterranean edaphohygrophilous serie 66 Yes Thermo‐Meso‐Mediterranean on nutrient rich soils rich edaphohygrophilous serie 25 Yes Upper‐Meso‐Mediterranean on nutrient rich soils rich edaphohygrophilous serie 31 Yes 320 Yes Meso‐Mediterranean on nutrient soils rich serie Meso‐Medierranean dry on nutrient soils rich serie 517 Yes Meso‐Mediterranean semiarid serie 201 Yes Meso‐Upper‐Mediterranean‐Low limestone‐dolomitic edaphoxerophilous serie 5 Yes Oro‐Mediterranean on nutrients rich soils serie 10 Yes Oro‐Mediterranean on siliceous soils serie 35 Yes Upper‐Mediterranean on nutrients rich soils serie 8 Yes Upper‐Mediterranean dry‐sub‐humid on nutrient rich soils serie 20 Yes Upper‐Meso‐Mediterranean limestone serie 1 Endemic Upper‐Meso‐Mediterranean siliceous soils Serie 353 Yes Upper‐Meso‐Mediterranean sub‐humid & humid on nutrients rich soils serie 3 Minority Thermo‐Mediterranean‐low semiarid serie 936 Yes Thermo‐Mediterranean Semiarid & arid costal serie 52 Yes Thermo‐Mediterranean dry & subhumid on nutrient soils rich serie 68 Yes Thermo‐Mediterranean semiarid serie 497 Yes 724 yes Thermo‐Mediterranean semiarid‐arid serie Thermo‐Mediterranean semiarid‐dry serie 405 Yes Thermo‐Meso‐Mediterranean serie 4 Minority Halophytic coastal Vegetation 1 Endemic All Polygons 5864 Yes
10
y = ‐2,2236x + 27,113 R² = 0,8527
R2 Z value 0.996 8.88 0.86 2.21 0.97 2.34 0.91 2.66 0.81 0.88 0.97 0.95
1.62 1.57 1.58 0.6
0.91 0.9 0.97 0.79 0.9 0.76
1.56 4.03 2.14 1.44 0.84 1.13
0.86 0.98 0.91 0.92 0.66 0.95 0.97 0.96 0.95 0.82 0.94 0.64 0.88
0.5 0.54 1.67 1.61 2.62 2.48 1.62 2.15 3.33 2.18 3.98 2.47 3.12
0.96 0.99 0.89 0.94 0.97 0.97 0.95 0.94 0.63
2.45 0.75 1.61 3.09 2.79 2.29 1.94 2.27 1.48
0.85
2.22
Almeria PNV Main Types Power Fit PNV Main Types Polygon sizes edaphohygrophilous Salt Series Sand % Sand Dunes Salinas edaphoxerophilous Eutric Dystric gypifeous Series Subsaline marls Climatophilous Caliciculous Salt marshes
Powe Fit Yes Yes Yes Yes No No No No No No Endemic Minority
R2
Z value 0.88 0.79 0.5 0.47 0.0002 0.05 0.04 0.07 0.06 0.004
edaphohygrophilous
0.46 0.23 0.26 0.22 0.002 0.07 0.06 0.05 0.05 0.02
80 60 40
edaphohygrophilous
20 0 0
100000000 200000000
PNV edaphohygrophilous 6 5
PNV Climatophilous
4 3
6
y = ‐0,0179x + 3,5425 R² = 0,0039
4
edaphohygrophilous
2 1
y = ‐0,4614x + 9,066 R² = 0,8788
0
2
0 0 0
5
10
15
20
5
10
15
20
Edaphophylous Polygon Size 7000 6000 5000 4000 3000
Area
2000
Area%
1000 0 Total Area
Acumulated Area Acumulated Area before the before the 2nd larguer larguer edaphophylou edaphophylou polygon polygon
Relative edaphopylous polygon size
Area Km2 Area%
Total Area (Almería)
6932.24
100
Accumulated Area before the larger edaphophylous polygon
4746.21
68.5
Accumulated Area before the 2nd larger edaphophylous polygon 5674.76
87.4
PNV Larger Polygons Climatophilous Lithological Climatophilous Lithological Lithological Lithological Lithological Climatophilous Lithological PNV Smaller Polygons Sands and Sands dunes Sands and Sands dunes Sands and Sands dunes Sands and Sands dunes Sands and Sands dunes Sands and Sands dunes Sands and Sands dunes Sands and Sands dunes Sands and Sands dunes Sands and Sands dunes
Area m2 466495705.5 301636684.6 252097306.5 229981736 213517556.4 186887649.8 166817685.2 154407521.4 135989448.1 Area m2 4.03736 3.739154 3.562533 3.125016 2.748981 1.4055 1.19722 0.614673 0.219602 0.010441
Almeria PNV Main Types Power Fit PNV Sands and Sand Dunes
Salty PNV Ln Rank
2,5
2,5
2
2 Sand Dunes
1,5
Ln Rank
1
1
Lineal (Sand Dunes)
0,5 0 ‐0,5
1,5
0
5
10
15
20
Lineal (Ln Rank)
0,5
y = ‐0,2301x + 4,3005 R² = 0,7939
0 0
y = ‐0,2627x + 4,4029 R² = 0,4934
5
10
PNV Eutric
15
20
PNV Dystric
4
3,5 3
3
2,5 Eutric
2
Lineal (Eutric) 1
2
Dystric
1,5
Lineal (Dystric)
1
0 0
5
10
15
y = ‐0,0749x + 3,8125 20 R² = 0,047
0,5 0 0
5
10
15
y = ‐0,0555x + 3,0349 R² = 0,0429 20
PNV & Associated soils in risk of Extinction PNV in Risk of Extinction
Nº Polygons Conservation
Max Min Min Km2 Km2 m2
Gypiferous edaphoxerophilous vegetation complex
3
Minoritiy
7.289 0.004
4099
Brackish waters Edaphohygrophilous geoserie
1
Endemic
0.058
Thermo‐Mediterranean semiarid riparian geoserie
3
Minoritiy
0.299 0.158
157791
Oro‐Mediterranean on nutrient rich soils rich edaphohygrophilous microgeoserie
2
Minoritiy
0.005 0.005
4774
Thermo‐Mediterranean meso‐halophytic edaphohygrophilous microgeoserie
7
Risk
2.399 0.002
1521
Meso‐Thermo‐Mediterranean meso‐halophytic edaphohygrophilous serie Meso‐Upper‐Mediterranean subhumid & humid on nutrient soils rich edaphohygrophilous serie
9
Risk
0.198
0.011
9886
9
Risk
0.076 0.019
19020.
Upper‐Meso‐Mediterranean dry‐ sub‐humid on siliceous soils edaphohygrophilous serie
3
Minoritiy
0.041 0.022
22251
58082
Meso‐Upper‐Mediterranean‐Low limestone‐dolomitic edaphoxerophilous serie
5
6.657
0.051
50618
Upper‐Mediterranean on nutrients rich soils serie
8
2.294 0.003
3295
Upper‐Meso‐Mediterranean limestone serie
1
Endemic
Upper‐Meso‐Mediterranean sub‐humid & humid on nutrients rich soils serie
3
Minoritiy
Thermo‐Meso‐Mediterranean serie
4
Halophytic coastal Vegetation
1
0.020 0.024 0.010 6.406
Endemic
20799
4.155
0.519
10461 518558 4155390
Spain (Iberian Peninsula)
Spain (Iberian Peninsula)
J1
Tectonic Depressions
Spain nesting impossible For each basin does exist nesting
Diapositiva 31 J1
Juanjo; 09/05/2015
Spain (Iberian Peninsula) 120000
Rank Abundance Plot Spain
80000 60000 40000 20000 0 0
5
10
15
20
25
30
Basins Area in km2 120000
Rank Abundance Plot Iberia
100000 24 higest basins
24 higest basins
100000
80000 60000 40000 20000 0 0
5
10
15
20
Bains Area in Km2
25
30
35
Spain (Iberian Peninsula) Basins Rank
Soil S
Soil H´
PNV S
PNV H´
Geology S
Geology H´
Quaternary Landforms S
Quaternary Landforms H
Rank 1
7.12
1.37
2.41
0.42
2.91
0.65
2.65
0.56
Rank 2
10.47
1.61
3.18
0.58
4.08
0.98
2.99
0.63
Rank 3
11.40
1.75
4.86
0.88
5.22
1.12
4.11
0.80
Rank 4
17.90
1.97
9.44
1.43
9.00
1.42
7.38
1.38
Rank 5
29.67
2.29
14.33
1.44
15.33
1.96
24.67
2.31
Rank 6
32.6
2.43
31.20
2.31
16.80
1.98
26.60
2.19
30
Area‐Basins Rank
Area KM2
25 20 15 10 5
y = 3,7746x + 17,284 R² = 0,8881
0 0
0,5
1 Basins Rank
1,5
2
Spain (Iberian Peninsula) Basins Rank
Soil Types
PNV Types
Lithological Association Types
Basins Hortonian 1 Rank Soil types 99.6%* 1 PNV Types 95.0%* 0.99.5* 1 Lithological 98.6%* 99.8%* 77.3% 1 Associations Quaternary Units 95.1%* 99.9%* 58.7% 84.3% Correlation Matrix Aggregated Data (T‐Student >95% = (*)) Basins/ Samples All 100km2 200km2 Samples Samples Soils R2 Values 0.46 0.51 0.55 2 Quaternary R 0.59 0.59 0.65 Values 0.45 0.54 0.57 PNV R2 Values Lithological 0.50 0.38 0.38 Assoc R2 Values R2 Taxa-area relationships Values deleting small basins
Quaternary Units
1
conflictive overlapping of thematic maps -Small effect islands -Sampling Density
Spain (Iberian Peninsula) conflictive overlapping of -Small effect islands By drainage basins thematic maps -Sampling Density
4 3,5 3 2,5 2 1,5 1 0,5 0
Soil Types‐Area
PNV‐Area ln Richness
4
y = 0,8664x + 1,8007 R² = 0,8921
3 2 y = 1,3576x + 0,5054 R² = 0,8579
1 0
0
0,5
1
1,5
0
2
0,5
ln Basins Rank
3
ln Richness
2 1,5 1 y = 1,0313x + 0,8482 R² = 0,9024
0,5 0 0,5
1 ln Basins Rank
1,5
2
Quaternary Landforms
3,5 3 2,5 2 1,5 1 0,5 0
y = 1,3652x + 0,4973 R² = 0,7703 0
0
1 ln Basins Rank
Lithological Ass.
2,5 ln Richness
ln Soil types
Spain (Iberian Peninsula) By drainage basins
1,5
2
0,5
1 ln Basins Rank
1,5
2
Spain (Iberian Peninsula) Density Power law Fit R2 Z value
Lithology
Quaternary Vegetation Pedotypes landforms (PNV) Spain
0.63 0.55
0.50 0.62
0.64 0.63
0.63 0.64
Pedotypes Iberian Peninsula 0.77 0.90
Density = richness per unit area Geology
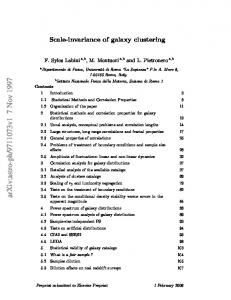
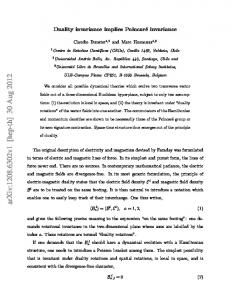
Basin number 4007 Muga 4009 Fluvia 4004 Deva 4003 Sella 4005 Nervión 4019 Andarax 4017 Odiel 4001 Navia 4006 Ulla 4008 Ter 4020 Guadalhorce 4021 Guadalete 4014 Mijares 4002 Nalón 4010 Llobregat 4013 Turia 5003 Segura 6001 Miño 5001 Jucar 5002 Guadiana 6004 Tajo 6005 Guadalquivir 6003 Duero 6002 Ebro
Lager basins
Cuaternario
Basin Numer
4007 4009 4004 4003 4005 4019 4017 4001 4006 4008 4020 4021 4014 4002 4010 4013 5003 6001 5001 6005 5002 6004 6002 6003
Muga Fluvia Deva Sella Nervión Andarax Odiel Navia Ulla Ter Guadalhorce Guadalete Mijares Nalón Llobregat Turia Segura Miño Jucar Guadalquivir Guadiana Tajo Ebro Duero
PNV Basin Numer
Pedotypes Basin Numer 4007 Muga 4007 4009 Fluvia 4009 4004 Delva 4004 4003 Sella 4003 4005 Nervión 4005 4019 Andarax 4019 4017 Odiel 4017 4001 Navia 4001 4006 Ulla 4006 4008 Ter 4008 4020 Guadalhorce 4020 4021 Guadalete 4021 4014 Mijares 4014 4002 Nalón 4002 4010 Llobregat 4010 4013 Turia 4013 5003 Segura 5003 6001 Miño 6001 5001 Jucar 5001 5002 Guadiana 6005 6004 Tajo 5002 6005 Guadalquivir 6004 6003 Duero 6002 6002 Ebro 6003
Muga Fluvia Deva Sella Nervión Andarax Odiel Navia Ulla Ter Guadalorce Guadalete Mijares Nalón Llobregat Turia Segura Miño Jucar Guadalquivir Guadiana Tajo Ebro Duero
Almeria Conclusions •
Conceptually, two sampling designs, one perpendicular to the other.
•
Both sampling designs together, provide information on all soil forming factors
•
The results are complementary not antagonistic
•
However the analysis by climate belts break the scale invariance to nested subset analysis showed using drainage basins. This result is logic (islands-area and watersheds-area follow power laws, PNV no). Spain is too heterogeneous: the conditions for structures do not occur.
•
Landscape (soilscape) spatial patterns could be considered from both perspectives: scale invariance vs non scale invariance (sampling scheme)
Almeria Conclusions: Two Sampling Designs •
Regularities – Richness-area relationships fit well to power laws – Diversity area-relationships relationships fit well to power laws – Plant communities diversity as well as pedodiversity are conform to the same patterns being correlated among them – Geological assemblages no? – The theory of island biogeography and biodiversity-area relations in continents.
•
Idiosyncrasies – Nestedness do not occurs by bioclimatic belts or for the whole of Spain. Each Phytoclimate fringe tend to have idiosyncratic soils and vegetation types. – Nesting requires that the environmental conditions are rather homogeneous This is not the case of watersheds in Spain – The information provided by drainage basin on landforms is lost in climate belts analysis. Thus soil-landforms relationships are not clear.
Almeria Conclusions: Two Sampling Designs • Limitations (shortcomings) of databases – Different scales difficult to detect regularities better – A geological map do not represent accurately lithology outcrops in earth surface systems. Geological maps do not permit quantify the extent covered by the different lithologies. thus, it is not feasible analyse the relations between parent materials, soils and plant communities diversities – Lack information on geomorphology – There is not a universal lithological classification to compare different territories – There is not a universal geomorphological classification to compare different territories – There is not a universal vegetation classification to compare different geographical spaces – Syntaxonomic approach has been used systematically across all he European continent (e.g. Habitat 20000), but is but it is practically unknown in Anglo-Saxon countries.
Almeria Conclusions Soils and Water at landscape level •
Sintaxonomic approach provide information on plant species, plant associations, climate, but also ¡on soils! (nutrients, salt contents, texture and water regimes).
•
In Almeria study area the most plant landscapes are climate & Lithological dependents
•
In Almeria biodiversity depend mainly on soils (>60%)
• • •
Soil: 58.5% Rocks: 24.5% Climate: 17%
•
Edaphohygrophilous PNV fil bet to power laws across several magnitude orders (scale invariance)
•
Soil degradation imply a huge loss of natural plant communities
•
Preserving soil-habitat we preserve above and underground diversities
Almeria Conclusions Soils and Water at landscape level and Biogeodiversity islands •
PNV map at the scale 10.000 concern to vegetation individuals and not to associations of PNV. Each polygon is an PNV individual. This fact permit the analysis of polygons without disaggregation.
•
Edaphophylous PNV polygons are very small, in general. Thus soil conditions (pedotypes) do not appear at the scale of the soil map (E1: 1000.000). Also is true that WRB 1998 and the USDA ST were carryout mainly to agronomic purposes ignoring natural preservation.
•
Some on the termed soil functions concern to biodiversity preservation (“gene pool”).
•
The most of edaphophylous series that demand considerable supply water (of edaphohygrophylous ).
Almeria Conclusions Soils and Water at landscape level and Biogeodiversity islands •
Edaphohygrophylous PNV seems islands of biogeodiversity (invisible in the soil map), into a matrix of arid lands, but providing the 58.5% of the biodiversity, following scaling laws along several orders of magnitude: both for each type of vegetation as the whole of them.
•
Many edaphohygrophylous PNV are scarce and of small size, being difficult their preservation in an arid-anthropic landscape.
•
Overlaying PNV and the soil maps should allow identify the sites of arid landscapes with edaphohygrophylous PNV. To study soilsvegetation relationships PNV map should provide a list of “phases s.l.” to conservation purposes
•
The concepts of biogeodiversity islands and islands of fertility in arid lands are not the same but are related in some aspects.
Almeria Conclusions Soils and Water at landscape level and Biogeodiversity islands •
The information provided by the PNV map should be used as phases s. l. with available to indicating sites to be preserved via complementarity methods (designing natural network of PNV/soil reserves).
•
Thus if some of the edaphohygrophylous PNV are in risk of extinction, pedological information could be used as a tool of ecological/pedological restauration.
•
Are there this spatial pattern and scale invariance of edaphohygrophylous PNV in other arid lands?
•
Biogeodiversity islands: Biopedodiversity islands
Bioclimatic Diagrams Simulation Model (González Rebollar)
The End
A landscape film of the far eastern
XIX Centurty Lead Fever
Almeria Geological History
Spain (Iberian Peninsula) PNV, Pedotypes, Geology and Quaternary
Soil Types (WRB, 1998) of the Almeria Province Soil Types 2nd WRB (1998) Calcaric Regosol Lithic Leptosol Leptic Regosol Eutric Regosol Aridic Calcisol Calcaric Cambisol Calcaric Fluvisol Eutric Cambisol Rendzic Leptosol Aridic Solonchak Haplic Calcisol Chromic Luvisol Luvic Calcisol Terric Anthrosol Epipetric Calcisol Luvic Phaeozem Eutric Fluvisol Eskeletic Arenic Fluvisol Chromic Cambisol Calcic Luvisol Dystric Regosol Leptic Phaeozem
Acronyms % Covered Soil Types 2nd WRB (1998) Acronyms % Covered RGca 27.438 Sands Mare 0.3481 LPli 14.0425 Gypsiric Regosol RGgp 0.3354 RGle 13.4096 Albic Arenosol ARab 0.2032 RGeu 10.777 Calcaric Phaeozem PHca 0.1661 CLad 5.6389 Gleyic Solonchak SCgl 0.1632 CMca 5.1564 umbric Leptosol LPum 0.1465 FLca 4.8169 Salinas Msal 0.1305 CMeu 2.1548 Aridic Arenosol ARad 0.1162 LPrz 1.9576 Dystric Cambisol CMdy 0.0904 SCad 1.8338 Aridic Gypsisol GYad 0.0754 CLha 1.6948 Hypergypsic Gypsisol GYgyh 0.0722 LVcr 1.437 Anthric Urbic Regosol RGah_ub 0.055 CLlv 1.3569 Chromic Vertisol VRcr 0.0391 ATtr 1.1867 Leptic Umbrisol UMle 0.0301 CLptp 1.1123 Water bodies Memb 0.0172 PHlv 1.0105 Gleyic Cambisol CMgl 0.0108 FLeu 0.6984 Dystric Gleysol GLdy 0.016 FLsk_ar 0.5214 Anthric Spolic Regosol RGah_sp 0.011 CMcr 0.5072 Vertic Cambisol CMvr 0.0014 LVcc 0.4589 Urban Soils Mnuc 0.0012 RGdy 0.3852 Dystric Fluvisol FLdy 0.0091 PHle 0.3664 Calcic kastanozem KScc 0.0007
Nº Soil Types/RSG including other sources RSG
Nº Soil Types
% Covered
Nº Soil Types
Nº Soil Types
% Covered
Nº Soil Types
Regosols
7
52.1
11 Umbrisols
1
0.27
1
Leptosols
3
16.03
6 Vertisols
1
0.1
2
Arenosols
2
10.01
2 Kastanozems
1
0.09
2
Fluvisols
4
8.04
5 Anthrosols
1
0.04
1
Cambisols
6
6.1
9 Luvisols
2
0.03
1
Calcisols
4
1.97
5 Salinas
1
0.02
1
Phaeozems
3
1.96
3 Water Bodies
1
0.018
1
Gypsisols
2
1.92
4 Sands
1
0.0009
1
Solonchaks
2
1.01
4 Urban Soils
1
0.0008
1
Gleysols
1
0.29
1 Chernozems
0
0.0004
1
44
100
62
Total S
Other soils of Almería not included in the Soil Map
Dystric Leptosol
Leptic Cambisol
Calcaric Leptosol
Antropic-Reductic Regosol
Eutric Leptosol
Antric-Aric Regosol
Mollic Leptosol
Antric-Garbic Regosol
Hiposalic Fluvisol
Calcic Chernozem
Luvic Kastanozem
Calcic Solonchak
Calcic Gypsisol
Haplic Solonchak
Endopetrics Calcisol
Haplic Gypsisol
Mollic Cambisol
Calcic Vertisol
Endosalic Cambisol
Other Questions and Answers (Enrico Feoli) Alpha diversity • (1) How much are diversities of lithotypes, pedotypes and vegetation types of watersheds correlated to the extent (area) of the watersheds? • (2) How much is pedodiversity correlated to lithodiversity? • (3) How much is vegetation diversity correlated to pedodiversity and lithodiversity? Beta Diversity • (4) How much are the litho-, pedo- and vegetation diversities of watersheds correlated among themselves? • (5) How much are litho-, pedo- and vegetation diversities of watersheds correlated with the extent of the watersheds? • (6) How much are the litho-, pedo- and vegetation diversities of watersheds correlated to the proximity of the watersheds? • (7) Is the land system of the province of Almeria classifiable in subsystems of watersheds according to lithology, pedology and vegetation, or is the nestedness overwhelming any classification possibility?
Other Questions and Answers (Enrico Feoli) Alpha diversity Questions • We have considered the richness and the Shannon entropy (the Shannon entropy is routinely used to calculate the diversity of landscapes, of the watersheds in terms of their lithotypes, soil types and vegetation types (series) and we have applied linear and non-linear regression analysis (simple and multiple) between the area (independent variable) and the diversity measures (dependent variables). •
We have used simple correlation analysis (by Spearman and Pearson coefficients) and partial correlation analysis (first and second order partial correlation using Pearson correlation coefficient) .
•
To evaluate the best fit of the non-linear regression the program offers the sum of squares of the residuals. We used this parameter to compare different regressions and to evaluate the multiple regression in a step-wise mode to see how much the vegetation diversity–area relationship is improved by introducing in the regression, first the lithodiversity and then the pedodiversity and to see how much the relationship pedodiversity-area improves by introducing in the regression the lithodiversity
Other Questions and Answers (Enrico Feoli) Beta Diversity Questions • Diversity questions they concern the analysis of (dissimilarities, similarity) within a set of sampling units.
the
heterogeneity
•
While diversity is expressed by a scalar obtained from a single vector, diversity is expressed by a scalar obtained from a matrix of at least two vectors.
•
To answer the fourth question (How much are the litho-, pedo - and vegetation diversities of watersheds correlated among themselves? we have used the three matrices L(L,N), S(S,N) and V(V,N) and we have calculated the similarity between the watersheds considering both the area of the types (quantitative data) and the binary data for each of the three matrices. The Mantel’s test has been used to test the correlation between the similarity matrices.
Other Questions and Answers (Enrico Feoli) Beta Diversity Questions • Diversity questions they concern the analysis of the heterogeneity (dissimilarities, similarity) within a set of sampling units. •
While diversity is expressed by a scalar obtained from a single vector, diversity is expressed by a scalar obtained from a matrix of at least two vectors.
•
To answer the fourth question (How much are the litho-, pedo - and vegetation diversities of watersheds correlated among themselves? we have used the three matrices L(L,N), S(S,N) and V(V,N) and we have calculated the similarity between the watersheds considering both the area of the types (quantitative data) and the binary data for each of the three matrices. The Mantel’s test has been used to test the correlation between the similarity matrices.