completed in Section VII and a summary of our findings is provided in ... USA, in which nodes are generators, transformers, or substations ... Newman [27] show that well-defined groups (such as a research ..... Information includes the list of shared files and ..... actors (in which actors belong to the cast of the same movie).
1
The Small World of File Sharing Adriana Iamnitchi, Matei Ripeanu, Elizeu Santos-Neto, and Ian Foster
Abstract— Web caches, content distribution networks, peer-topeer file sharing networks, distributed file systems, and data grids all have in common that they involve a community of users who use shared data. In each case, overall system performance can be improved significantly by first identifying and then exploiting the structure of community’s data access patterns. We propose a novel perspective for analyzing data access workloads that considers the implicit relationships that form among users based on the data they access. We propose a new structure —the interest-sharing graph— that captures common user interests in data and justify its utility with studies on four data-sharing systems: a high-energy physics collaboration, the Web, the Kazaa peer-to-peer network, and a BitTorrent file-sharing community. We find small-world patterns in the interest-sharing graphs of all four communities. We investigate analytically and experimentally some of the potential causes that lead to this pattern and conclude that user preferences play a major role. The significance of small-world patterns is twofold: it provides a rigorous support to intuition and it suggests the potential to exploit these naturally emerging patterns. As a proof of concept, we design and evaluate an information dissemination system that exploits the small-world interest-sharing graphs by building an interest-aware network overlay. We show that this approach leads to improved information dissemination performance. Index Terms— File sharing, workload characterization, smallworld graphs, self-organization, peer-to-peer systems.
I. I NTRODUCTION It is well-accepted that understanding a system’s usage characteristics can help guide its architects to an optimal design point. A well-known example is the relationship between web page popularity and cache sizes. Previous studies have shown that the popularity of web pages follows a Zipf distribution [8], [13]: few pages are highly popular while most pages are requested only few times. As a result, the efficiency of increasing the cache size is not linear: caching is most efficient for the most popular items, and there are diminishing returns from increasing the cache to provision for less popular items. A second example is understanding and exploiting the topology of networked systems. Many real networks have been shown to be power law. That is, their node degrees are distributed according to a power law: a small number of nodes have many neighbors, thus acting as hubs, while most nodes have few neighbors. Such networks are organically resilient to random node failures, while they are highly exposed to informed attacks that target the wellconnected nodes [59]. This study applies this intuition to large-scale distributed systems formed around shared data, such as peer-to-peer media sharing networks or scientific data grids. Our objective is to characterize the data-sharing patterns emerging in these communities and to explore the feasibility of building self-configuring, decentralized mechanisms that take advantage of these patterns. To this end, we look at data-sharing communities in a novel way: we study the relationships that form among users based on
the data in which they are interested. We capture and quantify these relationships by modeling a community as an interestsharing graph (Section II) and justify its utility with studies on four data-distribution systems (Section III): a high-energy physics collaboration, the Web, and two peer-to-peer file sharing networks, Kazaa and BitSoup. The interest-sharing graphs of all four communities we study have small-world characteristics (Section IV). We discuss possible causes of these emergent smallworld patterns (Section V) and, finally, as a proof-of-concept, we design and evaluate a fully decentralized mechanism that exploits the small-world pattern to disseminate information (Section VI). Related work, discussed in various places within the article, is completed in Section VII and a summary of our findings is provided in Section VIII. The remaining of this section introduces the intuition that led to this work and details the contributions of this paper. A. The Topology of Real Networks The development of the Internet added significant momentum to the study of networked systems by both facilitating access to collections of data and by introducing new networks to study, such as the Web graph, whose nodes are web pages and edges are hyperlinks [15], the Internet at the router and the autonomous system level [23], and the email graph [47]. The study of large networks uncovered recurring patterns in real networks (see [4], [6], [21], [46] for surveys). For example, a frequent pattern is the power-law distribution of node degree. Examples are numerous and from many domains: the longdistance phone-call network [1], [3], the citation network [53], and the linguistics network [16] (pairs of words in English texts that appear at most one word apart). In computer science, the evidence that the Internet topology has a power-law degree1 distribution [23] led to the replacement of the previously used random graph-based models. Other results followed: the web graph [7], [15] and the Gnutella overlay (as of year 2000) [54] are also power-law networks. Another class of networks are the “small worlds”. Two characteristics distinguish them from other network topologies: first, a small average path length, typical of random graphs (here ‘path’ means shortest node-to-node path); second, a large clustering coefficient that is independent of network size. The clustering coefficient captures how many of a node’s neighbors are connected to each other. This set of characteristics is identified in systems as diverse as social networks, in which nodes are people and edges are relationships; the power grid system of western USA, in which nodes are generators, transformers, or substations and edges are transmission lines; and neural networks, in which nodes are neurons and edges are synapses or gap junctions [64]. 1 Very recently, however, Willinger et al. [65] challenged the validity of these results based on limitations in data-collection that may compromise the claim that the physical Internet topology is power-law, with high degree nodes in its core and low degree nodes on the edge of the network.
2
B. Motivation and Contributions Newman shows that collaboration networks (i.e., networks that connect co-authors) in different scientific domains (physics, biomedical research, neuroscience, and computer science) have small-world characteristics [43]–[45]. Moreover, Girvan and Newman [27] show that well-defined groups (such as a research group in a specific field) can be identified in these collaboration networks. In parallel, a theoretical model for small-world networks by Watts and Strogatz [63] pictures a small world as a loosely connected set of highly connected sub-graphs. Since scientists tend to collaborate on publications, they likely use similar sets of resources: for example, they might use the same instruments to observe physics phenomena, or they might analyze the same data, using perhaps the same software tools or even a common set of computers. This means that if we connect scientists who use the same resources, we might get a small world. More interestingly, we might be able to identify groups that share a set of resources and harness this information to optimize the design of systems that enable resource sharing. Motivated by this intuition, we aim to answer the following two questions: Q1: Are there any patterns in the way scientists share data? Furthermore, are these characteristics typical of scientific communities or are they more general? Q2: Can these patterns be used to optimize the design of mechanisms supporting large-scale distributed systems? This article gives an empirical answer to both questions: it shows that small-world patterns exist in diverse data-sharing communities and that these patterns can be harnessed to design an efficient, adaptive, interest-aware information dissemination mechanism. The significance of this work is twofold: First, it presents quantitative evidence that supports the intuition described above and provides formal support to experimental work that might have benefited from these patterns without identifying the underlying phenomenon. Second, these patterns suggest solutions to designing efficient infrastructure services that support data-sharing communities. For example, our proof-of-concept informationdissemination mechanism (Section VI) that dynamically infers groups of users with common interests and proactively disseminates data, meets up to 70% of future requests for data without asking users to explicitly subscribe to content. II. T HE I NTEREST-S HARING G RAPH To answer question Q1, we introduce a new data structure, the interest-sharing graph, that captures the implicit relationships between users who request similar data during some period. We define the interest-sharing graph as an undirected weighted graph whose nodes represent users. Two users are connected by an edge if their interests as expressed by their recent activity are similar. In this paper, we consider users have similar interests if the intersection of their recent request sets is larger than some predefined threshold. The size of the intersection defines the edge weight. Formally, let U represent the set of users in a distributed system and R represent the set of resources to which the users have shared access. The set of resources requested by a user defines that user’s activity. In order to preserve time locality, we consider user activity within intervals of duration τ . Consequently, the activity
of user u during the interval T is the set RTu ⊂ R. Similarly, U T is the set of active users over T , that is, users who made requests for resources during interval T . The interest-sharing graph is an undirected graph defined as: GT = (U T , E T , wT )
(1)
An edge connects two users if the sets of requests the users made during T overlap. Formally, the set of undirected edges ET is defined as: E T = {(u, v)|(RTu ∩ RTv ) �= φ ; u, v ∈ U T ; RTu , RTv ⊆ R}
(2)
The degree of similarity between the activity of two users is represented by the edge weight function that measures the size of the intersection: wT : E T → N, wT (u, v) = |RTu ∩ RTv |
(3)
We note that other similarity criteria are possible, such as based on semantic knowledge. For example, users accessing different files with similar content can be recorded as an expression of similar interests. Also, different weight functions can be considered, such as the Jaccard Similarity Index [34]. For simplicity, in this study we chose the size of the intersection between sets of requested resources as the measure of the similarity between the interests of two users. In order to evaluate the small-world characteristics of these interest-sharing graphs along variable interest similarity criteria, we introduce a parameter μ in the edge definition: we consider an edge between two users if the edge weight is above the predefined threshold μ . Formally: EμT = {(u, v)||RTu ∩ RTv | ≥ μ ; u, v ∈ U T ; RTu , RTv ⊆ R}
(4)
where μ ∈ N∗ is a system-specific variable that can tune the degree of overlap in user interests. III. F OUR DATA -S HARING C OMMUNITIES We study the characteristics of the interest-sharing graph corresponding to four file-sharing communities: a high-energy physics collaboration (Section III-A), the Web as seen from the Boeing traces (Section III-B), and two peer-to-peer file-sharing systems— Kazaa as seen from a large ISP in Israel (Section III-C) and BitSoup, a BitTorrent-based community (Section III-D). This section gives a brief description of each community and its traces. In addition, we present the file popularity and user activity distribution for each of these traces as they have high impact on the characteristics of the interest-sharing graph: intuitively, a user with high activity is likely to map onto a highly connected node in the interest-sharing graph. Similarly, highly popular files are likely to produce dense subgraphs in the interest-sharing graph. TABLE I C HARACTERISTICS OF TRACES ANALYZED . System
Users
D0 Web Kazaa BitSoup
317 60,826 14,404 56,928
Requests All Distinct 2,757,015 193,686 16,527,194 4,794,439 976,184 116,509 N/A 6,298
Duration Traces 180 days 10 hours 5 days 15 days
3
1e+06
120000
100000
100000
# Requests
Number of requests
the 140000
80000 60000 40000
Distinct requests All requests
10000 1000 100 10
20000 0
1 0
20 40 60 80 100 120 140 160 180 Day
0
50
100 150 200 250 300 350 User Rank
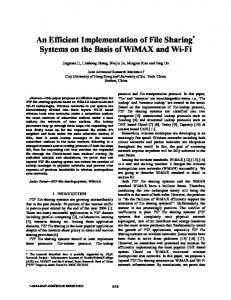
Fig. 1. D0 trace characteristics. Left: number of file requests per day. Center: the distribution of the number of file requests (total and distinct) made by users over the 6-month interval. Right: file popularity distribution.
800
B. The Web We use the Boeing proxy traces [12] as a representative sample for Web data access patterns. These traces represent a five-day record from May 1999 of all HTTP requests (more than 20 million requests per day) from a large organization (Boeing) to the Web. For the study of Web traces, we consider a user as an IP address. During the 10-hour interval we studied, 60,826 users sent 16.5 million web requests, of which 4.7 million requests were distinct. It is possible that multiple users had the same IP address (for example, due to DHCP reusing IPs or shared workstations). We do not have any additional information to help us identify these cases or evaluate their impact. However, given the relatively short intervals we consider in our studies—from 2 minutes to a couple of hours—the chances of multiple users using the same IP are small.
1e+06
700
100000
600 # Requests
The D0 Experiment [19] is a virtual organization of hundreds of physicists from more than 70 institutions in 18 countries. Its purpose is to provide a worldwide system of shareable computing and storage resources to mine Petabytes of experimental and simulated high-energy physics data. In D0 data files are read-only and typical jobs analyze and produce new, processed data files. Tracing system use is possible via a software layer (SAM [41]) that provides centralized data management. We analyzed logs from the first six months of 2002, amounting to about 23,000 jobs submitted by more than 300 users and involving more than 2.5 million requests for about 200,000 distinct files. A data analysis job typically makes requests for multiple files (117 on average for the traces we analyzed), an important data-usage pattern in itself, as this level of data co-usage calls for the redesign of traditional data-management techniques such as caching [31], [50], prefetching, and job reordering [20]. Figure 1 (left) shows the number of requests per day: the daily activity is relatively uniform, with a few significant peaks. User activity, however, is highly variable (Figure 1, center), with scientists requesting as much as tens of thousands of distinct files to as little as just a couple of files over the 6-month interval. In D0 file popularity does not follow the Zipf’s law typical of Web requests (Figure 1, right). The reason, we believe, is that data in this scientific application is more uniformly interesting: a typical job swipes a significant part of the data space in search of particular physics events.
# Requests per Second
A. The D0 Experiment: A High-Energy Physics Collaboration
500 400 300
10000 1000 100
200 10
100 0
1 30 40 50 60 70 80 90 100 110 120 130
0
Time (’000s)
20000
40000
60000
User rank
Fig. 2. Boeing web trace characteristics for a representative 10-hour interval. Left: Activity level (averaged over 15-minute intervals). Right: Number of requests per Web user.
C. The Kazaa Peer-to-Peer Network Kazaa is a popular peer-to-peer file-sharing system with over 3 million concurrent users in July 2006. Few details are publicly available about FastTrack, the protocol Kazaa uses. Kazaa nodes dynamically elect “supernodes” that form an unstructured overlay network and use query flooding to locate content. To search for content, regular nodes connect to one or more supernodes and pass them a compressed index of their content and the queries issued by users. Once content is located, data is transferred (unencrypted) directly from the provider peer to the requester using the HTTP protocol. In order to improve transfer speed, multiple file fragments are downloaded in parallel from multiple providers. Since control information is encrypted, the only accessible information can be obtained from the download channel. As a result, we can only gather information about the files that are actively downloaded. We had access to a five-day trace collected at a large ISP. During this interval 14,404 users generated 976,184 download requests for 116,509 distinct files. Users are identified based on their anonymized user ID that appears in the HTTP download request. The user population is formed of Kazaa users who are clients of the ISP: similar to the Boeing traces, these traces give information about a subset of all Kazaa users. Figure 3 presents the relevant characteristics of the Kazaa trace: activity level, user activity distribution, and file popularity distribution. A thorough analysis of the Kazaa traffic and details on trace collection are presented in [39]. D. The BitSoup Content-Sharing Community BitTorrent [10] is one of the most popular file-sharing protocols today and BitSoup [9] is one of the many communities built around it. A key element for a BitTorrent community is a web portal that aggregates information about each file published in
4
10000
10000 Request frequency
7 1000
6 # Requests
# Requests per pecond
8
5 4 3
100
10
2
1000
100
10
1 1
0 0
Fig. 3.
0
50 100 150 200 250 300 350 400 450 500 Time (’000 seconds)
3000
6000
9000
1 0 10
12000
10
1
2
3
10 10 10 Request rank
User rank
4
10
5
10
6
Kazaa trace characteristics. Left: Activity level (averaged over 100s). Center: Number of requests per user. Right: File popularity distribution.
the community. Information includes the list of shared files and the set of participating peers that are exchanging chunks of each file. To collect this data, we developed a simple HTTP crawler that collects every hour the information published to the BitSoup portal. The data set studied is over a 15-day period during February 2007. 1000
in Bitsoup. Additionally, Figure 5 highlights the influence of the time interval on the interest-sharing graph characteristics: a larger time interval captures more user activity and thus the potential for larger overlap in user interests, showed as edge weights. There is also significant difference in the activity intensity in the various communities, as presented in Section III: for example, in D0, a user makes on average 48 requests per day; in Kazaa, 13; and in the Web trace, 652.
1000
# Files
# Users
100
10
1 0 10
10000
1
2
3
10 10 User Rank
10
4
10
5
28 days 10000
1000
1 0 10
Weight
10
10
100000 7 days
100
1
10
2
10 File Rank
3
10
4
10
1000 100 100 10
10
1
Fig. 4. BitSoup trace characteristics. Left: User activity distribution: number of file downloads per peer. Right: File popularity distribution.
1 1
10
1
# Edges
10 # Edges
100
Fig. 5. The distribution of weights in D0 interest-sharing graphs for different time intervals τ . Left: τ = 7 days. Right: τ = 28 days.
Since our crawling mechanism records a snapshot of the community every hour, peers that join and leave between consecutive snapshots are not captured by the crawler. However, two observations suggest that our crawler captures a significant portion of the peer population. First, there is little variation in the population of peers across snapshots along the period of observed activity. Second, at any time, the majority of online peers are long-lived: Stutzbach et al. [62] find that more than 90% of the download sessions last more than one hour. Figure 4, left, plots the number of files each user downloads during the tracing interval: we note high heterogeneity in the user activity levels. Figure 4, right, shows the file popularity distribution, resembling a stretched exponential distribution as noted in other studies of Internet media traffic [29]. IV. S MALL -W ORLD I NTEREST-S HARING G RAPHS Based on the graph definition introduced in Section II (Eq. 1 and 4), we built and analyzed interest-sharing graphs from the traces recorded from the four communities described above. The choices of the similarity criterion threshold μ and the time interval τ are system and purpose specific, and thus they should be informed by workload characteristics and desired performance objectives. The distribution of edge weights in Figures 5 and 6 highlights the differences among the sharing communities in terms of user-interest overlap: the sharing in D0 and the Web is significantly more pronounced than in Kazaa and BitSoup, having edge weights with values in the order of hundreds or thousands in the first two, compared to under 10 in Kazaa and around 20
To test the intuition that, similar to scientific collaborations, we find small-world properties at the file-sharing level, we analyze the properties of the interest-sharing graphs. We consider the Watts-Strogatz definition [63]: a graph is a small world if it has a small average path length (similar to that of a random graph with the same number of nodes and edges) and a large clustering coefficient (much larger than that of a random graph with the same number of nodes and edges). The clustering coefficient is a measure of how likely it is that two neighbors of a node are also connected. According to one commonly used definition (Eq. 5), the clustering coefficient of a node u in a graph G(V, E) is the ratio between the number of existing edges and the maximum number of possible edges connecting its neighbors. The clustering coefficient of a graph is the average clustering coefficient over all |V | nodes in the graph (Eq. 6). CCu =
# edges between u’s neighbors Maximum # edges between u’s neighbors
(5)
1 CCu |V | ∑ u
(6)
CC1 =
An alternative definition (Eq. 7) directly calculates the clustering coefficient as a ratio between the number of triangles and the number of triples in the graph, where connected triples are trios of nodes in which at least one is directly connected to the other two.
5
10
10000
100
Weight
Weight
1000 Weight
100 8h 4h 1h
1 hour 30 min 15 min
10
10
1 100 101 102 103 104 105 106 107 108 # Edges
1
1 1
10
100
1000
10000 100000
1
10
100 1000 100001000001e+061e+07 # Edges
# Edges
Fig. 6. The distribution of weights in interest-sharing graphs for different time intervals τ . Left: weight distributions in Web interest-sharing graphs with τ = 1 hour, 30 minutes and 15 minutes, respectively. Center: weight distributions in Kazaa interest-sharing graphs with τ = 8, 4, and respectively, 1 hour. Right: weight distributions in BitSoup.
0.2
2 1.5 1 0.5 0
0
5
10
15 Week
20
25
0
30
5
10
15
20
25
30
Week
Fig. 7. Clustering coefficients (left) and average path lengths (right) of D0 interest-sharing graphs and their corresponding random graphs. Similarity criterion μ = 1 shared file over τ = 7 days.
(8)
The results show that the interest-sharing graphs for all four systems we study over different intervals τ and similarity criteria μ display small-world properties. Figures 7, 8, 9, and 10 present the average path lengths and the clustering coefficients for the observed interest-sharing graphs and for the corresponding2 random graphs. Each measurement corresponds to a snapshot of the traces taken during an interval T of duration τ : only the active users during that interval are considered. These measurements are performed over the entire period of our traces in order to analyze their evolution over time. In all cases and consistently over time, the interest-sharing graphs display a low average path length (close to that of the corresponding random graph) and a large clustering coefficient (significantly larger than that of the corresponding random graph). Table II presents the graphs characteristics inferred from all four communities for some combinations of values of parameters τ and μ . For large graphs for which measuring all-pair distances is computationally expensive, an accepted procedure is to measure it over a random sample of nodes [64]. Thus, we computed the average path length using a random sample of 5% of all node pairs for the larger Web interest-sharing graphs in Table II. We make a special note about the BitSoup results: the corresponding interest-sharing graph naturally exhibits large clustering coefficient as BitTorrent is designed to exploit the simultaneous 2 Corresponding graphs in this case refers to graphs with the same number of nodes and edges.
3.5 WWW, 10 files Random
Average Path Length
(9)
1 0.8 0.6 0.4 0.2
WWW,10 files Random
3 2.5 2 1.5 1 0.5
0
0 0
2
4
6
8 10 12 14 16 18 20 Interval (30 min)
0
2
4
6
8
10 12 14 16 18 20
Interval (30 min)
1
60 WWW, 100 files Random
0.8
Average Path Length
The average path length of a graph is the average over all distances. The average path length of an undirected random graph is: log(|V |) lr = log(|E|/|V |)
0.4
0.6 0.4 0.2 0
WWW,100 files Random
50 40 30 20 10 0
0
2
4
6
8 10 12 14 16 18 20 Interval (30 min)
0
2
4
6
8 10 12 14 16 18 20 Interval (30min)
Fig. 8. Clustering coefficients (left) and average path lengths (right) of web interest-sharing graphs and their corresponding random graphs. Similarity criterion μ = 10 and 100 shared requests, respectively, over τ = 30 minutes.
1
7 Kazaa Random
0.8
Average Path Length
2 × |E| |V | × (|V | − 1)
0.6
D0 Random
3 2.5
0
Clustering Coefficient
CCr =
3.5 D0 Random
0.8
Average path Length
The two definitions of the clustering coefficient simply reverse the operations—one takes the mean of the ratios, while the other takes the ratio of the means. The former definition tends therefore to weight the low-degree nodes more heavily, since they have a small denominator in Eq. 5. According to the definition from Eq. 5, the clustering coefficient for undirected random graphs is given by:
Clustering Coefficient
1
(7)
Clustering Coefficient
3 × Number of triangles on the graph Number of connected triples of vertices
Clustering Coefficient
CC2 =
0.6 0.4 0.2 0
Kazaa Random
6.5 6 5.5 5 4.5 4 3.5
0
2
4
6 8 10 8-hour interval
12
14
16
0
2
4
6 8 10 8-hour interval
12
14
16
Fig. 9. Clustering coefficients (left) and average path lengths (right) of Kazaa interest-sharing graphs and their corresponding random graphs. Similarity criterion μ = 2 shared requests over τ = 8 hours.
3.5 Average Path Length
BitSoup Random
0.8 0.6 0.4 0.2 0
BitSoup Random
3 2.5 2 1.5 1 0.5 0
0
5
10
15 12h
20
25
30
0
5
10
15 12h
20
25
30
interest of multiple users in the same file. As a consequence, as long as the design intuition of BitTorrent is confirmed, it is expected that multiple users will simultaneously participate in a file download. Their simultaneous interest in the same file will be reflected as a clique in the interest-sharing graph: all users interested in the same file will be connected to each other. What is not intuitive in this case is the average path length and the number of connected components of the interest-sharing graphs. Indeed, one would expect a large number of isolated cliques, each including the users interested in one file. Our results prove that the BitSoup community is well-connected, with a small number of disconnected components and a small average path length for the largest connected component, consistent with the results on our analysis of the other traces. Finally, we use the intution that small worlds are loosely connected collections of highly connected sub-graphs, as pictured by Watts-Strogatz [64], and make two significant observations. First, well-connected clusters exist; due to the interest-sharing graph definition, these clusters map onto groups of users with shared interests in files. Second, there is, on average, a small path between any two nodes in the interest-sharing graph: therefore, one could exploit this property, for example, to tune a floodingbased data dissemination mechanism to use a relatively small time-to-live, and still cover most of the graph.
V. I NVESTIGATING THE S OURCE OF S MALL - WORLD PATTERNS
Time Interval τ 7 days 7 days 28 days 28 days 2s 30 min 30 min 1 hour 8 hours 8 hours N/A
Similarity Criterion μ 1 100 1 100 1 1 100 1 1 3 1
#Connected Components 5 3 9 4 100 39 20 97 79 24 9
Largest connected component # Nodes # Edges CC1 CC2 35 142 0.741 0.648 20 88 0.773 0.743 107 757 0.716 0.641 78 438 0.706 0.763 1805 47256 0.786 0.634 6049 1866271 0.808 102 172 0.720 0.130 548 1690 0.740 0.593 3403 30555 0.652 0.473 56 78 0.442 0.178 17333 1675945 0.697 0.410 # Edges 153 95 777 441 47610 1866338 196 1937 31252 111 1675947
Fig. 10. Clustering coefficient (left) and average path length (right) for BitSoup interest-sharing graphs and their corresponding random graphs. Similarity criterion μ = 1 shared request over τ = 12 hours.
# Nodes 46 26 129 84 2076 6137 143 809 3608 111 17343
l 2.114 1.65 2.476 2.769 2.666 2.056 3.6 5.629 3.611 3.160 2.547
Random Graph CCr lr 0.238 2.538 0.463 2.021 0.133 2.388 0.145 2.524 0.029 2.296 0.102 1.519 0.033 8.851 0.011 5.599 0.005 3.705 0.050 12.148 0.011 2.135
Clustering Coefficient
1
System D0 D0 D0 D0 Web Web Web Kazaa Kazaa Kazaa BitSoup
TABLE II P ROPERTIES OF SAMPLE INTEREST- SHARING GRAPHS FOR THE FOUR COMMUNITIES STUDIED OVER VARIOUS TIME INTERVALS τ AND DIFFERENT SIMILARITY CRITERIA μ . CC1 IS THE AVERAGE MEASURED WATTS -S TROGATZ CLUSTERING COEFFICIENT (E Q . 5), CC2 IS THE AVERAGE MEASURED CLUSTERING COEFFICIENT DEFINED IN E Q . 7; CCr IS THE WATTS -S TROGATZ CLUSTERING COEFFICIENT OF RANDOM GRAPHS (E Q . 8); l IS THE AVERAGE OF MEASURED AVERAGE PATH LENGTH AND lr IS THE AVERAGE PATH LENGTH OF EQUIVALENT RANDOM GRAPHS (E Q . 9)
6
Given the diversity of our data sample, we could perhaps conjecture that the interest-sharing graph of any data or resourcesharing community is small-world. We need, however, to verify that the small world property of the graph is indeed an independent characteristic of these graphs – and driven by user choices of file usage – rather than an indirect consequence of the macro properties of the graph or of the traces. To this end, we address the following question: Q3 Are the small-world properties of the interest-sharing graphs a consequence of user preferences in data? Or are they a consequence of the graph definition or workload characteristics that can be decoupled from user preferences? We explore two separate directions to help us answer this causality question. In Section V-A we focus on the definition of the interest-sharing graph and question the large clustering coefficient as a natural consequence of the graph definition. In Section V-B we analyze the influence of file access patterns such as time locality and file popularity distribution.
7
A. Affiliation Networks An affiliation network (also called “a preference network”) is a social network in which the participants (actors in sociology terminology) are linked by common membership to groups. Examples include scientific collaboration networks (in which actors belong to the group of authors of a scientific paper), and movie actors (in which actors belong to the cast of the same movie). Affiliation networks are therefore bipartite graphs: there are two types of vertices, for actors and respectively groups, and edges link nodes of different types only (Figure 11, left). Affiliation networks are often represented as unipartite graphs of actors joined by undirected edges that connect actors in the same group. Therefore, the interest-sharing graph with the similarity criterion μ = 1 (one request in common) is such a one-mode projection of a bipartite affiliation network (Figure 11, right). A B
G
C
D
g0 (x) =
(10)
M
∑ qk xk
(11)
k=1
G0 (x) = f0 (g 0 (x)/g 0 (1))
(12)
The average degree for the actors’ one-mode projection of the affiliation network is: AvgDegree = G 0 (1)
(13)
And the clustering coefficient (as defined in Eq. 7) is: C=
E
N
∑ p jx j
j=1
n
E F
B
f0 (x) =
m
C D
A
order to easily compute the average node degree and the clustering coefficient of the unipartite affiliation network, Newman et al. use three generating functions f0 , g0 , and G0 defined below. Function G0 is the generating function for the number of neighbors of an actor in the unpartite projection of the affiliation network generated by f0 and g0 .
F
M g
0 (1) N G
0 (1)
(14)
p G
10000
1e+06 Users
Files
1000
Node Degree
Fig. 11. A bipartite network (left) and its unipartite projection (right). Users A-G access files m-p. In the unipartite projection, two users are connected if they requested the same file.
Node Degree
100000
100
10000 1000 100
10 10
These one-mode projections of bipartite graphs have particular characteristics. Most relevant to this discussion is the clustering coefficient: inherently, the clustering coefficient is larger in these graphs than in random graphs of the same size, since the members of a group will form a clique in the one-mode projection. Consequently, our comparison with random graphs, although faithful to the Watts-Strogatz definition of small worlds, may be misleading. Thus, there are two possible sources of bias in our analysis: one is that the implicitly large clustering coefficient may be a consequence of the unimodal projection, as just shown. Another is that the degree distribution of the interest-sharing graphs which, as in many other real networks, is far from the Poisson distribution of a random graph, may lead to a higher clustering coefficient and low average path length. To test these conjectures we compare the properties of our interest-sharing graphs with those of random graphs with a given degree distribution (rather than the Poisson distribution of the random graphs constructed by the traditionally used Erd˝os-R´enyi model). We use the model proposed by Newman et al. [48], [49] adapted to affiliation networks and deduce a set of parameters of their unimodal projections. We use this theoretical model to estimate the clustering coefficient of unimodal projections of random affiliation networks with the size and degree distributions implied by our traces and compare these clustering coefficients with our empirical results from the same traces. In a bipartite affiliation network, there are two degree distributions: of actors (how many groups does an actor belong to) and of groups (how many actors does a group contain). Let us consider a bipartite affiliation graph of N actors and M groups. Let p j be the probability that an actor is part of exactly j groups and qk the probability that a group consists of exactly k members. In
1
1 1
10
100 1000 # Nodes
10000 100000
1
10
100 # Nodes
1000
10000
Fig. 12. Degree distribution of user (left) and file (right) nodes of a bipartite affiliation network corresponding to a half-hour interval in the Web traces.
Figure 12 presents the degree distribution p and q in a Web interest-sharing graph with τ = 30 minutes and with similarity criterion μ = 1. Using this distributions, we compare the measured and modeled graph metrics. Table III shows significant difference between the values of observed and analytically-modeled clustering coefficient and average node degree. The measured clustering coefficient is up to three orders of magnitude larger than the modeled coefficient. This result proves that the large clustering coefficient is not due to the definition of the interest-sharing graph as a onemode projection of an affiliation network with non-Poisson degree distributions. The observed average degree is always smaller than predicted by the Newman model, in some cases (e.g., D0) by three orders of magnitude. An intuitive explanation for this is that user requests for files are not random: individual user preferences are concentrated on a limited set of files. This small set of files will connect the user with a small set of other users in the interestsharing graph, which explains the actual average degree being much smaller than predicted. A second observation leads to a possible metric for sharing intensity: we can obtain a measure of data sharing intensity in the four communities by comparing their clustering coefficients and average node degrees with those predicted by the theoretical model. We see that the Kazaa interest-sharing graphs are the closest to the theoretical model and the D0 graphs are very different from their corresponding model. This is different from
8
the comparison with the Erd˝os-R´enyi random graphs (Table II), where the Kazaa community seem to be “more of a small world” than the D0 community (the ratio between the clustering coefficients of the interest-sharing graph and the corresponding Erd˝os-R´enyi random graph was much higher in the case of Kazaa). The cause of this difference and the significance of this observation remain to be studied in the future.
(4)
(1)
User
(3)
Time
(5)
(2)
Request
B. User Behavior vs. Popularity Distribution and Locality Some workload characteristics have been shown to be widespread across various systems. Two such characteristics are relevant for our context: event frequency distributions (e.g., popularity distributions) and locality. Event frequency has been shown to follow a Zipf distribution in many systems, from city population to the popularity distribution of web pages. More recent studies showed that the popularity of Internet media files is departing from the traditional Zipf distribution [28]. But be it Zipf, Weibull, stretched exponential, or others, the agreed-upon model is that a few files are highly popular while most of them are infrequently requested. This behavior is apparent in two of the four cases we analyze: the Web [13] and Kazaa (Figure 3). Time locality implies that individual items are more popular during a limited interval, behavior evident in our traces (for example, see [32] for a detailed study of the DZero traces). Additionally, the temporal analysis of user activity shows that users are not uniformly active, but their activity follows daily and weekly patterns (for example, downloading more music files during weekends or holidays [54]). Thus, we ask: Q4 Are the properties we identified in the interest-sharing graph, especially the large clustering coefficient, an inherent consequence of these well-known usage patterns? To answer this question, we generate synthetic traces from the real workloads in such a way as to preserve the real popularity distributions, time locality, and the temporal distribution of user activity, but to break the user-request association. We build interest-sharing graphs from these synthetic traces and compare their properties with those resulting from the real traces. The intuition driving these experiments is the following: if the characteristics of the real and synthetic interest-sharing graphs are similar, then these characteristics are a direct consequence of (some of) the properties we preserve across all traces, real and synthetic. If the characteristics are different, then they reflect a usage pattern not modeled by these traditionally analyzed characteristic. We believe this usage pattern reflects user interests in a focused group of items. 1) Generating Synthetic Traces: The core of our traces is a triplet of user ID, item requested, and request time. Figure 13 identifies the following correlations in traces, some of which we want to preserve in the synthetic traces: (1) User–Time: User’s activity varies over time: for example, in the D0 traces, some users accessed data only in May. (2) Request–Time: Items may be more popular during some intervals: e.g., news sites are more popular in the morning. (3) User–Request: Users request data of their interest and not randomly. This is the key to user’s preferences. By breaking this relationship and randomly recreating it, we can analyze the effect of user preferences on the properties of the interest-sharing graph.
(6)
Fig. 13. The relations between users, their requests, and their request times determine observed patterns like Zipf frequency of requests or time locality.
(4) User activity: The total number of items requested by a user may be relevant, as some users are more active than others (see Figure 2, right for the Web traces). (5) Time: The time of the day (or in our case, of the periods studied) is relevant, as the Web traces show (the peak in Figure 2, left). (6) Request popularity: specifies the number of requests for the same item. The core idea of our trace generation is to dissociate users from their requests while preserving the other usage patterns. One can picture a trace as an R × 3 matrix, in which R is the number of requests in that trace and the three columns correspond to users, files requested, and request times, respectively. Now imagine that we shuffle the users column while the other two are kept unchanged: this breaks relations (3) and (1). If the requests column is shuffled, relations (3) and (2) are broken. If both user and request columns are shuffled, then relations (1), (2), and (3) are broken. In all cases, (4), (5), and (6) are maintained faithful to the observed behavior: that is, users ask the same number of requests (4); the times when requests are sent remain the same (5); and requests preserve their observed popularity (6). We thus generated the following synthetic traces: ST1: Removes the relations between users and the time they make requests, and the requests and the times they were made, but preserves request popularity, user activity patterns, and the distribution of requests over time: thus, break relations (1), (2), and (3). ST2: Maintains the request times as in the real traces: breaks relations (1) and (3). ST3: Maintains the user’s activity over time as in the real traces: breaks (2) and (3). 2) Properties of Synthetic Interest-sharing Graphs: Two sets of characteristics of the synthetic interest-sharing graphs are relevant to our study. First, their basic graph properties (size, edge weights distribution, and number of connected components) are significantly different from their corresponding real graphs (“corresponding” in terms of the similarity criterion used). Second, the topological properties—especially the small-world characteristics—are less pronounced than in the observed traces. Three basic graph properties are different: the size of the largest connected components, the number of connected components, and the edge weight distribution. On one hand, for low similarity thresholds (Figure 14, left), the synthetic interest-sharing graphs for which user activity in time (relation (1)) is not preserved have a significantly larger number of nodes. Even when user activity
9
TABLE III P ROPERTIES OF INTEREST- SHARING GRAPHS , MEASURED AND MODELED AS UNIMODAL PROJECTION OF AFFILIATION NETWORKS . C LUSTERING COEFFICIENT ARE MEASURED USING E Q . 7 AND MODELED USING E Q . 14
Web Kazaa BitSoup
Users 74 151 3385 6757 1629 2497 17343
Files 28638 67742 39423 240927 3393 9224 4934
Clustering Model Measured 0.0006 0.65 0.0004 0.64 0.046 0.63 0.016 0.55 0.60 0.30 0.48 0.23630 0.697
in time is preserved (as in the ST3 case), the number of nodes is larger: this is because in the real interest-sharing graphs, we ignored the isolated nodes and in the synthetic graphs there are no isolated nodes. On the other hand, for high similarity thresholds (e.g., 100 shared files in the D0 case, Figure 15), the synthetic graphs are much smaller or even disappear in a cloud of singleton nodes. This behavior is further revealed by the distribution of weights in the synthetic graphs (Figure 14) compared to the real graphs (Figure 5): the synthetic graphs have many more edges with small weights. The median weight in the real D0 interestsharing graphs is 356 and the average is 657.9, while for synthetic graphs the median is 137 (185 for ST3) and the average is 13.8 (75.6 for ST3). We also note that the synthetic interest-sharing graphs are always connected, unlike the interest-sharing graphs built from real traces, that always have multiple connected components, as shown in Table II. This behavior is due to the uniform distribution of requests per user in the case of synthetic traces, which is obviously not true in the real case. What these experimental results show is that the synthetic traces diffuse the concentration of interest sharing and distribute it more evenly across the node population. 1000
7 days, ST3 1000
Weight
100
Real ST1 ST2 ST3
1.6 1.4 1.2 1 0.8 0.6 0.4 0.2 1
2
3 4 5 6 Clustering coefficient ratio
7
Fig. 16. Comparison of the small-world interest-sharing graphs as resulted from the real and synthetic D0 traces.
100
VI. E XPLOITING THE S MALL - WORLD INTEREST- SHARING G RAPH : A C ASE S TUDY
10 10
1
1 1
10
100 # Edges
1000
10000
1
10
100
1000
# Edges
Fig. 14. Distribution of weights in the synthetic interest-sharing graphs built from shuffling the D0 traces.
300
60
250
50
200
Nodes in graph
Nodes in graph
1.8
These results show that user preferences for files have significant influence on the interest-sharing graphs: their properties are not induced (solely) by user-independent trace characteristics.
10000 7 days, ST1
Average degree Model Measured 1242.5 3.3 7589.6 6.0 50.0 22.9 1453.1 304.1 2.9 2.4 9.5 8.7 210.48 193.33
The topological properties of the synthetic interest-sharing graphs are also different. The synthetic graphs are generally “less” small world than their corresponding real graphs: the ratio between the clustering coefficients is smaller and the ratio between average path lengths is larger than in real interest-sharing graph (Figure 16). However, these differences are not major: the synthetic interest-sharing graphs would perhaps pass as small worlds.
Avg. path length ratio
D0
Interval 7 days 28 days 2 min 30 min 1h 8h N/A
ST1 ST2 ST3 Real
150 100 50
ST1 ST2 ST3 Real
40 30 20 10
0
0 0
5
10
15
20
7-day interval (1 common request)
25
0
5
10
15
20
25
7-day interval (1000 common requests)
Fig. 15. Number of nodes in interest-sharing graphs in real and synthetic D0 traces
The interest-sharing graph and its properties introduce a novel way to analyze data-sharing communities: instead of analyzing individual user behavior, this approach looks at implicit relationships that form among individuals based on shared interest. The small-world characteristics highlighted using this approach suggest that adaptive divide-and-conquer strategies have the potential to operate efficiently in large-scale data-sharing communities. Specifically, we propose to organize the nodes of a distributed system by mapping the interest-sharing graph onto an overlay topology. If the small-world properties of the interest-sharing graph are preserved, then such an overlay will be a loose collection of dense subgraphs with high clustering coefficients, thus preserving high interest locality. We propose to identify these dense subgraphs (or clusters) and run problem-specific components independently or in a loosely connected fashion in each of them, thus improving overall system scalability.
10
This section proposes an overlay construction algorithm that connects nodes with similar interests (Section VI-A); and a graph partitioning heuristic that identifies densely connected clusters of nodes (Section VI-B). These two algorithmic components are general to any problem that aims to exploit the interest-sharing graph and its small-world topology in this divide-and-conquer manner; the main challenge they have to overcome is building the overlay and identifying the clusters without making use of global information. We note that there are other ways to exploit the small-world properties of a interest-sharing graph-like structure, as presented in [17] and discussed in Section VII. We connect these two algorithmic components in a dynamic and adaptive information dissemination technique (Section VI-C), that we call interest-aware, as it exploits the implicit interestlocality within the identified clusters to disseminate relevant information. Experimental results based on simulations using real workloads show that this approach leads to significant performance improvements (Section VI-D). A. Overlay Construction The overlay construction component builds the interest-sharing graph in a decentralized, adaptive manner: it allows nodes with similar interests to identify each other without requiring global knowledge or centralized components. Consistent with the definition of the interest-sharing graph, we use a system model in which nodes submit requests for resources. A node can represent a user, or, more generally, a group of users with shared interests (such as a department or a research group within an institution). In order to reflect the realistic topology of an interest-sharing graph, the set of requests each node in the overlay generates must represent a specialized set of interests. In contrast, nodes with random interests would most likely lead to a topology closer to that of a random projection of a bipartite graph than to a small-world graph, thus making the partitioning into dense subgraphs less reflective of common interests. We propose a solution that uses resource providers (i.e., the data storage nodes) as rendezvous points for users interested in the same data. Figure 17 illustrates this scenario in a filelocation context: node A learns from a file location mechanism where file F is stored. When A fetches file F from N, N will record A’s interest in its file and the access time. If user B then fetches the same file within a time window τ , N informs B about A’s interest in the same file F. Thus, B can contact A if it is interested in connecting to new peers and if A’s interests satisfy B’s interest similarity criterion. For example, B may choose to contact A only if more than μ common files have been requested within an interval τ . The value μ can be adapted by each node independently to satisfy local constraints, such as the number of connections or better interest overlap. This approach allows for true adaptability to node heterogeneity relating, for example, to communication capabilities or high load/reduced processing power. Because nodes are both resource providers and users, as typical of peer-to-peer and grid computing contexts, the algorithm is fully decentralized. B. Decentralized Graph Partitioning Once the overlay that mirrors the interest-sharing graph is in place, nodes need to identify the group to which they belong. Given the dynamics of a potentially large distributed system with
Fig. 17. Overlay construction: (1) Node A requests file F; (2) A learns that F is stored on node N; (3) A contacts N to fetch file. N logs A’s request and time; (4) Node B requests file F; (5) B learns that F is stored on node N; (6) B contacts N to fetch F; (7) N sends the relevant log with latest requests for file F; (8) B initiates dialog with A
intermittent participation and changing interests, it is unrealistic to assume accurate (or even the availability of) global knowledge about the overlay topology. The challenge is, thus, to design a decentralized graph partitioning algorithm that can be independently run by each node and requires only local information. We consider a simple, fully decentralized approach where nodes investigate their neighborhood independently of each other and label edges in the overlay as long or short. A short edge will connect either neighboring nodes that form a triangle or a node with degree of one to the rest of the graph. All other edges are labeled long. Figure 18 gives an example of the outcome of the labeling algorithm. While other definitions for long/short labels are also possible, this triad labeling captures a key principle in sociology called “triadic closure” [52]: links are much more likely to form between two people when they have a friend in common. Similarly, the small-world topology dictates that nodes connected to the same node will likely connect to each other. Long edge
Short edge
Fig. 18. Triad labeling: edges in triangles and dead-ends are considered short, while the others are considered long.
Graph partitioning can then be performed in a fully decentralized manner by “removing” long edges. The result is a collection of dense subgraphs where nodes are connected by short edges. Resilience to node churn can be improved through gossip-based membership protocols [26] that allow nodes to learn about distant nodes in the cluster. C. Case Study: Information Dissemination for Locating Files The two algorithmic components just presented—overlay construction and graph partitioning—are general building blocks for solutions that exploit the small-world characteristics of resourcesharing communities as shown by the analysis of the interestsharing graph. To complete our proof-of-concept, we propose an information dissemination mechanism that takes advantage of the small-world structure of the interest-sharing graph. More specifically, the proposed information dissemination mechanism uses autonomically-inferred clusters of interest (corresponding to
11
the interest-sharing overlay partitions) to disseminate information of interest. We place this information dissemination mechanism in the context of file location such that we can run meaningful experiments on the same set of traces as the ones we analyzed. In such a context, disseminating information in clusters of shared interest can be used to ease the load on a centralized file location service or to reduce the latency in a fully decentralized solution. In the context of file location, our generic solution needs to be instantiated in two respects: the information to disseminate and the performance metrics. We disseminate the locations of files retrieved in the previous interval τ and we measure hit rate. File location information is disseminated via gossip protocols [36]. Gossip messages will be sent by a node only along its short edges. The information disseminated via gossip includes information about the source and the destination for the downloads and the files retrieved during the past interval τ . The destination node contributes to building the membership information (as mentioned earlier in this section) and will always be a node in the current cluster, since gossips propagate only along short edges and a set of nodes connected only via short edges forms a cluster. The source node specifies which node stores the list of files downloaded and can be from outside the current cluster, depending on what files are advertised: nodes may advertise their own files as well as remote files of which they learned recently. The list of files can be compressed using Bloom filters [11] or left uncompressed to support key-based filename matches. We stress that the goal of analyzing a file location service is purely to illustrate the value in exploiting the observed smallworld characteristics in the implicit interest-sharing graph based on the same real workloads we analyzed. Indeed, there are numerous alternative decentralized file location solutions [42] proposed for large-scale distributed systems, and it is not our intent to claim innovation in this area. A more detailed description of the algorithms we propose is presented in [33]. D. Proof-of-Concept: Experimental Evaluation The traditional performance metric in proactive information dissemination is hit rate, defined as the percentage of requests can be served from proactively disseminated information. In the context of file location, the higher the hit rate, the lower the search time and the communication costs (since a hit is served using locally available information). The costs in proactive information replication are storage and communication. 1) Experimental Setup: We present our experiments on two of the sets of traces described above: D0 and Kazaa (the corresponding results on the Web traces are presented in [30]). For each set of traces we consider multiple instances of interest-sharing graphs (i.e., for various values of the time interval τ and the similarity criterion μ ). The two communities behave differently in terms of the number of files shared: while in D0 there are hundreds of files shared between two users, in Kazaa this number is most often close to 1. From the family of interest-sharing graphs we analyzed, we thus selected μ = 100 for D0 and μ = 1 for Kazaa as representative examples. The time interval τ varies between 3 and 28 days for D0 and 1 and 8 hours for Kazaa. Our simulator works as follows: for each graph definition, we build the interest-sharing graph for the interval τ and “freeze” it at the end of the interval. We then apply the triad labeling technique to identify clusters of interest and disseminate information within clusters along the short edges. We disseminate the location of files
requested (and, we assume, discovered) in the previous interval. We measure the hit rate: the percentage of queries sent during an interval τ that can be answered from the information disseminated in the previous interval. The hit rate resulted from our experiments is a lower bound for the performance of a real implementation because of two simplifications in our simulator. First, we do not cache data for more than one interval τ to account for the volatility of the system: nodes unpredictably join and leave the system, files can be added and removed, users change their interests over time, and consequently the overlay and the clusters may change frequently to adapt to these changes. Second, our simulator updates the overlay at time increments of duration τ . In a real implementation the overlay adjusts to user behavior smoothly over time. This will likely lead to better hit rates, since the overlay and clusters adapt faster to changing in user interests. The results presented in the following are based on the assumption that all requests are answered within the interval in which they are asked. This assumption is perfectly supported in a hybrid scenario in which information dissemination within clusters is used to reduce the load on an index service or for large τ . 2) The Benefits of Interest-Aware Information Dissemination: Figure 19 shows the average hit rate for different interest-sharing graph definitions. The benefits of disseminating information in D0 are significant: more than 50% of queries can be answered from the information disseminated within the previous interval. In terms of file location performance, this means that 50% of queries do not impose any costs on the network or on a potential centralized service and their response latency is that of a local lookup. The decrease of the hit rate with the increase in time interval can be explained by a stronger time locality in scientific communities, as shown in [32]. In order to distinguish between the effects of local caching (that is, remembering the locations of files discovered during previous τ ) and the effects of information dissemination, we evaluate the impact of local caching. Caching has an impact when the same user makes the same requests in consecutive intervals: the later requests can therefore be answered from the local cache. However, the percentage of requests of this sort is low: up to 15%, with averages between 5% and 10% for different intervals in D0. Although it is conceivable that scientists repeat requests for the same data to run their computations, it is less intuitive that a Kazaa user repeats requests for same music at intervals of one hour: surprisingly, Kazaa users show the same behavior, with average cache-hit rates around 7%. This behavior may be explained by unsatisfactory downloads: files that were not downloaded properly or were corrupted. In Kazaa the hit rate is constantly high (around 70%) for all durations, in spite of the decrease in the user’s cached repeated requests (from almost 8% for 1-hour to 5.5% for 8-hour intervals). Finally, we note that triad labeling leads to clusters with highly variable sizes in both traces. The resulting unbalanced clusters are expected: finding an optimal balanced partition is NP-hard, and approximate almost-balanced partitions known to date require full knowledge of the graph [5], [22]. Because the performance and cost of gossip-based dissemination protocols within clusters depends on cluster size, we isolate in Figure 19 the average hit rate from the average hit rate when the positive3 effects of the 3 The larger the cluster, the more information to share and thus the larger the chance of finding the answer to a query.
12
largest cluster are ignored. In both systems, the influence of the largest cluster increases with duration: for example, in Kazaa the hit rate due to the largest cluster varies from 13% for 1-hour to 44% for 8-hour intervals. 100
100 Without LC Local Answers (%)
Local Answers (%)
Without LC 80 60 40 20 0
80 60 40 20 0
3
7
10
14
21
28
Time Interval (days)
1
4
8
Time Interval (hours)
Fig. 19. Hit rate with experience dissemination in D0 (left) and Kazaa traces (right). Dashed lines show hit rate when the effect of the largest cluster obtained with the triad clustering method is ignored. Full lines show hit rate averages over all clusters (including the largest).
3) The Costs of Information-Aware Information Dissemination: The price for the increased hit rate is the increased dissemination cost and the additional storage required for the information disseminated. Table IV presents these costs: the storage space required per node is a function of the number of files disseminated within a cluster; communication cost per node depends on the number of files disseminated within the cluster and the size of the cluster. Both costs are modest and practical for today’s systems. TABLE IV D ISSEMINATION COSTS IN D0 AND K AZAA ( ASSUMING A PAIR FILENAME – LOCATION IS 300 BYTES ON AVERAGE ). Trace (μ ) D0 (100)
Kazaa (1)
τ 3 days 7 days 10 days 14 days 21 days 28 days 1 hour 4 hours 8 hours
Storage/node # Filenames MB 8787 2.6 18182 5.2 24912 7.1 32239 9.2 44911 12.8 56924 16.3 1345 0.3 5303 1.5 10178 2.9
MB/node sent during τ 4.66 11.36 18.05 25.40 42.47 58.10 0.6 5.2 15.0
Given the gossip-based information dissemination mechanisms used, the communication costs are estimated by multiplying storage costs with the natural logarithm from the number of nodes in cluster. (This is because each message needs to be gossiped to approximately ln(N) peers in cluster to ensure the message will reach all N members [36]). Consequently, communication costs are low: 4.6MB of data transmitted per node in a 3-day interval, growing to 58MB for the 28-day interval case. These results are averaged over all participating peers, including the largest cluster. 4) Summary: To summarize, the benefits of disseminating experience within clusters identified with triad labeling from the interest-sharing graph topology are significant for both communities, ranging from 40 to 70% of the queries being answered locally. Also, even after eliminating the optimistic effects of the largest cluster, the hit rate is between 30% and 65%. Shorter time intervals for the interest-sharing graph are preferable to keep costs down. Interestingly, the average hit rate over all clusters (except the largest one) is higher for shorter intervals due to more focused interests, thus recommending a smaller value for τ . To isolate the effects of interest-aware information dissemination from those of general information dissemination, we
performed the same experiments by disseminating data in random groups with the same number of users as resulted from triad labeling. This setup maintains the same storage and communication costs. We measured again the hit rate due to information dissemination. The results differ drastically from the results presented in Figure 19: with random clustering, the average hit rate is under 5% for both D0 and Kazaa traces when the largest cluster is ignored. Even for the largest cluster alone the hit rate with random grouping is significantly lower than in the triadlabeling experiments (10–30%). These results clearly differentiate the benefits of information dissemination from the benefits of interest-aware information dissemination. VII. R ELATED W ORK The idea of exploiting interest for structuring peer-to-peer overlays has been addressed in various works. In [51] each peer keeps track of the peers who responded to its requests and moves closer to them in the overlay. Khan and Tokarchuk propose in [38] a set of mechanisms for building an overlay where super-peers are managing communities of peers with the same explicitlydeclared interest. Our approach is to infer overlapping interest from requests instead of requiring peers to subscribe to interest categories that might be too general in some instances. Cohen et al. [18] propose another approach to build unstructured overlays: nodes connect to other nodes that store the same data, in an attempt to adapt the market-basket idea to P2P. This approach assumes that a relationship exists among the files stored on a node: users do not store random things on their disks. Our study presents evidence that there is a relationship among what data users consume: users do not ask for random data items, but their consumption patterns present clear small-world patterns. Khambatti et al. proposed a set of algorithms for community formation and discovery [37] in a distributed fashion similar to the mechanisms we propose in Section VI. Their solution requires a set of attributes specified for each peer that can be used to infer community structures. Santos-Neto et al. [57] demonstrate the effectiveness of exploiting the interest-sharing graph in tagging communities to predict user behavior. In this context, two users are linked in the interestsharing graph if they display similar tagging activity over time. A graph somewhat similar to the interest-sharing graph is analyzed in a recent study [17] on YouTube data: related videos posted on YouTube are connected via hyperlinks. This resulting graph is shown to be small world. Similar to the solution proposed in [60] for adding shortcuts in Gnutella, a peer-to-peer solution for video sharing is proposed in [17] that assumes that past downloaders become data providers. This approach leads to densely connected swarms on top of which an indexing and a prefetching mechanism are proposed. Some recommender systems have a similar flavor to the interest-sharing graph. ReferralWeb [35] attempts to uncover existing social networks to create a referral chain of named individuals. It does this by inferring social relationships from web pages, such as co-authorship, research groups and interests, coparticipation in discussion panels, etc. This social network is then used to identify experts in particular fields and then guide web searches toward the pages closer to these experts’ pages. The emergence of large-scale collaborative systems such as peer-to-peer networks inspired many trace characterization efforts that significantly contributed to the understanding of user behavior
13
and its consequences, from free riding behavior [2] to caching opportunities [58], [59] and the network properties of the Gnutella overlay [54], [61]. We note that our analysis of the graph topologies are not aimed to the overlay topology but rather to the implicit relationships that form among users due to common interests. Other efforts have been directed to identifying locality of interests based on overlapping content stored by peers [24], [25] or on semantic information inferred from content processing [40]. VIII. S UMMARY This article reveals the existence of pattern across diverse datasharing communities, from scientific communities to the Web and file-sharing peer-to-peer systems. This pattern is brought to light by a structure we introduce: the interest-sharing graph. This structure captures the implicit relationships that form between users who are interested in the same files. We present the properties of the interest-sharing graphs inferred from four communities. These properties are relevant to and might inspire the design of a new style of mechanisms in peer-to-peer systems, mechanisms that take into account, adapt to, and exploit user behavior. We also present an information dissemination mechanism that builds online the interest-sharing graph dynamically and in a decentralized fashion and exploits its small-world properties to infer communities with shared interest. For consistency with our trace analysis, we used the same traces to evaluate this approach. This required us to instantiate the information dissemination mechanism as a file location problem: given a filename, the system should return the location(s) of files with that name. The information dissemination approach we propose disseminates file locations and satisfies up to 70% of future requests. Other problems in distributed systems can take advantage of the interest-sharing graph structure and its properties. For example, in a distributed mutable data-sharing system, keeping track of which peers recently requested a data item allows for the selective propagation of updates in a fully decentralized, self-organizing fashion. Because users who recently accessed the same data item(s) are neighbors in the interest-sharing graph, the timely propagation of file update notifications, as well as efficient groupings of writing operations by the same user to multiple files are facilitated. A related idea is explored in [55] by maintaining independent file-replica chains. Another example is designing dynamic data replication techniques adaptive to usage patterns that insure data availability and access performance. In particular, the topology of the interestsharing graph suggests where to place replicas closer to the nodes that access them. Similarly, the idea can be exploited in a dynamic distributed storage context: if files cannot be stored entirely on a node, then they can be partitioned among nodes interested in the same file, i.e., neighbors in the interest-sharing graph. However, in such cases the size of the files to be transferred becomes an important design parameter. A third way to exploit the interest-sharing graph is for dataintensive job scheduling. Data-intensive job scheduling is a significant challenge in scientific communities, and it is often expressed as the dilemma of moving data to computation vs. finding computation close to the data. In a decentralized architecture with distributed knowledge, the relationships between users who requested the same files can be exploited for job management. If nodes store and share recently downloaded files, they will become good candidates for running jobs that take those files as
input. This can be used for scheduling, migrating or replicating data-intensive jobs and is implicitly suggested by Santos-Neto et al. [56] and Briquet et al. [14]. The relatively diverse set of communities we explore and long time interval of the traces we analyze give a historical perspective on a rapidly evolving field: When our initial study began, Kazaa was one of the most popular peer-to-peer networks. Meantime, a radically different approach has been promoted by BitTorrent, who managed to decisively enter the domain of software and movie distribution. Scientific communities such as DZero continue to operate and to grow in scale, tackling ever more impressive challenges and posing more challenging problems in data management. The Web is moving towards the new Web 2.0 family of applications. Yet, it appears that the smallworld pattern in data sharing is a representative characteristic that stands time and solutions. ACKNOWLEDGMENTS We are grateful to Ruth Pordes and Gabriele Garzoglio of Fermi National Accelerator Laboratory for facilitating access to the D0 traces, to Nathaniel Leibowitz for the access to the Kazaa traces, and to Nazareno Andrade who helped with the BitSoup data collection. Adriana Iamnitchi was partially supported under NSF grant CNS-0831785. R EFERENCES [1] J. Abello, P. Pardalos, and M. Resende, “On maximum clique problems in very large graphs,” DIMACS Series on Discrete Mathematics and Theoretical Computer Science, vol. 50, pp. 119–130, 1999. [2] E. Adar and B. A. Huberman, “Free riding on Gnutella,” First Monday, vol. 5, no. 10, 2000. [3] W. Aiello, F. Chung, and L. Lu, “A random graph model for massive graphs,” in The 32nd Annual ACM Symposium on Theory of Computing, 2000, pp. 171–180. [Online]. Available: citeseer.nj.nec.com/article/aiello00random.html [4] R. Albert and A.-L. Barab´asi, “Statistical mechanics of complex networks,” Reviews of Modern Physics, vol. 74, pp. 47–97, 2002. [5] S. Arora, S. Rao, and U. Vazirani, “Expander flows, geometric embeddings and graph partitioning,” in STOC ’04: Proceedings of the thirtysixth annual ACM symposium on Theory of computing. New York, NY, USA: ACM, 2004, pp. 222–231. [6] A.-L. Barab´asi, Linked: The New Science of Networks. Perseus Publishing, 2002. [7] A.-L. Barab´asi, R. Albert, and H. Jeong, “Scale-free characteristics of random networks: The topology of the World Wide Web,” Physica A, vol. 286, pp. 69–77, 2000. [8] P. Barford, A. Bestavros, A. Bradley, and M. Crovella, “Changes in web client access patterns characteristics and caching implications,” Boston University, Tech. Rep. BUCS-TR-1998-023, 1998. [9] BitSoup, “Bittorrent community,” http://www.bitsoup.org, 2007. [10] BitTorrent, http://www.bittorrent.com. [11] B. Bloom, “Space/time trade-offs in hash coding with allowable errors,” Communications of the ACM, vol. 13, no. 7, pp. 422–426, 1970. [12] “Boeing proxy logs,” ftp://researchsmp2.cc.vt.edu/pub/boeing/boeing.99030105.notes. [13] L. Breslau, P. Cao, L. Fan, G. Phillips, and S. Shenker, “Web caching and Zipf-like distributions: Evidence and implications,” in InfoCom. New York, NY: IEEE Press, 1999. [14] C. Briquet, X. Dalem, S. Jodogne, and P.-A. de Marneffe, “Scheduling data-intensive bags of tasks in p2p grids with bittorrent-enabled data distribution,” in UPGRADE ’07: Proceedings of the second workshop on Use of P2P, GRID and agents for the development of content networks. New York, NY, USA: ACM Press, 2007, pp. 39–48. [15] A. Broder, R. Kumar, F. Maghoul, P. Raghavan, S. Rajagopalan, R. Stata, A. Tomkins, and J. Wiener, “Graph structure in the web,” Computer Networks: The International Journal of Computer and Telecommunications Networking, vol. 33, no. 1-6, 2000. [16] R. F. Cancho and R. V. Sol`e, “The small world of human language,” Proceedings of the Royal Society B, vol. 268, pp. 2261–2266, 2001.
14
[17] X. Cheng and J. Liu, “Nettube: Exploring social networks for peer-topeer short video sharing,” in IEEE INFOCOM’09, April 2009. [18] E. Cohen, A. Fiat, and H. Kaplan, “Associative search in peer to peer networks: Harnessing latent semantics,” in Infocom, San Fancisco, CA, 2003. [19] “The DZero Experiment.” http://www-d0.fnal.gov, http://wwwd0.fnal.gov. [20] S. Doraimani and A. Iamnitchi, “File grouping for scientific data management: Lessons from experimenting with real traces,” in 17th ACM/IEEE Symposium on High Performance Distributed Computing (HPDC), June 2008. [21] S. Dorogovtsev and J. Mendes, “Evolution of networks,” Advances in Physics, vol. 51, no. 4, pp. 1079–1187, 2002. ´ [22] Eva Tardos, “Technical perspective new developments in graph partitioning,” Commun. ACM, vol. 51, no. 10, pp. 95–95, 2008. [23] M. Faloutsos, P. Faloutsos, and C. Faloutsos, “On power-law relationships of the internet topology,” in SIGCOMM, 1999, pp. 251– 262. [Online]. Available: citeseer.nj.nec.com/faloutsos99powerlaw.html [24] A. Fast, D. Jensen, and B. N. Levine, “Creating social networks to improve peer-to-peer networking,” in KDD ’05: Proceeding of the eleventh ACM SIGKDD international conference on Knowledge discovery in data mining. New York, NY, USA: ACM Press, 2005, pp. 568–573. [25] F. L. Fessant, S. H. amd Anne-Marie Kermarrec, and L. Massoulie, “Clustering in peer-to-peer file sharing workloads,” in The 3rd International Workshop on Peer-to-Peer Systems (IPTPS), February 2004. [26] A. Ganesh, A. Kermarrec, and L. Massoulie, “Peer-to-peer membership management for gossip-based protocols,” IEEE Transactions on Computers, vol. 52, February 2003. [Online]. Available: citeseer.nj.nec. com/ganesh03peertopeer.html [27] M. Girvan and M. Newman, “Community structure in social and biological networks,” Proc. Natl. Acad. Sci. USA, vol. 99, pp. 8271– 8276, 2002. [28] L. Guo, E. Tan, S. Chen, Z. Xiao, and X. Zhang, “Does internet media traffic really follow zipf-like distribution?” SIGMETRICS Perform. Eval. Rev., vol. 35, no. 1, pp. 359–360, 2007. [29] ——, “The stretched exponential distribution of internet media access patterns,” in PODC ’08: Proceedings of the twenty-seventh ACM symposium on Principles of distributed computing. New York, NY, USA: ACM, 2008, pp. 283–294. [30] A. Iamnitchi, “Resource discovery in large resource-sharing environments,” Ph.D. dissertation, University of Chicago, 2003. [31] A. Iamnitchi, S. Doraimani, and G. Garzoglio, “Filecules in highenergy physics: Characteristics and impact on resource management,” in 15th IEEE International Symposium on High Performance Distributed Computing (HPDC), June 2006, pp. 69–79. [32] ——, “Workload characterization in a high-energy data grid and impact on resource management,” Journal of Cluster Computing, vol. 12, pp. 153–173, 2009. [33] A. Iamnitchi and I. Foster, “Interest-aware information dissemination in small-world communities,” in 14th IEEE International Symposium on High Performance Distributed Computing (HPDC), July 2005. [34] P. Jaccard, “The distribution of the flora in the alpine zone,” New Phytologist, vol. 11, no. 2, pp. 37–50, 1912. [Online]. Available: http://www.jstor.org/stable/2427226 [35] H. Kautz, B. Selman, and M. Shah, “ReferralWeb: Combining the social networks and collaborative filtering,” Communications of the ACM, vol. 40, no. 3, pp. 63–65, 1997. [36] A.-M. Kermarrec, L. Massoulie, and A. Ganesh, “Probabilistic reliable dissemination in large-scale systems,” IEEE Transactions on Parallel and Distributed Systems, vol. 14, no. 3, March 2003. [37] M. Khambatti, K. D. Ryu, and P. Dasgupta, “Structuring peer-to-peer networks using interest-based communities,” in First International Workshop on Databases, Information Systems, and Peer-to-Peer Computing (DBISP2P), 2003, pp. 48–63. [38] S. Khan and L. Tokarchuk, “Interest-based self organization in groupstructured p2p networks,” in Consumer Communications and Networking Conference, 2009. CCNC 2009. 6th IEEE, Jan. 2009, pp. 1–5, declared interest, super-peer network topology. [39] N. Leibowitz, M. Ripeanu, and A. Wierzbicki, “Deconstructing the Kazaa network,” in Workshop on Internet Applications, San Francisco, CA, 2003. [40] M. Li, W.-C. Lee, and A. Sivasubramaniam, “Semantic small world: An overlay network for peer-to-peer search,” in ICNP ’04: Proceedings of the Network Protocols, 12th IEEE International Conference on (ICNP’04). Washington, DC, USA: IEEE Computer Society, 2004, pp. 228–238.
[41] L. Loebel-Carpenter, L. Lueking, C. Moore, R. Pordes, J. Trumbo, S. Veseli, I. Terekhov, M. Vranicar, S. White, and V. White, “SAM and the particle physics data Grid,” in Computing in High-Energy and Nuclear Physics, Beijing, China, 2001. [42] K. Lua, J. Crowcroft, M. Pias, R. Sharma, and S. Lim, “A survey and comparison of peer-to-peer overlay network schemes,” Communications Surveys & Tutorials, IEEE, pp. 72–93, 2005. [43] M. Newman, “Scientific collaboration networks: I. Network construction and fundamental results,” Phys. Rev. E, vol. 64, 2001. [44] ——, “Scientific collaboration networks: II. Shortest paths, weighted networks, and centrality,” Phys. Rev. E, vol. 64, 2001. [45] ——, “The structure of scientific collaboration networks,” Proc. Natl. Acad. Sci. USA, vol. 98, pp. 404–409, 2001. [46] ——, “The structure and function of complex networks,” SIAM Review, vol. 45, no. 2, pp. 167–256, 2003. [47] M. Newman, S. Forrest, and J. Balthrop, “Email networks and the spread of computer viruses,” Phys. Rev. E, vol. 66, no. 035101, 2002. [48] M. Newman, S. Strogatz, and D. Watts, “Random graphs with arbitrary degree distribution and their applications,” Phys. Rev. E, vol. 64, no. 026118, 2001. [49] M. Newman, D. Watts, and S. Strogatz, “Random graph models of social networks,” Proc. Natl. Acad. Sci. USA, vol. 99, pp. 2566–2572, 2002. [50] E. Otoo, D. Rotem, and A. Romosan, “Optimal file-bundle caching algorithms for data-grids,” in SC ’04: Proceedings of the 2004 ACM/IEEE conference on Supercomputing. Washington, DC, USA: IEEE Computer Society, 2004, p. 6. [51] M. K. Ramanathan, V. Kalogeraki, and J. Pruyne, “Finding good peers in peer-to-peer networks,” in IPDPS ’02: Proceedings of the 16th International Symposium on Parallel and Distributed Processing. Washington, DC, USA: IEEE Computer Society, 2002, p. 24, interest based on stored files. [52] A. Rapoport, “Spread of information through a population with sociostructural basis i: Assumption of transitivity,” Bulletin of Mathematical Biophysics, vol. 15, pp. 523–543, December 1953. [53] S. Redner, “How popular is your paper? An empirical study of the citation distribution,” European Physical Journal B, vol. 4, pp. 131– 134, 1998. [54] M. Ripeanu, A. Iamnitchi, and I. Foster, “Mapping the Gnutella network: Properties of large-scale peer-to-peer systems and implications for system design,” Internet Computing, vol. 6, no. 1, pp. 50–57, 2002. [55] Y. Saito, C. Karamanolis, M. Karlsson, and M. Mahalingam, “Taming aggressive replication in the Pangaea wide-area file system,” in OSDI, 2002. [56] E. Santos-Neto, W. Cirne, F. Brasileiro, and A. Lima, “Exploiting replication and data reuse to efficiently schedule data-intensive applications on grids,” Lecture Notes in Computer Science, vol. 3277, pp. 210–232, January 2005. [57] E. Santos-Neto, M. Ripeanu, and A. Iamnitchi, “Tracking user attention in collaborative tagging communities,” in the International ACM/IEEE Workshop on Contextualized Attention Metadata: Personalized Access to Digital Resources, June 2007. [58] S. Saroiu, P. K. Gummadi, R. Dunn, S. D. Gribble, and H. Levy, “An analysis of internet content delivery systems,” in Proc. of the Fifth Symposium on Operating Systems Design and Implementation (OSDI 2002), Boston, MA, USA, 2002. [59] S. Saroiu, P. K. Gummadi, and S. D. Gribble, “A measurement study of peer-to-peer file sharing systems,” in Multimedia Computing and Networking (MMCN), San Jose, CA, USA, 2002. [60] K. Sripanidkulchai, B. Maggs, and H. Zhang, “Efficient content location using interest-based locality in peer-to-peer systems,” in INFOCOM, San Francisco, 2003. [61] D. Stutzbach, R. Rejaie, and S. Sen, “Characterizing unstructured overlay topologies in modern p2p file-sharing systems,” Networking, IEEE/ACM Transactions on, vol. 16, no. 2, pp. 267–280, April 2008. [62] D. Stutzbach and R. Rejaie, “Understanding churn in peer-to-peer networks,” in IMC ’06: Proceedings of the 6th ACM SIGCOMM on Internet measurement. New York, NY, USA: ACM Press, 2006, pp. 189–202. [63] D. Watts and S. Strogatz, “Collective dynamics of ’small-world’ networks,” Nature, vol. 393, 1998. [64] D. J. Watts, Small Worlds: The Dynamics of Networks between Order and Randomness. Princeton University Press, 1999. [65] W. Willinger, D. Alderson, and J. C. Doyle, “Mathematics and the internet: A source of enormous confusion and great potential,” Notices of the AMS, vol. 56, no. 5, May 2009. [Online]. Available: http://www.ams.org/notices/200905/rtx090500586p.pdf