The Staphylococcus aureus Response to Unsaturated Long Chain Free Fatty Acids: Survival Mechanisms and Virulence Implications John G. Kenny1, Deborah Ward1, Elisabet Josefsson2, Ing-Marie Jonsson2, Jason Hinds3, Huw H. Rees1, Jodi A. Lindsay3, Andrej Tarkowski2, Malcolm J. Horsburgh1* 1 School of Biological Sciences, University of Liverpool, Liverpool, United Kingdom, 2 Department of Rheumatology and Inflammation Research, University of Gothenburg, Go¨teborg, Sweden, 3 Division of Cellular & Molecular Medicine, St George’s, University of London, London, United Kingdom
Abstract Staphylococcus aureus is an important human commensal and opportunistic pathogen responsible for a wide range of infections. Long chain unsaturated free fatty acids represent a barrier to colonisation and infection by S. aureus and act as an antimicrobial component of the innate immune system where they are found on epithelial surfaces and in abscesses. Despite many contradictory reports, the precise anti-staphylococcal mode of action of free fatty acids remains undetermined. In this study, transcriptional (microarrays and qRT-PCR) and translational (proteomics) analyses were applied to ascertain the response of S. aureus to a range of free fatty acids. An increase in expression of the sB and CtsR stress response regulons was observed. This included increased expression of genes associated with staphyloxanthin synthesis, which has been linked to membrane stabilisation. Similarly, up-regulation of genes involved in capsule formation was recorded as were significant changes in the expression of genes associated with peptidoglycan synthesis and regulation. Overall, alterations were recorded predominantly in pathways involved in cellular energetics. In addition, sensitivity to linoleic acid of a range of defined (sigB, arcA, sasF, sarA, agr, crtM) and transposon-derived mutants (vraE, SAR2632) was determined. Taken together, these data indicate a common mode of action for long chain unsaturated fatty acids that involves disruption of the cell membrane, leading to interference with energy production within the bacterial cell. Contrary to data reported for other strains, the clinically important EMRSA-16 strain MRSA252 used in this study showed an increase in expression of the important virulence regulator RNAIII following all of the treatment conditions tested. An adaptive response by S. aureus of reducing cell surface hydrophobicity was also observed. Two fatty acid sensitive mutants created during this study were also shown to diplay altered pathogenesis as assessed by a murine arthritis model. Differences in the prevalence and clinical importance of S. aureus strains might partly be explained by their responses to antimicrobial fatty acids. Citation: Kenny JG, Ward D, Josefsson E, Jonsson I-M, Hinds J, et al. (2009) The Staphylococcus aureus Response to Unsaturated Long Chain Free Fatty Acids: Survival Mechanisms and Virulence Implications. PLoS ONE 4(2): e4344. doi:10.1371/journal.pone.0004344 Editor: Dana Davis, University of Minnesota, United States of America Received July 9, 2008; Accepted December 18, 2008; Published February 2, 2009 Copyright: ß 2009 Kenny et al. This is an open-access article distributed under the terms of the Creative Commons Attribution License, which permits unrestricted use, distribution, and reproduction in any medium, provided the original author and source are credited. Funding: This research was enabled by the BBSRC grant BB/D003563/1 awarded to MJH. EJ, IMJ and AT were supported by LUA/ALF, Go¨teborg Medical Society, Go¨teborg Rheumatism Association, King Gustaf V’s 80 Years Foundation, Swedish Research Council, Swedish Rheumatism Association, The Sigurd and Elsa Golje Memorial Foundation and the Family Tho¨le´ns and Kristlers Foundation. The funders had no role in study design, data collection and analysis, decision to publish, or preparation of the manuscript. Competing Interests: The authors have declared that no competing interests exist. * E-mail:
[email protected]
aureus and susceptibility to bacterial skin infections [1–3]. In human tissue and nasal fluid, the major LC-FFAs are the unsaturated linoleic [C18:2 (n-6,9)], oleic [C18:1 (n-9)] and palmitoleic [C16:1 (n-7)] acids and the saturated palmitic [C16:0] and stearic [C18:0] acids [4–7]. Assay of staphylococcal abscess homogenates has revealed the presence of anti-staphylococcal activity comprising a pool of monoglycerides and free fatty acids [8–10]. The most abundant compound present in this active pool was identified as linoleic acid and was found at millimolar concentrations. FFAs of various chain lengths and with different levels of unsaturation are primarily effective against Gram-positive bacteria [11–18]. Inhibition of several membrane-enveloped viruses has also been demonstrated [19–21]. Although several studies have attempted to pinpoint the specific cellular target(s) of LC-uFFAs, the actual anti-bacterial mechanism has not been unambiguously
Introduction Staphylococcus aureus is the aetiological agent for a wide range of human infections, including abscesses, septicaemia, arthritis and endocarditis. The increased prevalence of meticillin resistant(MRSA) and vancomycin insensitive-S. aureus strains, and the emergence of community-acquired MRSA make investigations into the pathogenicity of this species imperative. Inevitably, this focuses research into the development of novel antimicrobial agents, which requires a rigorous study of staphylococcal physiology. Long chain unsaturated free fatty acids (LC-uFFAs), typically $C16, are known to possess anti-staphylococcal activity and LC-uFFAs are important components of the innate immune system. Individuals with atopic dermatitis exhibit deficient production of the skin-specific LC-uFFA, hexadecenoic acid [C16:1 (n-6)], which is associated with increased carriage of S. PLoS ONE | www.plosone.org
1
February 2009 | Volume 4 | Issue 2 | e4344
S. aureus Response to LC-uFFAs
determined. Conflicting data have proposed that LC-uFFAs inhibit all major bacterial biosynthetic pathways within the cell, or alternatively, that they specifically inhibit FabI, which catalyses the final and rate-limiting step in fatty acid biosynthesis [12,18,22,23]. Oleic acid was proposed by Won et al. [24] to inhibit glucosyltransferases, while other proposed mechanisms for LC-uFFA-mediated growth inhibition include peptidoglycan (PG) precipitation, peroxidative stress, interference with energy metabolism and alteration of the membrane permeability or fluidity [12,16,18,22,25,26]. A diversity of mechanisms have been proposed to account for resistance to LC-uFFAs in S. aureus. Enhanced production of the carotenoid staphyloxanthin (giving aureus its golden title) has been proposed as a mechanism to relieve the inhibitory effects of increased membrane fluidity due to insertion of LC-uFFAs into the lipid bilayer in S. aureus [26–28]. Increased staphylococcal resistance to LC-uFFAs was positively correlated with pigmentation, although these experiments were performed using nonisogenic strains [28]. A fatty acid modifying enzyme (FAME), which catalyses the esterification of FFAs with cholesterol has also been purified from several S. aureus strains and its production correlated with increased disease severity in an abscess model [29– 32]. Nonetheless the gene encoding FAME remains unidentified. Furthermore, in Neisseria gonorrhoea, FFA resistance has been linked to the presence of FFA-specific efflux pumps [33] while in S. aureus, the expression of Fur-iron-regulated staphylococcal surfaceassociated protein IsdA was identified as contributing to FA resistance in iron-limited environments by reducing cellular hydrophobicity [34]. Another proposed mechanism included the increased production of a ‘protective slime’ composed of precipitated PG complexed to fatty acids [25]. Previous studies demonstrated that S. aureus responds to the C12 monoester glycerol monolaurate (GML) and the component FFA lauric acid by reducing levels of expression of alpha toxin (Hla) [35–37]. Similarly, Clarke et al. [34] showed that expression of hla was reduced following exposure of S. aureus to the LC-uFFA hexadecenoic acid [C16:1 (n-6)]. More recently, GML was shown to inhibit the synthesis of toxins in several Gram-positive bacteria and also limited the effect of these toxins on eukaryotic cells [38– 40]. While the biological effects of free fatty acids as antimicrobial compounds have been catalogued, there remains no unequivocal identification of the targets or mechanisms of action in relation to S. aureus. Transcriptomic and proteomic analyses have the potential to elucidate complex cellular and metabolic responses and are applied here for the first time to analyse the reaction of S. aureus to the LC-uFFAs linoleic, oleic and hexadecenoic acid. In addition, an analysis of existing well-characterised mutants and the generation of new allelic replacement mutants based on gene array data coupled to transposon screens was carried out to identify loci important for survival. Finally, a murine arthritis model of infection was used to ascertain whether two of the genes highlighted in this study have a role in pathogenesis.
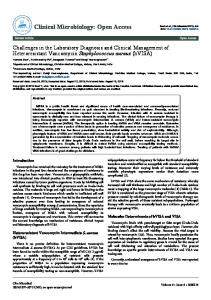
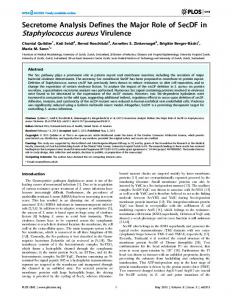
Figure 1. Inhibition of S. aureus by C18 unsaturated fatty acids. A Graph showing percentage survival of wild-type strains of S. aureus when these strains were incubated on BHI plates containing 0, 0.25, 0.5 and 1 mM linoleic acid. The strains analysed were SH1000 (closed box), MRSA252 (closed triangle), MSSA476 (open box) and N315 (open circle). This assay was performed in triplicate and is representative of multiple experiments. B Growth of a 0.5% (vol/vol) inoculum of MRSA252 in 100 ml BHI containing 0 mM fatty acid (closed triangle), 0.01 mM oleic acid (cross) or 0.01 mM linoleic acid (open box) at 37uC with shaking at 250 rpm. RNA was extracted from these cells at an OD600 of 3 and analysed in microarray experiments as the growth exposure conditions. C Growth of a 0.5% (vol/vol) inoculum of MRSA252 in 100 ml BHI at 37uC with shaking at 250 rpm with (open box) or without (closed triangle) the addition of 0.1 mM linoleic acid at an OD600 of 3. RNA was extracted from these cells 20 min post-exposure and analysed in microarray experiments as the challenge conditions. The growth curves shown in B and C were performed in biological triplicate. The error bars shown in graphs B and C correspond to standard errors of the mean. doi:10.1371/journal.pone.0004344.g001
Results Comparative resistance of S. aureus strains to unsaturated C18 free fatty acids The relative resistances of different strains of S. aureus to the unsaturated C18 free fatty acids linoleic acid [C18:2 (n-6,9)] and oleic acid [C18:1 (n-9)] were compared using a previously described agar plate assay [13]. Many strains, such as MSSA476 and N315, were unable to grow on emulsion agar plates containing 1 mM linoleic acid (Fig. 1A). In contrast MRSA252, PLoS ONE | www.plosone.org
2
February 2009 | Volume 4 | Issue 2 | e4344
S. aureus Response to LC-uFFAs
an epidemic ERMSA-16 strain, and the laboratory strain SH1000 displayed high levels (.60%) of survival at millimolar concentrations. Consequently, all subsequent experiments were performed using MRSA252 and SH1000 strains of S. aureus, owing to their enhanced growth in the presence of C18 LC-uFFAs.
encoding ESAT-6-like proteins and the genes coding for their synthesis/secretion [41] and tcaR that encodes a MarR-like regulator of SarS and SasF expression [42] (Table 3). Many genes involved in sugar metabolism showed altered levels of regulation. In particular, several genes in the fructose and mannose metabolism pathways were down-regulated. These include SAR0753 (fruA) and SAR0752, involved in the importation and phosphorylation of fructose, respectively. Genes with similar functions involving the importation and phosphorylation of glucose, mannose, maltose and galactitol, namely SAR0235, SAR1777 (pfkA), SAR2720, SAR2721 (pmi), SAR0242 and SAR0263 were also down-regulated. This could indicate an alteration of central metabolism via the action of the linoleic acid. Here, in concert with these changes, many genes in glycolysis were up-regulated, including SAR2684 (fda), SAR0830 (tpiA), SAR0831 (pgm) and SAR2506 (dpgm). In addition, the SAR0141 (drm), SAR0574 and SAR0575 genes involved in pentose and glucuronate interconversions were up-regulated, which would increase the availability of substrates for glycolysis or pentose phosphate pathways. The down-regulation of the putative UTP-glucose-1phosphate uridylyltransferases SAR2262 and SAR2579 (gtaB), which are predicted to catalyse the conversion of glucose-1phosphate to UDP-glucose, would maintain the pool of phosphorylated glucose available for glycolysis. In addition to increased transcription of genes encoding glycolytic enzymes, the cells exposed to a linoleic acid challenge alter metabolism to maintain levels of pyruvate. The up-regulation of SAR0824 which encodes malate dehydrogenase (converting malate to pyruvate) is predicted to increase pyruvate levels. Concomitantly, there was down-regulation of genes involved in pyruvate utilisation, including ldh1, SAR1088 (pycA), ald2 and SAR0355 converting pyruvate to lactate, oxaloacetate, alanine and cysteine, respectively. Reduced transcription of SAR2143 (ilvC) could further lower the expenditure of cellular pyruvate via amino acid synthesis, and down-regulation of SAR0522 and SAR0523 encoding predicted enzymes utilising glyceraldehyde-3-phosphate would prevent diversion of this intermediate from glycolysis. The reduced importation of substrates for glycolysis would explain increased levels of glycolytic enzymes and modulation of other pathways to increase pyruvate production. Under such potentially energy starved conditions, the pool of pyruvate would be pushed toward energy creation at the expense of less critical pathways. There was up-regulation of many genes involved in cellular stress responses, including the CtsR regulon genes clpB, dnaJ and dnaK suggesting that linoleic acid addition is perceived by S. aureus as a stressor. Moreover, the transcripts of several sB-regulated genes were up-regulated, including katA, asp23 and clpL, and the crtM, crtN, crtO, crtP, crtQ genes involved in staphyloxanthin biosynthesis. The mevalonate pathway generates the isopentenyldiphosphate precursor for biosynthesis of this carotenoid, and the pathway genes mvaK1, mvaD and mvaK2 were up-regulated accordingly (Table 1). Linoleic acid has been proposed to interfere with membrane function by increasing fluidity, which has the potential to perturb the electron transport chain. The production of carotenoids, which insert into the membrane has been reported to decrease fluidity and counteract the effect of LC-uFFAs [26]. In response to linoleic acid challenge the menaquinone biosynthesis pathway genes SAR1017 (menD) and SAR1018 involved in the conversion of chorismate to menaquinone (MK), and present in an operon with menB, were up-regulated indicating an increase in MK biosynthesis. This up-regulated MK synthesis could be a response to perturbation of the electron transport chain. The SAR1479, SAR1480 (menH) and SAR1481 genes synthesise heptaprenyl diphosphate for the isoprenoid moiety of MK-7, while SAR1278
Growth of MRSA252 in the presence of LC-uFFAs To facilitate analysis of gene transcription and protein expression, a range of different concentrations of linoleic or oleic acid and the timing of their addition were examined during growth (data not shown). Upon inoculation 0.01 mM linoleic acid was determined to be the maximum concentration, which did not retard the aerobic growth of MRSA252 in BHI broth (Fig. 1B). Cells were subsequently grown in the presence of 0.01 mM linoleic or oleic acid with the FFAs being added at the start of growth (growth exposure conditions). To test the response of MRSA252 to LC-uFFAs under slightly different conditions, a higher concentration of linoleic acid (0.1 mM) was added during the lateexponential growth phase (OD600 = 3) where it was observed to reduce subsequent growth (challenge conditions) (Fig. 1C). These culture conditions were repeated for independent samples and cells were harvested to determine the transcriptional and translational responses of the cells to treatment with LC-uFFAs.
The transcriptional response of S. aureus to C18 free fatty acids A pronounced differential transcriptional response was observed in MRSA252 cells treated with linoleic acid when it was added to a final concentration of 0.1 mM for 20 min during late-exponential growth (linoleic acid challenge) compared to unexposed control cells; 213 genes were up-regulated (Table 1) and 179 genes were down-regulated (Table 2). When transcription was analysed for cells grown in the presence of a lower concentration of linoleic acid (0.01 mM) from the time of inoculation (linoleic acid growth exposure) a correspondingly smaller subset of genes displayed differential transcription; 37 genes were up-regulated (Table 3) and 28 genes were down-regulated (Table 4). Oleic acid differs from linoleic acid in its degree of unsaturation, containing one less double bond in the chain. When cells were grown under the conditions of oleic acid growth exposure, 20 genes were upregulated (Table 5) and 23 genes were down-regulated (Table 6). The sudden imposition of linoleic acid during exponential growth at OD600 = 3 (linoleic acid challenge) resulted in large-scale transcriptional reprogramming of genes in four major discernible categories, including: virulence, energy metabolism, stress resistance and cell wall synthesis. In contrast, the presence of linoleic at 0.01 mM, a non-growth limiting concentration (linoleic acid growth exposure), resulted in changes in transcription of fewer genes in the same categories, with the exception of cell wall synthesis.
Effect of linoleic acid on S. aureus MRSA252 transcription A distinctive feature of linoleic acid addition to cells of MRSA252 under both challenge and growth exposure conditions was observed to be the 10- and 2-fold up-regulation of the virulence regulator RNAIII, respectively (Table 1, 3). Previous studies have not reported changes in regulation of this locus after exposure to FFAs in S. aureus [34,35]. Moreover, after linoleic acid challenge the virulence regulator sarA was up-regulated as was clfA, encoding clumping factor A and genes required for capsule formation (capF, capM, capN), while the genes encoding the proteases staphopain and aureolysin were down-regulated (Table 1, 2). Further virulence-associated loci up-regulated in the presence of linoleic acid during growth included the esxA locus PLoS ONE | www.plosone.org
3
February 2009 | Volume 4 | Issue 2 | e4344
S. aureus Response to LC-uFFAs
Table 1. MRSA252 genes up-regulated following the addition of linoleic acid (0.1 mM) to exponentially growing cells (linoleic acid challenge).
Group Functions Virulence Factors and Regulators
MRSA252 ORF
MRSA252 Gene MRSA252 Gene Product
Fold Change Up Regulated
P-value
SAR0156
capF
capsular polysaccharide synthesis enzyme
2.23
4.22E-02
SAR0163
capM
capsular polysaccharide synthesis enzyme
2.23
3.20E-02
SAR0164
capN
capsular polysaccharide synthesis enzyme
2.83
1.79E-02
SAR0625
sarA
staphylococcal accessory regulator A
2.14
1.50E-02
SAR0842
clfA
clumping factor
4.12
6.58E-03
SAR2122
hld
delta-hemolysin precursor
3.28
1.23E-02
SAR2295
Stress Response
putative exported MAP/eap domain protein
3.21
8.77E-04
SAR2443
tcaR
MarR family regulatory protein
3.15
1.76E-03
RNAIII
RNAIII
RNAIII accessory gene regulator (agr) locus
2.01
3.02E-02
SAR0577
proP
SAR0859
8.15E-04
clpB
putative ATPase subunit of an ATP-dependent protease
2.49
katA
catalase
5.71
1.86E-03
SAR1656
dnaJ
chaperone protein
2.30
4.25E-02
SAR1657
dnaK
chaperone protein
2.41
2.17E-03
SAR2273
asp23
alkaline shock protein 23
2.06
3.86E-02
SAR2276
opuD2
glycine betaine transporter 2
4.42
6.16E-03
alkylhydroperoxidase, AhpD family
6.83
8.77E-04
SAR2628
clpL
putative ATPase subunit of an ATP-dependent protease
4.06
4.79E-03
SAR0113
lldP1
L-lactate permease 1
2.15
1.07E-03
putative isochorismatase
4.91
8.03E-04
putative phosphopentomutase
2.45
1.31E-02
SAR0574
putative hexulose-6-phosphate synthase
2.36
1.80E-03
SAR0575
putative 6-phospho-3-hexuloisomerase
2.16
5.11E-03
SAR0775
Osmoprotectant ABC transporter
2.13
4.80E-03
SAR0776
Osmoprotectant ABC transporter, permease protein
2.99
3.00E-04 9.27E-03
SAR0141
drm
SAR0824
putative malolactic enzyme
2.59
SAR0830
tpiA
triosephosphate isomerase
2.22
3.39E-02
SAR0831
pgm
putative phosphoglycerate mutase
2.64
1.39E-02
SAR1017
menD
1.65E-03
putative menaquinone biosynthesis bifunctional protein
2.24
SAR1018
putative hydrolase
2.80
1.65E-03
SAR2386
putative NAD-dependent dehydrogenase
3.73
3.00E-04
SAR2506
dpgm
putative phosphoglycerate mutase
2.06
7.33E-04
SAR2684
fda
fructose-bisphosphate aldolase class I
2.02
5.85E-03
putative AMP-binding enzyme
2.01
9.65E-03
SAR2687 SAR2724 SAR0363
ssb
SAR0744
Protein Synthesis
5.78E-04 1.23E-02
SAR1344
SAR0188
DNA Repair and Replication
8.31 3.82
SAR0938
SAR2561
Energy Metabolism
putative proline/betaine transporter putative organic hydroperoxide resistance protein
isochorismatase family protein
3.00
8.30E-04
putative single-strand DNA-binding protein
2.26
3.29E-03
putative DNA photolyase
3.46
6.97E-04
SAR0813
uvrA
excinuclease ABC subunit A
2.45
2.06E-03
SAR0836
rnr
putative ribonuclease R
3.40
3.55E-03
SAR0837
smpB
putative tmRNA-binding protein
3.07
3.70E-04
SAR0364
rpsR
30S ribosomal protein S18
2.40
1.99E-02
SAR0552
fus
translation elongation factor G
2.10
3.39E-02
SAR1638
rpoD
RNA polymerase sigma factor
2.86
3.70E-04
SAR2308
rplQ
50S ribosomal protein L17
2.60
1.99E-02
SAR2309
rpoA
DNA-directed RNA polymerase alpha chain
2.36
3.35E-02
PLoS ONE | www.plosone.org
4
February 2009 | Volume 4 | Issue 2 | e4344
S. aureus Response to LC-uFFAs
Table 1. Cont. Group Functions
MRSA252 ORF
MRSA252 Gene MRSA252 Gene Product
Fold Change Up Regulated
P-value
SAR2310
rpsK
30S ribosomal protein S11
2.46
3.77E-02
SAR2311
rpsM
30S ribosomal protein S13
2.45
3.12E-02
SAR2313
infA
SAR2728 Peptidoglycan Synthesis
translation initiation factor IF-1
2.08
1.49E-02
preprotein translocase SecA subunit-like protein
3.85
6.58E-03
2.52
3.07E-02
SAR0878
csdB
putative selenocysteine lyase
SAR1026
atl
bifunctional autolysin precursor
2.65
6.16E-03
SAR1158
mraY
phospho-N-acetylmuramoyl-pentapeptide-transferase
2.13
9.56E-04
SAR1159
murD
7.64E-03
UDP-N-acetylmuramoylalanine–D-glutamate ligase
2.39
SAR1160
putative cell division protein
2.10
1.31E-02
SAR1290
putative exported CHAP domain protein
3.17
6.97E-04 1.86E-03
SAR1430
murG
putative N-acetylglucosamine transferase
5.26
SAR1761
lysP
lysine-specific permease
2.07
3.01E-02
SAR2109
dapE
putative succinyl-diaminopimelate desuccinylase
4.89
3.00E-03
SAR2188
murA1
6.54E-03
putative carboxyvinyltransferase
2.94
putative alanine racemase
2.64
1.78E-03
putative pentaglycine interpeptide biosynthesis protein
2.49
4.22E-03
putative protein associated with cell-envelope regulation
2.34
2.55E-03
arginase family protein
2.83
4.71E-03
SAR2521
putative membrane GtrA-like protein
3.11
5.78E-04
Fatty Acid Metabolism
SAR1438
conserved hypothetical protein
2.64
4.94E-03
SAR2187
fabZ
putative hydroxymyristoyl-(acyl carrier protein) dehydratase
2.41
4.22E-02
Carotenoid Biosynthesis
SAR0596
mvaK1
mevalonate kinase
2.32
3.00E-04
SAR0597
mvaD
mevalonate diphosphate decarboxylase
3.35
9.23E-04
SAR0598
mvaK2
phosphomevalonate kinase
3.18
5.09E-04
SAR2642
crtN
squalene synthase
4.95
8.03E-04
SAR2643
crtM
squalene desaturase
7.18
2.38E-02
SAR2645
crtQ
putative glycosyl transferase
6.07
3.00E-03
SAR2646
crtP
putative phytoene dehydrogenase related protein
6.28
1.73E-03
SAR2269 SAR2346
fmhB
SAR2394 SAR2420
Antibiotic Resistance
Miscellaneous
Metabolism
hutG
SAR2647
putative membrane protein
4.47
1.73E-03
SAR0139
putative tetracycline resistance protein
4.06
1.59E-03
SAR1622
metallo-beta-lactamase superfamily protein
2.08
3.93E-03
SAR1785
metallo-beta-lactamase superfamily protein
3.05
1.08E-03
beta-lactamase precursor
2.02
2.72E-02
SAR1831
blaZ
SAR2505
mdeA
putative transport system protein
3.93
7.74E-03
SAR2558
conserved hypothetical beta-lactamase-like protein
8.72
3.70E-04
SAR2632
Putative MMPL efflux pump
2.03
4.58E-02
SAR2655
putative glyoxalase
5.15
1.11E-03
SAR2668
hypothetical aminoglycoside phosphotransferase protein
4.35
6.30E-03
SAR1738
tnpB2
transposase B 2
2.14
1.25E-03
SAR2725
sasF
putative surface anchored protein
16.80
4.68E-05
SAR0108
putative peptidase
2.98
5.22E-03
SAR0109
putative transporter protein
2.37
1.52E-02
SAR0170
putative cation efflux system protein
2.50
1.77E-03
SAR0306
ABC transporter ATP-binding protein
6.10
1.68E-03
SAR0324
putative lipoate-protein ligase A
2.09
4.31E-03
SAR0325
putative reductase
4.80
8.17E-04
SAR0556
ThiJ/PfpI family protein
7.20
7.59E-04
PLoS ONE | www.plosone.org
5
February 2009 | Volume 4 | Issue 2 | e4344
S. aureus Response to LC-uFFAs
Table 1. Cont. Group Functions
MRSA252 ORF
MRSA252 Gene MRSA252 Gene Product
P-value
SAR0589
putative amino acid permease
4.19
3.75E-03
SAR0600
pyridine nucleotide-disulphide oxidoreductase protein
2.26
2.77E-04
SAR0624
putative esterase
6.49
7.59E-04
SAR0729
putative acetyltransferase
2.92
3.23E-03
SAR0732
putative acetyltransferase
2.34
3.00E-04
SAR0756
aldo/keto reductase family protein
2.96
6.16E-04
SAR0757
putative glucosyl transferase
3.49
7.59E-04
SAR0764
putative 6-pyruvoyl tetrahydropterin synthase
3.70
8.03E-04
SAR0841
putative acetyltransferase
5.22
3.29E-03
SAR0883
putative dioxygenase
5.40
1.75E-03
SAR0903
putative pyridine nucleotide-disulphide oxidoreductase
2.82
3.00E-04
SAR0953
transport system extracellular binding lipoprotein
2.18
6.05E-03
SAR1076
Spermidine/putrescine-binding protein homolog.
4.46
8.77E-04
putative tRNA pseudouridine synthase B
2.31
2.10E-03
homoserine kinase
2.20
3.71E-02
putative acetyltransferase
4.58
1.80E-03 6.34E-03
SAR1247 SAR1340
thrB
SAR1431 SAR1439
dfrB
dihydrofolate reductase type I
2.13
SAR1440
thyA
thymidylate synthase
5.32
1.58E-03
SAR1585
malR
maltose operon transcriptional repressor
2.21
2.20E-02
putative methyltransferase
2.25
6.08E-03
SAR1655 SAR2210 SAR2352
moaA
aldehyde dehydrogenase family protein
5.48
1.51E-03
putative molybdenum cofactor biosynthesis protein A
2.07
1.86E-03
SAR2385
putative Na+/H+ antiporter
2.35
1.34E-02
SAR2395
inositol monophosphatase family protein
2.90
7.59E-04
SAR2413
putative short chain dehydrogenase
4.63
3.66E-03
SAR2460
putative acetyltransferase (GNAT) family protein
2.26
6.97E-04
SAR2485
nitrate reductase beta chain
2.16
1.02E-02
SAR2541
putative carboxylesterase
2.45
1.79E-02
SAR2544
ABC transporter ATP-binding protein
6.01
1.68E-03
SAR2559
putative short chain dehydrogenase
6.85
6.16E-04
SAR2659
putative short chain dehydrogenase
2.65
1.76E-03
SAR2661
putative hydrolase
8.11
8.27E-04
putative histidine biosynthesis bifunctional protein
2.09
2.19E-02
SAR2754
Hypothetical Genes
Fold Change Up Regulated
narH
hisIE
SAR2778
putative nickel transport protein
2.51
3.59E-03
SAR0111
putative myosin-crossreactive antigen
5.96
2.43E-03
SAR0112
putative membrane protein
3.57
4.80E-04
SAR0171
hypothetical protein
2.64
3.01E-02
SAR0269
LacI family regulatory protein
2.57
3.59E-03
SAR0299
hypothetical protein
2.05
4.99E-02
SAR0305
putative membrane protein
3.89
6.02E-03
SAR0390
putative lipoprotein
3.97
1.68E-03
SAR0392
putative membrane protein
2.54
1.20E-02
SAR0405
hypothetical protein
2.76
1.07E-02
SAR0444
putative lipoprotein
2.31
2.16E-03
putative regulatory protein
3.65
1.07E-03
SAR0498
yabJ
SAR0499
spoVG
stage V sporulation protein G
2.83
1.11E-02
SAR0601
putative DNA-binding protein
2.15
4.48E-04
SAR0670
putative sensor histidine kinase protein
2.01
4.80E-04
SAR0721
multicopper oxidase protein
2.29
4.39E-03
PLoS ONE | www.plosone.org
6
February 2009 | Volume 4 | Issue 2 | e4344
S. aureus Response to LC-uFFAs
Table 1. Cont. Group Functions
MRSA252 ORF
MRSA252 Gene MRSA252 Gene Product
Fold Change Up Regulated
P-value
SAR0733
conserved hypothetical protein
3.04
1.99E-03
SAR0734
conserved hypothetical protein
2.23
1.59E-03
SAR0821
conserved hypothetical protein
3.19
6.54E-03
SAR0825
conserved hypothetical protein
5.06
1.86E-03
SAR0840
putative membrane protein
5.25
2.63E-03
SAR0849
hypothetical protein
2.81
6.05E-03
SAR0850
hypothetical protein
2.94
6.81E-04
SAR0854
hypothetical protein
4.07
1.56E-02
SAR0855
hypothetical protein
2.53
1.94E-03
SAR0867
hypothetical protein
2.54
4.55E-03
SAR0877
conserved hypothetical protein
2.34
3.01E-02
SAR0879
NifU-like protein
2.06
3.39E-02
SAR0880
conserved hypothetical protein
2.14
3.47E-03
SAR0882
putative membrane protein
4.05
4.12E-03
SAR0931
putative membrane protein
7.87
4.28E-04
SAR1055
hypothetical protein
4.50
3.08E-03
SAR1077
putative membrane protein
2.54
5.69E-03
SAR1227
conserved hypothetical protein
2.11
1.71E-02
SAR1258
putative DNA-binding protein
2.12
3.07E-04
SAR1289
putative exported protein
3.49
1.65E-03
SAR1306
hypothetical protein
2.20
5.66E-03
SAR1429
putative membrane protein
5.74
1.84E-03
SAR1528
hypothetical phage protein
6.04
4.99E-02
SAR1623
conserved hypothetical protein
2.29
1.39E-02
SAR1669
conserved hypothetical protein
2.01
1.03E-02
SAR1670
conserved hypothetical protein
2.53
5.36E-03
SAR1671
probable nicotinate-nucleotide adenylyltransferase
2.03
8.07E-03
SAR1816
putative membrane protein
2.82
6.16E-04
SAR1854
hypothetical protein
4.98
1.27E-03
SAR1965
ThiJ/PfpI family protein
2.25
4.83E-02
SAR1970
conserved hypothetical protein
2.17
4.68E-02
SAR1972
putative exported protein
5.71
6.59E-03
SAR2010
hypothetical protein
3.49
6.58E-03
SAR2047
hypothetical phage protein
2.12
1.16E-02
SAR2085
hypothetical phage RecT family protein
2.18
9.84E-04
SAR2088
hypothetical phage protein
2.62
2.28E-02
SAR2094
hypothetical phage protein
2.69
3.06E-03
SAR2095
hypothetical phage protein
4.03
5.44E-03
SAR2098
hypothetical phage protein
2.02
2.87E-03
SAR2189
putative membrane protein
2.94
6.07E-03
SAR2232
conserved hypothetical protein
8.26
2.06E-03
SAR2245
putative transcriptional antiterminator
6.03
1.76E-03
SAR2270
hypothetical IucA/IucC family protein
3.36
3.80E-03
SAR2274
putative membrane protein
4.59
2.04E-03
SAR2275
putative membrane protein
3.98
6.16E-04
SAR2347
putative membrane protein
2.21
6.54E-03
SAR2392
conserved hypothetical protein
3.03
5.20E-03
SAR2393
putative molydopterin dinucleotide binding domain protein
3.26
2.50E-03
SAR2444
putative membrane protein
4.38
2.77E-04
SAR2469
putative pyridoxamine 59-phosphate oxidase
4.72
1.11E-03
PLoS ONE | www.plosone.org
7
February 2009 | Volume 4 | Issue 2 | e4344
S. aureus Response to LC-uFFAs
Table 1. Cont. Group Functions
MRSA252 ORF
MRSA252 Gene MRSA252 Gene Product
Fold Change Up Regulated
P-value
SAR2496
putative solute binding lipoprotein
2.60
3.66E-03
SAR2525
hypothetical protein
5.28
2.33E-05
SAR2532
CapD domain protein
2.48
4.16E-03
SAR2542
putative transport protein
2.01
5.64E-03
SAR2543
putative membrane protein
6.37
6.16E-04
SAR2568
hypothetical protein
4.66
1.65E-03
SAR2656
conserved hypothetical protein
3.35
6.16E-04
SAR2657
hypothetical protein
2.40
8.80E-04
SAR2658
TetR family regulatory protein
2.22
4.39E-04
SAR2660
conserved hypothetical protein
7.26
6.16E-04
SAR2665
conserved hypothetical protein
2.19
4.06E-03
SAR2666
hypothetical protein
2.75
1.87E-03
SAR2667
hypothetical protein
2.19
1.37E-02
SAR2688
hypothetical protein
7.55
3.70E-04
SAR2689
hypothetical protein
2.53
1.84E-02
SAR2726
conserved hypothetical protein
5.07
1.80E-03
SAR2727
glycosyl transferase, group 1 family protein
4.11
6.70E-03
SAR2739
conserved hypothetical protein
4.21
2.06E-03
SAR2740
conserved hypothetical protein
2.05
3.09E-02
SAR2777
putative DNA-binding protein
2.40
1.90E-03
SAR2780
putative membrane protein
7.38
4.80E-04
doi:10.1371/journal.pone.0004344.t001
(miaA) is a predicted isopentenyl-pyrophosphate transferase. These genes were down-regulated, which is consistent with a reduction of the MK-7 isoprenolog. S. aureus synthesises various MK isoprenologs, up to MK-9, and alters their ratio in response to changes in temperature and oxygen levels [43]. Genes concerned with cell wall biosynthesis were observed to be modulated in linoleic acid challenge conditions but not in the growth exposure conditions. The genes mraY, murD, murG and murA1 involved in the synthesis of the pentaglycine precursor in PG synthesis were upregulated, as was atl, encoding the major cellular autolysin (Table 1) [44]. There was down-regulation of the two-component regulatory system lytRS, the holin-like lrgA and cidA and the putative transglycosylase SAR1807, which have cell wall modulatory roles (Table 2) [45,46]. In addition to these changes, an assortment of transcriptionally modulated genes was observed, which would function to maintain the level of constituents for the PG-pentapeptide precursor. SAR2109 (dapE), which catalyses the formation of a substrate for lysine biosynthesis and the lysine-specific permease SAR1761 (lysP) were up-regulated, and this would increase the pool of L-lysine in the cell. Up-regulation of SAR2420 (hutG), and downregulation of SAR2669 encoding a putative dihydroorotate dehydrogenase, SAR0228 encoding a putative glutamine amidotransferase and SAR1752 (hemA), in concert, would maintain glutamate levels within the cell. SAR2269, a putative alanine racemase, was up-regulated thereby increasing synthesis of D-alanine by isomerising L-alanine. The microarray data also revealed increased transcription of the tagA, tagG and tagB genes concerned with teichoic acid biosynthesis. The fatty acid biosynthesis enzyme FabI was previously reported to be inhibited by linoleic acid and was therefore proposed to be a key target for its antibacterial activity [23]. Here, within fatty acid metabolism, only fabZ was up-regulated in linoleic acid challenge conditions, whereas fadD, fadX and plc were downPLoS ONE | www.plosone.org
regulated. fabZ is directly downstream of murA1 within a predicted operon which may explain why fabZ alone is up-regulated amongst the fatty acid biosynthesis genes.
Quantitative Real-Time PCR Confirmation of the microarray data was performed using qRTPCR to test selected transcriptional changes of known genes from different functional subsets. To this end, the expression level of genes involved in staphyloxanthin synthesis (crtM), PG biosynthesis (murG, cidA and lytR), stress responses (katA and clpB), virulence (RNAIII, sarA, arcA, hla and spa) and fatty acid metabolism (fabZ, fabI, fadD and fadA) were analysed. In addition, the sasF gene was analysed to confirm the particularly high levels of transcript that were observed under the challenge experimental conditions. Most genes tested showed the same pattern of up- or down-regulation (Table 7) that was identified by microarray analysis under any given set of conditions. The only exceptions were the fatty acid degradation pathway genes fadD and fadA. While fadD was 2.15 fold down-regulated after linoleic acid challenge when analysed by microarray, this was identified as a 3.16 fold up-regulation when tested by qRT-PCR. The fadA gene lies within a predicted operon with fadD and would thus be co-regulated. A 3.1 fold upregulation of fadA was similarly measured by qRT-PCR when the cells were challenged with linoleic acid, which supports the reproducibility of the qRT-PCR analysis of fadD and its likely operon arrangement with fadA. Therefore, with the exception of the fad operon, the microarray data was shown to be consistent when tested by qRT-PCR. The transcription of a subset of genes was examined by qRT-PCR during mid-exponential growth phase and late exponential-phase (OD600 = 8) (Table 7), to examine the potential effect of the increased 8
February 2009 | Volume 4 | Issue 2 | e4344
S. aureus Response to LC-uFFAs
Table 2. MRSA252 genes down-regulated following the addition of linoleic acid (0.1 mM) to exponentially growing cells (linoleic acid challenge).
Group Functions
MRSA252 Gene
MRSA252 Gene Product
Fold Change Down Regulated
P-value
Virulence Factors SAR0105 and Regulators
plc
1-phosphatidylinositol phosphodiesterase
3.85
4.39E-04
SAR1574
fur
2.46E-02
Energy Metabolism
MRSA 252 ORF
iron uptake regulatory protein
2.08
SAR1984
ferritin
2.56
4.39E-03
SAR2001
staphopain protease
2.44
3.00E-04
SAR2474
sarZ
MarR family virulence regulator
2.22
2.18E-02
SAR2155
rsbU
putative sigma factor sigB regulation protein
2.56
1.58E-03
SAR2715
argR
arginine repressor family protein
2.27
4.27E-03
SAR2716
aur
zinc metalloproteinase aureolysin precursor
2.17
1.76E-03
SAR0234
ldh1
L-lactate dehydrogenase 1
2.94
2.99E-05
SAR0235
putative PTS system, IIBC component
2.22
1.30E-03
SAR0242
putative galactitol PTS component
2.13
1.76E-02
SAR0263
putative PTS system protein
2.50
3.44E-02
SAR0355
Cys/Met metabolism PLP-dependent enzyme
2.04
2.74E-02
SAR0522
putative pyridoxal 5-phosphate biosynthesis protein
3.03
3.00E-04
SAR0523
SNO glutamine amidotransferase family protein
2.70
3.70E-04
SAR0752
putative phosphofructokinase
2.38
3.27E-02
fructose-specific PTS system component
2.50
3.78E-02
SAR0766
glutamine amidotransferase class-I protein
2.04
6.16E-04
SAR1088
putative pyruvate carboxylase
2.5
8.78E-04 5.47E-03
SAR0753
fruA
SAR1450
tdcB
putative threonine dehydratase
2.22
SAR1451
ald2
alanine dehydrogenase 2
3.03
1.15E-03
SAR1777
pfkA
6-phosphofructokinase
2.86
2.87E-03
SAR1789
ackA
acetate kinase
2.33
9.23E-03
SAR2143
ilvC
ketol-acid reductoisomerase
2.22
2.80E-02
SAR2213
fba
putative tagatose-bisphosphate aldolase
3.13
6.59E-03
putative uridylyltransferase
2.27
8.35E-03
SAR2262 SAR2579
gtaB
SAR2720 SAR2721 Cell Wall Synthesis
pmi
SAR0228
2.63
6.84E-03
4.17
3.54E-03
mannose-6-phosphate isomerase
3.57
2.76E-03
putative glutamine amidotransferase class-I
2.13
2.08E-03
SAR0257
lytS
autolysin sensor kinase protein
3.33
3.00E-03
SAR0258
lytR
autolysin response regulator protein
3.57
9.15E-03
SAR0259
lrgA
holin-like protein
2.22
1.20E-03
SAR0646
tagA
teichoic acid biosynthesis protein
2.78
6.80E-03
SAR0648
tagG
teichoic acid ABC transporter permease protein
2.38
1.32E-02
SAR0649
tagB
teichoic acid biosynthesis protein
2.50
4.41E-04
putative carbamate kinase
2.27
6.79E-03
SAR1143 SAR1752
hemA
SAR1807
glutamyl-tRNA reductase
2.27
3.93E-02
putative transglycosylase
2.04
8.78E-04 2.97E-02
SAR2472
gltT
putative proton/sodium-glutamate symport protein
2.04
SAR2621
cidA
holin-like protein
2.27
1.18E-02
putative dihydroorotate dehydrogenase
2.86
3.75E-03
putative acyl-CoA dehydrogenase
2.17
3.27E-02
SAR2669 Fatty Acid Metabolism
putative uridylyltransferase putative PTS system component
SAR0225
fadD
SAR0227
fadX
SAR0803
PLoS ONE | www.plosone.org
putative acetyl-CoA transferase
2.13
4.95E-02
conserved hypothetical protein
3.23
1.02E-02
9
February 2009 | Volume 4 | Issue 2 | e4344
S. aureus Response to LC-uFFAs
Table 2. Cont. Group Functions Carotenoid Biosynthesis
MRSA 252 ORF
MRSA252 Gene
MRSA252 Gene Product
Fold Change Down Regulated
P-value
SAR1278
miaA
putative isopentenylpyrophosphate transferase
2.00
9.23E-03
putative heptaprenyl diphosphate synthase
2.78
1.62E-02
heptaprenylnaphthoquinone methyltransferase
2.27
3.54E-02
putative hexaprenyl diphosphate synthase
3.13
1.79E-02
dnaA
chromosomal replication initiator protein DnaA
2.04
2.17E-03
SAR0004
recF
DNA replication and repair protein RecF
2.08
8.51E-03
SAR0028
repB
replication protein (pseudogene)
4.35
1.48E-02
SAR0485
holB
SAR1479 SAR1480
menH
SAR1481 DNA Repair and SAR0001 Replication
putative DNA polymerase III, delta’ subunit
3.03
1.26E-02
putative replication initiation protein
2.50
3.43E-02
putative 3-methylpurine glycosylase
2.22
1.87E-03
conserved hypothetical protein
2.00
2.27E-03
putative nitric oxide reductase
2.22
6.16E-04
putative formate/nitrite transporter
2.38
8.03E-03
nucleoside permease
2.94
3.96E-03
SAR0562
putative deoxyadenosine kinase protein
2.17
2.64E-02
SAR0563
putative deaminase
2.50
3.75E-03
SAR0569
putative glycosyl transferase
2.13
4.40E-03
SAR0642
ABC transporter permease protein
2.56
9.65E-03
SAR0643
ABC transporter ATP-binding protein
3.70
9.25E-03
SAR0711 SAR2429 Metabolism
SAR0246
ispD
SAR0261 SAR0302 SAR0524
nupC
SAR0655
putative Na+ dependent nucleoside transporter
2.17
2.25E-03
SAR0743
putative sodium:sulfate symporter protein
2.22
4.39E-04
SAR0847
thermonuclease precursor
3.33
3.70E-04
SAR0916
putative peptidyl-prolyl cis-trans isomerase
2.13
6.54E-03
SAR1008
putative glycosyl transferases
4.00
1.65E-03
SAR1014
acetyltransferase (GNAT) family protein
2.27
6.54E-03
SAR1090
nuc
putative protoheme IX farnesyltransferase
2.04
2.66E-02
SAR1185
putative guanylate kinase
2.78
6.16E-03
SAR1449
amino acid permease
2.50
2.65E-03
putative nucleoside diphosphate kinase
2.38
3.03E-02
SAR1598
arginine repressor
2.50
3.23E-03
SAR1627
5-formyltetrahydrofolate cyclo-ligase family protein
2.78
2.27E-03
SAR1707
putative ATPase
2.13
1.36E-02
SAR1478
ctaB
ndk
SAR1714
relA
GTP pyrophosphokinase
2.27
3.96E-03
SAR1717
secF
putative protein-export membrane protein
2.27
6.05E-03
putative acyltransferase
2.44
2.99E-02
sucrose operon repressor
2.56
1.38E-02
ammonium transporter family protein
2.04
1.65E-03
acetyltransferase (GNAT) family protein
3.03
8.77E-04
putative molybdate-binding lipoprotein precursor
2.08
2.97E-02
SAR1804 SAR2129
scrR
SAR2130 SAR2340 SAR2363
Hypothetical Genes
modA
SAR2432
CorA-like Mg2+ transporter protein
2.44
5.61E-03
SAR2493
putative formate/nitrite transporter
2.22
8.71E-03
SAR2594
ABC transporter ATP-binding protein
2.38
1.65E-03
SAR2789
putative subtilase family protease
2.04
2.27E-03
SAR0013
putative membrane protein
2.17
1.81E-02
SAR0024
conserved hypothetical protein
3.03
2.27E-03
SAR0030
hypothetical protein
2.38
6.16E-03
SAR0048
putative membrane protein
2.08
1.08E-02
SAR0061
putative membrane protein
2.08
4.25E-02
PLoS ONE | www.plosone.org
10
February 2009 | Volume 4 | Issue 2 | e4344
S. aureus Response to LC-uFFAs
Table 2. Cont. Group Functions
MRSA252 Gene Product
Fold Change Down Regulated
P-value
SAR0063
hypothetical protein
2.56
1.02E-02
SAR0075
hypothetical protein
2.04
6.16E-04
SAR0078
hypothetical protein
2.08
9.65E-03
SAR0097
putative DNA-binding protein
2.17
2.99E-03
SAR0145
putative lipoprotein
2.13
1.56E-02
SAR0197
hypothetical protein
286
2.14E-02
SAR0216
putative lipoprotein
2.04
6.16E-04
SAR0338
putative membrane protein
2.86
2.40E-03
SAR0383
abortive infection bacteriophage resistance related
4.76
1.99E-02
SAR0618
putative iron compound-binding protein
2.27
4.08E-02
SAR0673
conserved hypothetical protein
2.70
4.55E-03
SAR0694
putative bacteriocin
2.38
3.75E-03
SAR0695
putative bacteriocin-immunity membrane protein
2.22
2.08E-03
SAR0718
putative membrane protein
3.33
9.93E-04
SAR0761
putative lipoprotein
2.86
3.00E-04
SAR0793
hypothetical protein
2.56
1.58E-02
SAR0846
secreted von Willebrand factor-binding homolog
2.17
1.94E-02
SAR0890
conserved hypothetical protein
2.56
8.06E-04
SAR0893
putative membrane protein
2.13
4.74E-02
SAR0898
conserved hypothetical protein
2.70
1.59E-02
SAR0899
conserved hypothetical protein
2.33
4.94E-03
SAR0915
kinase-associated protein B
2.44
8.06E-04
SAR0970
protozoan/cyanobacterial globin family protein
2.38
1.11E-02
SAR0971
conserved hypothetical protein
2.78
1.87E-03
SAR0979
putative membrane protein
2.50
2.25E-03
SAR0981
putative esterase
2.44
1.55E-03
SAR0982
putative restriction-modification system protein
2.44
1.37E-03
SAR0983
putative restriction-modification system protein
2.56
2.42E-03
SAR0985
putative 29,59 RNA ligase family
2.13
2.32E-02
SAR0987
putative monogalactosyldiacylglycerol synthase
2.56
6.54E-03
SAR1066
putative lipoprotein
2.50
4.74E-02
SAR1085
conserved hypothetical protein
2.33
3.44E-02
SAR1086
conserved hypothetical protein
3.45
6.54E-03
SAR1095
conserved hypothetical protein
2.86
2.16E-02
SAR1114
putative cell division protein ZapA
2.38
3.96E-03
SAR1148
putative DNA-binding protein
2.38
2.66E-02
SAR1154
MraZ protein
2.50
3.00E-03
SAR1312
hypothetical protein
3.85
3.27E-02
SAR1315
hypothetical protein
2.38
2.99E-03
SAR1316
hypothetical protein
2.27
1.79E-02
SAR1320
hypothetical protein
4.00
1.46E-02
SAR1335
putative exported protein
2.27
7.38E-03
SAR1389
conserved hypothetical protein (pseudogene)
2.33
5.63E-03
SAR1448
major facilitator superfamily transporter protein
2.04
4.57E-03
SAR1556
putative phage regulatory protein
2.08
5.64E-03
SAR1558
putative phage lipoprotein
2.44
1.24E-03
SAR1559
hypothetical phage protein
2.33
4.80E-04
SAR1560
hypothetical phage protein
2.04
1.72E-02
SAR1561
putative phage membrane protein
2.13
1.10E-03
SAR1581
conserved hypothetical protein
2.86
1.81E-02
MRSA 252 ORF
MRSA252 Gene
PLoS ONE | www.plosone.org
11
February 2009 | Volume 4 | Issue 2 | e4344
S. aureus Response to LC-uFFAs
Table 2. Cont. Group Functions
MRSA252 Gene Product
Fold Change Down Regulated
P-value
SAR1592
conserved hypothetical protein
2.27
1.16E-02
SAR1699
conserved hypothetical protein
2.00
3.92E-03
SAR1706
putative transcriptional regulator
3.45
2.16E-02
SAR1708
conserved hypothetical protein
2.04
3.14E-03
SAR1770
putative membrane protein
2.13
2.99E-03
SAR1834
putative leucyl-tRNA synthetase
2.17
3.65E-02
SAR1885
hypothetical protein
2.63
6.97E-04
SAR1897
hypothetical protein
3.03
2.86E-02
SAR1935
probable phosphoesterase
2.78
2.37E-03
SAR1938
putative DNA-binding protein
2.38
2.80E-02
SAR2020
putative membrane protein
2.44
6.39E-03
SAR2035
putative exported protein
2.86
1.61E-02
SAR2113
hypothetical protein
2.86
4.64E-02
SAR2114
hypothetical protein
2.56
3.43E-02
SAR2115
hypothetical protein
2.86
4.22E-02
SAR2118
putative membrane protein
2.00
3.28E-03
SAR2119
membrane anchored protein
2.44
1.08E-03
SAR2156
pemK-like protein
3.03
5.61E-03
SAR2219
hypothetical protein
2.78
6.21E-03
SAR2261
putative membrane protein
2.08
6.02E-04
SAR2263
putative membrane protein
2.17
2.89E-03
SAR2299
hypothetical protein
2.04
3.47E-03
SAR2369
putative acyl-CoA dehydrogenase
2.86
1.94E-03
SAR2425
putative membrane protein
2.13
5.63E-03
SAR2428
putative membrane protein
2.00
3.23E-03
SAR2435
putative acyl hydrolase
2.50
3.02E-02
SAR2439
tetR family regulatory protein
2.22
3.23E-03
SAR2473
putative exported protein
3.85
3.97E-03
SAR2500
putative lipoprotein
2.86
8.48E-04
SAR2546
putative lipoprotein
3.13
2.76E-02
SAR2595
putative membrane protein
2.78
1.65E-03
SAR2718
putative exported protein
2.04
4.80E-04
SAR2719
transcriptional regulator
3.13
3.07E-04
SAR2792
putative membrane protein
3.85
2.78E-03
SAR2793
putative membrane protein
3.70
8.17E-04
MRSA 252 ORF
MRSA252 Gene
doi:10.1371/journal.pone.0004344.t002
Several genes showed fluctuations in relative transcript levels during the growth cycle. For example, arcA transcription varied over the different sample points, with gene up-regulation at OD600 = 3.0 for the linoleic growth experiment as per the microarray results. However, arcA was down-regulated in postexponential phasef growth phase in the presence of linoleic acid. The observation of increased expression of RNAIII, hla and spa in MRSA252 in response to LC-uFFAs is significantly different to previously published experiments for these transcripts in alternative strains [34,35]. The expression of a large subset of genes, confirmed by qRT-PCR to be altered following exposure of MRSA252 to linoleic acid (Table 7), were subsequently examined in SH1000 to determine whether they were similarly regulated (Table 8). This revealed that in SH1000 the up- or downregulation of several genes was in direct contrast to the pattern
levels of the density-signalling effector RNAIII on transcription of regulated genes (e.g. spa, hla and sarA). qRT-PCR analysis was performed on MRSA252 genes under linoleic and oleic acid growth exposure conditions. The RNAIII and clpB transcripts were consistently up- or down-regulated, respectively, at all of the points tested during growth; at OD600 = 8 RNAIII was massively upregulated (.150-fold) in the presence of either linoleic or oleic acid. The transcription of sarA was up-regulated 1.5- to 2-fold in postexponential phase in these conditions. Post-exponential transcription of hla was .6-fold higher after growth with either linoleic or oleic acid in comparison with the untreated control. Interestingly, this increase was moderate compared to that observed for RNAIII of the agr locus, which is known to up-regulate expression of hla. This reflects the complex regulation of hla and may be due to the increase in sarA levels. PLoS ONE | www.plosone.org
12
February 2009 | Volume 4 | Issue 2 | e4344
S. aureus Response to LC-uFFAs
Table 3. MRSA252 genes up-regulated during growth in the presence of linoleic acid (0.01mM) (linoleic acid growth exposure).
Group Functions
MRSA252 ORF
MRSA252 Gene
MRSA252 Gene Product
Fold Change Up Regulated
P-value
Virulence Factors and Regulators
SAR0279
esxA
virulence factor esxA
5.93
7.03E-08
Metabolism
Hypothetical Genes
SAR0280
esaA
putative membrane protein
4.32
4.53E-06
SAR0281
essA
putative membrane protein
2.70
1.66E-03
SAR0282
esaB
conserved hypothetical protein
2.65
3.35E-03
SAR0284
essC
putative membrane protein
2.56
1.25E-03
SAR0284v
essC
putative membrane protein
2.49
4.23E-03
SAR2123
agrB
putative autoinducer processing protein
9.36
1.74E-05
SAR2125
agrC
autoinducer sensor protein
5.39
4.33E-05
SAR2126
agrA
autoinducer sensor protein response regulator protein
2.25
1.41E-03
agrIII
agrIII
Class III accessory gene regulator (agr) locus
8.71
4.16E-06
RNAIII
RNAIII
RNAIII accessory gene regulator (agr) locus
10.20
1.21E-05
SAR0150
adhE
putative aldehyde-alcohol dehydrogenase
2.25
1.67E-02
SAR0190
glcA
glucose-specific PTS transporter protein, IIABC component
2.05
3.76E-02
SAR0829
pgk
phosphoglycerate kinase
2.76
2.16E-03
SAR0830
tpiA
triosephosphate isomerase
2.75
1.69E-03
SAR0831
pgm
putative phosphoglycerate mutase
2.83
2.22E-03
SAR0832
eno
putative enolase
2.15
5.88E-03
SAR2296
alsD
putative acetolactate decarboxylase
2.43
3.32E-03
SAR2297
alsS
putative acetolactate synthase
2.17
1.41E-03
SAR2618
glcB
PTS system, glucose-specific IIABC component
2.78
1.41E-02
SAR2711
arcC
carbamate kinase
2.40
3.41E-02
SAR2712
arcD
arginine/ornithine antiporter
2.21
1.88E-02
SAR2713
arcB
putative ornithine carbamoyltransferase
2.31
1.88E-02
SAR2714
arcA
arginine deiminase
2.89
1.41E-02
SAR0111
putative myosin-crossreactive antigen
2.44
6.52E-05
SAR0277
putative exported protein
3.76
4.22E-05
SAR0278
putative CHAP domain protein
2.89
1.22E-04
SAR0299
possible pseudogene
2.95
3.30E-03
SAR0301
putative membrane protein
3.44
1.93E-03
SAR0385
similar to putative pathogenicity island gene orf3
4.09
1.93E-03
SAR0839
putative lipoprotein
3.36
5.41E-05
SAR1564
hypothetical protein
2.09
5.32E-04
SAR1565
putative lipoprotein
2.38
3.02E-03
SAR2426
putative membrane protein
2.09
2.11E-03
SAR2427
ABC transporter ATP-binding protein
2.14
4.82E-03
SAR2428
putative membrane protein
3.73
1.21E-05
SAR2569
hypothetical protein
6.01
4.75E-02
doi:10.1371/journal.pone.0004344.t003
observed in MRSA252. For example, where both microarray data and qRT-PCR data showed that there was a large up-regulation of RNAIII after challenge or growth exposure in MRSA252, pronounced down-regulation was observed in SH1000 by qRTPCR. Contrasts in regulation between MRSA252 and SH1000 were also observed for sarA, spa and sasF. However, several genes not predicted to be RNAIII-regulated, including lytR, clpB, fabI, murG, and arcA exhibited similar patterns of regulation in both strains under the conditions tested. PLoS ONE | www.plosone.org
Proteomic analysis The proteome of MRSA252 was analysed by 2D-PAGE to identify protein expression changes in exponentially growing cells that were exposed to linoleic acid under the challenge conditions used for the microarray experiments. This analysis was performed to determine whether the large-scale transcriptional modulation described above was translated into a correspondingly large-scale proteomic shift. Under these conditions, 58 proteins were significantly (P#0.05) up-regulated $2-fold and 15 proteins were 13
February 2009 | Volume 4 | Issue 2 | e4344
S. aureus Response to LC-uFFAs
Table 4. MRSA252 genes down-regulated during growth in the presence of linoleic acid (0.01mM ) (linoleic acid growth exposure).
Group Functions Stess Response
MRSA252 ORF
MRSA252 Gene
SAR0525
ctsR
SAR0526
Metabolism
Fold Change Down Regulated
MRSA252 Gene Product
P-value
stress regulatory protein
3.57
6.52E-05
uvrB/uvrC domain protein
4.35
4.16E-06
SAR0528
clpC
putative stress response-related Clp ATPase
4.17
5.47E-05
SAR0823
clpP
putative ATP-dependent Clp protease proteolytic subunit
2.04
3.82E-04
SAR0938
clpB
putative ATPase subunit of an ATP-dependent protease
9.09
5.72E-06
SAR1657
dnaK
chaperone protein
2.94
5.41E-05
SAR1658
grpE
GrpE protein
3.57
7.03E-08
SAR2116
groEL
60 kDa chaperonin
2.44
1.05E-03
SAR2117
groES
10 kDa chaperonin
2.78
1.92E-04
SAR0189
putative thiamine pyrophosphate enzyme
2.94
1.51E-04
SAR0208
putative sugar transport system permease
2.94
2.68E-02
SAR0209
putative oxidoreductase
4.75
1.21E-02
SAR0210
putative oxidoreductase
9.09
3.75E-03
SAR0527
putative phosphotransferase
4.55
7.03E-08
SAR0752
putative phosphofructokinase
2.44
3.20E-02
SAR0753
fruA
fructose-specific PTS system component
3.45
1.21E-02
SAR1274
glpF
putative glycerol uptake facilitator protein
3.70
3.36E-03
SAR1275
glpK
glycerol kinase
4.17
6.42E-04
SAR1276
glpD
glycerol-3-phosphate dehydrogenase
7.69
4.83E-06
SAR2244
mtlA
mannitol-specific PTS system component
2.08
4.75E-02
SAR2445
hrtA
Heme-regulated transporter ATPase
2.94
3.11E-04
ABC transporter ATP-binding protein
2.33
3.32E-03
putative membrane protein
2.56
2.28E-02
conserved hypothetical protein
11.11
3.02E-03
predicted role in ipenimen resistance
2.27
3.15E-02
SAR0750
conserved hypothetical protein
2.22
1.32E-02
SAR0939
LysR family regulatory protein
2.94
5.81E-05
SAR2595
putative membrane protein
2.04
7.18E-03
SAR2594 Hypothetical Genes SAR0100 SAR0211 SAR0584
vraX
doi:10.1371/journal.pone.0004344.t004
significantly (P#0.05) down-regulated $2-fold. MALDI-MS was used to identify the most intense protein spots on the gel corresponding to proteins that were modulated by linoleic acid, and the identities of 38 up-regulated and 5 down-regulated proteins were unambiguously determined (Table 9 and 10). There was strong agreement between the observed changes in protein expression due to linoleic acid challenge exposure and the encoded functions of the genes modulated in the microarray experiments. In terms of the assigned metabolic pathways, the interpreted effects of the fatty acid upon the cell were therefore corroborated. Proteins associated with stress responses and PG and MK biosynthesis were modulated in response to linoleic acid. Similarly, the CapA protein involved in capsule biosynthesis was upregulated over 3-fold. From the proteomic data, challenge with linoleic acid resulted in up-regulation of glycolysis pathway proteins and those linked to pyruvate metabolism. Moreover, the proteomic data were often complementary to those from the microarrays. Several proteins within the glycolysis and pyruvate metabolism pathways were up-regulated (e.g Gap1, Pgi), whereas all glycolytic genes except eno were up-regulated in the microarray experiment. A few contradictions were observed between the microarray and proteomics data. The ald2, ackA, ispD, SAR0985 PLoS ONE | www.plosone.org
and SAR2369 proteins were determined by proteomics to be upregulated but were down-regulated according to microarray analysis. In addition to linoleic acid, the effect of the skin-associated LCuFFA hexadecenoic acid [C16:1 (n-6)] on the cellular proteome was studied to determine whether there was a common response to LCuFFAs on S. aureus MRSA252. Analysis of 2D-SDS-PAGE gels revealed strong spot conservation for proteins exhibiting modulated expression in response to hexadecenoic acid compared to linoleic acid. Under challenge conditions with 0.1 mM hexadecenoic acid, 95 proteins were significantly (P#0.05) up-regulated $2-fold and 7 proteins were significantly (P#0.05) down-regulated $2-fold. MALDI-MS was used to identify 63 of the most intense protein spots on the gel corresponding to proteins that were modulated by linoleic acid and the identities of 56 up-regulated and 5 downregulated proteins were unambiguously determined (Table 11 and 12). Many of the same proteins, or different proteins within the same metabolic pathways e.g. glycolysis and pyruvate metabolism, were identified after exposure to hexadecenoic acid and linoleic acid. This indicates that there is commonality in the metabolic response to the cellular perturbations caused by exposure to these LC-uFFAs, which differ in chain length, and the number and position of double bonds. 14
February 2009 | Volume 4 | Issue 2 | e4344
S. aureus Response to LC-uFFAs
Table 5. MRSA252 genes up-regulated during growth in the presence of oleic acid (0.01 mM) (oleic acid growth exposure).
Group Functions Virulence Factors and Regulators
Metabolism
Hypothetical Genes
MRSA252 ORF
MRSA252 Gene
MRSA252 Gene Product
Fold Change Up Regulated
P-value
SAR0279
esxA
virulence factor EsxA
3.20
1.51E-05
SAR0280
esaA
putative membrane protein
2.67
1.07E-04
SAR2122
hld
delta-hemolysin precursor
6.02
5.53E-04
SAR2123
agrB
putative autoinducer processing protein
6.54
3.55E-07
SAR2125
agrC
autoinducer sensor protein
3.77
9.89E-05
SAR2126
agrA
autoinducer sensor protein response regulator protein
2.01
2.21E-04
agrIII
agrIII
Class III accessory gene regulator (agr) locus
6.30
1.12E-07
RNAIII
RNAIII
RNAIII accessory gene regulator (agr) locus
7.02
3.21E-05 1.34E-02
SAR0753
fruA
fructose-specific PTS system component
2.07
SAR2296
alsD
conserved hypothetical protein
2.05
4.08E-03
SAR2297
alsS
putative acetolactate synthase
2.49
1.19E-03
SAR2711
arcC
carbamate kinase
4.09
6.41E-03
SAR2712
arcD
arginine/ornithine antiporter
3.55
7.34E-04
SAR2713
arcB
putative ornithine carbamoyltransferase
3.41
1.97E-03
SAR2714
arcA
arginine deiminase
4.03
3.28E-03
SAR0277
putative exported protein
2.00
7.31E-03
SAR0301
putative membrane protein
2.15
2.54E-02
SAR0385
putative membrane protein
2.88
8.02E-03
SAR0839
putative lipoprotein
2.07
1.97E-03
SAR1448
major facilitator superfamily
2.03
1.32E-02
SAR2710
putative regulatory protein
2.62
6.93E-05
doi:10.1371/journal.pone.0004344.t005
Identification of survival mutants
Autolysis assays
Allelic replacement mutants were constructed in the genes sasF and arcA, which displayed altered transcription in response to linoleic acid and a further mutant was constructed in vraS, encoding a cell wall synthesis regulator. The contribution of these genes to survival in the presence of LC-uFFAs was tested on agar plates containing linoleic acid. Additionally, existing mutants of genes identified by microarray analysis to display altered transcription in response to linoleic acid, or regulators of these genes, were tested. Furthermore, a 5,000 clone Tn917 mutant library was also screened to identify survival mutants. Analysis of the mutant clones was performed in SH1000 since MRSA252 is resistant to most antibiotics used for gene inactivation studies. Importantly, many of the mutant strains tested exhibited increased sensitivity to LC-uFFAs when compared to the wild-type, including those harbouring mutations in the genes: sasF (Liv694), crtM (Liv681), arcA (Liv692), sigB (Liv130), agr (Liv038) and sarA (Liv039) (Fig. 2A, 2B). In contrast clfA (Liv442), vraS (Liv718), katA (Liv750), lytSR (Liv101) and clpC (Liv671) did not contribute to survival under the conditions tested in a SH1000 background. Screening of the Tn917 transposon library identified two further clones with defective survival. Sequencing upstream and downstream of the transposon in these mutants revealed insertion of Tn917 in the SAR2632 (Liv766) and vraE (Liv753) genes. Complementation of the fatty acid sensitivity of the sasF, arcA, vraE and SAR2632 mutants was achieved by individually cloning each gene into the low copy number shuttle vector pSK5630 [75] and transforming each mutant with the relevant plasmid. Complementation restored survival of each mutant in LC-uFFA resistance assays (data not shown).
Cells grown in the presence of linoleic acid under constant growth conditions displayed reduced expression of the CtsR regulon, which is known to impact on cell autolysis [47]. Consequently we addressed the impact of the presence of LCuFFAs upon autolysis of treated and control cells of MRSA252 and SH1000. A significantly increased rate of autolysis was observed in linoleic acid treated cells of each strain (Fig. 3A, 3B). This increase is in accordance with the reduced expression of the CtsR regulon in treated cells.
PLoS ONE | www.plosone.org
Cell hydrophobicity IsdA reduces cell surface hydrophobicity and acts to increase staphylococcal resistance to LC-uFFAs [34] while a GML resistant mutant of Enterococcus faecalis was found to be less hydrophobic than the wild type parent strain [48]. Partitioning of cells in the non-polar solvent hexadecane was measured to determine whether modulating cell hydrophobicity was a S. aureus response to growth in the presence of fatty acids. Growth in the presence of 0.1 mM linoleic acid resulted in both strains exhibiting decreased partitioning indicating a decrease in cell surface hydrophobicity (Fig. 3C). The change in cell hydrophobicity was particularly dramatic for MRSA252 with partitioning reduced from over 90% to less than 20% of cells upon growth in the presence of linoleic acid. The adaptive decrease in cell hydrophobicity makes conditions less favourable for interactions between the cell and the amphipathic fatty acid. Alterations to cell surface charge via the dlt and mprF loci have also been linked to S. aureus evasion of a number of innate immune system components including cationic antimicrobial 15
February 2009 | Volume 4 | Issue 2 | e4344
S. aureus Response to LC-uFFAs
Table 6. MRSA252 genes down-regulated during growth in the presence of oleic acid (0.01 mM) (oleic acid growth exposure).
Group Functions Stress Response
MRSA252 ORF
MRSA252 Gene MRSA252 Gene Product
SAR0525
ctsR
SAR0526 SAR0527
Metabolism
P-value
stress regulatory protein
3.23
3.26E-05
uvrB/uvrC domain protein
4.17
3.26E-05
putative phosphotransferase
3.85
2.20E-07
SAR0528
clpC
putative stress response-related Clp ATPase
3.23
1.01E-04
SAR0938
clpB
putative ATPase subunit of an ATP-dependent protease
8.33
1.30E-06
SAR1119
uvrC
putative excinuclease ABC subunit C
3.70
7.00E-03
SAR1657
dnaK
chaperone protein
2.63
1.01E-04
SAR1658
grpE
GrpE protein
2.86
4.78E-06
SAR2116
groEL
60 kDa chaperonin
2.38
1.82E-03
SAR2117
groES
10 kDa chaperonin
2.44
2.21E-04
SAR0120
putative ornithine cyclodeaminase
2.38
4.46E-02
SAR0354
putative homocysteine S-methyltransferase
2.13
1.60E-02
SAR0452
putative NADH-Ubiquinone protein
2.00
1.32E-02 9.16E-03
SAR1274
glpF
putative glycerol uptake facilitator protein
4.35
SAR1275
glpK
glycerol kinase
3.57
1.59E-02
SAR1276
glpD
aerobic glycerol-3-phosphate dehydrogenase
4.76
3.26E-05
SAR1849
Hypothetical Genes
Fold Change Down Regulated
proline dehydrogenase
3.23
8.02E-03
SAR2445
hrtA
Heme-regulated transporter ATPase
2.94
1.01E-04
SAR2446
hrtB
Heme-regulated transporter permease
2.22
3.98E-02
SAR2582
gntP
putative gluconate permease
5.88
4.53E-03
SAR2583
gntK
putative gluconokinase
4.55
3.60E-02
SAR0939
LysR family regulatory protein
2.86
2.76E-04
SAR2581
hypothetical protein
4.55
3.99E-02
doi:10.1371/journal.pone.0004344.t006
Table 7. qRT-PCR analysis of gene expression in MRSA252.
ORF
Gene
Linoleic Challenge
Linoleic Growth
Oleic Growth
Linoleic Growth
Oleic Growth
OD600 = 3
OD600 = 3
OD600 = 8
OD600 = 8 22.92 (0.24)
SAR0114
spa
1.46 (0.37)
1.01 (0.07)
21.08 (0.11)
23.03 (0.14)
SAR0223
fadA
3.10 (0.08)
nd
nd
nd
nd
SAR0225
fadD
3.16 (0.61)
21.34 (0.03)
21.88 (0.02)
21.06 (0.03)
21.01 (0.02)
SAR0258
lytR
25.03 (0.01)
nd
nd
nd
nd
SAR0625
sarA
3.84 (0.81)
1.10 (0.11)
21.12 (0.07)
1.52 (0.55)
2.05 (1.12)
SAR2621
cidA
21.93 (0.02)
1.52 (0.03)
1.41 (0.03)
22.75 (0.01)
21.39 (0.02)
SAR0938
clpB
3.90 (0.08)
28.55 (0.01)
210.31 (0.01)
23.16 (0.01)
23.00 (0.01)
SAR0978
fabI
1.25 (0.02)
nd
nd
nd
nd
SAR1136
hla
21.60 (0.20)
1.19 (0.19)
21.71 (0.09)
6.38 (2.91)
7.88 (5.16)
SAR1344
katA
7.27 (0.18)
nd
nd
nd
nd
SAR1430
murG
7.59 (0.22)
nd
nd
nd
nd
SAR2187
fabZ
3.37 (0.64)
21.10 (0.02)
1.40 (0.02)
1.10 (0.04)
1.20 (0.06)
SAR2643
crtM
3.72 (0.08)
nd
nd
nd
nd
SAR2714
arcA
1.61 (0.03)
1.86 (0.04)
2.17 (0.04)
22.19 (0.02)
21.50 (0.01)
SAR2725
sasF
31.86 (0.69)
nd
nd
nd
nd
RNAIII
7.86 (0.15)
56.14 (1.40)
34.28 (0.74)
156.12 (6.95)
153.30 (2.81)
The values correspond to the fold change for each gene tested under the relevant fatty acid treatment conditions when compared to the untreated control. The standard deviation for each measurement is in parentheses. nd, not detemined. ORF indicates the gene locus in MRSA252 (http://www.genedb.org/genedb/saureusMRSA/). doi:10.1371/journal.pone.0004344.t007
PLoS ONE | www.plosone.org
16
February 2009 | Volume 4 | Issue 2 | e4344
S. aureus Response to LC-uFFAs
expression, but down-regulation of agr-regulated virulence determinants, including alpha toxin (hla). MRSA252 has a nonsense mutation in hla, which does not affect hla mRNA measurements by qRT-PCR but ablates activity of the encoded protein preventing activity measurements [52]. In this study, transcription of hla in MRSA252 was only up-regulated in the presence of linoleic or oleic acid in the post-exponential growth phase demonstrating maintenance of its temporal expression, despite up-regulation of RNAIII at earlier phases of growth. Analysis by qRT-PCR revealed contrasting regulation of RNAIII synthesis in SH1000 and MRSA252 in response to treatment with LC-uFFAs. RNAIII levels were reduced after growth exposure to linoleic or oleic acid during growth of SH1000. The data reported here therefore highlights important differences between the effects of these LCFFAs between strains. Previous studies identified a fatty acid modifying enzyme (FAME) in strains of S. aureus, which esterifies LC-FFAs with cholesterol, thereby reducing toxicity [32]. However, this activity was demonstrated to be agr-regulated [29,53], producing the anomaly that in strains with SH1000-like regulation, expression of the detoxifying enzyme would be downregulated upon exposure to its substrate. MRSA252 is a successful epidemic strain of S. aureus and the ability to persist in an environment containing LC-uFFAs such as on the skin surface (hexadecenoic acid) or in skin infections (linoleic and oleic acid) would aid the transmission of the organism. In this scenario, the specific up-regulation of agr in response to LC-uFFAs observed in MRSA252 (EMRSA-16) may contribute towards its success as an epidemic strain. Superior skin colonisation was previously suggested as a reason for the epidemic nature of the EMRSA-15 and -16 strains, which together are responsible for over 95% of MRSA from cases of nosocomial bacteraemia in the UK [54,55]. Microarray analysis revealed further virulence factors exhibiting increased transcription, including the esx locus, which encodes a specific secretion system and the ESAT-6-like proteins that have been confirmed as having a role in the pathogenesis of murine abscesses [41]. Increased transcription of the esx locus was only observed after growth exposure to linoleic or oleic acid and not in response to linoleic acid challenge conditions. Increased transcription of the arcABDC operon, encoding the arginine deiminase (ADI) pathway enzymes, was observed under the same conditions where the esx locus is up-regulated. The ADI pathway enables the utilisation of arginine as an energy source under anaerobic conditions of growth. Concomitant with the expression of the ADI pathway, there was an up-regulation of many glycolytic enzymes, suggesting that a net effect of growth exposure to linoleic acid was metabolic alterations leading toward anaerobic growth. To test the importance of the ADI pathway under these conditions, an arcA allelic replacement mutant of SH1000 was generated (arcA was transcriptionally up-regulated in both SH1000 and MRSA252). The arcA strain was found to display a reduction in growth on agar plates containing 1 mM linoleic acid, with a 25-fold lower survival than the parental strain. The alteration in metabolism via upregulation of the ADI pathway is therefore important for survival under these conditions. The ADI pathway may also contribute to virulence since some ST8-SCCmecIVa (USA300) MRSA clones carry the arginine catabolism mobile element (ACME), which contains an extra copy of the arc operon [56]. This leads to the hypothesis that the arcABDC operon facilitates pathogenicity by increasing survival of S. aureus in the presence of LC-uFFAs. The sasF gene showed the largest change in expression of any gene in response to linoleic acid challenge (.16-fold and .30-fold upregulation in MRSA252 by microarray and qRT-PCR, respectively). Expression of SasF, an LPXAG motif cell wall-anchored surface protein, is repressed by TcaR, the teicoplanin-associated locus
Table 8. qRT-PCR analysis of gene expression in SH1000.
ORF
Gene
Linoleic Challenge
Linoleic Growth
Oleic Growth
OD600 = 3
OD600 = 3
SAR0114
spa
2.19 (0.09)
21.94 (0.02)
1.66 (0.04)
SAR0258
lytR
22.31 (0.02)
nd
nd
SAR0625
sarA
1.26 (0.05)
23.79 (0.02)
23.45 (0.03)
SAR0938
clpB
1.95 (0.08)
22.11 (0.02)
22.58 (0.03)
SAR0978
fabI
21.20 (0.04)
nd
nd
SAR1136
hla
23.60 (0.01)
22.11 (0.02)
22.58 (0.03) nd
SAR1430
murG
1.84 (0.11)
nd
SAR2643
crtM
1.32 (0.05)
nd
nd
SAR2714
arcA
nd
2.19 (0.10)
4.39 (0.18)
SAR2725
sasF
1.49 (0.06)
nd
nd
RNAIII
21.79 (0.03)
23.29 (0.01)
21.95 (0.01)
The values correspond to the fold change for each gene tested under the relevant fatty acid treatment conditions when compared to the untreated control. The standard deviation for each measurement is in parentheses. nd, not detemined. ORF indicates the gene locus in MRSA252 (http://www.genedb.org/ genedb/saureusMRSA/) that was tested in SH1000. doi:10.1371/journal.pone.0004344.t008
peptides [49–51]. The SH1000 mutants vraE, sasF, or SAR2632, identified in this study as having decreased survival upon exposure to linoleic acid, did not exhibit altered hydrophobicity in this partitioning assay (data not shown). This indicates that the products of these three genes interact with LC-uFFAs in a manner that does not involve alterations to cell surface hydrophobicity.
Murine arthritis virulence assay A murine arthritis model of infection was used to determine a role for the LC-uFFA survival genes sasF and vraE in pathogenesis. This model of infection also reports on systemic inflammation and abscess formation in kidneys and was therefore relevant for in vivo investigation of fatty acid survival mutants. Neither the sasF nor vraE mutations showed a significant reduction in arthritis development of SH1000 in this model (data not shown). However, a significantly reduced weight loss (P,0.05) was observed for both sasF and the vraE mutants for 3 out of 5 weight measurements over the 14 day experiment, when compared to the SH1000 parent strain (Fig. 4A). In contrast, while a reduced bacterial load of both mutant strains was observed in the kidney compared to the wild type this was not found to be significant (p = 0.075) (Fig. 4B). Collectively, these data suggest that SasF and VraE might make contributions to the pathogenesis of systemic inflamation, but not to the development of arthritis.
Discussion Analysing the response of MRSA252, an EMRSA-16 clone, to the LC-uFFAs linoleic [C18:2 (n-6,9)] and oleic [C18:1 (n-6)] acid revealed modulated expression of many genes, including those encoding virulence determinants. After exposure of exponentially growing cells to linoleic acid there was a very large increase in RNAIII compared to control cells, and this was also observed at all stages of growth when either linoleic or oleic acid were present from the time of inoculation. This observed up-regulation of RNAIII synthesis was unexpected given previous reports on the effects of GML, a lauric acid monoester, and the LC-uFFA hexadecenoic acid [C16:1 (n-6)] on S. aureus gene expression [34,35]. In those studies, there was no change in agr (RNAIII) PLoS ONE | www.plosone.org
17
February 2009 | Volume 4 | Issue 2 | e4344
S. aureus Response to LC-uFFAs
Table 9. MRSA252 proteins up-regulated following the addition of linoleic acid (0.1 mM) to exponentially growing cells (linoleic acid challenge).
Group Functions
MRSA252 ORF
MRSA252 Gene MRSA252 Gene Product
Fold Change Up Regulated
P-value
Virulence Factors and Regulators
SAR2745
capA
3.36
2.27E-04
Energy Metabolism SAR0140
deoC1
SAR0217 SAR0394
Capsular polysaccharide biosynthesis protein deoxyribose-phosphate aldolase
4.34
2.49E-03
formate acetyltransferase
2.30
1.50E-03
phosphoglycerate mutase family protein
2.94
1.67E-02
SAR0828
gap1
glyceraldehyde 3-phosphate dehydrogenase 1
2.07
3.53E-03
SAR0924
pgi
glucose-6-phosphate isomerase
4.18
7.43E-03
SAR1451
ald2
alanine dehydrogenase 2
2.13
1.32E-03
SAR1789
ackA
acetate kinase
2.81
6.97E-04
SAR2506
dpgm
putative phosphoglycerate mutase
2.15
3.52E-02
SAR2685
mqo2
malate:quinone oxidoreductase
3.39
8.08E-03
DNA Repair and Replication
SAR1639
dnaG
DNA primase
2.66
2.61E-03
SAR1996
lig
DNA Ligase
2.09
6.11E-04
Protein Synthesis
SAR0552
fus
elongation factor G
4.47
2.51E-04
SAR0552
fus
elongation factor G
2.10
2.09E-02
SAR1216
trmD
putative tRNA (guanine-7-)-methyltransferase
2.33
4.84E-04
SAR1720
queA
S-adenosylmethionine:tRNA ribosyltransferase-isomerase
2.11
1.68E-02
SAR2309
rpoA
RNA polymerase alpha subunit
2.61
2.40E-03
SAR0470
lysR
family regulatory protein
2.20
1.07E-02
SAR1762
thrS
threonyl-tRNA synthetase
2.77
9.07E-04
SAR1991
gatB
aspartyl/glutamyl-tRNA amidotransferase subunit B
2.25
3.52E-02
SAR2201
glyA
serine hydroxymethyltransferase
3.55
8.43E-03
SAR2201
glyA
serine hydroxymethyltransferase
2.15
3.74E-03
Peptidoglycan Synthesis
Carotenoid Biosynthesis
SAR1378
prephenate dehydrogenase
2.37
8.08E-03
Miscellaneous
SAR0218
putative pyruvate formate-lyase activating enzyme
2.60
3.46E-02
SAR0403
putative DNA binding protein
2.72
3.48E-02
SAR2007
putative oxygenase/mitric oxide synthase
2.04
7.13E-03
SAR2007 Metabolism
putative nitric oxide synthase
2.66
2.38E-02
SAR0150
adhE
putative aldehyde-alcohol dehydrogenase
3.48
5.07E-03
SAR0246
ispD
2-C-methyl-D-erythritol 4-phosphate cytidylyltransferase
2.43
4.84E-04
SAR0246
ispD
2-C-methyl-D-erythritol 4-phosphate cytidylyltransferase
2.21
8.75E-03
putative haloacid dehalogenase-like hydrolase
2.22
1.01E-02
SAR0564 SAR1070
pdhD
dihydrolipoamide dehydrogenase
2.22
2.62E-02
SAR2353
mobA
molybdopterin-guanine dinucleotide biosynthesis protein
3.12
8.32E-04
SAR2513
6-carboxyhexanoate–CoA ligase
4.84
4.13E-05
SAR2641
putative aminotransferase
2.07
1.54E-02
Hypothetical ProteinsSAR0985
putative RNA ligase protein
2.31
2.12E-02
SAR2064
hypothetical phage protein
2.06
1.41E-03
SAR2369
Acyl-CoA dehydrogenase-related protein
3.36
4.69E-03
doi:10.1371/journal.pone.0004344.t009
regulator [42,57]. The tcaR gene was found by microarray analysis to be up-regulated (.3-fold) in MRSA252 under the linoleic challenge conditions (Table 1). However, the SH1000 strain harbours a truncated copy of tcaR [42,58] and synthesises a non-functional protein. This could explain why the sasF gene was only slightly upregulated in SH1000 since its transcription may already be very high as its expression is reduced as part of the TcaR regulon. Many of the PLoS ONE | www.plosone.org
differences observed in the transcriptional responses of SH1000 and MRSA252 to the presence of fatty acids (Table 7, 8) are thus likely to be due to differential responses modulating RNAIII production, altered sarA transcription and differences between the strains in respect of the functionality of TcaR. The importance of sasF transcription for adaptation and survival of S. aureus to linoleic acid was tested by constructing an allelic replacement mutant in SH1000. 18
February 2009 | Volume 4 | Issue 2 | e4344
S. aureus Response to LC-uFFAs
Table 10. MRSA252 proteins down-regulated following the addition of linoleic acid (0.1 mM) to exponentially growing cells (linoleic acid challenge).
Group Functions
MRSA252 ORF
MRSA252 Gene
MRSA252 Gene Product
Fold Change Down Regulated
P-value
Protein Synthesis
SAR0927
spsB
signal peptidase Ib
5.88
9.88E-04
SAR1755
tig
trigger factor
2.56
1.93E-02
putative membrane protein
2.17
2.05E-02
Peptidoglycan Synthesis
SAR1284
SAR2179 glnA
glutamine synthetase
2.33
5.00E-02
Metabolism
SAR0814
hprK
kinase/phosphorylase
3.03
6.66E-03
doi:10.1371/journal.pone.0004344.t010
The sasF mutant showed much reduced survival on agar plates containing 1 mM linoleic acid, exhibiting a 6-fold lower level of survival than the parental strain (Fig. 2A). The expression of this cell wall-anchored protein is therefore important for survival under these conditions. SasF may also contribute to virulence since in a murine arthritis model of infection a sasF allelic replacement mutant of SH1000 caused significantly less weight loss of the animals compared to control cells (Fig. 4A). Reduced numbers of bacteria were harvested from the kidney in mice infected with the sasF mutant strain compared to the control but the difference was not significant (Fig. 4B). SasF did not significantly affect development or severity of arthritis. A screen for additional mutants of SH1000 that were defective for survival in the presence of linoleic acid identified several Tn917 transposants from a 5,000 clone library of mutants. Sequencing located the transposons within genes encoding VraE (ABC transporter permease) and SAR2632 (MMPL domain, putative efflux pump). The mutants Liv753 (vraE) and Liv766 (SAR2632) had reduced survival using this agar plate-based assay exhibiting 130-fold and 4-fold reductions in viability, respectively, at 1 mM linoleic acid (Fig. 2A). Each of these genes encodes transporter proteins of unknown function. The gene vraE is located downstream of vraD in a bicistronic operon and is a member of the GraSR regulon proposed to regulate traffic of cell wall substrates [59,60]. Two studies have shown that S. aureus vraE mutants display decreased resistance to meticillin and increased susceptibility to human b-defensin 3. [61,62]. VraE may also contribute to virulence, since in a murine arthritis model of infection a vraE allelic replacement mutant of SH1000 resulted in significantly less weight loss of the animals compared to control cells (Fig. 4A). Reduced numbers of bacteria were harvested from the kidney in mice infected with the vraE mutant strain compared to control but the difference was not significant (Fig. 4B). VraE did not significantly affect the development or severity of arthritis (data not shown). SAR2632 is a predicted transporter protein of the MMPL domain family proposed to be involved in lipid transport [63]. The identification of cell envelope mutants correlated with the gene expression and proteomic data, in which altered levels of cell wall synthesis and regulation components was observed (Fig. 5A). An increase in autolysis was observed under growth exposure conditions, although whether this is due to changes in expression of PG synthesis genes or down-regulation of the CtsR regulon remains unelucidated. The overall up-regulation of many cell wall synthesis genes could have two possible explanations. Firstly, the increased synthesis may be required to maintain the integrity of the cell wall, damaged due to loss of material through the precipitation of PG by LC-uFFAs as described by Campbell et al. PLoS ONE | www.plosone.org
[25]. The binding of LC-uFFAs to PG would not be unexpected given that chitosan, which has a very similar structure to PG, has been shown to bind lipids [64]. Secondly, an increase in cell wall and capsule synthesis could act as a defense mechanism since an increase in ionically charged material surrounding the cell would mitigate against access of the non-polar carbon chain of LC-uFFAs to the cell membrane. Reduced cell surface hydrophobicity and increased thickness of the cell wall have been suggested as Grampositive defense mechanisms to limit interactions with lipids [34,48]. Therefore, the reduced cell surface hydrophobicity of both the MRSA252 and SH1000 strains, observed here following overnight growth in the presence of linoleic acid, represents a pathogen countermeasure to this component of the innate immune system. Previous studies have used gene expression profiling to determine the cellular pathway targeted by antimicrobial agents [65,66]. In this study, there was no change in expression of fatty acid biosynthesis genes, other than fabZ, which is located on the same operon as the PG synthesis gene murA1. This suggests that the anti-staphylococcal toxicities of the LC-uFFAs used in this study are not a consequence of inhibiting fatty acid biosynthesis. Prior studies on the action of LC-uFFAs upon cells of S. aureus demonstrated membrane perturbations [12,18,22,26]. This supports the finding of Chamberlain et al. that increased fluidity of S. aureus membranes resulted from exposure to LC-uFFAs [26]. Furthermore, these authors demonstrated that carotenoid-dependent pigmentation in non-isogenic clinical isolates positively correlated with increased survival from LC-uFFAs and showed that the carotenoid staphyloxanthin acted to decrease membrane fluidity and reduce its damaging effects. Interestingly, genes involved in carotenoid biosynthesis were up-regulated in response to LC-uFFAs (Fig. 5B), and Liv681 (crtM), which cannot produce staphyloxanthin, was shown here to have a .5-fold reduced survival to 1 mM linoleic acid. Staphyloxanthin production is regulated via sB, which also regulates many stress response components observed to be up-regulated in the array data. Consequently, the general stress response, including the production of staphyloxanthin serves as an important component of defence against LC-uFFAs, given the discovery that Liv130 (sigB) exhibited a .75-fold reduction in survival to 1 mM linoleic acid. sigB has previously been shown to contribute to S. aureus resistance to antimicrobials [67]. The CtsR regulon was strongly upregulated after linoleic acid challenge, but was down-regulated after growth exposure and may therefore also participate in the adaptation to this environment. A consequence of LC-uFFAs inserting in the cell membrane could be the disruption of the electron transport chain. This would explain the numerous changes in expression of genes associated 19
February 2009 | Volume 4 | Issue 2 | e4344
S. aureus Response to LC-uFFAs
Table 11. MRSA252 proteins up-regulated following the addition of hexadecenoic acid (0.1 mM) to exponentially growing cells (hexadecenoic acid challenge).
Group Functions
MRSA252 ORF
MRSA252 Gene MRSA252 Gene Product
Fold Change Up regulated
P-value
Stress Response
SAR2116
groEL
chaperonin
2.03
3.49E-02
SAR2273
asp23
alkaline shock protein 23
2.89
8.90E-03
SAR2461
pyridine nucleotide-disulphide oxidoreductase family protein
2.05
3.99E-02
SAR2461
pyridine nucleotide-disulphide oxidoreductase family protein
2.00
2.13E-03
SAR2461
pyridine nucleotide-disulphide oxidoreductase family protein
2.59
2.49E-02
deoxyribose-phosphate aldolase
4.21
4.86E-03
phosphoglycerate mutase family protein
4.79
1.06E-03
Energy Metabolism
SAR0140
deoC1
SAR0394 SAR0828
gap1
glyceraldehyde 3-phosphate dehydrogenase 1
2.86
2.51E-03
SAR0830
tpiA
triosephosphate isomerase
3.40
4.42E-03
SAR0832
eno
enolase
3.20
1.83E-02
SAR0832
eno
enolase
3.09
4.60E-03
SAR0832
eno
enolase
2.07
5.15E-03
SAR0924
pgi
glucose-6-phosphate isomerase
2.31
2.73E-02
SAR1068
pdhB
putative pyruvate dehydrogenase E1 component
2.72
2.29E-04
SAR1068
pdhB
putative pyruvate dehydrogenase E1 component
2.72
2.29E-04
SAR1121
sdhA
putative succinate dehydrogenase flavoprotein
2.24
1.36E-02
SAR1451
ald2
alanine dehydrogenase 2
2.21
2.30E-03
SAR2605
ddh
D-lactate dehydrogenase
3.11
8.87E-03
SAR2685
mqo2
malate:quinone oxidoreductase
4.79
1.06E-03
SAR2685
mqo2
malate:quinone oxidoreductase
3.13
2.18E-03
DNA Repair and Replication
SAR1997
pcrA
ATP-dependent DNA helicase
2.23
3.49E-02
Protein Synthesis
SAR0552
fus
translation elongation factor G
3.56
3.84E-02
SAR0553
tuf
translation elongation factor Tu
2.65
3.41E-02
SAR0553
tuf
elongation factor Tu
4.13
7.56E-03
SAR1216
trmD
putative tRNA (guanine-7-)-methyltransferase
2.80
1.69E-03
SAR1485
rpsA
putative 30S ribosomal protein S1
2.91
4.91E-02
SAR1719
tgt
queuine tRNA-ribosyltransferase
2.01
4.96E-02
SAR1720
queA
S-adenosylmethionine:tRNA ribosyltransferase-isomerase
2.49
1.44E-02
SAR2309
rpoA
DNA-directed RNA polymerase subunit alpha
2.44
9.73E-03
SAR1048
purD
putative phosphoribosylamine–glycine ligase
3.98
2.08E-02
SAR1762
thrS
threonyl-tRNA synthetase
2.51
1.51E-02
SAR2212
murA2
UDP-N-acetylglucosamine 1-carboxyvinyltransferase
2.13
1.36E-02
SAR1795
ezrA
putative septation ring formation regulator
3.11
3.71E-03
SAR1795
ezrA
putative septation ring formation regulator
2.56
5.16E-03
SAR0218
putative pyruvate formate-lyase activating enzyme
2.39
4.03E-03
SAR0403
putative DNA-binding protein
2.84
8.32E-03
SAR2007
putative oxygenase
2.85
2.92E-02 2.59E-04
Peptidoglycan Synthesis
Cell Division
Miscellaneous
Metabolism
SAR0351
thl
acetyl-CoA acetyltransferase
2.85
SAR0351
thl
acetyl-CoA acetyltransferase
2.77
9.07E-04
putative O-acetylserine (thiol)-lyase
2.41
4.43E-03
SAR0514 SAR1142
otc
ornithine carbamoyltransferase
2.03
5.43E-03
SAR2352
moaA
putative molybdenum cofactor biosynthesis protein A
3.73
6.34E-03
SAR2352
moaA
putative molybdenum cofactor biosynthesis protein A
2.25
9.64E-03
SAR2460
putative acetyltransferase (GNAT) family protein
5.37
6.22E-05
SAR2460
putative acetyltransferase (GNAT) family protein
5.20
2.03E-02
SAR2641
putative aminotransferase
2.12
8.47E-03
putative anaerobic ribonucleotide reductase activating protein
3.38
4.66E-04
SAR2694
PLoS ONE | www.plosone.org
nrdG
20
February 2009 | Volume 4 | Issue 2 | e4344
S. aureus Response to LC-uFFAs
Table 11. Cont. Group Functions
MRSA252 ORF
MRSA252 Gene MRSA252 Gene Product
Fold Change Up regulated
P-value
SAR2694
nrdG
putative anaerobic ribonucleotide reductase activating protein
2.48
3.43E-02
Hypothetical Proteins SAR0246
ispD
2-C-methyl-D-erythritol 4-phosphate cytidylyltransferase
3.37
2.20E-04
SAR0246
ispD
2-C-methyl-D-erythritol 4-phosphate cytidylyltransferase
2.90
1.69E-03
putative RNA ligase protein
2.11
1.68E-02
hypothetical protein
2.25
3.60E-03
SAR2063
hypothetical phage protein
2.06
1.41E-03
SAR2369
putative acyl-CoA dehydrogenase
2.61
2.43E-04
SAR2545
M42 glutamyl aminopeptidase
2.08
1.72E-02
SAR2674
hypothetical protein
2.45
5.46E-04
SAR0985 SAR1105
isdD
doi:10.1371/journal.pone.0004344.t011
with energy creation within the cell (Fig. 5C, 5D) and appears to constitute the main cellular response to LC-uFFAs. The overall trend is one of increasing levels of pyruvate and alterations in menaquinone synthesis. Moreover, the ADI pathway for anaerobic utilisation of arginine was up-regulated under growth exposure conditions. The genes affected by LC-uFFAs include those involved in the glycolytic and fermentative pathways, cell wall synthesis, cell division, and capsule synthesis. These pathways have also been shown to be modulated in a S. aureus small colony variant, which has a mutation in the hemB gene of the electron transport chain [68]. This supports a mode of action for LC-uFFAs of disturbing cell energetics via membrane disruption. Finally, the overall similarities in responses to the LC-uFFAs employed in this study appear to indicate a common mode of action amongst the linoleic, oleic and hexadecenoic acids. This corroborated dataset on the transcriptional and translational responses of S. aureus should provide a useful resource for further studies on this pathogens response to the host environment.
Transposon mutagenesis and screening for sensitivity to LC-uFFAs Transposon mutagenesis was performed on the SH1000 strain of S. aureus using the Tn917 containing plasmid pLTV1, as described previously [69]. Single colonies from a transposon library grown on BHI agar containing erythromycin and lincomycin were innoculated into 96-well plates containing 200 ml of BHI. From this library 5,000 clones were cultured and stored at 280uC in 10% glycerol. After repeat growth of clones overnight at 37uC, without shaking, cultures were diluted 100-fold before 5 ml was spotted onto BHI agar with or without 0.5 mM linoleic acid. After overnight incubation, strains with decreased resistance to linoleic acid, when compared to wild type (WT) SH1000, were selected. The transposon-mediated mutations in these strains were transduced into the WT SH1000 using ø11 as described previously [70]. The linoleic acid sensitivity of these mutants was reconfirmed, proving the phenotype was transposonlinked, by repeat assay using serial dilutions of the mutant strains onto BHI agar containing millimolar concentrations of linoleic acid. The locations of the Tn917 insertions within the genome of mutants were determined using arbitrary primed nested PCR and DNA sequencing of regions upstream and downstream of the transposon [71].
Materials and Methods Bacterial strains, plasmid and growth conditions
Construction of sasF, arcA and vraS insertional mutants and complementation plasmids
Strains and plasmids used in this study are listed in Table 13. Unless indicated otherwise, bacteria were grown in brain heart infusion broth (BHI)(Merck) at 37uC with shaking at 125 rpm. When included, antibiotics were added at the following concentrations: erythromycin, 5 mg ml21; lincomycin, 25 mg ml21; tetracycline, 5 mg ml21, chloramphenicol 10 mg ml21.
Construction of sasF, arcA and vraS mutants was performed as described by Horsburgh et al. [72] using the oligonucleotides described in Table 14. Briefly this was as follows: the sasF, arcA or vraS genes were amplified as upstream and downstream fragments using
Table 12. MRSA252 proteins down-regulated following the addition of hexadecenoic acid (0.1 mM) to exponentially growing cells (hexadecenoic acid challenge).
Group Functions
MRSA252 ORF
MRSA252 Gene
MRSA252 Gene Product
Fold Change Down Regulated
P-value
Protein Synthesis
SAR0927
spsB
signal peptidase Ib
4.55
8.44E-03
Peptidoglycan Synthesis
SAR0920
NAD-specific glutamate dehydrogenase
2.17
8.21E-03
Miscellaneous
SAR2622
lysR
family regulatory protein
2.13
1.21E-02
Metabolism
SAR0483
tmk
putative thymidylate kinase
2.27
1.04E-03
SAR1399
pstB
ABC transporter ATP-binding protein
3.23
1.80E-03
doi:10.1371/journal.pone.0004344.t012
PLoS ONE | www.plosone.org
21
February 2009 | Volume 4 | Issue 2 | e4344
S. aureus Response to LC-uFFAs
Figure 2. Plate based survival assay. A Graph showing the percentage survival of WT and mutant variants of SH1000 when serial dilutions of the strains were plated on BHI agar containing 1 mM linoleic acid. Survival is expressed as a percentage of viable cell counts obtained for control plates lacking linoleic acid. Values are the mean of multiple independent experiments. Error bars indicate standard errors of the mean. p,0.005 for each mutant by Student’s t-test. B Plates showing the relative survival of SH1000 and the sasF (Liv694) and vraE (Liv753) mutants on BHI agar containing 0 or 1 mM linoleic acid. The 1021 to 1026 dilution series of cultures are as indicated. doi:10.1371/journal.pone.0004344.g002
SH1000, which had now lost the plasmid and contained an allelic replacement with the tetracycline resistance gene, were confirmed as mutants by PCR amplification. Correct allelic replacement was confirmed in each case. Complementation of the sasF, arcA, vraE and SAR2632 mutants was performed by amplifying each gene with sufficient upstream and downstream DNA using the primer pairs listed in Table 14. The fragments were ligated into pSK5630 [75] following digestion with BamHI/SalI, and the resulting constructs and the control plasmid were transformed into E. coli DH5a, with selection on agar plates containing ampicillin. The resulting constructs were confirmed by restriction digest and then used to transform electrocompetent S. aureus RN4220. The plasmids were then
primer pairs sasF_BamHI/sasF_NotI and sasF_KpnI/sasF_EcoRI, or arcA_BamHI/arcA_NotI and arcA_KpnI/arcA_EcoRI or vraS_ BamHI/vraS_NotI and vraS_KpnI/vraS_EcoRI, respectively. The tetracycline resistance gene from pDG1513 [73] was amplified by using the primer pair Tet_NotI/Tet_KpnI. The upstream, downstream and tet gene fragments were digested with BamHI and NotI, or KpnI and EcoRI, or NotI and KpnI, respectively, and simultaneously ligated into pAZ106, which had been previously digested with BamHI and EcoRI. The resulting constructs were confirmed by restriction digest and then used to transform electrocompetent S. aureus RN4220 by the method of Schenk and Ladagga [74]. Strains of RN4220 containing the Campbell integration of the plasmid were resolved in SH1000 by transductional outcross using ø11. Clones of PLoS ONE | www.plosone.org
22
February 2009 | Volume 4 | Issue 2 | e4344
S. aureus Response to LC-uFFAs
Figure 3. Physiological effects of linoleic acid on S. aureus. The result of growth of MRSA252 and SH1000 in the absence (closed triangle) or presence (open box) of 0.01mM linoleic acid on autolysis is shown in A and B, respectively. Survival is expressed as a percentage of OD600 at T = 0. Values are from three independent experiments. Error bars indicate standard errors of the mean. **p,0.01, *p,0.05 by Student’s t test. C Relative hydrophobicity of the MRSA252 and SH1000 strains following overnight growth in BHI +/2 0.1 mM linoleic acid. Values are from three independent experiments. Error bars indicate standard errors of the mean. **p,0.01, *p,0.05 by Student’s t test. doi:10.1371/journal.pone.0004344.g003
PLoS ONE | www.plosone.org
23
February 2009 | Volume 4 | Issue 2 | e4344
S. aureus Response to LC-uFFAs
was converted to cDNA and labelled by incorporation of Cy5 dCTP during reverse transcription of RNA using the enzyme Superscript II (Amersham). DNA used in the microarray hybridisations was extracted from 5 ml of an overnight culture (18 h) of MRSA252 using the Edge Biosystems Bacterial Genomic DNA purification kit according to manufacturer’s instructions. The DNA was labeled by the incorporation of Cy3 dCTP using Klenow (Invitrogen). cDNA derived from RNA and genomic DNA were pooled and hybridized on whole-genome microarrays supplied by the Bacterial Microarray Group at St. George’s Hospital (BmG@S [http://bugs.sgul.ac.uk]) before washing and scanning [76]. Microarrays were scanned using an Affymetrix 428 scanner and image data extracted using ImaGene 5.2 (BioDiscovery). Fully annotated microarray data have been deposited in BmG@Sbase (accession number E-BUGS-68; http:// bugs.sgul.ac.uk/E-BUGS-68) and also ArrayExpress (accession number E-BUGS-68). Two independent labelling reactions and hybridisations were carried out for each RNA sample. Image data was analysed using the GeneSpring 7.3.1 software (Silicon Genetics). Briefly, data were normalized relative to the corresponding untreated controls. Signals below 0.01 were taken as 0.01. Genes were then filtered on expression level to remove non-changing genes, with only those genes that changed by at least two-fold considered biologically significant. Changing genes were then filtered on confidence applying the Benjamini and Hochberg false discovery rate algorithm with a maximum significance cut-off at 0.05 to eliminate the chance of falsepositives [77].
Quantitative Real-Time PCR
Figure 4. Contribution of vraE and sasF to virulence. A Effect of WT SH1000 (open box) and mutations of vraE (vertical hatched box) and sasF (diagonal hatched box) on percentage change in weight of infected mice. *p,0.05, **p,0.01 by Dunn’s test. B Effect of mutations of vraE (closed triangle) and sasF (closed inverted triangle) on cfu of S. aureus SH1000 (closed box) in kidneys of infected mice. doi:10.1371/journal.pone.0004344.g004
To confirm the validity of microarray data gene specific mRNAs were quantified from treated and untreated cultures by quantitative real-time PCR (qRT-PCR). Cells were grown in biological triplicate exactly as described above for the microarray experiments and bacterial RNA was isolated using the Pro-Blue Fast RNA kit (MP Biomedicals). DNA was removed from the samples by DNase I treatment (Ambion) according to manufacturer’s instructions. The purified RNA was quantified using the nanodrop ND-1000 Spectrophotometer (Thermo Fisher Scientific) and the integrity assessed by electrophoresis. 0.5 mg of RNA was reverse transcribed with 100 U of Bioscript Reverse Transcriptase (Bioline) using 0.2 mg of random hexamer primers (Promega) according to manufacturer’s instructions. qRT-PCR was performed using the 7500 Fast System (Applied Biosystems) and the QuantiFast SYBR Green PCR kit (Qiagen) according to manufacturer’s instructions. The relative levels of gene expression in fatty acid treated cells and the non-treated controls were calculated by relative quantification using gyrB as the endogenous reference gene. The choice of gyrB as a single reference gene was based on its consistent levels in microarray in all conditions and at all timpoints that were analysed. The oligonucleotides used for qRT-PCR are listed in Table 15. All samples were amplified in triplicate and the data analysis was carried out using the 7500 Fast System Software (Applied Biosystems).
purified from RN4220 and transformed into the corresponding mutant strains.
Microarray analysis To ascertain the transcriptional responses of MRSA252 to fatty acids, overnight cultures (18 h) of MRSA252 were used to inoculate 100 ml of BHI (Merck) with or without 10 mM of oleic or linoleic acid in 250 ml conical flasks. These 100 ml cultures were placed in a shaking water bath at 37uC at 250 rpm and 10 ml samples were taken from the flask when the cultures reached late exponential phase (OD600 = 3). Identical inoculations were performed to 100 ml of BHI lacking additional fatty acids. 100 mM of linoleic acid in ethanol or an equal volume of the ethanol used to dilute the fatty acid was added to these cultures at an OD600 = 3.0 and the RNA extracted from treated and untreated cells 20 min post-treatment. Each treatment and control culture was performed in biological triplicate. The concentrations of fatty acids used in these experiments did not alter the pH of the media. RNA was extracted from 10 ml samples of culture taken at the indicated time intervals and stabilised by the addition of 20 ml of RNA Bacteria Protect (Qiagen). The cells were subsequently harvested by centrifugation at 5000 rpm for 10 min and cell pellets resuspended in lysis buffer (10 mM Tris, pH8.0) containing 200 U ml21 of lysostaphin and 400 U ml21 of mutanolysin, and incubated for 90 min at 37uC with gentle shaking every 10–15 min. The RNA was subsequently extracted using the RNeasy Midi kit (Qiagen) and DNase treated whilst on the purification column using the RNaseFree DNase Set according to manufacturers instructions (Qiagen). The quantity and quality of the RNA was assessed on an Agilent 2100 bioanalyzer by using the RNA 6000 Nano LabChip Kit. The RNA PLoS ONE | www.plosone.org
Sample preparation for 2D-PAGE Cultures of MRSA252 (100 ml) were grown to late exponential phase (OD600 = 3.0) and exposed to 0.1 mM linoleic acid or 0.1 mM hexadecenoic acid as described above. Cells were harvested by centrifugation at 5000 g for 10 min at 4uC. After two washes in PBS the cells were resuspended in 2 ml of lysis buffer (PBS, 1 mg/ml DNase I, 100 mM benzamidine, 100 mM PMSF, 1 mg/ml RNase, 2 mg/ml lysostaphin) and incubated at 37uC for 20 min before chilling on ice. Cell debris and insoluble material was pelleted by centrifugation at 4uC for 20,000 g for 20 min. The supernatant was stored at 220uC. Protein samples 24
February 2009 | Volume 4 | Issue 2 | e4344
S. aureus Response to LC-uFFAs
Figure 5. Schematic representation of cellular pathways displaying changes in gene transcription in response to linoleic acid challenge conditions. Sections A, B, C and D highlight the various genes involved in peptidoglycan, carotenoid, menaquinone and energy metabolism respectively. Genes in red and blue boxes are up- and down-regulated, respectively. See text for details. doi:10.1371/journal.pone.0004344.g005
1200V for 1h, 1200–8000V over 1h (linear gradient), 8000 V to 40000 v (steady state)), using a Protean IEF Cell (Bio-Rad). After focusing, strips were equilibrated in 50 mM Tris (pH 6.8), 6 M urea, 2% (w/v) SDS, 30% (w/v) glycerol, and bromophenol blue, containing 20 mM DTT in the reduction step (15 min) and 25 mM iodoacetamide in the alkylation step (15 min). IPG strips were run in the second dimension on 20620cm 12.5% SDSPAGE gels using a Protean II xi 2D Cell (Bio-Rad). Gels were run in triplicate, silver-stained [78] and scanned (GS-710 Densitometer, Bio-Rad) as gray-scale tiff files at 16 bit and 300 dpi and uploaded into the Progenesis ‘SameSpots’ (Non Linear Dynamics) gel image analysis Software. Quantitative analysis was based on average gels created from three gel replicates. Spots in the treated
were quantified using the BioRad Protein assay. The protein samples were desalted using Slide-A-Lyzer Mini Dialysis Units with a 3.5 kDa MWCO (Thermo Scientific).
2D-PAGE Soluble protein (120 mg ) was brought up to 320 ml with rehydration buffer (8 M urea, 2M thiourea, 4% (w/v) CHAPS, 20 mM DTT, 1% (v/v) ASB 14 detergent and 0.5% (v/v) carrier ampholytes (Bio-lyte 3/10, Bio-Rad)). Samples were incubated for an hour at room temperature with gentle shaking, before centrifugation at 8,000 g for 5 min. Samples were in-gel rehydrated and focused on 17 cm, pH 4–7 IPG strips (Bio-Rad) for a total of 40000 V h (150V for 1h, 300V for 1h, 600V for 1h, PLoS ONE | www.plosone.org
25
February 2009 | Volume 4 | Issue 2 | e4344
S. aureus Response to LC-uFFAs
Table 13. Strains and plasmids used in this study.
Strain or Plasmid
Comment
Reference or Source
ø80 (lacZ)M15 (argF-lac)U169 endA1 recA1 hsdR17 (rK2 mK+) deoR thi-1 supE44 gyrA96 relA1
[86]
Strains: E. coli: DH5a S. aureus: SH1000
Functional rsbU derivative of 8325-4 rsbU+
[87]
MRSA252
Wild-type clinical isolate
[52]
RN4220
Restriction-deficient transformation recipient mutant of 8325-4
[88]
N315
Wild-type pharyngeal smear clinical isolate
[89]
MSSA476
Wild-type clinical isolate
[52]
Liv033 (katA)
8325-4 katA::Tn917
[87]
Liv038 (agr)
SH1000 agr::tet
[87]
Liv039 (sarA)
SH1000 sarA::kan
[87]
Liv101 (lytS)
SH1000 lytS::pER1
[45]
Liv130 (sigB)
SH1000 sigB::tet
[87]
Liv142 (atl)
SH1000 atl::lacZ pAZ106
[44]
Liv405 (clfA)
8325-4 clfA::lacZ pAZ106
T. Foster
Liv442 (clfA)
SH1000 clfA trandsduced from Liv405
This Study
Liv671 (clpC)
SH1000 clpC::erm
[90]
Liv673 (crtM)
Newman crtM::cat
[91]
Liv681 (crtM)
SH1000 crtM::cat transduced from Liv673
This study
Liv684 (sasF)
RN4220 sasF::tet
This Study
Liv686 (arcA)
RN4220 arcA::tet
This Study
Liv692 (arcA)
SH1000 arcA::tet transduced from Liv686
This Study
Liv694 (sasF)
SH1000 sasF::tet transduced from Liv684
This Study
Liv718 (vraS)
SH1000 vraS::tet transduced from Liv723
This Study
Liv723 (vraS)
RN4220 vraS::tet
This Study
Liv750 (katA)
SH1000 katA::Tn917 transduced from Liv033
This study
Liv753 (vraE)
SH1000 SAR2782::Tn917
This Study
Liv766 (SAR2632)
SH1000 SAR2632::Tn917
This Study
Liv994
RN4220 pSK5630+sasF
This Study
Liv995
RN4220 pSK5630+arcA
This Study
Liv996
RN4220 pSK5630+vraE
This Study
Liv997
RN4220 pSK5630+SAR2632
This Study
Liv1000 (sasF)
Liv694 complemented with pSK5630+sasF
This Study
Liv1001 (arcA)
Liv692 complemented with pSK5630+arcA
This Study
Liv1002 (vraE)
Liv753 complemented with pSK5630+vraE
This Study
Liv1003 (SAR2632)
Liv766 complemented with pSK5630+SAR2632
This Study
Plasmids: pLTV1
Temperature-sensitive plasmid harbouring Tn917
[69]
pAZ106
Promoterless lacZ erm insertion vector
[92]
pDG1513
pMTL22 derivative [tetr]
[73]
pSK5630
Low copy number E. coli-S. aureus shuttle vector [cmr]
[75]
doi:10.1371/journal.pone.0004344.t013
samples with a p#0.05 and $ two-fold difference from the control sample were considered statistically significant. For protein identification by mass spectrometry 2 gels containing 800 mg each of soluble protein (a pool from each growth condition) were prepared as above and stained with Colloidal Coomassie Brilliant Blue [79]. The scanned images were uploaded into Progenesis ‘SameSpots’ and matched to the analytical gels.
PLoS ONE | www.plosone.org
Trypsin digestion and mass spectrometric identification of proteins Spots for identification were excised and digested in-gel with trypsin. Gel Plugs were destained in 50% (v/v) acetonitrile:50% (v/v) 50 mM ammonium bicarbonate (37uC), dehydrated in 100% acetonitrile (37uC), and rehydrated overnight (37uC) in 10 ml of 50mM ammonium bicarbonate containing trypsin (1 ml of 100 ng 26
February 2009 | Volume 4 | Issue 2 | e4344
S. aureus Response to LC-uFFAs
Table 14. Oligonucleotides used for the construction of mutants.
Table 15. Oligonucleotides used for qRT-PCR analysis.
Oligonucleotide
SAR Number Sequence (59 to 39)
gyrB_For
SAR0005
ATCGACTTCAGAGAGAGGTTTG
gyrB_Rev
SAR0005
CCGTTATCCGTTACTTTAATCCA
ATAACTGCGGCCGCTTGAAACGGTTTCCCTCG
spa_For
SAR0114
GAAGCAACCAGCAAACCATGC
sasF_KpnI
CCGGTACCGTTATCACGACGCAATAAG
spa_Rev
SAR0114
ACGTCCAGCTAATAACGCTGC
sasF_EcoRI
ACATGAATTCAAACAAGGAGTTCGGAC
fadA_For
SAR0223
GAAGATGTCATTGTTGGTACGG
arcA_BamHI
CCACGGATCCACAAGTAGTAGATATGTG
fadA_Rev
SAR0223
TGTAATCCTGATGAGCAGTAGC
arcA_NotI
ATAACTGCGGCCGCTTAATTGGACCATCTGTC
fadD_For
SAR0225
TTCATTGCTAGAAAGTAAGTACCG
arcA_KpnI
CCGGTACCGACACTTTCTAATCAAG
fadD_Rev
SAR0225
TGGCGTTTGGACGATCCTTGT
arcA_EcoRI
ACATGAATTCTGCTTTGGTAAATCAC
lytR_For
SAR0258
TTTTTGCAACTGCACATGACCAA
vraS_BamHI
CCACGGATCCGCATGCTAGCTGCATTTC
lytR_Rev
SAR0258
TTATCATCTTTGGCTTTAGTCGC
vraS_NotI
ATAACTGCGGCCGCCATTTCATGATCATCCAC
sarA_For
SAR0625
TAAACTACAAACAACCACAAGTTG
vraS_KpnI
CCGGTACCCAAGCTGTCATCTATGCATTC
sarA_Rev
SAR0625
TTCGATTTTTTTACGTTGTTGTGC
vraS_EcoRI
ACATGAATTCGCTGAAACATCTACTC
clpB_For
SAR0938
GAACGAGCAAATATTGAGGTAGA
Tet_NotI
ATAACTGCGGCCGCGGCGGATTTTATGACCGATGAAG
clpB_Rev
SAR0938
GCCTTAGTTATCAATTGGTTTGC
Tet_KpnI
CCGGTACCTTAGAAATCCCTTTGAGAATGTTT
fabI_For
SAR0978
GTGATGGGTGTTGCTAAAGCG
fabI_Rev
SAR0978
AACCACCCACACCTTTTGCAC
Oligonucleotides
Sequence (59 to 39)
sasF_BamHI
CCACGGATCCGGTAGTGATGTTTTGG
sasF_NotI
Complementation Sar2725_SasF_For
ACGCGTCGACTAATATGATGTTAGCGACATGG
hla_For
SAR1136
GTTGCAACTACCTGATAATGAAG
Sar2725_SasF_Rev
ACGCGGATCCAATGATGGACAATCTATTCATTGC
hla_Rev
SAR1136
CCAATTTTTCCAGAATCATCACC
arcA_For
ACGCGTCGACGTGAATATAATCACATGTAAGCG
katA_For
SAR1344
AATAGTATGACAGCAGGGCCTA
arcA_Rev
ACGCGGATCCTCTGTCATTATTTTCACCCTCG
katA_Rev
SAR1344
AATGTCCCAAATGCACCAGAAC
Sar2632_For
ACGCGTCGACTTTATAACTCGTAAATCAGTCTC
murG_For
SAR1430
ATCCCGAGGCGACCAAATTGA
Sar2632_Rev
ACGCGGATCCCATGTAAAATTTGCGACATTGC
murG_Rev
SAR1430
AATTCGAGTTCTTTCCTGTTCCA
Sar2782_vraE_For
ACGCGTCGACTGTCATCATGCTAAAAGATGGC
fabZ_For
SAR2186
AATATGAAGAAGGTCAACGTTGC
Sar2782_vraE_Rev
ACGCGGATCCAGTTAATAGTTATACTGCATTGC
fabZ_Rev
SAR2186
ACCGCACCTGTTTGAGCTAACG
cidA_For
SAR2621
GCCGGCAGTATTGTTGGTCTA
cidA_Rev
SAR2621
TAATACCTACAACTGACGGTATG
crtM_For
SAR2643
TGATGACAGTATAGATGTTTATGG
crtM_Rev
SAR2643
ACATGCTGAAGGGCCATCATG
arcA_For
SAR2714
GTCAGGAGTACGTAAGGAAGA
arcA_Rev
SAR2714
GTGTCCTATTGAGGCTTGTGG
sasF-For
SAR2725
CACAAATCGGAAGATTCAGC
sasF_Rev
SAR2725
TGAGTCGATTACTATGGCTTTGA
RNAIII_For
RNAIII
ACATGGTTATTAAGTTGGGATGG
RNAIII_Rev
RNAIII
TAAAATGGATTATCGACACAGTGA
doi:10.1371/journal.pone.0004344.t014
trypsin stock reconstituted in 50 mM acetic acid (Promega)). Supernatants containing the extracted peptides were removed and analyzed by MALDI-TOF. Peptide Mass Fingerprinting (PMF) was conducted on a reflectron MALDI-TOF instrument (M@LDI;Waters-Micromass,UK ). Samples were mixed in a 1:1 ratio with a saturated solution of a cyano-4hydroxycinnamic acid ACN: water:TFA (50:49:1 (v/v/v)). The acquired spectra were analysed using MassLynx v 4.0 (WatersMicromass,UK) and were all externally calibrated with a mixture of peptides. For each sample, all acquired spectra were combined and processed as follows using MassLynx v 4.0: smoothing, 26 smooth using a Savitzky Golay method set at +/2 3 channels and background subtraction using a polynomial of order 1 and 40% below the curve in order to reduce background noise. To get accurate mono isotopic peak data all processed spectra were centred using the top 80% of each peak. Peak lists were generated using ProteinLynx, part of MassLynx v 4.0. Monoisotopic peptide masses in the mass range of 800–4000 Da were used in the database search. The resulting peptide mass maps were used to interrogate S. aureus MRSA252 sequences to generate statistically significant candidate identifications using the MASCOT search engine (Matrix Science). Searches were performed allowing for complete carbamidomethylation (alkylation) of cysteine residues, partial oxidation of methionine residues, one missed cleavage and a mass error of 250 ppm. Molecular Weight Search (MOWSE) scores [80], number of matched ions, percent protein sequence coverage, and correlation of gel region with predicted mass and pI were collectively considered for each protein identification. PLoS ONE | www.plosone.org
doi:10.1371/journal.pone.0004344.t015
Cell surface hydrophobicity assays Cell surface hydrophobicity of S. aureus strains was measured as described previously [81]. Briefly, stationary-phase cells (18-h cultures) grown in the presence or absence of 0.1 mM linoleic acid were harvested, washed three times and resuspended to an OD440 of 0.5 in PBS. 3 ml aliquots of each of these bacterial suspensions were vortexed for 1 min with 200 ml n-hexadecane (Sigma). After 15 min incubation to enable partitioning, 1 ml was removed from the aqueous layer and the OD440 recorded. Cell surface hydrophobicity was calculated as the percentage decrease in OD as a result of cells partitioning into the hexadecane.
Cell Autolysis Assay Cell autolysis rates were determined on cells exposed to linoleic acid using an assay modified from that described by Blackman et al. [82]. Briefly, cells were grown in 100 ml volumes of BHI to an 27
February 2009 | Volume 4 | Issue 2 | e4344
S. aureus Response to LC-uFFAs
OD600 of 0.8–1.0 in the presence or absence of 0.01 mM linoleic acid. Following harvesting of the cells by centrifugation, the cells were washed in PBS and resuspended to an OD600 = 0.6 in 0.5% (v/v) Triton X-100. The cells were incubated with shaking at 37uC and the OD600 was monitored over time.
The number of viable bacteria was measured in conjunction with each challenge by counting colonies following culture at 37uC for 24 hours on blood agar plates. Ten mice were infected with each strain of S. aureus by i.v. injection in the tails of 3.2–3.56106 CFU of bacteria for induction of septic arthritis. The mice were weighed regularly and examined for arthritis until death by cervical dislocation 14 days after challenge. The kidneys were aseptically dissected and kept on ice, homogenized, diluted in PBS and inoculated on blood agar plates. Data were presented as CFU per kidney pair.
Experimental septic arthritis A well described mouse model of septic arthritis was used to test the in vivo role of genes implicated in resistance to fatty acids in the strains [83–85]. Seven week old female NMRI mice were obtained from Charles River Laboratories (Sulzfeld, Germany) and maintained in the animal facility of the Department of Rheumatology and Inflammation Research, University of Go¨teborg, Sweden. All mice were maintained according to the local ethic board animal husbandry standards. The mice were housed 10 to a cage under standard conditions of temperature and light and were fed standard laboratory chow and water ad libitum. Bacteria were grown on blood agar plates for 24 h, harvested and stored frozen at 220uC in PBS containing 5% bovine serum albumin and 10% dimethyl sulfoxide. Before injection into animals, the bacterial suspensions were thawed, washed in PBS, and adjusted to appropriate cell concentrations. Mice were inoculated in the tail vein with 0.2 ml of bacterial suspension.
Acknowledgments We would like to thank Alan McCarthy and Heather Allison for critical reading of the manuscript and Timothy Foster, Dorte Frees, Friedrich Go¨tz and Simon Foster for kindly supplying mutant strains.
Author Contributions Conceived and designed the experiments: JGK DW EJ AT MJH. Performed the experiments: JGK DW EJ IMJ MJH. Analyzed the data: JGK DW EJ IMJ JH MJH. Contributed reagents/materials/analysis tools: JL. Wrote the paper: JGK DW HR MJH.
References 1. Rippke F, Schreiner V, Doering T, Maibach HI (2004) Stratum corneum pH in atopic dermatitis: impact on skin barrier function and colonization with Staphylococcus aureus. Am J Clin Dermatol 5: 217–223. 2. Scha¨fer L, Kragballe K (1991) Abnormalities in epidermal lipid metabolism in patients with atopic dermatitis. J Invest Dermatol 96: 10–15. 3. Takigawa H, Nakagawa H, Kuzukawa M, Mori H, Imokawa G (2005) Deficient production of hexadecenoic acid in the skin is associated in part with the vulnerability of atopic dermatitis patients to colonization by Staphylococcus aureus. Dermatology 211: 240–248. 4. Ansari MN, Nicolaides N, Fu HC (1970) Fatty acid composition of the living layer and stratum corneum lipids of human sole skin epidermis. Lipids 5: 838–845. 5. Drake DR, Brogden KA, Dawson DV, Wertz PW (2008) Thematic review series: skin lipids. Antimicrobial lipids at the skin surface. J Lipid Res 49: 4–11. 6. Pappas A, Anthonavage M, Gordon JS (2002) Metabolic fate and selective utilization of major fatty acids in human sebaceous gland. J Invest Dermatol 118: 164–171. 7. Do TQ, Moshkani S, Castillo P, Anunta S, Pogosyan A, et al. (2008) Lipids including cholesteryl linoleate and cholesteryl arachidonate contribute to the inherent antibacterial activity of human nasal fluid. J Immunol 181: 4177–4187. 8. Dye ES, Kapral FA (1981) Characterization of a bactericidal lipid developing within staphylococcal abscesses. Infect Immun 32: 98–104. 9. Engler HD, Kapral FA (1992) The production of a bactericidal monoglyceride in staphylococcal abscesses. J Med Microbiol 37: 238–244. 10. Shryock TR, Kapral FA (1992) The production of bactericidal fatty acids from glycerides in staphylococcal abscesses. J Med Microbiol 36: 288–92. 11. Bergsson G, Arnfinnsson J, Steingrı´msson O, Thormar H (2001) Killing of Gram-positive cocci by fatty acids and monoglycerides. APMIS 109: 670–678. 12. Galbraith H, Miller TB (1973) Effect of long chain fatty acids on bacterial respiration and amino acid uptake. J Appl Bacteriol 36: 659–675. 13. Heczko PB, Lu¨tticken R, Hryniewicz W, Neugebauer M, Pulverer G (1979) Susceptibility of Staphylococcus aureus and group A, B, C, and G streptococci to free fatty acids. J Clin Microbiol 9: 333–335. 14. Kabara JJ, Swieczkowski DM, Conley AJ, Truant JP (1972) Fatty acids and derivatives as antimicrobial agents. Antimicrob Agents Chemother 2: 23–28. 15. Kelsey JA, Bayles KW, Shafii B, McGuire MA (2006) Fatty acids and monoacylglycerols inhibit growth of Staphylococcus aureus. Lipids 41: 951–961. 16. Knapp HR, Melly MA (1986) Bactericidal effects of polyunsaturated fatty acids. J Infect Dis 154: 84–94. 17. Nieman C (1954) Influence of trace amounts of fatty acids on the growth of microorganisms. Bacteriol Rev 18: 147–161. 18. Speert DP, Wannamaker LW, Gray ED, Clawson CC (1979) Bactericidal effect of oleic acid on group A streptococci: mechanism of action. Infect Immun 26: 1202–1210. 19. Hilmarsson H, Traustason BS, Kristmundsdo´ttir T, Thormar H (2007) Virucidal activities of medium- and long-chain fatty alcohols and lipids against respiratory syncytial virus and parainfluenza virus type 2: comparison at different pH levels. Arch Virol 152: 2225–2236. 20. Hilmarsson H, Larusson LV, Thormar H (2006) Virucidal effect of lipids on visna virus, a lentivirus related to HIV. Arch Virol 151: 1217–1224.
PLoS ONE | www.plosone.org
21. Thormar H, Isaacs CE, Brown HR, Barshatzky MR, Pessolano T (1987) Inactivation of enveloped viruses and killing of cells by fatty acids and monoglycerides. Antimicrob Agents Chemother 31: 27–31. 22. Greenway DL, Dyke KG (1979) Mechanism of the inhibitory action of linoleic acid on the growth of Staphylococcus aureus. J Gen Microbiol 115: 233–245. 23. Zheng CJ, Yoo JS, Lee TG, Cho HY, Kim YH, et al. (2005) Fatty acid synthesis is a target for antibacterial activity of unsaturated fatty acids. FEBS Lett 579: 5157–5162. 24. Won SR, Hong MJ, Kim YM, Li CY, Kim JW, et al. (2007) Oleic acid: an efficient inhibitor of glucosyltransferase. FEBS Lett 581: 4999–5002. 25. Campbell IM, Crozier DN, Pawagi AB, Buivids IA (1983) In vitro response of Staphylococcus aureus from cystic fibrosis patients to combinations of linoleic and oleic acids added to nutrient medium. J Clin Microbiol 18: 408–415. 26. Chamberlain NR, Mehrtens BG, Xiong Z, Kapral FA, Boardman JL, et al. (1991) Correlation of carotenoid production, decreased membrane fluidity, and resistance to oleic acid killing in Staphylococcus aureus 18Z. Infect Immun 59: 4332–4337. 27. Grinsted J, Lacey RW (1973) Ecological and genetic implications of pigmentation in Staphylococcus aureus. J Gen Microbiol 75: 259–267. 28. Xiong Z, Kapral FA (1992) Carotenoid pigment levels in Staphylococcus aureus and sensitivity to oleic acid. J Med Microbiol 37: 192–194. 29. Chamberlain NR, Imanoel B (1996) Genetic regulation of fatty acid modifying enzyme from Staphylococcus aureus. J Med Microbiol 44: 125–129. 30. Kapral FA, Smith S, Lal D (1992) The esterification of fatty acids by Staphylococcus aureus fatty acid modifying enzyme (FAME) and its inhibition by glycerides. J Med Microbiol 37: 235–237. 31. Long JP, Hart J, Albers W, Kapral FA (1992) The production of fatty acid modifying enzyme (FAME) and lipase by various staphylococcal species. J Med Microbiol 37: 232–234. 32. Mortensen JE, Shryock TR, Kapral FA (1992) Modification of bactericidal fatty acids by an enzyme of Staphylococcus aureus. J Med Microbiol 36: 293–298. 33. Lee EH, Shafer WM (1999) The farAB-encoded efflux pump mediates resistance of gonococci to long-chained antibacterial fatty acids. Mol Microbiol 33: 839–845. 34. Clarke SR, Mohamed R, Bian L, Routh AF, Kokai-Kun JF, et al. (2007) The Staphylococcus aureus surface protein IsdA mediates resistance to innate defenses of human skin. Cell Host Microbe 1: 199–212. 35. Projan SJ, Brown-Skrobot S, Schlievert PM, Vandenesch F, Novick RP (1994) Glycerol monolaurate inhibits the production of beta-lactamase, toxic shock toxin-1, and other staphylococcal exoproteins by interfering with signal transduction. J Bacteriol 176: 4204–4209. 36. Ruzin A, Novick RP (2000) Equivalence of lauric acid and glycerol monolaurate as inhibitors of signal transduction in Staphylococcus aureus. J Bacteriol 182: 2668–2671. 37. Schlievert PM, Deringer JR, Kim MH, Projan SJ, Novick RP (1992) Effect of glycerol monolaurate on bacterial growth and toxin production. Antimicrob Agents Chemother 36: 626–631. 38. Peterson ML, Schlievert PM (2006) Glycerol monolaurate inhibits the effects of Gram-positive select agents on eukaryotic cells. Biochemistry 45: 2387–2397.
28
February 2009 | Volume 4 | Issue 2 | e4344
S. aureus Response to LC-uFFAs
39. Ruzin A, Novick RP (1998) Glycerol monolaurate inhibits induction of vancomycin resistance in Enterococcus faecalis. J Bacteriol 180: 182–185. 40. Vetter SM, Schlievert PM (2005) Glycerol monolaurate inhibits virulence factor production in Bacillus anthracis. Antimicrob Agents Chemother 49: 1302–1305. 41. Burts ML, Williams WA, DeBord K, Missiakas DM (2005) EsxA and EsxB are secreted by an ESAT-6-like system that is required for the pathogenesis of Staphylococcus aureus infections. Proc Natl Acad Sci USA 102: 1169–1174. 42. McCallum N, Bischoff M, Maki H, Wada A, Berger-Ba¨chi B (2004) TcaR, a putative MarR-like regulator of sarS expression. J Bacteriol 186: 2966–2972. 43. Bentley R, Meganathan R (1982) Biosynthesis of vitamin K (menaquinone) in bacteria. Microbiol Rev 46: 241–280. 44. Foster SJ (1995) Molecular characterization and functional analysis of the major autolysin of Staphylococcus aureus 8325/4. J Bacteriol 177: 5723–5725. 45. Brunskill EW, Bayles KW (1996) Identification and molecular characterization of a putative regulatory locus that affects autolysis in Staphylococcus aureus. J Bacteriol 178: 611–618. 46. Rice KC, Mann EE, Endres JL, Weiss EC, Cassat JE, et al. (2007) The cidA murein hydrolase regulator contributes to DNA release and biofilm development in Staphylococcus aureus. Proc Natl Acad Sci USA 104: 8113–8118. 47. Qoronfleh MW, Gustafson JE, Wilkinson BJ (1998) Conditions that induce Staphylococcus aureus heat shock proteins also inhibit autolysis. FEMS Microbiol Lett 166: 103–107. 48. Dufour M, Manson JM, Bremer PJ, Dufour JP, Cook GM, et al. (2007) Characterization of monolaurin resistance in Enterococcus faecalis. Appl Environ Microbiol. 73: 5507–5515. 49. Collins LV, Kristian SA, Weidenmaier C, Faigle M, Van Kessel KP, et al. (2002) Staphylococcus aureus strains lacking D-alanine modifications of teichoic acids are highly susceptible to human neutrophil killing and are virulence attenuated in mice. J Infect Dis 186: 214–219. 50. Peschel A, Jack RW, Otto M, Collins LV, Staubitz P, et al. (2001) Staphylococcus aureus resistance to human defensins and evasion of neutrophil killing via the novel virulence factor MprF is based on modification of membrane lipids with llysine. J Exp Med 193: 1067–1076. 51. Weidenmaier C, Peschel A, Kempf VA, Lucindo N, Yeaman MR, et al. (2005) DltABCD- and MprF-mediated cell envelope modifications of Staphylococcus aureus confer resistance to platelet microbicidal proteins and contribute to virulence in a rabbit endocarditis model. Infect Immun 73: 8033–8038. 52. Holden MT, Feil EJ, Lindsay JA, Peacock SJ, Day NP, et al. (2004) Complete genomes of two clinical Staphylococcus aureus strains: evidence for the rapid evolution of virulence and drug resistance. Proc Natl Acad Sci U S A. 101: 9786–9791. 53. Chamberlain NR, Brueggemann SA (1997) Characterisation and expression of fatty acid modifying enzyme produced by Staphylococcus epidermidis. J Med Microbiol 46: 693–697. 54. Johnson AP, Pearson A, Duckworth G (2005) Surveillance and epidemiology of MRSA bacteraemia in the UK. J Antimicrob Chemother 56: 455–462. 55. Johnson AP, Aucken HM, Cavendish S, Ganner M, Wale MC, et al. (2001) Dominance of EMRSA-15 and -16 among MRSA causing nosocomial bacteraemia in the UK: analysis of isolates from the European Antimicrobial Resistance Surveillance System (EARSS). J Antimicrob Chemother 48: 143–144. 56. Goering RV, McDougal LK, Fosheim GE, Bonnstetter KK, Wolter DJ, et al. (2007) Epidemiologic distribution of the arginine catabolic mobile element among selected methicillin-resistant and methicillin-susceptible Staphylococcus aureus isolates. J Clin Microbiol 45: 1981–1984. 57. Roche FM, Massey R, Peacock SJ, Day NP, Visai L, et al. (2003) Characterization of novel LPXTG-containing proteins of Staphylococcus aureus identified from genome sequences. Microbiology 149: 643–654. 58. Oscarsson J, Kanth A, Tegmark-Wisell K, Arvidson S (2006) SarA is a repressor of hla (alpha-hemolysin) transcription in Staphylococcus aureus: its apparent role as an activator of hla in the prototype strain NCTC8325 depends on reduced expression of sarS. J Bacteriol 188: 8526–8533. 59. Kuroda M, Kuroda H, Oshima T, Takeuchi F, Mori H, et al. (2003) Twocomponent system VraSR positively modulates the regulation of cell-wall biosynthesis pathway in Staphylococcus aureus. Mol Microbiol 49: 807–821. 60. Neoh HM, Cui L, Yuzawa H, Takeuchi F, Matsuo M, et al. (2008) Mutated response regulator graR is responsible for phenotypic conversion of Staphylococcus aureus from heterogeneous vancomycin-intermediate resistance to vancomycinintermediate resistance. Antimicrob Agents Chemother 52: 45–53. 61. De Lencastre H, Wu SW, Pinho MG, Ludovice AM, Filipe S, et al. (1999) Antibiotic resistance as a stress response: complete sequencing of a large number of chromosomal loci in Staphylococcus aureus strain COL that impact on the expression of resistance to methicillin. Microb Drug Resist 5: 163–175. 62. Sass V, Pag U, Tossi A, Bierbaum G, Sahl HG (2008) Mode of action of human beta-defensin 3 against Staphylococcus aureus and transcriptional analysis of responses to defensin challenge. Int J Med Microbiol 298: 619–633. 63. Tekaia F, Gordon SV, Garnier T, Brosch R, Barrell BG, et al. (1999) Analysis of the proteome of Mycobacterium tuberculosis in silico. Tuber Lung Dis 79: 329–342. 64. Wydro P, Krajewska B, Hac-Wydro K (2007) Chitosan as a lipid binder: a langmuir monolayer study of chitosan-lipid interactions. Biomacromolecules 8: 2611–2617.
PLoS ONE | www.plosone.org
65. Freiberg C, Fischer HP, Brunner NA (2005) Discovering the mechanism of action of novel antibacterial agents through transcriptional profiling of conditional mutants. Antimicrob Agents Chemother 49: 749–759. 66. Hutter B, Schaab C, Albrecht S, Borgmann M, Brunner NA, et al. (2004) Prediction of mechanisms of action of antibacterial compounds by gene expression profiling. Antimicrob Agents Chemother 48: 2838–2844. 67. Riordan JT, O’Leary JO, Gustafson JE (2006) Contributions of sigB and sarA to distinct multiple antimicrobial resistance mechanisms of Staphylococcus aureus. Int J Antimicrob Agents 28: 54–61. 68. Seggewiss J, Becker K, Kotte O, Eisenacher M, Yazdi MR, et al. (2006) Reporter metabolite analysis of transcriptional profiles of a Staphylococcus aureus strain with normal phenotype and its isogenic hemB mutant displaying the smallcolony-variant phenotype. J Bacteriol 188: 7765–7777. 69. Camilli A, Portnoy A, Youngman P (1990) Insertional mutagenesis of Listeria monocytogenes with a novel Tn917 derivative that allows direct cloning of DNA flanking transposon insertions. J Bacteriol 172: 3738–3744. 70. Novick RP (1991) Genetic systems in staphylococci. Methods Enzymol 204: 587–636. 71. Begun J, Sifri CD, Goldman S, Calderwood SB, Ausubel FM (2005) Staphylococcus aureus virulence factors identified by using a high-throughput Caenorhabditis elegans-killing model. Infect Immun 73: 872–877. 72. Horsburgh MJ, Wiltshire MD, Crossley H, Ingham E, Foster SJ (2004) PheP, a putative amino acid permease of Staphylococcus aureus, contributes to survival in vivo and during starvation. Infect Immun 72: 3073–3076. 73. Guerot-Fleury AM, Shazand K, Frandsen N, Stragier P (1995) Antibiotic resistance cassettes for Bacillus subtilis. Gene 167: 335–336. 74. Schenk S, Ladagga RA (1992) Improved methods for electroporation of Staphylococcus aureus. FEMS Microbiol Lett 94: 133–138. 75. Grkovic S, Brown MH, Hardie KM, Firth N, Skurray RA (2003) Stable lowcopy-number Staphylococcus aureus shuttle vectors. Microbiol 149: 785–794. 76. Witney AA, Marsden GL, Holden MTG, Stabler RA, Husain SE, et al. (2005) Design, validation and application of a seven strain Staphylococcus aureus microarray for comparative genomics. Appl Environ Microbiol 71: 7504–7514. 77. Benjamini Y, Hochberg Y (1995) Controlling the False Discovery Rate: a Practical and Powerful Approach to Multiple Testing. J Royal Statistical Society 57: 289–300. 78. Yan J, Wait R, Berkelman T, Harry R, Westbrook J, et al. (2000) A modified silver staining protocol for visualization of proteins compatible with matrixassisted laser desorption/ionization and electrospray ionization-mass spectrometry. Electrophoresis 21: 3666–3672. 79. Neuhoff V, Arold N, Taube D, Ehrhardt W (1988) Improved staining of proteins in polyacrylamide gels including isoelectric focusing gels with clear background at nanogram sensitivity using Coomassie Brilliant Blue G-250 and R-250. Electrophoresis 9: 255–262. 80. Pappin DJ, Hojrup P, Bleasby AJ (1993) Rapid identification of proteins by peptide-mass fingerprinting. Curr Biol 3: 327–332. 81. Banner MA, Cunniffe JG, Macintosh RL, Foster TJ, Rohde H, et al. (2007) Localised tufts of fibrils on Staphylococcus epidermidis NCTC 11047 are comprised of the accumulation-associated protein. J Bacteriol 189: 2793–2804. 82. Blackman SA, Smith TJ, Foster SJ (1998) The role of autolysins during vegetative growth of Bacillus subtilis 168. Microbiology 144: 73–82. 83. Bremell T, Lange S, Yacoub A, Ryden C, Tarkowski A (1991) Experimental Staphylococcus aureus arthritis in mice. Infect Immun 59: 2615–2623. 84. Josefsson E, Kubica M, Mydel P, Potempa J, Tarkowski A (2008) In vivo sortase A and clumping factor A mRNA expression during Staphylococcus aureus infection. Microb Pathog 44: 103–110. 85. Sakiniene E, Bremell T, Tarkowski A (1996) Addition of corticosteroids to antibiotic treatment ameliorates the course of experimental Staphylococcus aureus arthritis. Arth Rheum 39: 1596–1605. 86. Sambrook J, Fritsch EF, Maniatis T (1989) Molecular cloning: a laboratory manual, 2nd ed. Cold Spring Harbor, N.Y.: Cold Spring Laboratory Press. 87. Horsburgh MJ, Aish JL, White IJ, Shaw L, Lithgow JK, et al. (2002) SigmaB modulates virulence determinant expression and stress resistance: characterization of a functional rsbU strain derived from Staphylococcus aureus 8325-4. J Bacteriol 184: 5457–5467. 88. Novick RP (1967) Properties of a cryptic high-frequency transducing phage in Staphylococcus aureus. Virology 33: 155–166. 89. Kuroda M, Ohta T, Uchiyama I, Baba T, Yuzawa H, et al. (2001) Whole genome sequencing of methicillin-resistant Staphylococcus aureus. Lancet 357: 1225–1240. 90. Frees D, Chastanet A, Qazi S, Sørensen K, Hill P, et al. (2004) Clp ATPases are required for stress tolerance, intracellular replication and biofilm formation in Staphylococcus aureus. Mol Microbiol 54: 1445–1462. 91. Clauditz A, Resch A, Wieland KP, Peschel A, Go¨tz F (2006) Staphyloxanthin plays a role in the fitness of Staphylococcus aureus and its ability to cope with oxidative stress. Infect Immun 74: 4950–4953. 92. Chan PF, Foster SJ, Ingham E, Clements MO (1998) The Staphylococcus aureus alternative sigma factor o´B controls the environmental stress response but not starvation survival or pathogenicity in a mouse abscess model. J Bacteriol 180: 6082–6089.
29
February 2009 | Volume 4 | Issue 2 | e4344