International Conference on Computer Systems and Technologies - CompSysTech’ 2005
The Statistical Features of eLSe Learning Environment Tsvetan Hristov, Tsvetozar Georgiev, Martina Klaus, Rositsa Fischer Abstract: This paper describes the statistical features of eLSe learning environment. The platform is developed in Department of Computing at University of Rousse. It is entirely based on open source components and is used in 14 Bulgarian Universities and also in educational institutions in Germany, Hungary and Russia. A comparison between the use of eLSe in three countries – Bulgaria, Germany and Russia is given. Key words: e-Learning, e-Learning Shell, Database, CMS, LMS, LCMS.
INTRODUCTION The main purpose of the contemporary e-Learning platforms is that they should allow lecturers to easily create and edit WEB-based courses and to provide easy access to actual learning materials. In the process of learning the feedback also plays an important role: first between lectures and students, second between lecturers and the platform itself. The second type of feedback is often received as statistical information. For example such statistical information is: • Materials prepared by the students and stored by the system [4]; • Number of source materials used by the students [8]; • Students’ results [8]: The administrators of the system have access to additional useful information, which can report on: • Statistical information about the age and gender of the users [5]; • The number of on-line courses, the number of unique users, the generated traffic [1]; • Average number of students per course [2]; • Average number of courses created by a lecturer [2]; • Number of users of a given platform, spread in time [7, 9]; • The generated by the users traffic, spread in time [7, 9]. The analysis of the statistical information by the lecturers gives possibilities for improvement the quality of the learning process. The statistical information accessible for the administrators of a given system can be used for improvement of its possibilities. [6] There are often described in the literature statistical data from using a given platform in one educational organization, but there has never been made a comparison of how this platform could function in different organizations. LAYOUT The possibilities of eLSe [3] for collecting and interpreting statistical information in three different educational organizations in three different countries (Bulgaria, Russia and Germany) are described in the present report. Mainly there are two different versions of the eLSe platform. The one of them is designed according to the specific needs of the firms and the other version is designed for the universities. The main differences between these two versions are as follows: • User access: The university version of the system is designed to be opened. After the registration process each user can access all the resources published in the WEB-based courses. The firm version is with restricted access. Users are grouped in user groups. Each user can access the courses depending on the rights of his group.
- - IV.16-1 - -
International Conference on Computer Systems and Technologies - CompSysTech’ 2005
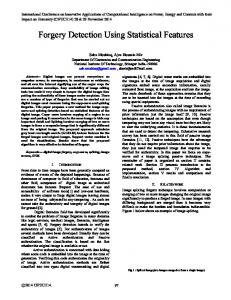
• Authoring system: The permissions for course creation and content publishing in the university system are granted on a request principle due to the large number of publishers. In the firm system the number of the lecturers is limited. The permissions are granted on a group rights principle. Despite of all these differences both types of system generate the same statistical information. According to their roles users have access to different statistical information. • Published courses by years; • User registrations by years; • Average user visits; • Average published resources by a lecturer; • Average published resources in a course; • Published file resources by type; • Course visits; • Accessed Resources. On the other side the system supports different types of users – students, lecturers/instructors and administrators. Depending on the type the relevant users are granted different rights and access to different statistical information (Fig.1). For example, the students have access only to statistical information, which is related personally to their process of learning. The lecturers/instructors have access to statistics concerning the courses they have worked out as well as to statistics concerning students from the relevant courses. The administrators of the system possess access rights the whole statistical information, which includes statistics about the way the system is used. User Roles
Administrators
Lecturers
Students
Access
Statistical Information Administrative, Course and User Statistics
Course and User Statistics
User Statistics
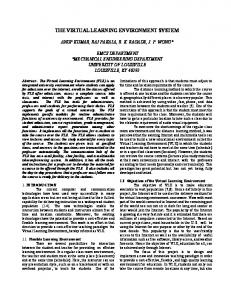
Fig.1. Dependence between user type and access to statistical information On the next figures are shown part of the eLSe statistical features – information about the number of supported courses (Fig.2.), information about registered users (Fig.3.), the number of resources (Fig.4.), and the file format of the used resources (Fig.5.). The results shown on the figures are in consequence of the use of the system for the last 4 years at the University of Rousse (Bulgaria), Volgograd University (Russia) and in Comhard GmbH (Germany). While analyzing the results there should be taken into account the fact that the results for 2005 are for the first 5 months of the year, as well as the fact that the system was installed on the server of Volgograd University in 2003 and in Comhard – in 2004. One of the most important statistical indicators is the number of published courses used by the students. Fig.2 shows a comparative diagram of the number of courses depending on educational organization and the year.
- - IV.16-2 - -
International Conference on Computer Systems and Technologies - CompSysTech’ 2005 700
600
500
400 Courses 300
200
100
0 2002
2003
Rousse, Bulgaria
2004 Year
Volgograd, Russia
2005
All
Comhard, Germany
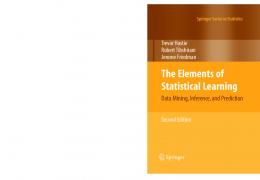
Fig.2. Comparative diagram concerning the number of published courses depending on educational organization and the year The data in Fig.2 show that the number of published courses in the universities is higher in the second year of using the system. This is due to the fact that the process of confirming of new courses in the universities is comparatively slow. On the other side we can expect comparatively equal distribution of the number of new courses by years in Comhard GmbH, which is due to a greater flexibility in the learning process. Another important indicator is the number of registered users in the system. Fig.3. shows a comparative diagram of this number depending on the educational institution and the year. 7000
6000
5000
4000 Registrations 3000
2000
1000
0 2002
2003
2004 Year
2005
Rousse, Bulgaria
Volgograd, Russia
Comhard, Germany
All
Fig.3. Comparative diagram concerning the number of registered users depending on educational institution and the year
- - IV.16-3 - -
International Conference on Computer Systems and Technologies - CompSysTech’ 2005
Data analysis from Fig.3 shows permanent growing of the number of registered users in all 3 institutions. This is an indicator for permanent interest towards eLSe. Interesting information supported by eLSe is the average number of users’ visits. This number shows the average visit of every user in the system. Average Visits: • Rousse, Bulgaria – 4,42 • Volgograd, Russia – 3,99 • Comhard, Germany – 9,57 These results show that the average visit in the University of Rousse and Volgograd University is about 4, whereas in Comhard GmbH the students show a greater interest – over 9. Important statistical information supported by eLSe is the number of resources used for web-based learning. Fig.4. shows a comparative diagram of this number depending on the educational institution and the year. 1600
1400
1200
1000
Resources
800
600
400
200
0 2002
2003
2004
2005
Year
Rousse, Bulgaria
Volgograd, Russia
Comhard, Germany
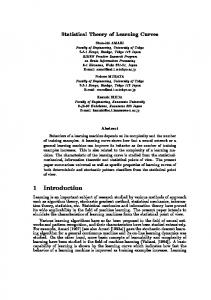
Fig.4. Comparative diagram concerning the number of used resources depending on the educational institution and the year Statistical data show that Volgograd University uses the greatest number of educational resources (over 2000). Maximum values are reached in the second year of using the system in the 3 institutions. The data concerning the average number of published resources by a lecturer as well as the average number of resources per course are of great interest. Average Published Resources by a Lecturer: • Rousse, Bulgaria – 34,93 • Volgograd, Russia – 33,71 • Comhard, Germany – 151,57 Average Published Resources per Course: • Rousse, Bulgaria – 18,28 • Volgograd, Russia – 3,15 • Comhard, Germany – 17,98 These data show that the resources one lecturer publishes in Rousse and Volgograd are approximately equal – 33-34, whereas the same number in Comhard GmbH is about 5 times bigger. Comparing the average number of resources can be concluded that courses
- - IV.16-4 - -
International Conference on Computer Systems and Technologies - CompSysTech’ 2005
in the University of Rousse and Comhard GmbH is about 18, whereas in the Volgograd University is comparatively small – about 3. Due to the statistical features of the platform there can be defined the most preferable file formats used in each educational institution for educational resources publishing (Fig.5.). 1600
1400
1200
1000
Resources
800
600
400
200
0 AVI
DOC
DVI
EXE
JPG
Rousse, Bulgaria
HTML
PDF
PPS PPT File Formats
Volgograd, Russia
PS
RAR
RTF
TXT
XLS
ZIP
Comhard, Germany
Fig.5. Comparative diagram concerning the type of used resources depending on the educational institution Analyzing Fig.5 we can come to the conclusion that text resources are among the most often used, the most preferable file format in Volgograd is DOC file format and less preferable ones are TXT, RTF and PDF. At the University of Rousse and in Comhard GmbH resources in PDF format are prevailing, rarely used are HTML and DOC file format. Other file formats like video, presentation, XSL, ZIP are comparatively low used in Comhard GmbH. Another supported by eLSe statistical information is the number of system visits and the number of accessed resources. They are the following for the 3 educational institutions: Course Visits: • Rousse, Bulgaria – 9967 • Volgograd, Russia – 2487 • Comhard, Germany – 3395 Accessed Resources: • Rousse, Bulgaria – 94989 • Volgograd, Russia – 6911 • Comhard, Germany – 667 There can be noticed that the number of course visits is the highest in the University of Rousse. The lowest course visits are in Volgograd University.
CONCLUSIONS AND FUTURE WORK The functioning of eLSe up till now has revealed its reliability, flexibility and usefulness. The statistical information supported by the system contributes to this. The access to such kind of information and its analysis brings to improvement of learning material and to perfection of the system as a whole. - - IV.16-5 - -
International Conference on Computer Systems and Technologies - CompSysTech’ 2005
REFERENCES [1] Alberer, G. et al., The Learn@WU Learning Environment, nm.wu-wien.ac.at/research/publications/b318.pdf [2] Gard, K., University Educational Technology Services (UETS) Annual Report for FY 2003, www.gsu.edu/~wwwets/aboutuets/reports/annual/UETS Annual Report FY2003.pdf [3] Hristov, T. et al., An Approach to Development of an e-Learning Software Platform, Proceedings of the international conference CompSysTech’2002, Sofia, 2002 [4] Marshall, B. et al., Convergence of Knowledge Management and E-Learning: the GetSmart Experience, uaeller.eller.arizona.edu/ ~byronm/Marshall_JCDL2003_GetSmart.pdf. [5] Yuen, A., W. Ma, Knowledge sharing and teacher acceptance of web based learning system. In R. Atkinson, C. McBeath, D. Jonas-Dwyer & R. Phillips (Eds), Beyond the comfort zone: Proceedings of the 21st ASCILITE Conference (pp. 975-983). Perth, 5-8 December, 2004. http://www.ascilite.org.au/conferences/perth04/procs/yuen.html. [6] Zhao, C., eLearning Content Management Middleware, www.cs.helsinki.fi/u/laine/opekanta/zhao.pdf [7] Zorilla, M. et al., Web Usage Mining Project for Improving Web-based Learning Sites, personales.unican.es/ZORRILLM/PDFs/ Web Usage Mining Project(28-2-05).pdf [8] Requirements for a portal integrating library services and university portals, www.ub.uio.no/ubfelles/prosjekter/ portal/dokumenter/sluttkrav.pdf [9] WebCT Student User Survey, www.admin.qmul.ac.uk/esd/webct/ WebCT_Student_User_Survey_ELP0409.pdf ABOUT THE AUTHOR Tsvetan Hristov, PhD Student, Department of Computing, University of Rousse, Phone +359 82 888 276, e-mail:
[email protected] Principal Lecturer Tsvetozar Georgiev, PhD, Department of Computing, University of Rousse, Phone: +359 82 888 276, E-mail:
[email protected] Martina Klaus, PhD, Comhard, Berlin, Germany, E-mail:
[email protected] Rositsa Fischer, Comhard, Berlin Germany, E-mail:
[email protected]
- - IV.16-6 - -