THE STATISTICAL PERFORMANCE IN A COMPARATIVE STUDY BETWEEN CENTRAL AMERICAN TEACHERS M. Alejandra Sorto Texas State University, United States
[email protected] The statistical performance on an instrument used to compare teachers’ knowledge in two Central American countries is examined. The hypothesis is that there are differences in the performance of statistics items given that one country has a higher allocation of resources for education and higher level of teacher preparation in statistics. A total of 250 third and seventh grade teachers, and primary pre-service teachers were surveyed from randomly selected schools in both countries. Results show that there are significant differences between countries for items measuring graphical comprehension and between seventh grade teachers and others for an item measuring statistical concepts in the context of teaching. INTRODUCTION Central American countries have recently started the process of developing and implementing new educational standards, which include, for the first time, the teaching and learning of statistics in primary and secondary levels of education. As a consequence, governments in some of these countries are starting to make important decisions with respect to the preparation of teachers. These decisions are usually made based on non-empirical evidence due to the lack of human capacity to carry out educational studies and to the fact that third world countries are often left out of international comparison studies like the Third International Mathematics and Science Study (TIMSS) and the Preparatory Teacher Education Study (PTEDS). The governments of Panama and Costa Rica in collaboration with their private sector have decided, for the first time in the region, to base their teacher quality improvement policies on an empirical comparative study of teachers and teaching practices. The relevance of the results presented in this paper is thus two fold. One, it better informs policy makers in these countries about the quality of teachers with respect to their knowledge and how it compares to another country with a similar economical profile. Two, it informs the rest of the world about teachers’ knowledge in a very underrepresented region. OVERVIEW OF COMPARATIVE STUDY Under the leadership of Stanford University and University of Pennsylvania, a diverse research team from several universities and consulting firms from Brazil and Mexico designed and carried out a comparative study during Fall 2006 and Spring 2007 (Marshall & Sorto, 2007). Educational economists focused their comparison on allocation of resources in education, teachers labor market and teacher preparation, and organizational structures. Based on published census and Ministry data, plus interviews, they concluded that : •
•
•
Costa Rica spends a higher percentage of its gross domestic product (GDP) on education than Panama, and Panama seems to spend much more on tertiary education than on primary or secondary. Overall, Panama’s public education “effort” measures favorably against that of other Latin American countries. Measured in purchasing power parity dollars (PPP), Costa Rican teachers earn considerably more than teachers in Panama, particularly primary school teachers. For example, a Costa Rican teacher in his or her late thirties earned about 1100 PPP dollars in 2000, whereas a Panamanian primary school teacher earned about 700 PPP dollars. This suggests that Costa Rica may be able to attract individuals into primary teaching careers with higher levels of educational preparation. In comparing teacher preparation between Panama and Costa Rica, several general points can be made. First, all Costa Rican primary teachers have university degrees, while in Panama, primary teachers can opt for a Normal School degree (grades 10–12) or a university degree, which means that, on average, Costa Rican primary teachers have more training and slightly more preparation in statistics than Panamanian teachers.
© ICMI/IASE 2008. In C. Batanero, G. Burrill, C. Reading & A. Rossman (Eds.), Joint ICMI/IASE Study: Teaching Statistics in School Mathematics. Challenges for Teaching and Teacher Education. Proceedings of the ICMI Study 18 and 2008 IASE Round Table Conference.
However, primary teachers with university degrees have similar levels of preparation in mathematics but different levels in statistics: a primary teacher with a four-year degree (Licenciatura) from the University of Panama receives one descriptive statistics course, one inferential course, one course in “quantitative methods”, and two mathematics education courses. A primary teacher with a four-year degree (Bachillerato) from the University of Costa Rica receives one introduction to statistics for education majors course, and one mathematics education course. Primary teachers from Panama Normal School receive no statistics, which corresponds to about 51% of the primary teachers at the time of the study. Second, secondary teachers in both countries are mathematics specialists and receive considerable preparation in statistics content, including introduction to mathematical statistics. However, teachers with Bachilleratos in secondary mathematics education from the University of Costa Rica have four courses in mathematics education, while mathematics majors with secondary teaching certification from the University of Panama receive no mathematics education courses. From the course descriptions, it is not clear whether students from the University of Costa Rica receive any statistics education as part of their mathematics education courses. Therefore, there are a priori reasons to expect Costa Rican teachers to do better on the quality of teaching statistics. Costa Rica spends more on schooling overall, which translates into longer preparation for teachers and higher pay, particularly for primary teachers. In the rest of the paper I test whether or not these differences turn up in observable differences in teacher statistical knowledge. The overarching research question under investigation was to what extend is Costa Rica teacher knowledge different from Panamanian in relation to their formal preparation? In particular, how do they compare in statistical knowledge and preparation? THEORETICAL BACKGROUND The examination and study of teachers’ knowledge have developed in the past 20 years. Starting with the introduction of the concept of pedagogical content knowledge (PCK) by Shulman (1986) to the broader construct of mathematical knowledge for teaching (MKT) studied by Ball and colleagues (Ball & Bass, 2000; Hill, & Ball, 2004). Groth (2007) was the first to explore content knowledge for teaching with a focus on statistics instead of mathematics. Statistical knowledge for teaching builds on the MKT construct to include common knowledge and specialized knowledge in mathematical and nonmathematical contexts. Common knowledge relates to the necessary statistical knowledge teachers need to have in order to teach well, and specialized knowledge relates to teaching tasks such as providing understandable explanations, appraising students’ unconventional methods for representing or analyzing data, and constructing multiple representations of concepts. Hill and Ball (2004, p. 333) claim “…that teachers of mathematics need both types of content knowledge to teach this subject matter competently.” METHODS After a brief pilot data collection in several schools in the Panama City and San Jose area, 27 schools and two teacher training institutes were visited in Panama, and 50 schools and several teacher training faculties were visited in Costa Rica. The sample was drawn randomly from Ministry of Education data files and included both primary and middle schools from intentionally chosen provinces to account for different realities within each country. This resulted in 100 teachers in Panama and 150 teachers in Costa Rica filling out questionnaires, for a total of 250 teachers. About 36% of them were third grade teachers, 31% seventh grade teachers, and the rest were pre-service teachers from the University of Panama and University of Costa Rica. With respect to location, 73% of the teachers taught in an urban school, 25% in a rural school, and about 2% in an “indigenous” school. The great majority (78%) was teaching in public schools. Almost all seventh grade teachers from Costa Rica and Panama were mathematics specialists with degrees from a four-year institution. About half of the third grade teachers from Panama graduated from a four-year institution, the other half from a Normal
School, while Costa Rican third grade teachers all graduated from a four-year institution. The written instrument was designed to measure three different domains of knowledge. One set of items measured third grade level common knowledge, a second set of items measured seventh grade level common knowledge, and the third set of items measured specialized knowledge for teaching. The small body of research on the impact of teachers knowledge on student achievement have given some evidence to believe that teachers need to know not just the content for which they are responsible (Grade 3 statistics for a third grade teacher) but also the content at least “one level up” and how to apply that knowledge to teaching situations (Conference Board of the Mathematical Sciences, 2001; Hill & Ball, 2004; Hill, Rowan, & Ball, 2005). Each type of teacher (third grade, seventh grade, and pre-service teacher) completed a slightly different version of a written questionnaire. For content knowledge all three versions included both third and seventh grade content questions. For grade three level content the items were in the form of multiple choice or fill in the blank and covered the areas of number and operations, geometry, measurement and statistics. Primary teachers answered a total of 19 of these items, while middle school teachers only answered 15, and teachers-intraining 11. For the area of statistics, third and seventh grade teachers answered two of these items, while pre-service teachers only answered one. These items measured the ability to “read the data”. Higher-level content (grade seven) knowledge was measured by a series of multiplechoice items drawn from the grade seven mathematics curriculum. For the statistics portion, third and seventh grade teachers answered one item designed to measure the ability to “read between” the data (Curcio, 1987). The focus on data representation for the statistics items is because third and seventh grade Panamanian national curriculum only includes the construction and interpretation of bar graphs in third grade and circular and line graphs in seventh grade. For knowledge for teaching (in statistics), all teachers answered one multiple-choice item designed to measure the ability to select the data representation (generated by students) most appropriate to identify the spread and center of the data distribution. Seventh grade teachers also answered three more open-ended items about knowledge for teaching statistics, which are not discussed in this paper. RESULTS It was expected Costa Rican teachers would do better on the statistics portion of the instrument at the primary level and about the same at the middle level and pre-service based on their formal statistical preparation. However, as we know, teachers can acquire informal statistical knowledge from other sources outside the school, such as professional development courses and classroom experience. Statistical Common Knowledge Table 1 summarizes teacher statistical knowledge for each type of teacher. Here the statistical knowledge is limited to three items measuring graphical comprehension at the level of “reading the data” and “reading between” the data (Curcio, 1987) and results should be interpreted with care. The first result that stands out is the significant advantage for Costa Rican teachers—at all levels (p < 0.000 in a two-way ANOVA test). Their averages are roughly 90-97 percent in each category, which is consistent with a teacher preparation regime that requires university level education for all teachers and more exposure to statistical content. The Panama teachers, by contrast, answer about 73-83 percent of the content items correctly. The differences among third grade teachers may be explained by the fact that about 52 percent of the third grade Panamanian teachers that answered the questionnaire have a degree from the Normal School, which required no statistics courses. The discrepancy is much smaller (but statistically significant) among seven grade teachers, as the Panamanian group has an average of 83.3 percent. This result is also consistent with their preparation, as middle school teachers from both countries are math specialists with universities degrees. The largest difference is between the primary pre-service teachers (Table 1). In this category there are some potential validity issues with the comparisons in terms of year of study, quality and rigor of courses, etc. This could explain why pre-service teachers from University of Panama, who take more statistics courses, scored lower than their Costa Rican counterparts. But
overall the three comparison categories provide strong support for the guiding hypothesis related to Costa Rican superiority in teacher preparation. It is worth noting that the same pattern of achievement was observed for other areas of mathematics such as geometry and measurement, and for the overall averages. Table 1. Percentage of correct responses to items Primary (Grade 3) Panama C. Rica Overall average and (standard deviation) Grade 3 Item 1 Grade 3 Item 2 Grade 7 Item 1 Sample sizes
Middle Grades (Grade 7) Panama C. Rica
Pre-Service (Primary) Panama C. Rica
75.4 (25.8)
91.1 (14.9)
83.3 (19.7)
94.3 (14.2)
73.3 (31.4)
97.1 (11.8)
89.1 76.1 60.9
100.0 97.8 75.0
100.0 83.3 66.7
98.1 98.1 86.5
86.7 60.0 ----
100.0 94.2 ----
46
45
24
53
30
52
Source: Panama and Costa Rica Survey, 2006-07.
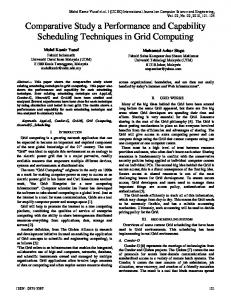
Another result that stands out is the big differences between the performance among the grade three items and the grade seven item. The grade seven item asks teachers to identify the difference in frequency among two categories in a given bar graph (see Figure 1). This is not a very demanding item and yet draws clear differences between teachers for both third and seven grade levels. For primary teachers it demonstrates that their knowledge of “one level up” is limited, and for middle school teachers, especially Panamanian, there is some indication of insufficient knowledge at the level they teach. Students from fifth and sixth grade were asked which subject they like the most. The graph bellow shows the results. 20 15 Votos
10 5 0 Fernando
Joselyn
Oscar
Irián
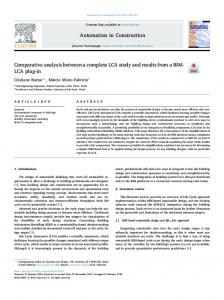
Observe the number of students that like the subjects of Mathematics and Natural Sciences. How many more students like Natural Sciences than Mathematics? Figure 1. Grade 7 Item Specialized Statistical Knowledge for Teaching Figure 2 presents the item used to assess this knowledge and Table 2 a summary of results. The first result that stands out is the higher degree of difficulty for both countries compared to the other items. One reason could be because the item covers statistical concepts that go beyond graph comprehension, and it is primarily nonmathematical. Another result that stands out is that Costa Rican teachers are not leading on the performance of this item. In fact, more third grade Panamanian teachers correctly answered it than any other group of teachers followed by pre-service teachers from the University of Panama. Interestingly, 73 percent of those third grade teachers that answered correctly graduated from the University of Panama and not from the Normal School. We also note that the seventh grade teachers from both countries scored significantly lower than the other two levels (p < 0.01 in a logistic regression model). The implication is that secondary teacher preparation in statistics in both countries is primarily
from a mathematical point of view. The popular choice, especially among Costa Rican seventh grade teachers, that none of the two representations is appropriate for illustrating the center and spread of the distribution, suggests that secondary teachers do not recognize these as representation of data with the same features as a bar graph and a dotplot or histogram. It is worth noting that the pattern of performance in mathematical knowledge for teaching for this sample is somehow different. Both countries scored much lower than in the domain of mathematical content, but Costa Rican teachers were the leaders.
Imagine that two second-grade students in the same class have created the following representations to show the number of teeth lost by their classmates. I)
II)
If the teacher wants to illustrate center and spread of the distribution of teeth lost, which representation is preferable? I b. II c. I and II d. None Source: Adapted from instrument in Sorto (2004). Figure 2. Teacher Responses to Statistics for Teaching Item Table 2. Summary of Responses Given by Teachers to the Item presented in Figure 2
Grade 3 Grade 7 Pre-service Panama C. Rica Panama C. Rica Panama C. Rica a 23 17 5 9 14 18 b 7 13 7 12 2 14 c 1 2 2 3 2 5 d 13 10 6 26 7 15 Blank 3 3 4 3 5 0 Correct 50.0% 37.8% 20.8% 17.0% 46.7% 34.7% CONCLUSION AND RECOMMENDATIONS The analysis of the statistics performance of teachers in Panama and Costa Rica does not follow the same pattern as the mathematical performance, and hence policies with respect to the preparation of teachers in these two areas need to be considered separately. In mathematics and mathematics for teaching, Costa Rica teachers do better at all levels, and seventh grade teachers from both countries do better than third grade teachers; this was not always the case for the performance of items measuring statistical knowledge. Costa Rica teachers performed better than Panamanian teachers at all levels on the items measuring interpretation of bar graphs. It is surprising that there are significant differences in such a basic skill that can be learned from just being exposed to reading newspapers or reports. It is with hesitation that we claimed this lack of basic knowledge is due to the no requirement of statistics for primary teachers from Normal Schools in Panama. Nevertheless, this result together with the fact that now students are expected to construct and interpret graphs, we recommend the inclusion of at least one statistics course in the Normal Schools program.
The performance on the item that involves the application of statistical concepts in a teaching context, gives some indication that teachers from both countries, especially seventh grade teachers, are not making connections between descriptive statistical measures and the graphical representation of data. It is also surprising that even though middle grade teachers take more higher-level statistics courses than primary teachers, they performed significantly lower. The implication is that they are learning statistics in ways that do not focus on the nonmathematical aspect, such as examining the context to make sense of the data, that is, separate from the statistical discipline. Groth (2007) claims that this is one of the differences between mathematical knowledge for teaching and statistical knowledge for teaching. In Groth’s terms, the items measuring graph comprehension required primarily mathematical knowledge, and the item in Figure 1 primarily requires statistical knowledge. He claims “learning experiences for statistics teachers should intertwine the development of common and specialized mathematical and nonmathematical knowledge by focusing on tasks that arise within teaching contexts” (p. 432). Of course we can not recommend a change of policy for the preparation of future middle school teachers based on a single item for an entire country, but we have some indication that the hypothetical aspects mentioned above about the knowledge for teaching statistics are consistent with the results presented here. More specifically it is recommended that: •
•
The average Panama teacher at the primary level needs to have a content level that is beyond “statistics facts” and a handful of algorithms. With proper preparation, they can learn to have a large repertoire of interpretations of major concepts and a way they can be applied. At least one statistics course is recommended for elementary teachers at the Normal school. For middle school teachers in Costa Rica and Panama, it is recommended to create a program that is separate from the high-school teachers with statistics education courses. One of the major findings in this study is the apparent low level of specialized nonmathematical content knowledge for middle school teachers. Teachers of middle grades need to have knowledge of the teaching and learning of fundamental ideas of statistics. The idea is to broaden their understanding of statistical connections between one educational level and the next, connections between elementary and middle grades as well as between middle grades and high-school.
REFERENCES Ball, D. L., & Bass, H. (2000). Interweaving content and pedagogy in teaching and learning to teach: Knowing and using mathematics. In J. Boaler (Ed.), Multiple perspectives on the teaching and learning of mathematics (pp. 83-104). Westport, CT: Ablex. Curcio, F. R. (1987). Comprehension of mathematical relationships expressed in graphs. Journal for Research in Mathematics Education, 18, 382-393. Conference Board of the Mathematical Sciences (2001). The mathematical education of teachers. Providence, RI: American Mathematical Society. Groth, R. E. (2007). Toward a conceptualization of statistical knowledge for teaching. Journal for Research in Mathematics Education, 38, 427-437. Hill, H., Rowan, B., & Ball, D. L. (2005). Effects of teachers’ mathematical knowledge for teaching on student achievement. American Educational Research Journal, 42, 371-406. Hill, H. C. & Ball, D. L. (2004). Learning mathematics for teaching: Results from California’s mathematics professional development institutes. Journal for Research in Mathematics Education, 35, 330-351. Marshall, J. H. & Sorto, M. A. (2007). Teacher mathematics knowledge. In M. Carnoy (Ed.), Comparing education in Panama and Costa Rica: What lessons for educational improvement? Unpublished manuscript, University of Pennsylvania. Shulman, L. S. (1986). Those who understand: Knowledge growth in teaching. Educational Researcher, 15, 4-14.