ogy, Erindale Campus, University of Toronto, Mississauga, ON L5L lC6. Canada. merical estimation techniques, and Zwislocki and Good- man (1980) have ...
Perception & Psychophysics 1994. 56 (1). 1-11
The stimulus range effect: Evidence for top-down control of sensory intensity in audition SCOTI' PARKER American University, Washington, D.C. and BRUCE SCHNEIDER University of Toronto, Mississauga, Ontario, Canada The influence of intensity range on the perceived magnitude of a stimulus is well documented and usually attributed to response biases. Recent studies, however, have suggested that the range effect might be sensory in origin. To test this notion, we had one set of subjects compare loudness intervals in three conditions: a broad-range condition (15 tones, 23-95 dB SPL), a soft shortrange condition (the lowest 10 tones from the broad-range condition), and a loud short-range condition ~t~e highe~t 10 .tones). Nonmetric. scaling showed that the broad-range and loud short-range conditions had identical loudness functions, However, the second derivative ofthe loudness function was larger for the soft short-range condition than for the broad-range condition. This pattern of results. is consistent with the notion of a nonlinear amplifier whose gain and degree of nonlinearity are adjusted under top-down control, so as to prevent distortion and increase discriminability.
It is well known that measures of sensory events are subject to context effects. For example, numerical estimates of loudness are affected not only by stimulus intensity, but also by the context provided by the instructions, and by the number, spacing, and range of the sounds being presented. Many investigators interested in sensory processes tend to regard these context effects as "nuisance" variables and would like to banish them to the realm of higher order, nonsensory processing, where they can be catalogued, controlled for, and ultimately dismissed. For example, S. S. Stevens (1957, 1971) argued that it often was difficult to uncover the "true" sensory representation because of the operation of a number of "psychological" factors that bias subjects' reports of sensory magnitude. Indeed, response biases have been invoked to explain why varying the stimulus range (Teghtsoonian, 1973), stimulus spacing (Stevens & Galanter, 1957), and instructional parameters (Robinson, 1976) perturb the form of the loudness function, and many schemes have been developed to control, counterbalance, and/or circumvent these so-called higher order effects. For example, Schneider, Parker, Valenti, Farrell, and Kanow (1978) used nonmetric scaling techniques to circumvent the operation of many of the response biases found in nu-
This research was supported by a grant from the Natural Sciences and Engineering Research Council of Canada. We thank Jane Carey for conducting these experiments. Correspondence should be addressed to either S. Parker, Department of Psychology, American University, Washington, DC 20016-8062, or B. Schneider, Department of Psychology, Erindale Campus, University of Toronto, Mississauga, ON L5L lC6 Canada.
merical estimation techniques, and Zwislocki and Goodman (1980) have developed a scaling technique that they believe is capable of overcoming these response biases. Such viewpoints and approaches, until recently, reflected a consensus that most, if not all, of the above-mentioned context effects were due to the operation of higher level, nonsensory processes, and that these "cognitive" factors interfered with the measurement of relatively simple sensory processes. Recent experiments by Marks and his colleagues (Algom & Marks, 1990; Marks, 1988; Marks, Szczesiul, & Ohlott, 1986; Marks & Warner, 1991) have identified a context effect in loudness judgments that may not be attributable to such higher order processing. Marks (1988) had subjects estimate the loudnesses of both 500- and 25OO-Hz tones, intermixed in the same session, by using the method of magnitude estimation. In one condition, the sound-pressure levels (SPLs) of the 5OO-Hz tones ranged from 35 to 75 dB, and the 25OO-Hz tones ranged from 50 to 85 dB. In the other condition, the 5OO-Hz tones ranged from 55 to 90 dB, and the 25OO-Hz tones ranged from 30 to 65 dB. Because both the 500- and 25OO-Hz tones were intermixed within a session, it was possible to determine, for example, the intensity of the 25OO-Hz tone whose loudness judgment equaled that given to a 70dB, 5OO-Hz tone. In Condition 1, a 68-dB, 25OO-Hz tone was rated as being as loud as the 70-dB, 5OO-Hz tone. However, in Condition 2, a 51-dB, 25OO-Hz tone was rated as being as loud as the 70-dB, 5OO-Hz tone, indicating a 17-dB shift in the loudness match between the two conditions. The major difference between the two conditions was that, in Condition 1, the intensity levels of the
Copyright 1994 Psychonomic Society, Inc.
2
PARKER AND SCHNEIDER
500-Hz tones were lower than those of the 2500-Hz tones, whereas the reverse was true in Condition 2. It appears that reversing the intensity ranges at the two frequencies dramatically affected the loudness matches. Thus, loudness matches obtained from a magnitude estimation procedure are affected by relations between the ranges of the sounds at the two different frequencies. Because magnitude estimation was involved, initially it was tempting to assign the cause of this context effect to the malleability of people's use of numbers, as Marks (1988) did. Subsequent studies of this context effect, however, began to indicate that the source of the effect might be sensory rather than cognitive. Schneider and Parker (1990) investigated the context effect found by Marks by having subjects choose which of two pairs of tones defined the larger loudness interval. The tones within a pair could differ in both intensity and frequency (500 or 2500 Hz). Nonmetric scaling techniques were used to determine loudness values for both the 500- and 2500-Hz tones, making it possible to find, for example, the decibel value of a 2500-Hz tone that was as loud as a 7Q-dB, 500-Hz tone. In different conditions, the intensity range at one frequency was varied relative to the intensity range at the other frequency. Contrary to Schneider and Parker's expectations, the relative intensity ranges at the two frequencies did affect the derived loudness matches in some conditions. Because their subjects did not make numerical judgments, these context effects could not readily be attributed to numerical response biases. Other evidence suggesting a sensory origin for the context effect has been provided by Marks and Wamer (1991), and Marks (1992). Marks and Warner, using Marks's (1988) paradigm, varied the frequency separation between the two groups of tones and found that frequency separation governed the size of the context effect. When the frequency separation was less than a critical band, so that the auditory filter that was centered on one frequency would still respond to stimuli at the other frequency, the context effect disappeared. Thus, the context effect is not simply due to the discriminability of the two frequencies; it also requires that the two frequencies be processed in separate sensory channels. If the context effect depends on the critical band-clearly a peripheral process-it is difficult to attribute its occurrence to cognitive rather than sensory processing. Finally, Marks (1992) occasionally interrupted magnitude estimation sessions employing his (1988) context paradigm to ask the subjects which of two stimuli was louder (a 500-Hz or a 2500-Hz tone). Note that this judgment did not require a numerical response, only a binary decision by the subject; yet he found that the subjects' loudness comparisons were affected by the stimulus context. Again, this suggests a sensory origin for the context effect. If the context effect has a sensory origin, what sensory process produces it? Schneider and Parker (1990) suggested that the context effect is produced by the operation of a narrow-band amplifier, which is engaged when all the stimuli within its bandwidth are soft. In their experiments, when soft tones at one frequency (fl) were
combined with a broad range of tones at another frequency (f2), the loudnesses of at least some of the fl tones were increased. When, however, only loud tones at fl were combined with a broad range of tones at f2, no change in the loudnesses of the fl tones was observed. These results are consistent with the notion that context influences the" gain" in the critical band around fl. If, during the course of the experiment, subjects hear only soft fl tones, they can "tum up" the gain in this channel in order to process the tones more readily. If, on the other hand, the fl tones are sometimes loud, then turning up the gain of the fl amplifier might be expected to produce distortion in that channel when the louder tones are presented. Therefore, the gain would be turned up only when no loud tones are expected. This model requires that the stimuli at two frequencies be separated by at least one critical band, as Marks and Warner (1991) found. If the f2 tones "spilled over" into the fl channel, then the fl channel would experience both loud and soft stimuli, so that no context effect would be observed. Of course, rather than turning up the gain on soft tones, we could hypothesize that the gain is normally set high but is turned down in the presence of loud sounds, and that the mechanism functions more as an attenuator than as an amplifier. Either an attenuator or an amplifier could provide the kind of gain control that would account for the results found by Schneider and Parker (1990). For simplicity, we refer to the gain control mechanism as an amplifier. Note that the notion of an internal amplifier does not require the presence of tones at two different frequencies in order for stimulus range to have an effect on the coding of loudness. If only soft tones at one frequency are presented, then subjects should tum up the gain in that channel, independent of anything that is happening in other channels. Therefore, the context effect should occur in experiments in which tones of one frequency are used. One way to demonstrate the existence of this effect is to compare the loudnesses of a set of soft tones, when only they are presented (Condition S), with their loudnesses when they are combined with loud tones to produce a set of tones covering a broad range (Condition B). Only in Condition S should the amplifier be engaged, thereby increasing the loudnesses of the soft tones. However, if we were to compare the loudnesses of a set of loud tones when only they were presented (Condition L), with the loudnesses when they were included within a broad range (Condition B), we would not expect any change in their loudnesses because the amplifier would not be engaged in either condition. As in our previous experiments, we used a nonmetric analysis of comparisons of loudness intervals to circumvent any response biases in numerical judgments, so that any context effect that remained could not easily be attributed to higher order processes.
METHOD Subjects Eight subjects, students and research assistants associated with the Psychology Department of the University of Toronto, partici-
TOP-DOWN CONTROL OF SENSORY INTENSITY pated in these experiments. There were 5 males and 3 females, ranging in age from 25 to 37 years. All were paid for their participation and reported having no auditory pathology. Apparatus The I-kHz tones were generated digitally (sampling rate of 20 kHz) and converted to analog form by using a Spectrum TMS3200c25 16-bit digital signal processing board in a Comptech 386 computer. Calibration using a Wavetek spectrum analyzer and an oscilloscope showed that all harmonics were at least 80 dB below the highest signal level and 27 dB below the lowest signal level (23 dB SPL). The amplitude of the signal was controlled digitally, and the signals were switched on and off with a IO-msec rise and fall time. Stimuli were presented monaurally (preferred ear) over TDH49 earphones. The earphones were calibrated by using a Briiel & Kjaer 2209 sound-level meter with a l-in, microphone in a 6-cm 3 coupler. The subjects sat in a double-walled sound-attenuating chamber. Procedure The broad-range set (Condition B) contained 15 stimuli, whereas the short-range soft set (Condition S) and the short-range loud set (Condition L) contained only 10 stimuli each. Five stimuli were common to all three sets. The stimuli in Condition B were 23,29,34, 40,46,51,56,62,67,70,75,79,84,90, and 95 dB SPL. The stimuli in Condition S were the lower 10 of those in Condition B (23-70 dB SPL); the stimuli in Condition L were the higher 10 of those in Condition B (51-95 dB SPL). Thus, stimulus levels of 51, 56, 62, 67, and 70 dB SPL were common to all three conditions. Each pair of distinct stimuli defined a loudness interval. In both the soft and loud short-range conditions there were 45 (10X9/2) distinct stimulus pairs possible from the 10 intensities. Thus, the number of distinct comparisons among these 45 loudness intervals was 45 x 44/2 = 990. However, because loudness is monotonic with intensity, we do not need to compare loudness intervals in which the tone intensities defining one interval bracket those defining the other interval. For example, we know that the loudness interval defined by tonal intensities of 50 and 75 dB is larger than that defined by intensities of 55 and 70 dB, because the first interval brackets the second. Removing these bracketed cases reduces the number of comparisons to 540 (Bissett & Schneider, 1991, p. 694; Fagot, 1959, pp. 165-166). The 15 stimuli in the broad-range condition result in 105 (15 X 14/2) distinct stimulus pairs. Of the 5,460 (105 X 104/2) possible loudness-interval comparisons among these pairs, we can eliminate 2,275 of them because the intensities of one pair bracket those of another, leaving 3,185 loudness-interval comparisons to be tested (Bissett & Schneider, 1991). Because the remaining number of comparisons in all three conditions was so large, the subjects were presented with a random subset of these comparisons. Bissett and Schneider (1991) showed that loudness scales constructed from only 30% of 540 critical comparisons among 10 tones recover the "true" form of the loudness scale almost as well as when they are constructed from all 540 comparisons. Similarly, when there are 15 stimuli, a mere 20% of the 3,185 critical comparisons are sufficient. Thus, in the present experiment we used only 162 comparisons in the loud and soft shortrange conditions and only 637 comparisons in the broad-range condition. The subset of comparisons (162 or 637) chosen in each condition was randomly selected. In this random selection, the stimuli were labeled 1-10 for the soft and loud short-range conditions, and the 540 interval comparisons were defined by listing their component stimuli (e.g., 1,3 vs. 2,7 defined an interval comparison). From this set of interval comparisons, 162 were chosen at random by a computer program. The same 162 comparisons were used for both the loud and soft short-range conditions. The only differences were that Stimuli 1, 2, ... , 10 in the soft short-range condition had in-
3
tensities of23, 29, ... ,70 dB, whereas Stimuli 1,2, ,10 in the loud short-range condition had intensities of 51, 56, , 95 dB. In the broad-range condition, the stimuli were labeled 1-15, the interval comparisons were defined, and 637 of them were chosen at random. In each condition, all the subjects were presented with the same comparisons. However, each subject was presented with the interval comparisons for a given condition in a different random sequence. Within a single pair, there were two possible orders in which the tones could occur; there were two pairs, so there were four possible orders of tones within pairs. In addition, each pair could be assigned to either Button lor Button 2, so there were eight possible arrangements. Each of the eight arrangements for each comparison of pairs was randomly assigned to 1 subject. Both the loud and soft short-range conditions (Conditions Land S) consisted of 4 sessions: a practice session, which contained 50 comparisons, and 3 experimental sessions. The purpose of the practice session was to familiarize the subjects with the range of stimuli employed. The first 2 experimental sessions contained 60 comparisons each, and the third contained 42 comparisons. Within each experimental session, the subject experienced the full range of intensities, usually within 3 to 4 comparisons. The broad-range condition consisted of 13 sessions. The first was a practice session containing 50 comparisons. The next 8 contained 60 comparisons each. Because there was a l-rnonth break between the 8th and 9th sessions, the 9th session was preceded by another practice session containing 50 comparisons. Experimental Sessions 9 and 10 contained 60 comparisons, and Session 11 contained 37 comparisons. Again, each subject experienced the full range of intensities within each experimental session, usually within 5 to 6 comparisions. In each condition, stimulus presentation was initiated when the subject pressed one of two buttons. When Button 1 was pressed, the computer, after a 50-msec delay, presented the two intensities in Pair 1 for 750 msec each, separated by a 500-rnsec silent interval. Pressing Button 2 presented the second pair of tones in an identical manner. The subjects were allowed to listen to each pair as many times as they wished before indicating their judgment by pressing one of the two response buttons. They were instructed to listen to the loudness difference between the tones in each pair, and indicate the pair in which the tones were more widely separated in loudness.
RESULTS If 5 or more of the 8 subjects judged pair (i,j) to differ more in loudness than pair (k,l), we would consider the loudness interval in the first pair to be greater than the loudness interval in the second pair [i.e., (i,j) > (k,l)]. If only 4 subjects judged the first as being larger than the second, we would consider the loudness-difference comparison to be indeterminate [i.e., (i,j) ... (k,l)]. The number of such indeterminate pairs was 51 in the broad range, 17 in the soft short range, and 4 in the loud short range. To determine a loudness scale for each condition, a nonmetric scaling procedure specifically designed for comparisons of intervals (Bissett & Schneider, 1991) was employed. In this procedure, loudness values, L, are assigned to each of the tones, so that whenever (i,j)
>
(k,l), then IL(i) - L(j)1
>
IL(k) - L(I)I. (1)
Of course in data with error, it is not possible to do this perfectly; hence the program minimizes a badnessof-fit index called G, where G is the proportion of times
4
PARKER AND SCHNEIDER
that relation 1 is violated. If G = 0, then the loudnessdifference comparisons are perfectly predicted by the difference in loudness values. Values of G were .084 for Condition B, .090 for Condition S, and .044 for Condition L. These values of G can be used to estimate the degree to which the loudness values represent interval scale measurement. To accomplish this, the index of coordinate metric recovery (CM) was estimated. CM is the squared Pearson correlation coefficient between the true loudness values of the stimuli (which presumably generated the obtained comparisons) and the loudness values produced by the program. Hence, CM varies between 0 and 1, and CM = 1 indicates that the true loudness values have been perfectly recovered. In empirical investigations conducted with these techniques, the true loudness values are unknown. Bissett and Schneider (1991), however, have shown how CM can be estimated from G. Hence, if the estimated value of CM is sufficiently high, the loudness values obtained from the program can properly be regarded as representing interval scale measurement. The estimated value of CM was greater than .99 in all three conditions. Given these high values, the loudness values in each condition can be considered as representing interval scale measurement of loudness. The loudness values determined in this fashion are unique only up to affine transformation-that is, up to the addition of a constant and multiplication by a constant. If, for example, the loudness values determined from the nonmetric program were all doubled and then increased by 20, the differences among these new values would still predict the subjects' judgments precisely as well. Therefore, in order to compare loudness values across conditions, we first have to normalize them. Recall that five stimuli were common to all three conditions. Standard least squares linear regression techniques were used to determine estimates of the values of a and {3 in the equation y = ay' + {3, where y' represents the loudnesses of the five tones in Condition S that were also common to Condition B, and y represents the loudness of those Condition B tones. All of the tones in Condition S were then rescaled by using the least squares estimators of a and {3. A similar procedure was followed in order to rescale the loudness values from Condition L. The correlation coefficients for these five values were .929 for Conditions Band L, and .980 for Conditions Band S. If the relation between loudness and sound-pressure level is independent of the physical range ofthe stimulus sets employed, the loudness values from all three conditions should lie along a single curve when plotted as a function of sound pressure. In particular, if loudness is a power function of intensity, and the loudness values, Lv, determined in these conditions are affine transformations of loudness, then
L; = ap"
+ b,
(2)
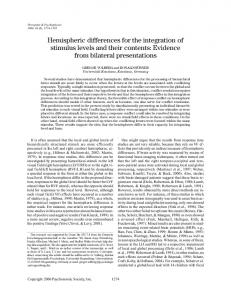
where p is sound-pressure level, a and b are constants, and n is the exponent ofthe power function. These loudness values (in arbitrary units) are plotted in Figure 1 as
a function of decibels of sound pressure (dB SPL). The smooth curve drawn through the data points is the least squares fit of Equation 2 to the loudness values from the broad-range experiment, and it has an exponent (as a function of sound pressure) of 0.35. Note that the loudness values for the broad-range Condition B are nearly identical to those from the loud short-range Condition L. However, the five softest loudness values from the soft short-range Condition S diverge from those of the broadrange condition. Note that this divergence occurs despite the fact that the five loudest of the soft short-range loudness values were adjusted so that they were as close as possible to the equivalent five values in the broad-range condition. This suggests that the function that relates loudness to sound-pressure level in Condition S differs from the functions for Conditions Band L, but that the functions for the latter two conditions are equivalent. The loudness values obtained in Condition S are plotted as a function of the equivalent values in the broad-range condition (Condition B) in Figure 2. Also plotted are the loudness values from Condition L as a function of their corresponding values in Condition B. Here, a point represents the loudness values of a tonal intensity that was common to both conditions. Loudness values for the soft short-range condition are a positively accelerated function of their broad-range counterparts. On the other hand, loudness values for the loud short-range condition appear as a straight line against their broad-range counterparts. Similar plots were examined for the individual subjects. To test for positive acceleration in these plots, power functions of the form
y = ax' + {3 were fit to each plot, where x represents the broad-range projection values, y represents their short-range counterparts, and a, {3, and r are fitted constants. (Before fitting these functions to the data of individual subjects, each set of projection values was normalized so that they ranged from 0 to 1.0.) Values of r greater than 1 indicate the presence of positive acceleration in a plot. 1 For all 8 subjects, the values of r were greater than 1 for the soft shortrange versus broad-range plots (r = 1.74, 2.28, 2.22, 2.57,1.25, 1.20,2.38, and 1.42 for Subjects 1-8, respectively). If, in the population, both sets of projection values are linearly related, we would expect an exponent of 1.0. A sign test, used to verify the hypothesis that the median value of the exponent is 1.0, was significant at the .01 level (two-tailed). On the other hand, for the loud shortrange versus broad-range plots, the values of r were .87, .83, .86, 1.15, .77, 1.43, .81, and 1.11 for Subjects 1-8, respectively. The average exponent (.98) is very close to 1.0. A sign test of the hypothesis was not significant (p > .70). Thus, there is no evidence that the loudness projections of the individual subjects deviate systematically from a linear relation when the loud short-range values are plotted as a function of their broad-range counterparts. We conclude, as indicated in Figure 2, that (1) the loudness values for the soft tones in the soft short-range condition are a positively accelerated function of the loud-
TOP-DOWN CONTROL OF SENSORY INTENSITY
,....
rn
0
broad range
Z
0 A
"sort' range
E-
c:: < c::
"loud" range
E-