INTERNATIONAL JOURNAL OF BUSINESS, 20(1), 2015
ISSN: 1083-4346
The Early Bird Gets the Worm? The Stock Returns and Operating Performance of Quick SEOs Yi Jianga*, Mark Stohsb, Xiaoying Xiec a
Department of Finance, Mihaylo College of Business and Economics California State University, Fullerton
[email protected] b Department of Finance, Mihaylo College of Business and Economics California State University, Fullerton
[email protected] c Department of Finance, Mihaylo College of Business and Economics California State University, Fullerton
[email protected]
ABSTRACT This paper examines the rationale and performance of firms that issue quick SEOs (SEOs issued within six months of IPOs). We find that firms experiencing larger IPO underpricing, larger stock price run–ups after the IPO, and larger IPO offer size tend to return to the market with an SEO earlier than the others. Firms that issue SEOs quickly after an IPO underperform in comparison to their peers. The mean announcement effect of firms issuing SEOs within six months of the IPO is 2.69% lower than that of firms issuing SEOs six months or more following their IPOs. Firms issuing SEOs shortly after their IPOs also exhibit worse long–run stock returns and operating performance. The results are most consistent with the hypothesis that managers time the market by issuing overvalued equities to take advantage of the “windows of opportunity.” JEL Classifications:
G14, G34, G32
Keywords: seasoned equity offering; initial public offering; market timing; market feedback
*
We thank Matt Billett, Philip Davis, Jon Garfinkel, Erik Lie, Yiming Qian, Jay Ritter, Ashish Tiwari, and Anand Vijh for helpful comments and suggestions. All errors are our own.
2
Jiang, Stohs, Xie
I.
INTRODUCTION
Some firms decide to issue seasoned equity offerings (SEOs) very quickly after an initial public offering (IPO). Such corporate decisions are puzzling for the following reasons. First, it is known that the average impact on firm value from an SEO is negative. So why issue SEOs at all? Second, most firms issuing SEOs typically wait one to three years after an IPO. Why then do some act so quickly, i.e., by issuing SEOs within six months of an IPO, a very sensitive time period for existing shareholders?1 The primary objective of our research is to investigate why some firms issue SEOs quickly following their IPOs. While prior studies have improved our understanding of related decisions, very few have examined the time between an IPO and the first SEO. Our contribution fills this void. The finance literature offers two primary explanations for quick SEO decisions. First is the market feedback hypothesis, which states that high stock returns after an IPO signal that the marginal return to the project is high, encouraging managers to increase investment by raising additional capital. Jegadeesh, Weinstein, and Welch (1993) find that firms experiencing larger post–IPO returns tend to issue SEOs within three years of their IPOs, and that the size of the SEOs is larger, which they interpret as being consistent with the market feedback hypothesis. The second explanation points to market timing opportunities (also labeled as the overvaluation hypothesis by Myers and Majluf (1984)). According to this hypothesis, managers use quick SEOs to take advantage of “open financing windows” to sell overvalued equity. Overall, we find support for the market timing/overvaluation hypothesis in explaining firms’ SEO decisions shortly after their IPOs. The support relies on studying publicly traded firms that issue SEOs within six months of their IPOs. Specifically, we address the following research questions: (1) which hypothesis best explains why firms conduct quick SEOs? (2) How does the market react to the announcement of a quick SEO? (3) What is the long–run stock performance of firms conducting quick SEOs? (4) What is the operating performance of our sample firms? Jegadeesh, Weinstein, and Welch (1993) find that firms with larger post–IPO returns are more likely to issue SEOs within three years of their IPOs.2 They interpret their results as being most supportive of the market feedback hypothesis. Yet they overlook the overvaluation hypothesis and some of their results do not support the market feedback hypothesis. Their analysis employs a long (three–year) window. We suggest that a short window is more likely to capture a firm’s equity issuance decision soon after its IPO. In addition, we examine the post–issue performance of SEO firms to detect whether managers engage in market timing. DeAngelo, DeAngelo, and Stulz (2010) study the factors determining a firm’s decision to issue an SEO at a given year and find that near–term cash need is the primary motivation for SEOs. They argue that both market–timing opportunities and a firm’s corporate lifecycle (which is defined as the number of years listed) play a statistically significant but only ancillary role in the decision. DeAngelo et al. (2010) treat the time between an IPO and SEO as exogenous to an SEO issue decision, using the number of years listed as a proxy for a firm’s lifecycle. Our analysis differs by treating the time between an IPO and SEO as endogenously determined by firm characteristics and market conditions. To control for the corporate lifecycle hypothesis,
INTERNATIONAL JOURNAL OF BUSINESS, 20(1), 2015
3
following Loughran and Ritter (2004), we use the number of years since the founding date of the firm as a proxy for a firm’s lifecycle stage.3 Our results suggest that the market–timing hypothesis holds after controlling for a firm’s lifecycle stage. There has been very little empirical work on the timing of a firm’s first SEO. Since firms issuing early SEOs tend to be smaller, younger, and risker, the SEO timing decision may be extremely valuable to them. In contrast, firms conducting SEOs at least one to three years after their IPOs are larger, more mature, and are followed by more analysts (e.g., Jegadeesh, Weinstein and Welch, 1993; DeAngelo, DeAngelo, and Stulz, 2010; Krigman, Shaw, and Womack, 2001). Issuing SEOs when the equity market is hot may not be as valuable for these more mature firms. Jegadeesh, Weinstein and Welch (1993) interpret their results as support for the market feedback hypothesis. DeAngelo, DeAngelo, and Stulz (2010) argue near-term cash need is the primary SEO motive. Krigman, Shaw, and Womack (2001) examine underwriter switching for follow–on SEOs and find evidence consistent with signaling hypothesis. Using these findings as a foundation, we reason that an analysis of quick SEOs should provide more evidence about the proper role of the market timing hypothesis. An analysis of quick SEOs is of particular interest because of the high frequency of such SEOs in the US stock market. In our sample, many firms use quick SEOs to reach a higher level of capitalization soon after their IPOs. Thus, identifying factors determining the time between firms’ IPOs and their first SEOs is of great importance to investors. Our research approach is as follows. First, we address the question of why some firms issue SEOs earlier than others. Results indicate that quick SEO firms tend to be smaller and younger, have larger IPO issue size and greater IPO underpricing, and larger post–IPO stock price run-ups. Next, we examine market reaction by analyzing the announcement effect of SEOs. Prior research has generally demonstrated a negative announcement effect upon an SEO announcement (e.g., Asquith and Mullins, 1986; Eckbo and Masulis, 1995).4 Our study differs in that we compare the announcement effect for firms issuing very early SEOs and late SEOs. We find that the market is more surprised by quick SEOs and that the price decline associated with the SEO announcement is more severe for these firms, presumably because of stock price overvaluation. We argue that such results support the overvaluation rather than the investment opportunity hypothesis. Third, we analyze whether the market properly values firms. Specifically, if companies announce stock issues when their stock is grossly overvalued, can the market reevaluate the stock appropriately, or will the stock still be substantially overvalued when the issue occurs? To address this question, we compare the long–term stock returns of firms issuing SEOs in our sample against five alternative matching benchmarks. Consistent with Loughran and Ritter (1995), we find strong evidence of poor performance following equity issuance. The mean three–year buy–and–hold abnormal–return (BHAR) for all SEOs in our sample is –23.13%, while quick SEOs have a more negative BHAR of –59.97%, compared with a BHAR of –17.54% for late SEOs. Our results indicate current shareholders benefit from a quick SEO, while new shareholders suffer a loss in the long–run.5 To evaluate the impact of the timing of SEOs and firm characteristics on the firm’s subsequent share performance more thoroughly, we perform multivariate regressions of BHARs on the logarithm of the time between the IPO and the first SEO (or early issue dummy), pre–issue stock–price appreciation, and other control variables.
4
Jiang, Stohs, Xie
We find that firms’ three–year BHARs are positively related to the logarithm of the time between IPO and the first SEO (or negatively related to the early issue dummy), which provides evidence for the poorer long–run performance of quick SEOs. Beyond the buy–and–hold returns approach, we employ two additional procedures to examine the underperformance of firms conducting quick SEOs. The first procedure uses a time–series of cross–sectional regressions on monthly individual firm returns. The results suggest that firms conducting new issues underperform by 41.5 basis points per month, and firms conducting quick SEOs underperform by 111 basis points per month.6 This evidence suggests that firms conducting quick SEOs experience more severe underperformance. The second procedure is the calendar–time portfolio analysis. We regress portfolio excess returns on Fama–French’s three factors and report the “alphas,” which measure the monthly abnormal returns associated with the SEO announcement. In the three–factor regressions, the alphas of non–issuers are larger than the alphas of issuers. For all issuers, the alpha of issuers conducting a late SEO significantly exceeds that of issuers conducting an early SEO. These results also support the overvaluation hypothesis. We also consider the market feedback hypothesis as an alternative to market timing. This hypothesis implies that investments increase with aftermarket returns. Hence, firms issuing early SEOs should have higher investment rates. Hovakimian and Hutton (2010) examine repeat SEOs and document a positive relationship between the first year post–issue returns and the likelihood of a follow–on equity issuance. They interpret their results as most consistent with the market feedback hypothesis: that a high post–issue return encourages managers to increase the firm’s investment because the marginal return to the project is high. We test this hypothesis by estimating regressions of investment on aftermarket returns, an SEO within six months of IPO dummy, as well as the interaction variables between aftermarket returns and the six months dummy. Our estimation results are inconsistent with the market feedback hypothesis. Finally, we examine whether the timing of an SEO affects post–issue operating performance. We find that firms conducting quick SEOs exhibit the most severe decline in operating performance among all the issuing firms. As the inflated stock price cannot be sustained following the IPO, the returns decline, reflecting poor operating performance. This finding is also consistent with the overvaluation hypothesis. The rest of the paper is organized as follows. Section II describes our hypotheses and data, Section III discusses the methodology for measuring SEO underperformance, Section IV presents the main results, Section V provides robustness checks, and Section VI summarizes. II. A.
HYPOTHESES AND DATA
Hypotheses
The market feedback hypothesis states that high stock returns signal high marginal returns to the projects, which in turn, encourage managers to increase investment by raising additional capital. The hypothesis therefore predicts:
INTERNATIONAL JOURNAL OF BUSINESS, 20(1), 2015
5
H1: Firms with higher aftermarket returns are more likely to issue SEOs earlier than firms with lower aftermarket returns. Intuitively, firms with high aftermarket returns are high quality firms with good investment opportunities. It is more costly for high–quality firms to defer their investments in new projects than it is for low quality firms. H2: The market reacts less unfavorably to the announcement of quick SEOs. If firms with good investment opportunities are more likely to issue quick SEOs, the market should be less surprised at SEO announcements by these firms. H3: Firms conducting quick SEOs exhibit relatively better long–run stock performance. If firms that issue quick SEOs are high–quality firms with good investment opportunities, then these firms will exhibit better long–run stock performance after the issue. H4: Investment rates are higher for firms that issue SEOs shortly after IPOs. High aftermarket returns encourage managers to increase the firm’s investments because the marginal return to the project is high. Thus, the investment rates should be higher for quick SEOs. H5: Firms conducting quick SEOs exhibit stronger post–issue operating performance. The overvaluation hypothesis, in contrast, states that firms issue equity when they believe their stock prices are overvalued relative to management’s private information. Thus, market timing hypothesis predicts: H1a: Firms with higher aftermarket returns are more likely to issue quick SEOs than firms with lower aftermarket returns. Under the overvaluation hypothesis, if managers believe their stocks are overvalued, they tend to issue quick SEOs to exploit “windows of opportunity” in ways that benefit existing shareholders. H2a: The market reacts more unfavorably to the announcement of quick SEOs. The market treats the SEO announcement shortly after an IPO less favorably because such equity issuances might signal a greater degree of stock price overvaluation. H3a: Firms issuing quick SEOs experience poorer long–run stock performance. If the stock prices of firms issuing quick SEOs are even more significantly overvalued
6
Jiang, Stohs, Xie
than the others, then the poorer long–run performance is merely a consequence of the market’s failure to incorporate all the information. The stock is still substantially overvalued when the issue occurs. H4a: Investment rates are not necessarily higher for firms that issue quick SEOs. If a firm’s equity issuance decision is driven by overvaluation rather than good investment opportunities, investment rates may not be higher for firms issuing quick SEOs. H5a: Firms conducting quick SEOs exhibit no better or even worse post–issue operating performance. The rationale behind this proposition is that after the issue, as the inflated stock price cannot be sustained, the returns may decline, reflecting poor operating performance. B.
Data
We use Thomson Financial’s SDC Global New Issues database to identify firms that conduct IPOs during 1970–2006, and then select the first–time SEOs by these firms for the same time period. Our ending date is restricted to 2006 so that we have available data from CRSP to compute long–run returns. Our sample IPOs satisfy the following criteria: (1) include only common share offers listed on NYSE (the New York Stock Exchange), AMEX (the American Stock Exchange) or NASDAQ; (2) exclude IPOs with offer price ≤ $57; (3) exclude IPOs with gross proceeds (in real 1984 dollar) less than $1 million; (4) exclude financial companies, such as banking, insurance and REITs (SIC codes between 6000–6999) and utility companies (SIC codes 4900–4949); (5) exclude unit offers, spinoffs, carve–outs, rights, and shelf offerings8; (6) include only firms with stock return data available in CRSP after the issue, and with financial data available in COMPUSTAT, and (7) exclude firms with a market cap of less than $10 million at the time of issue during 1970–2006 to minimize the influence of outliers in the analysis. The resulting sample consists of 1,610 first time SEOs. Table 1 reports summary statistics of firm characteristics and other main explanatory variables used in the paper, with more complete definitions and the COMPUSTAT origins of data presented in the Appendix. ΔT is the number of calendar days between IPO and the first SEO. The median value of ΔT is about one and half years (496 days). Under IPO is IPO underpricing, defined as the difference between the first day post–issue price and the IPO offer price divided by the offer price, with a median underpricing of 8.93%. AB RET 20 is the abnormal return over the period from trading day 1 to trading day 20 after the IPO date, with a median of 3.79%. AB RET 40 is the abnormal return over the period from trading day 21 to trading day 40 after the IPO date. The median abnormal return 20 days before SEO issues is 3.59% (not presented in Table 1), indicating the fact that SEO firms experience strong price run– ups prior to the issue. SEO AR is the SEO 3–day announcement period abnormal return, calculated over the event days –1, 0, and +1. The median SEO AR equals –3.40%.
INTERNATIONAL JOURNAL OF BUSINESS, 20(1), 2015
7
Table 1 Descriptive statistics for sample SEO firms (first time SEOs) Description
Mean
Median
Min.
Max
Std. Dev.
N
Market value ($M)
694.49
277.73
10.02
40098.59
2101.12
1610
Total Assets ($M) Book–to–market (B/M) Tobin’s Q
405.55
162.18
5.62
22384.00
1040.07
1610
0.47
0.38
–0.06
2.11
0.38
1610
2.58
1.91
0.66
11.08
1.89
1610
0.06
0.12
–1.00
0.43
0.24
1598
CAP EXP RATIO
0.09
0.06
0.00
0.47
0.09
1589
FCF ($M)
–0.03
0.13
–5.69
1.42
0.78
1610
IPO SIZE ($M)
53.61
32.90
1.60
2745.50
96.16
1610
SEO SIZE ($M)
82.45
50.70
0.70
1292.20
110.39
1610
SEO/IPO
2.03
1.54
0.23
11.72
1.80
1610
ROA
SEO/MV EQ
0.28
0.18
0.02
2.42
0.36
1610
ΔT (days)
898.67
496.00
64.00
9290.00
1051.48
1610
UNDER IPO
21.65%
8.93%
–22.79%
458.41%
41.79%
1608
AB RET 20
6.44%
3.79%
–95.18%
176.09%
21.64%
1610
AB RET 40
3.94%
2.43%
–72.05%
119.10%
18.45%
1610
SEO AR
–3.46%
–3.40%
–40.00%
49.39%
7.48%
1610
AGE
16.38
10.00
1.00
166.00
19.45
1591
SECOND
0.34
0.00
0.00
1.00
0.47
1610
IPORANK
2.98
0.00
0.00
9.00
3.73
1610
SEORANK
3.26
0.00
0.00
9.00
3.85
1610
SWITCHBETTER
0.18
0.00
0.00
1.00
0.38
1610
INTEGER_IPO
0.79
1.00
0.00
1.00
0.41
1610
INTEGER_SEO
0.41
0.00
0.00
1.00
0.49
1610
Note: The sample consists of all 1,610 firms listed on NASDAQ, AMEX, or NYSE that conducted both IPO and (first time) SEO during calendar years from 1970–2006, after applying our sample screening criteria. Market value is price multiplied by the number of shares outstanding. B/M is the ratio of book value of equity to market value of equity. Tobin’s Q is the ratio of total market value of assets to total book value of assets. ROA is the OIBD (Operating Income before Depreciation) normalized by total assets. CAP EXP RATIO is capital expenditure to total assets. FCF is the free cash flow, defined as net income after tax plus depreciation less common and preferred dividends, deflated by the firm’s beginning–of–year capital. IPO SIZE is the amount of capital raised in the IPO. SEO SIZE is the amount of capital raised in the first SEO. SEO/IPO is SEO size as a fraction of capital raised in the IPO. SEO/MV EQ is SEO size as a fraction of market value of equity. ΔT is the number of calendar days between IPO and the first SEO. UNDER IPO is IPO underpricing, defined as the difference between the first post–issue price and the IPO offer price divided by the offer price. AB RET 20 is the abnormal return over the period from trading day 1 to trading day 20 after the IPO date. AB RET 40 is the abnormal return over the period from trading day 21 to trading day 40 after the IPO date. SEO AR, the SEO 3–day announcement period abnormal return, is calculated using market model over the event days –1, 0 and +1, where day 0 is the filing date. AGE is the number of years since the founding date of the firm to the year issuing the SEO. SECOND is a dummy variable equal to one if the percentage of secondary shares offered in an SEO is greater than 50 percent of total offerings. IPORANK is the underwriter reputation ranking at the time of the IPO. SEORANK is the underwriter reputation ranking at the time of the
8
Jiang, Stohs, Xie
SEO. SWITCHBETTER is a dummy variable that equals one if the SEO underwriter is ranked higher than the IPO underwriter. INTEGER_IPO is a dummy variable equal to one if IPO offer price is an integer. INTEGER_SEO is a dummy variable equal to one if SEO offer price is an integer. All ratio variables are winsorized at the top and bottom 1%.
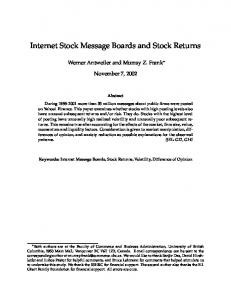
Table 1 also reports firm characteristics traditionally used to identify market timing. The median market value of equity for our SEO sample is $277.73 million. The mean is larger at $694.49 million, indicating skewness of distribution. Our sample firms have a median Tobin’s Q of 1.91, which suggests that the typical SEO firm is profitable and has valuable growth opportunities. Finally, firms that issue SEOs on average raise 2.03 times as much capital through SEOs as they raise from their IPOs (measured by SEO/IPO). We distinguish primary share offerings and secondary share offerings for the sample. For SEO issues, the shares offered may include pure primary shares (newly created shares that generate proceeds for the firms), pure secondary shares (insider's shares that do not increase the cash holdings of firms) or a mix of both. In the unreported univariate analysis, we find that for early issuers, 18% (39 firms) are pure secondary offerings, 69% (147 firms) are mixed offerings (60% of which (89 firms) with primary shares less than 50% of total offers); for late issuers, 13% are pure secondary offerings, 54% are mixed offerings (32% of which with primary shares less than 50% of total offers). We define pure secondary offerings or mixed offers with secondary shares greater than 50% as “second”. For early issuers, 60% of firms are “second”, and for late issuers, 30% of firms are “second”. The difference is significant at the 1% level. Table 1 shows that for the overall sample, 34 percent of the first time SEO issues are dominated by secondary offerings. Krigman, Shaw, and Womack (2001) examine underwriter switching for follow– on SEOs and document that SEO firms often switch to underwriters with a higher reputation and more analyst coverage. To control for the potential issue of underwriter quality on very quick SEOs, we construct several variables relating to the underwriters’ reputation (IPO underwriter reputation, SEO underwriter reputation, and whether firms switch to better ranked underwriters in their first SEOs) to proxy for information asymmetry in share offerings. We use the Carter-Manaster (CM) ranking, which is based on an underwriter’s relative position in IPO/SEO tombstone announcements. This measure is developed by Carter and Manaster (1990) and extended by Carter, Dark, and Singh (1998) and Loughran and Ritter (2004). 9 We find that the reputation of SEO underwriters (SEORANK) is on average higher than that of IPO underwriters (IPORANK). About 18 percent of firms in our sample switched to better ranked underwriters for their SEOs (SWITCHBETTER). It is argued that the integer offer price of IPO or SEO may serve as a measure of uncertainty as investment bankers are more likely to settle for an integer price if they cannot discover the true intrinsic price of an offer. Mola and Loughran (2004) argue that integer price clustering provides evidence that reputable investment banks use their influence to extract rents from issuing firms. Bradley et al (2004) find that IPOs with integer offer prices experience higher underpricing. Table 1 shows that 79 percent of our sample firms issued IPOs with integer offer prices (INTEGER_IPO), and 41% of them issued SEOs with integer offer prices (INTEGER_SEO). Figure 1 presents the number of SEOs in our sample by year and the proportion
INTERNATIONAL JOURNAL OF BUSINESS, 20(1), 2015
9
of quick SEOs. The volume of SEOs displays large variations over time, with the period 1991–2000 being the “hot” issue period, and we observe a higher proportion of quick SEOs during this period as well. Quick SEOs account for 10%–30% of all SEOs during this hot issue period. Figure 1 Number of first SEOs by year and the proportion of quick SEOs by year
III.
MEASURING SEO UNDERPERFORMANCE
We use three procedures to examine the underperformance of seasoned equity offerings. The first procedure is the BHAR analysis. The second procedure uses a time–series of cross–sectional regressions on monthly returns. The last procedure is the Fama–French three–factor regressions. A.
Buy–and–hold Abnormal Returns
Extensive literature exists about long–run stock performance following corporate events, yet long–term studies on stock returns remain controversial. We follow Billett, Flannery, and Garfinkel (2005) in calculating the BHAR as10:
T R i,T (1 R i, t ) 1 100% , t 1
(1)
where Ri,t is the daily return for firm i, T is the number of trading days in the three–year window following the issue, and Ri,T is the cumulative holding period return. For each issuing firm, we select five separate sets of matching non–issuing firms, following Vijh’s procedure (1999).11 We discuss the results based on the last set, where non-issuing firms are matched by size, industry and book–to–market ratio.
10
B.
Jiang, Stohs, Xie
Cross–sectional Regressions on Monthly Returns
Our second procedure for measuring SEO underperformance uses a time–series of cross–sectional regressions based on monthly individual firm returns. We run cross– sectional regressions on all firms listed on NASDAQ, AMEX, or NYSE during 1970– 2006 as follows:
rit a b ln MVit c ln B / Mit dISSUEit eISSUE6monthit it ,
(2)
where lnMV is the natural logarithm of the market value of equity (MV EQ), lnB/M is the natural logarithm of the ratio of the book value of equity to the market value of equity, and the book value is the book value of equity for the most recent fiscal year end. ISSUE is a dummy variable which equals one if a company conducted at least one public equity offering (SEO or IPO) within the 60 months preceding a given June 30th. ISSUE6month is a dummy variable which equals one if a company conducted an SEO within six months of its IPO. The dependent variable is the monthly percentage of stock returns. This procedure allows us to test whether there is an independent “new issues effect” and whether firms conducting quick SEOs experience more severe underperformance. C.
Fama–French Three–factor Regressions
Our third approach is to compute the calendar time abnormal return and compare it with the buy–and–hold abnormal returns. Barber and Lyon (1996), Kothari and Warner (1997), and Lyon, Barber, and Tsai (1999) suggest that unbiased statistical significance levels are difficult to compute using buy–and–hold returns. Consequently, long–run returns are commonly computed using the Fama and French (1993) three–factor time– series model:
(R pt R ft ) a b(R mt R ft ) sSMBt hHMLt t ,
(3)
where Rpt is the equally weighted portfolio returns of sample firms in month t; R mt is the return on the equally–weighted index of NYSE, AMEX, and NASDAQ stocks in month t; Rft is the three–month T–bill yield in month t; SMBt is the return on small firms minus the return on large firms in month t, and HMLt is the return on high book– to–market stocks minus the return on low book–to–market stocks in month t. The intercepts from these regressions are interpreted as abnormal returns. Abnormal returns will be associated with the event studied if the intercepts in the regressions are economically and statistically significant. IV. A.
RESULTS
Why Do Some Firms Return to the Equity Market Earlier Than the Others?
We begin our analysis by examining why some firms return to the equity issue market earlier than the others. Results are presented in Table 2. We first focus on what kind of
INTERNATIONAL JOURNAL OF BUSINESS, 20(1), 2015
11
Table 2 Firm characteristics and quick SEO Likelihood of a Quick SEO
Ln ΔT
Full Sample Subsample 1 Subsample 2 Full Sample Subsample 1 Subsample 2 (1970– (1990–2006) (exclude (1970–2006) (1990–2006) (exclude 2006) bubble period) bubble period) UNDER IPO Ln IPO SIZE AB RET 20 AB RET 40 Tobin's Q CAP EXP RATIO FCF Ln(Total Assets) ROA AGE SECOND IPORANK SEORANK SWITCHBE TTER INTEGER_I PO Mkt_ret Intercept
–0.267*** [0.062] –0.214*** [0.039]
–0.276*** [0.062] –0.126*** [0.044]
–0.503*** [0.120] –0.184*** [0.047]
0.447*** [0.123] 0.213** [0.099]
0.390*** [0.124] 0.191* [0.108]
0.902*** [0.264] 0.304** [0.129]
–0.822*** [0.099] –0.544*** [0.110] 0.003 [0.008] –0.674*** [0.231]
–0.745*** [0.103] –0.491*** [0.113] 0.002 [0.008] –0.856*** [0.266]
–0.721*** [0.139] –0.813*** [0.138] 0.002 [0.008] –0.671** [0.265]
1.483*** [0.219] 1.033*** [0.242] –0.011 [0.017] 1.060* [0.546]
1.427*** [0.225] 0.947*** [0.248] –0.012 [0.017] 0.97 [0.631]
1.403*** [0.336] 1.842*** [0.336] –0.022 [0.022] 0.721 [0.683]
–0.013 [0.016] 0.173*** [0.027]
0.003 [0.017] 0.122*** [0.030]
–0.047 [0.034] 0.184*** [0.032]
0.032 [0.039] –0.081 [0.066]
0.025 [0.039] –0.076 [0.070]
0.131 [0.132] –0.181** [0.084]
–0.123 [0.111] 0.007*** [0.001] –0.294*** [0.049] 0.052*** [0.009] –0.085*** [0.010]
–0.101 [0.115] 0.006*** [0.001] –0.347*** [0.054] 0.057*** [0.010] –0.091*** [0.011]
–0.009 [0.138] 0.005*** [0.001] –0.272*** [0.058] 0.060*** [0.010] –0.096*** [0.011]
–0.375 [0.271] –0.010*** [0.003] 0.600*** [0.115] –0.066** [0.027] 0.084*** [0.029]
–0.39 [0.280] –0.012*** [0.004] 0.582*** [0.123] –0.060** [0.029] 0.082*** [0.030]
–0.472 [0.398] –0.011*** [0.004] 0.462*** [0.144] –0.089*** [0.034] 0.103*** [0.036]
0.703*** [0.079] –0.048 [0.050] –0.418 [0.375] 7.074*** [0.969]
0.737*** [0.090] –0.121** [0.059] –0.298 [0.458] 5.604*** [0.659]
0.724*** [0.091] –0.107* [0.058] –0.961** [0.482] 5.489*** [0.641]
–1.015*** [0.254] 0.117 [0.139] 1.208 [0.946] –6.301 [135.642]
–0.918*** [0.264] 0.221 [0.159] 0.696 [1.117] –6.194 [119.757]
–0.913*** [0.291] 0.271 [0.175] 2.338* [1.292] –6.377 [123.586]
12
Jiang, Stohs, Xie
Industry and year dummies
Not reported
Not reported
Not reported
Not reported
Not reported
Not reported
Sample size Adjusted R2
1,532 0.36
1,169 0.294
1,007 0.314
1,532
1,169
1,007
0.000
0.000
0.000
p–value of regression
Note: This table reports (1) the cross–sectional regression of the logarithm of time between IPO and the first SEO. The dependent variable is the logarithm of the time between the IPO and the first SEO (Ln ΔT), and (2) probit regression of the factors leading to a quick SEO after IPO. The dependent variable is a dummy variable with value equal to one when an SEO is issued within six months of IPO and zero otherwise. The independent variables include: UNDER IPO is IPO underpricing, defined as the difference between the first post–issue price and the IPO offer price, divided by the offer price. Ln IPO SIZE is the logarithm of IPO size (the amount of equity capital raised in the IPO). AB RET 20 is the abnormal return over the period from trading day 1 to trading day 20 after the IPO date. AB RET 40 is the abnormal return over the period from trading day 21 to trading day 40 after the IPO date. Tobin’s Q is the ratio of total market value of assets to total book value of assets. CAP EXP RATIO is capital expenditure scaled by total assets. FCF is the free cash flow, defined as net income after tax plus depreciation less common and preferred dividends, deflated by the firm’s beginning–of–year capital. Ln (Total Assets) is the logarithm of the total assets. ROA is the OIBD (operating income before depreciation) normalized by total assets. AGE is the number of years since the founding date of the firm to the year issuing an SEO. SECOND is a dummy variable equal to one if the percentage of secondary shares offered in an SEO is greater than 50 percent of total offerings. IPORANK is the underwriter reputation ranking at the time of the IPO. SEORANK is the underwriter reputation ranking at the time of the SEO. SWITCHBETTER is a dummy variable that equals one if the SEO underwriter is ranked higher than the IPO underwriter. INTEGER_IPO is a dummy variable equal to one if IPO offer price is an integer. Mkt_ret is NYSE/Amex value weighted cumulative return in the prior three months before the SEO. The independent variables also include dummy variables for industry and the year of SEO. Standard errors are listed in brackets. *, **, and *** denote significance level at the 10%, 5%, and 1% levels.
firms is more likely to issue SEOs within six months of IPO. To address the concern that the “6 months” classification of “early” issue is “arbitrary,” we also use a continuous variable LnΔT, defined as the logarithm of the time between a firm’s IPO and its first SEO, as a dependent variable. To address the concern that the IPO/SEO market may have changed over time (Loughran and Ritter, 2004) regarding types of issuers, incentives of issues and market conditions, we run the analyses for both the full sample (1970–2006) and subsample (1990-2006). We also run the regression analyses for the subsample (1990-2006) by excluding the period 1999-2000 to address the concern if our results are driven by the internet bubble period in particular. Our probit regression shows that firms with larger IPO underpricing (Under IPO) are more likely to conduct an “early” issue. This is consistent with the signaling hypothesis of IPOs by Chemmanur (1993) and Welch (1989), which proposes that firms underprice their IPOs so they can subsequently issue seasoned equity at a favorable price, and can return more quickly to the equity market with SEOs. The coefficients of AB RET 20 and AB RET 40 are also positively significant, suggesting that firms experiencing larger stock price run–ups after the IPO tend to return to the market with SEOs earlier than other firms. Since large pre–issue stock price appreciation signals that the current stock price is overvalued, the above results are consistent with the hypothesis that management uses their private information to time equity offerings to take advantage of the “windows of opportunity.” The associated coefficient estimates on firm size and firm age are all negative, suggesting that larger firms and older firms are less likely to conduct quick SEOs (t < 6 months following the IPO). We also find that firms with dominating secondary share
INTERNATIONAL JOURNAL OF BUSINESS, 20(1), 2015
13
offerings are more likely conduct a quick SEO. Regarding the impact of underwriter reputation, the regression shows that firms with better ranked IPO underwriters are less likely, while firms with better ranked SEO underwriters are more likely to issue quick SEOs. In addition, a firm is less likely to launch a quick SEO if the firm chooses to switch to a better ranked underwriter for its SEO. Similar results are found in regressions on the length of time between an IPO and the first SEO. In addition to taking advantage of overvalued stocks, the results also show that firms with higher expenditure ratios and dominating secondary share offerings return to the equity issuance market more quickly. The results for the subsample (1990–2006) and the subsample excluding the internet bubble period are mostly consistent with the full sample analyses. Overall, we conclude that a firm’s decision to issue a quick SEO is explained by market timing rather than broader economic considerations.12 B.
Market Reaction
Prior research generally shows a negative announcement effect upon the announcement of an SEO (Loughran and Ritter, 1995; Houston and Ryngaert, 1997; Jegadeesh, Weinstein and Welch, 1993).13 We extend the existing literature by examining the relations between the timing of SEOs and SEO announcement effects. Specifically, we address whether or not the market is more surprised by firms that conduct quick SEOs. If the market timing hypothesis holds, we expect to find a less favorable market response because an earlier SEO issue may signal a greater degree of stock overvaluation. To address this question, we report the abnormal returns around SEO announcements categorized by length of time since the IPO at the date of the first SEO in Panel A of Table 3. Table 3 First time SEO three–day announcement abnormal returns and stock price run–ups Panel A: Abnormal returns ordered by length of time since IPO at the date of first SEO Time (t) between N
SEO AR (%)
AB RET 20 (%)
AB RET 40 (%)
(1) t < 6 months
214
–5.79
22.29
11.39
(2) 6 months ≤ t < 1 year
428
–3.67
8.38
5.91
(3) 1 year ≤ t < 2 years
379
–2.59
2.59
2.40
(4) 2 years ≤ t < 3 years
185
–2.63
2.37
0.82
(5) 3 years ≤ t < 4 years
115
–2.82
1.26
0.06
(6) 4 years ≤ t < 5 years
82
–3.97
1.75
0.63
(7) t ≥ 5 years
207
–3.10
1.44
1.25
1,610
–3.46
6.44
3.94
IPO and SEO
Sample Size/Averages
14
Jiang, Stohs, Xie
Panel B: Difference tests < 6 months
≥6 months
Difference Tests [p – value]
Mean
Median
Mean
Median
T– test
Median Test
SEO AR (%)
–5.79
–5.34
–3.10
–3.17
[0.00]***
[