Mar 15, 1995 - Further stud- ies show that the largest voids are those delineated by rich clusters and superclusters of galaxies. We call these voids supervoids.
AND ASTROPHYSICS 15.3.1995
Your thesaurus codes are: 12(12.03.3; 12.12.1)
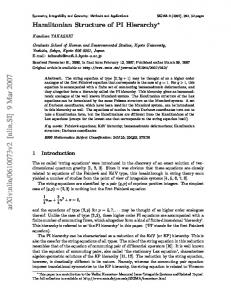
The Structure of Supervoids { I: Void Hierarchy in the Northern Local Supervoid
Ulrich Lindner1, Jaan Einasto2, Maret Einasto2, Wolfram Freudling3 4, Klaus Fricke1, and Erik Tago2 ;
1 2 3 4
University Observatory, D-37083 Gottingen, Germany Tartu Astrophysical Observatory, EE-2444 T~oravere, Estonia Space Telescope { European Coordinating Facility, D-85748 Garching, Germany European Southern Observatory, D-85748 Garching, Germany
Accepted for publication February 21, 1995
Abstract. Supervoids are regions in the local Universe
1. Introduction
The presence of voids in the distribution of galaxies has been discovered even in early redshift surveys of galaxies (e.g. J~oeveer & Einasto 1978, Tarenghi et al. 1978, Ti�t & Gregory 1978 and Tully & Fisher 1978). Further studies show that the largest voids are those delineated by rich clusters and superclusters of galaxies. We call these voids supervoids. This de nition is analogous to the definition of superclusters, which consist of rich clusters of galaxies and outline the regions of supervoids. A classical example of a supervoid is the Bootes void (Kirshner et al. 1981). The Bootes void is located at a distance of about 150 h?1 Mpc from us. This void is surrounded by the Hercules, Corona Borealis and Bootes superclusters and has a diameter of at least 100 h?1 Mpc. Other cluster de ned voids are the Perseus void behind the Perseus-Pisces supercluster (Einasto, J~oeveer and Saar 1980) and the supervoid described by Bahcall & Soneira (1982). The closest supervoid { the Northern Local void (hereafter NLV, Einasto et al. 1983) { is located in front of the Hercules supercluster. This void is bordered by the Local and the Coma superclusters and by walls between these superclusters and the Hercules supercluster. From the southern side the NLV reaches the Cetus wall and the Shapley supercluster, cf. Einasto et al. (1994, hereafter EETDA) and Figure 1a. Catalogues of cluster-de ned superclusters and supervoids were presented by Batuski and Burns (1985) Key words: cosmology: observations | galaxies: clusterand EETDA. The mean diameter of supervoids is about ing | large-scale structure of the Universe 100 h?1 Mpc (EETDA, Einasto et al. 1989, hereafter EEG). Previous studies have shown that supervoids are not completely empty. In the Bootes void a number of galaxies Send o�print requests to : Ulrich Lindner,University have been found (Balzano & Weedman 1982, Zmoody et Observatory, Geismarlandstr. 11, D-37083 Gottingen, al. 1987, Peimbert & Torres-Peimbert 1992, Szomoru et Germany al. 1993, Szomoru, Gorkom and Gregg 1994, Szomoru et which do not contain rich clusters of galaxies. In order to investigate the distribution of galaxies in and around supervoids, we have studied the closest example, the Northern Local Void. It is de ned as the region between the Local, Coma, and the Hercules superclusters, which is well covered by available redshift surveys. We nd that this supervoid is not empty, but it contains small galaxy systems and poor clusters of galaxies. We study the cosmography of this void by analyzing the distribution of poor clusters of galaxies, elliptical and other galaxies in two projections. We present a catalogue of voids, de ned by galaxies of di�erent morphological type and luminosity, and analyze mean diameters of voids in di�erent environments. This analysis shows that sizes of voids and properties of void walls are related. Voids de ned by poor clusters of galaxies and by bright elliptical galaxies have a mean diameter of up to 40 h?1 Mpc. Faint late-type galaxies divide these voids into smaller voids. The faintest galaxies we can study are outlining voids with mean diameters of about 8 h?1 Mpc. Voids located in a high-density environment are smaller than voids in low-density regions. The dependence of void diameters on the type and luminosity of galaxies, as well as on the large-scale environment shows that voids form a hierarchical system.
150 C-B
A-C
Z (Mpc)
100
Hercules
Cetus
50
Coma Virgo
0
Shapley
Pisces-Cetus Perseus
-50 -150
Leo
-100
-50
0 Y (Mpc)
50
100
150
Fig. 1a. Distribution of rich clusters of galaxies and strong radio galaxies in supergalactic coordinates. Clusters of galaxies which are members of rich superclusters (with at least 4 members, cf. EETDA) are plotted as lled circles (located in interval ?100 � X < 50 h?1 Mpc) or open circles (located in interval ?150 � X < ?100 h?1 Mpc, di�erent notation enables to distinguish members of the Shapley supercluster), isolated clusters and clusters in poor superclusters are plotted as small dots, radio galaxies as crosses. The zone of avoidance is given by dashed lines. Identi cations of some superclusters are given (C{B stands for Corona Borealis, A{C { for Aquarius-Capricornus). Box shows the contour of the region of NLV plotted in Figure 1b.
al. 1994). The same has been found for the void near the Perseus-Pisces supercluster (Weinberg et al. 1991), and in the Northern Local Supervoid (Freudling et al. 1988). These studies show that dwarf galaxies in large voids tend to form small systems. In particular, Szomoru et al. have shown, that galaxies in the Bootes void cluster to form groups and laments of galaxies. The aim of the present paper is to investigate the detailed structure of the area of the Northern Local void, which will serve as an example of properties of supervoids to guide future investigations of supervoids. We investigate in detail the properties of voids in the Northern Local supervoid and in the neighboring superclusters { the Local, Coma, and Hercules superclusters. The closeness of this supervoid and the surrounding superclusters gives us a unique possibility to compare structures of galaxies in low- and high-density environment. Di�erences, if found, give important information on the galaxy formation in various environments. The Hercules region has attracted the attention of astronomers since Shapley (1934) discovered the Hercules supercluster. The spatial structure of the low-density re-
gion in front of the Hercules supercluster was studied by J~oeveer & Einasto (1978), Zeldovich, Einasto and Shandarin (1982), Einasto et al. (1983) and Freudling, Haynes and Giovanelli (1988). This low-density region was independently discovered and studied by Tully (1986, 1987), Tully et al. (1992), by the CfA team (de Lapparent et al. 1986, 1989, Geller and Huchra 1989, Vogeley, Geller and Huchra 1991, Vogeley et al. 1992, 1994a,b), and by Shaver (1991). More recent redshift surveys of the area include Freudling et al. (1992) and Tarenghi et al. (1994). These studies have shown that the region of NLV is lled with a network of faint galaxy systems which divide the supervoid into smaller voids, see Figure 1b. Mean diameters of galaxy-de ned voids are 3 { 10 times smaller than diameters of supervoids. These systems are populated mostly by spiral galaxies (Tago et al. 1984, 1986). Recently, several catalogues of galaxy-de ned voids have been published (Kaufmann and Fairall 1991, hereafter KF, Haque-Copilah and Basu 1992, hereafter HB, and Slezak et al. 1993, hereafter SLB). In these catalogues, however, no distinction has been made between voids de ned by di�erent types of objects. By contrast, in this
Distribution of galaxies in supergalactic coordinates in a sheet 0 � X < 20 h?1 Mpc. Bright galaxies (M � ?20:3) are plotted with lled circles, fainter galaxies (?20:3 < M � ?19:7) with open circles. Solid lines show equidensity contours, found by Gaussian smoothing of the density eld with dispersion 8 h?1 Mpc (cf. Section 4.4). The mean density is denoted as %�. High-density regions (% � 2 %�) correspond to superclusters, low-density regions (% < %�) to the local supervoid, intermediate density regions (�% � % < 2 %�) to density enhancements in the supervoid, the supercluster outskirts and the walls between them. We see the Local, the Coma and the Hercules superclusters in the lower left, lower right, and upper right part of the gure, respectively. The intermediate density region in the right part of the gure between the Coma and the Hercules superclusters belongs to the Great Wall.
Fig. 1b.
work we emphasize a comparison of properties of voids de ned by galaxies of various luminosity and morphology located in di�erent environments. Thereby we con rm previous results by EEG and Einasto et al. (1991, hereafter EEGS), suggesting that the void analysis characterizes some properties of the distribution of galaxies better than other statistics, especially in low-density regions. EEG and EEGS studied the void properties in the direction of the Coma supercluster applying mean void diameter statistics and the void probability function, using redshift data available in the late 80's. In the present paper we shall use a much deeper and larger dataset and combine the quantitative analysis with a cosmographic description of the galaxy distribution. The paper is organized as follows. In x2 we describe the data used. In x3 we present a cosmographic descrip-
tion of the distribution of galaxies and clusters of galaxies in the direction of the NLV and Coma and Hercules superclusters. In x4 we present a void catalogue in this region of sky. In x5 we analyze the distribution of void diameters de ned by poor clusters of galaxies, and by galaxies of different morphological type and luminosity. In x6 we discuss our results. The paper ends with a summary of principal conclusions. Throughout this paper we use a Hubble constant of H = h100 km s?1 Mpc?1.
2. The data The Hercules supercluster covers a large area of the sky north of the celestial equator in the right ascension range
between 12 < � < 18 . Centers of the Local and Coma superclusters lie also in the region between 12 < � < 18 and 0� < � < 30�. Strong galactic obscuration starts at � > 18 . Therefore we select for our study the region � � 0� and 12 � � � 18 . The main body of the Hercules supercluster lies between redshifts 9000 and 12000 km s?1 . Thus we considered only redshifts up to � 12000 km s?1 . We use cubic samples of clusters and galaxies up to size L = 120 h?1 Mpc, in analyzing data we take into account the fact that in far corners of these cubes data are incomplete. h
h
h
h
h
h
h
2.1. Galaxies
For galaxies we primarily have used the redshift compilations by Huchra (1991, ZCAT) for the northern sky (� � 0� ). Redshift from several sources have been added to improve the completeness in the region of interest. These include several redshift surveys speci cally targeting the region of the Hercules supercluster (Freudling et al. 1992, Tarenghi et al. 1994, kindly provided as a computer le by Bianca Garilli). An additional compilation of published redshifts, mostly of spiral galaxies with 21cm line measurements, was kindly provided by Martha Haynes. Finally, unpublished 21cm line measurements in the region of the Hercules supercluster obtained by Marcio Maia and by one of us (WF) were added to the sample. All sources of redshifts were carefully cross correlated to avoid duplicate entries from several sources in our nal sample. Only galaxies up to an apparent magnitude of 15.5 have been included in the sample. The resulting sample contains a total of more than 5500 galaxies within the region de ned above. From this combined catalogue we selected a number of subsamples with di�erent magnitude limits and morphological type in order to investigate separately voids de ned by all galaxies and by elliptical galaxies (only de Vaucouleurs type T � 0). A summary of the observational samples used is given in Table 1 (for further explanations of Table 1 cf. Section 5.2). To assess the completeness of the sample, it was compared to the Catalogue of Galaxies and of Clusters of Galaxies (Zwicky et al. 1961-68). It was found that the compilation is complete up to an apparent magnitude 14.5 for almost the whole region. In the declination zones 27� ? 50� our data are complete up to 15.5. In the declination zones 7:5� ? 27� and 50� ? 75� the data are complete up to 15.5 in approximately half of the elds, in the remaining area the completeness varies, and is on average 30 { 50 %. The data are less complete between 17 and 18 . To visualize the completeness of our data we present in Figure 2 histograms of the completeness for each of the Palomar Observatory Sky Survey (POSS) elds located in the direction under study. Because our data are complete up to 14.5 Figure 2 shows the incompleteness in the apparent magnitude range from 14.5 to 15.5. h
Since our actual sample is only approximately complete to 15.5 mag, absolute magnitude limited subsamples we use are not strictly volume limited. The impact of the incompleteness on the void analysis is investigated in Section 5.7. To derive distances from observed redshifts, we have corrected the redshifts for the solar motion (galactocentric
ow), the virgocentric ow, and the velocity dispersion in clusters of galaxies (compression) from our list of clusters as described by Einasto et al. (1984), and Einasto et al. (1986). Distances to galaxies derived from observed redshifts are expressed in redshift space. To compare observed properties of galaxies with models it is necessary either to convert observational data to real space or simulated data to redshift space. Our observational samples are too limited in volume to make the correction to the observational data. In order to estimate this e�ect on void size statistics we have performed the necessary analysis for model simulations found by Frisch et al. (1994). This analysis shows that the reduction of model samples to redshift space increases mean void diameters only by a few per cent. This is much smaller than statistical errors of void sizes in samples. Thus in the void size analysis we can ignore the difference between redshift and real space. 75
50
25
0 18 h
16 h
14 h
12 h
The histograms of the completeness factors in POSS elds, expressed as the fraction of galaxies in our redshift catalogue in units of the number of galaxies in the Zwicky et al. catalogue, for galaxies up to apparent magnitude 15.5. In some elds the fraction is larger than 1, this means that the Zwicky catalogue itself is incomplete.
Fig. 2.
h
2.2. Clusters of galaxies
In this study we are interested in the distribution of galaxies and systems of galaxies of various richness from poor
Table 1. Cubic Samples L Type
h?1 Mpc 30
45 60 75 90 105 120 120
M0 N(M0 ) mag all ?17:3 1106 E 255 all ?18:2 1345 E 278 all ?18:8 1508 E 267 all ?19:3 2114 E 323 all ?19:7 1858 E 275 all ?20:0 1425 E 215 all ?20:3 877 E 141 Cluster 132
hD i � � v
v
h?1 Mpc
8.0 � 0.6 10.0 � 1.3 11.0 � 0.6 15.1 � 1.7 14.0 � 0.9 17.7 � 1.3 16.0 � 0.8 22.0 � 2.3 18.8 � 0.9 27.3 � 2.3 20.8 � 0.9 30.3 � 3.0 25.7 � 1.3 36.4 � 3.4 37.0 � 3.5
� N(M � ?18:8) N(M � ?19:7) N(M � ?20:3) v
h?1 Mpc 2.4 3.1 2.7 3.5 4.0 4.2 4.5 7.3 5.3 7.8 5.6 9.2 6.4 8.4 11.7
to rich clusters of galaxies. Thus we used the Zwicky et al. (1961-68) catalogue of clusters which contains data about rich and poor clusters. We used only clusters of the distance class \Near". \Near" clusters are de ned as having distances up to 150 h?1 Mpc. Most of these clusters contain bright galaxies listed in various compilations of galaxy redshifts (Huchra's ZCAT and others), and therefore it is possible to identify bright members of Zwicky clusters on galaxy catalogues and use them to determine distances of clusters. This study has been carried out by Tago (1993) and we used his catalogue of redshifts of Zwicky \Near" clusters of galaxies. For about 40 per cent of Zwicky \Near" clusters, redshifts were extracted from earlier cluster redshift compilations, or from redshift data for individual galaxies. In other cases redshifts for more than one galaxy per cluster have been obtained from ZCAT. In these cases the unweighted mean of redshifts of individual galaxies in clusters was calculated. In some cases there are several density concentrations in the cluster, in these cases all individual concentrations have were considered as separate clusters located at di�erent distances. Our sample of the region considered contains 132 Zwicky \Near" clusters of galaxies, 7 of them are also Abell clusters, i.e. they belong to the class of rich clusters.
454 128 866 201 1508 267
157 41 282 76 503 112 1260 223 1858 275
92 28 146 39 343 89 513 115 717 135 877 141
3. Cosmography of Clusters and Galaxies in the NLV region 3.1. Visual presentations of the 3-dimensional distribution
Before trying to apply statistical measures to the three dimensional distribution of galaxies, it is useful to get a visual impression rst. Therefore, in this section we present two series of plots which show the structure in slices through the region of the NLV. The rst series of plots shows the distribution of galaxies in distance slices in equatorial coordinates (Figure 3). Di�erent symbols are used for di�erent morphological types. Plots are shown for redshift intervals of 1000 km s?1 . Another possibility to present the distribution of galaxies and clusters is the use of slices through a rectangular grid. The coordinate system is de ned as follows. The positive x?axis points towards � = 12 and � = 0�, the positive y?axis towards � = 18 and � = 0� and the positive z ?axis towards � = 90� . In Figures 4 and 5 cubes with L = 120 h?1 Mpc, and L = 60 h?1 Mpc are shown, respectively. In each Figure, the z coordinate is divided into six equal parts and the resulting sheets are plotted separately. In Figure 4 the distributions of clusters, elliptical galaxies, and all galaxies are given in separate panels. In the cluster panels, Abell clusters are marked with lled circles, and Zwicky clusters with open circles. In Figure 5 we plot only the galaxies, and use di�erent symbols for bins in absolute magnitudes. The highest z panels are not plotted in Figures 4 and 5, h
h
0 < cz < 1000
1000 < cz < 2000
75
25
16h
14h
12h 18h
3000 < cz < 4000
16h
14h
14h
25
12h 18h
6000 < cz < 7000
16h
14h
75
25
12h 18h
9000 < cz < 10000
75
14h
12h18h
12h 18h
12h
50
25
14h
14h
75
50
16h
16h
11000 < cz < 12000
75
25
18h
16h
10000 < cz < 11000
50
12h
50
25
14h
14h
75
50
16h
16h
8000 < cz < 9000
75
25
0 18h
12h 18h
7000 < cz < 8000
50
12h
50
25
16h
14h
75
50
25
16h
5000 < cz < 6000
75
50
18h
12h 18h
4000 < cz < 5000
75
0
50
25
25
0
75
50
50
0 18h
2000 < cz < 3000
75
25
16h
14h
12h 18h
16h
14h
12h
Distribution of galaxies in equatorial coordinates at di�erent distance intervals corresponding to redshift intervals �cz = 1000 km s?1 . Elliptical galaxies are plotted with lled circles, spiral and irregular galaxies with open circles.
Fig. 3.
120 60 < z < 80
C
E
G
40 < z < 60
C
E
G
20 < z < 40
C
E
G
0 < z < 20
C
E
G
90
60
30
120
90
60
30
0 120
90
60
30
120
90
60
30
0 0 Fig. 4.
30
60
90
120
30
60
90
120
30
60
90
120
Distribution of clusters and galaxies in rectangular equatorial coordinates with cube size 120 h?1 Mpc. Cluster distri-
bution is given in left panels, that of elliptical galaxies in middle panels, and of all galaxies in right panels. The z coordinate of the cube is divided into intervals of 20 h?1 Mpc. In cluster panels Zwicky clusters are plotted with open circles, Abell clusters with lled circles. In the rightmost panels we show also voids from our void catalogue in Table 2a. The circles are intersections of the spherical voids with planes de ned by z=10, 30, 50 and 70 h?1 Mpc, respectively.
60 M 50 %, then the sphere with the smaller radius is discarded. For comparison, we also calculated the mean diameter of all voids, including all overlapping voids. The results show that the distribution of void diameters in both samples are rather similar, and thus the elimination of overlapping voids only slightly reduces the mean void diameter. The deviation increases with increasing resolution parameter k and reaches up to 10 %. This deviation is much smaller than the spread of mean diameters inside a particular void sample. The overlapping void elimination procedure used in this section is di�erent from the respective procedure used to construct our void catalogues in Section 4.3. For this reason mean void diameters for full samples given in Table 4a do not exactly coincide with respective data for all galaxies given in Table 4b. These di�erences, although small, demonstrate that in comparing void sizes it is necessary to use data obtained with identical void de nition algorithms. 5.2. Results
Mean void diameters of galaxy samples for all cube sizes used are given in Table 1, separately for voids de ned by all galaxies and by elliptical galaxies, as well as by poor clusters of galaxies. Nearby galaxy samples contain both faint and bright galaxies, thus for nearby samples it is possible to calculate void diameters using several absolute
v
v
v
magnitude limits. In Table 4a the mean diameters of voids,
hD i, are given for various absolute magnitude limits, M0 , v
and for di�erent cube sizes, L. We computed the scatter of mean void diameters, � . From this we estimated errors of the mean void diameters, � , as p (4) � =� = N ; where N is the number of voids used in the determination of the mean value. Void diameter scatter and mean diameter errors are also given in Tables 1 and 4. In Figure 6 we show the cumulative distribution of void diameters for some samples. In Figure 6a the cumulative distribution of diameters of voids de ned by poor clusters within the 120 h?1 Mpc cubic sample is plotted for different resolutions k. We see that the scatter of individual curves is rather small and there is no systematic dependence of the distribution on k. Similar plots for galaxy samples show no systematic di�erences for k. Thus we can use the mean value for all k, as a reliable distribution curve of void diameters. The cumulative frequency distribution of void diameters in all galaxy and elliptical galaxy samples are shown in Figures 6b and 6c, respectively. The void diameter distribution is calculated for galaxy samples with absolute magnitude limits ?18:8, ?19:7 and ?20:3. v
v
v
v
v
v
5.3. Dependence on morphology and luminosity
Mean void diameters of samples of various cube sizes L for galaxies of di�erent morphological type, and di�erent luminosity are listed in Tables 1 and 4. In some samples the
1.0
0.8
1.0 k = 16 k = 24 k = 32 k = 40 k = 48 k = 56 k = 64 mean value
1.0
G
C 0.8
0.8
0.6
0.6
0.6
0.4
0.4
0.4
0.2
0.2
0.0 0.0
a) 20.0
40.0
60.0
1.0
M = -18.8 M = -19.7 M = -20.3
20.0
40.0
60.0
1.0
0.0 0.0
0.6
0.6
0.6
0.4
0.4
0.4
20.0
40.0
void diameter [h-1 Mpc]
high med low
0.2
60.0
0.0 0.0
60.0
M


![THE VISIBILITY VOID [PDF]](https://m.moam.info/img/260x300/the-visibility-void-pdf_6479f2da098a9ea4358b4610.jpg)

