Jan 31, 2014 ... Tableau Server allows authorised users to view reports in an internet browser.
You ... Only authorised users are able to access Tableau Server.
How to Use Tableau Server
(https://bits.uas.ox.ac.uk)
Tableau Server allows authorised users to view reports in an internet browser. You can:
Use filters to see the data that is relevant to you. Export tables / charts into Excel, Word etc. Download the underlying data. Print views and images as PDFs.
Logging on to Tableau Server Only authorised users are able to access Tableau Server. If you wish to view a report and do not have an account, please contact SDMA (
[email protected]) to request access. You will need to include your Oxford WebAuth and the name of the report you wish to access in your request. You will be contacted by BI Support confirming your access once the authorisation process is complete. Tableau Server is integrated with the University’s single sign on (SSO) authentication. You may already use your SSO authentication to access software such as WebLearn, Nexus/Outlook email, OSS, GSS, OxCORT and Oxford only web pages. If you have forgotten or have an expired Oxford password, you can reset this here: https://webauth.ox.ac.uk/. If you wish to extend your access to the reports that you are able to view on Tableau Server, please contact SDMA.
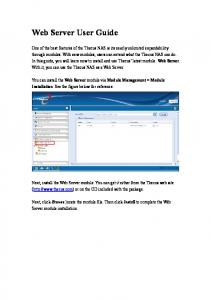
Exploring the Server F
A
B
A: Navigation giving access to Projects, Workbooks and Views. B: Filters to assist in finding content on the server. C: Actions and sort options. D: List of Workbooks on the server. E: Menus giving access to help, favourites and user preferences. F: Search box to assist in finding content on the server. G: Thumbnail or List view of content.
Understanding the Structure on the Server Projects > Workbooks > Views The server is divided into several main Projects, which cover broad categories of information - Annual Programme Statistics, College Reports, Population Details etc. Projects contain Workbooks, which themselves contain individual Views – the interactive tables/charts/dashboards that show the information. This structure is visible in the breadcrumb trail that shows your location in the server.
E
G C D
How to use Tableau Server
Viewing Workbooks on Tableau Server It is possible to view the workbooks on Tableau Server in more than one way. o When a workbook is published, you may be sent a link which will take you to that workbook directly. You will still be required to log in, but the workbook with all its views will then immediately open. This is the most straightforward way of accessing workbooks on Tableau Server, but you may not be able to navigate to different workbooks. Closing the browser completely will log you out from Tableau Server.
14 September 2016
How to Use Tableau Server o
If you are interested in a suite of reports, for example the Annual Programme Statistics, you may be sent a link which will take you to a Project containing the relevant reports. Once you have logged in you can then select the workbook in which you are interested by clicking on the name.
Finding the Relevant Workbook or View If you do not have a link for the workbook that you wish to view, it is possible to search Tableau Server for specific workbooks. When you have logged on, the menus to the left and at the top help you navigate. Projects: these are collections of workbooks belonging within a specific theme. Workbooks: this is a collection of views that have been compiled by SDMA to address a particular need. Click on a workbook name to see the views. Views: individual dashboards (tabs), which contain tables, graphs and so forth. Filters and Searching: you can use the search box at the top of the screen to type in the information you are looking for. You do not need to know the actual name of the workbook. You can also filter by specific Projects. Favourites: if there are some views or workbooks that you use regularly, you can add these to your favourites by clicking on the star next to the name of the view or workbook. These can then be accessed from the menu at the top of the screen.
How to use Tableau Server
(https://bits.uas.ox.ac.uk) Personalising your Tableau You can personalise the way Tableau Server looks to you. If you are only interested in a particular group of reports, for example Undergraduate Admissions or Annual Programme Statistics, you can navigate to these reports using the search and filter criteria. Click on your name at the top of the screen and select ‘make this my start page’ from this menu. The next time you log in you will start from this point. You can return to this screen and change your personal options at any time.
Interacting with the Views o Filtering Data: Most views contain filters, generally located to the left of the view, that allow you to select just the data in which you are interested; for example you may only wish to see data for a particular year, division, college or exam etc. Select the options that you want from the filters and the view will automatically update. If the display is empty, it is likely that your filter choices return no information. o Pause Automatic Updates: Every time you update a filter the data in the view refreshes. This can be time consuming if you are making lots of changes. By clicking the ‘Pause Automatic Updates’ button located on the tool bar you can make all your filter choices in one go. Click the button again and the data in the view will refresh. o Hierarchies: Some columns or rows are hierarchical. By clicking on the minus or plus buttons
you are able to drill in or out to see more or less data.
14 September 2016
How to Use Tableau Server o Tooltips: Many reports have a tooltip associated with data points on graphs or tables. If you hover your mouse over the mark you will see additional information. If you use your mouse and the control key to select several marks you can then choose to ‘keep only’ those items selected or ‘exclude’ the selected marks to further filter the data that you are viewing. Additionally, by clicking on the ‘View Data’ button you can see all the records that are used to build the view; these can then be downloaded into a CSV file. Not all views will have this feature available. If you select an entire column of data, additional icons appear in the tooltip. These enable you to change the sort order of the data, but will react differently depending upon how the initial view was constructed.
Some reports also have hover tooltips where additional, contextual information can be found.
How to use Tableau Server
(https://bits.uas.ox.ac.uk) o One Click Sort: You can also amend the way in which the data is sorted in the view by hovering over the top of the column or row you wish to sort by and clicking the sort icon. Again, the way in which the view was constructed will determine how this sort function displays. o Customising Your View: Some views may have a lot of different filter options and you may only ever be interested in data for a particular Division, College or Programme. Once you have chosen your filters, it is possible to save this customised version of the view. You can set up multiple customised versions of a view and then share these with other users. Select the relevant filters then click on ‘Remember my changes’ button. Give your view a name and click the ‘Remember’ button. This view will always be available to you when you log into Tableau Server.
14 September 2016
How to Use Tableau Server To share this customised view with colleagues, click on the ‘Share’ button and copy and paste the link into an email or other document. o Resetting Filters: If your filter choices have become confusing, or you wish to return to the original view of the data, you can use the ‘Revert All’ button located on the tool bar. The tool bar may be found either at the top or at the bottom of your view.
(https://bits.uas.ox.ac.uk) Return to Home Page o After you have finished exploring a workbook, you may wish to return to the Tableau Server home page to open a new report; this can be done by clicking on the Tableau icon in the top left of the screen. This icon may not be visible if you have used a link to get to a single report, or if you have minimised the header at the top of the report. Clicking on the small arrow will return the header.
Going Further with your Data o Export Data: As well as viewing the data (described above under tooltips) you can also export the underlying data into Excel directly using the ‘Data’ or ‘Crosstab’ options, where crosstabs summarises the data like a pivot table. Not all views will have these features available due to the confidential or sensitive nature of the data. o Copy / Export Images and Views: Clicking on the ‘Image’ option will export any view as an image which can then be imported into other applications such as Word. o Printing the View: You can publish the view as a PDF file using the Print to PDF option. Select either Portrait or Landscape orientation and a paper size. You can choose whether to print the entire workbook, dashboard or certain sheets. Clicking the highlighted thumbnail for a sheet excludes it from the export.
How to use Tableau Server
Need More Help? When you are logged in to Tableau Server, there is an information icon link towards the top right hand corner of the screen. This opens up a new window with more details that could help you get the answers that you need. If this does not resolve your problem, and for any other difficulties with Tableau, please contact SDMA.
We welcome your feedback. For any questions, comments or requests for changes and enhancements, please contact SDMA.
14 September 2016


![Intel Server Board SE7520BD2 User Guide [PDF]](https://m.moam.info/img/260x300/intel-server-board-se7520bd2-user-guide-pdf_64905a88098a9e97338b4626.jpg)