The temporal representation of speech in a nonlinear model of the guinea pig cochlea Stephen D. Holmesa) School of Psychology, University of Birmingham, Edgbaston, Birmingham, B15 2TT, United Kingdom
Christian J. Sumner MRC Institute of Hearing Research, University Park, Nottingham, NG7 2RD, United Kingdom
Lowel P. O’Mard and Ray Meddis Centre for the Neural Basis of Hearing at Essex, Department of Psychology, University of Essex, Colchester, CO4 3SQ, United Kingdom
共Received 20 April 2004; revised 15 September 2004; accepted 15 September 2004兲 The temporal representation of speechlike stimuli in the auditory-nerve output of a guinea pig cochlea model is described. The model consists of a bank of dual resonance nonlinear filters that simulate the vibratory response of the basilar membrane followed by a model of the inner hair cell/auditory nerve complex. The model is evaluated by comparing its output with published physiological auditory nerve data in response to single and double vowels. The evaluation includes analyses of individual fibers, as well as ensemble responses over a wide range of best frequencies. In all cases the model response closely follows the patterns in the physiological data, particularly the tendency for the temporal firing pattern of each fiber to represent the frequency of a nearby formant of the speech sound. In the model this behavior is largely a consequence of filter shapes; nonlinear filtering has only a small contribution at low frequencies. The guinea pig cochlear model produces a useful simulation of the measured physiological response to simple speech sounds and is therefore suitable for use in more advanced applications including attempts to generalize these principles to the response of human auditory system, both normal and impaired. © 2004 Acoustical Society of America. 关DOI: 10.1121/1.1815111兴 PACS numbers: 43.64.Bt, 43.66.Ba 关BLM兴
I. INTRODUCTION
Speech is the most important sound that the human auditory system has to process. Physiological recordings from the mammalian auditory nerve 共AN兲 in response to speechlike stimuli such as synthesized vowels and syllables 共e.g., Deng and Geisler, 1987a; Miller and Sachs, 1983; Miller et al., 1997; Sachs and Young, 1979; Young and Sachs, 1979兲 have determined the limits of peripheral representation, and posed clear tasks for processing by the central nervous system. Although such animal models have provided valuable insights, it is difficult to infer the processing mechanism from the measured responses alone. Furthermore, the nonlinear nature of the system makes it difficult to predict the responses to new complex stimuli, often requiring more data collection. Animal experiments are complex and time consuming, even using efficient measurement techniques such as the Spectral Manipulation Procedure 共SMP兲 共LePrell et al., 1996兲. A nonlinear computational model able to simulate the physiological data would be very useful in assessing how this coding would apply to a much wider range of speech stimuli. Recently, Sumner et al. 共2003b兲 presented a complete nonlinear filterbank model of the guinea-pig auditory nerve and evaluated it against AN responses to pure tones. The model was able to reproduce the pure tone tuning across a a兲
Electronic mail:
[email protected]
3534
J. Acoust. Soc. Am. 116 (6), December 2004
Pages: 3534 –3545
wide range of levels and best frequencies 共BFs兲, the compressive cochlear nonlinearities, and rate-level functions associated with different AN fiber types at a given BF. A dual resonance nonlinear 共DRNL兲 filter design 共Meddis et al., 2001兲 was used to simulate the response of the basilar membrane 共BM兲. Transduction of the BM response by inner hair cells was simulated with a revised version of the Meddis inner hair-cell 共IHC兲 共Meddis, 1986; Sumner et al., 2002, 2003a兲. This allowed accurate reproduction of phase locking, adaptation and the characteristics associated with AN fibers of different spontaneous rate. In addition to superior response to pure tones, the model’s nonlinear properties may introduce different responses to complex stimuli from that obtained from models that include linear filters, such as the gammatone filter 共Johanesma, 1972; Patterson et al., 1988兲. Here, the cochlear model1 of Sumner et al. 共2003兲 is evaluated quantitatively in its ability to reproduce AN responses to complex speechlike stimuli. This is an important step in the refinement of the model. It helps to strengthen its value as a computational tool, advancing toward the goal of being able to predict the response to arbitrary stimuli. A variety of nonlinear filter models have been proposed previously 共e.g., Deng and Geisler, 1987b; Goldstein, 1995; Irino and Patterson, 2001; Zhang et al., 2001兲. While speechlike stimuli have been tested in some of the models 共Deng and Geisler, 1987b; Sachs et al., 2002兲, only Bruce et al. 共2003兲 have attempted a systematic comparison with physiological data. Contrasts will be made with the responses of the cur-
0001-4966/2004/116(6)/3534/12/$20.00
© 2004 Acoustical Society of America
rent model and those of the model of Bruce et al. This study focuses on the temporal aspects of AN coding of steady-state vowels. Sachs and Young 共1979兲 first demonstrated that a place representation based upon AN spike rates was insufficient to effectively code vowel spectra, especially in the presence of background noise 共Sachs et al., 1983兲. However, timing information, in the form of phase locking by AN fibers to prominent spectral features, robustly codes the vowel spectra across signal level in cats 共Young and Sachs, 1979兲 even in the presence of background noise 共Sachs et al., 1983兲. This is important for speech representation because it provides level-invariant coding which is missing for a code based on spike rate. Young and Sachs proposed the average localized synchronized rate 共ALSR兲 as a suitable representation of this information. This code is based on temporal information, but also includes rate information. Palmer et al. 共1986兲 and Palmer 共1990兲 recorded the responses to single and double vowels from a large population of AN fibers across a wide range of BFs in the guinea-pig. From the raw spike times, they calculated several measures of temporal coding of vowels at different signal levels. Period histograms locked to the fundamental period of the vowels 共or the combined period for double vowels synthesized with different pitches兲 were collected and these were used to generate synchronization spectra using Fourier analysis. The most prominent component in this FFT spectra was obtained for every fiber, and the fiber BF was plotted against the frequency of this largest component to produce a dominant component analysis. ALSRs were also calculated from the FFT spectra for the population of fibers. All of these analyses highlighted the way that prominent spectral features, such as formant harmonics, were strongly represented in the pattern of AN phase locking and were consistent across signal levels. These two studies of Palmer and colleagues provide the physiological data for the evaluation of the guinea pig cochlea model presented here. The model parameters used here differ only slightly from previously published values. These changes were necessary to simulate more accurately the new data set, and are described with the model in Sec. II. The responses of the new model are shown in Sec. III. The new parameters still reproduce the previously modeled data. Thus, this study adds significantly to the value of the model by expanding the modeled data set to include complex sounds that are of biological significance for the human auditory system. Nonlinear filtering is thought to play an important role in the global 共cross-fiber兲 representation of speech sounds in the auditory nerve. Groups of fibers across wide BF ranges show coherent patterns of temporal responses phase locked to the major formant frequencies of the vowel 共Secker-Walker and Searle, 1990兲. Clear discontinuities across the best-frequency axis corresponding to a shift in the dominant response from one formant to another are suggestive of significant nonlinear processing. This tendency of individual AN fibers to phase-lock to nearby formant peaks rather than local harmonic frequencies may be important to our understanding of the role of formant frequencies in identifying and differentiating vowel sounds. J. Acoust. Soc. Am., Vol. 116, No. 6, December 2004
Section IV investigates the features of the model response that are important to vowel formant representation, and also considers vowel representation in a human cochlea. The response of the revised nonlinear filterbank is compared to the previous generation of models based on linear gammatone filters, and also a version of the DRNL that is linear, but has unchanged pure-tone thresholds. In this way we test the hypothesis that nonlinear filtering contributes to the temporal coding of speech stimuli. These comparisons show that in fact linear filters are capable of highlighting formants across fiber populations if they are matched to the correct bandwidth. However, they do not match detailed patterns in the physiological data as closely as the full nonlinear model. Removal of the IHC/AN complex also shows that this contributes to the vowel formant representation. Further, a linear filterbank with human bandwidths does not produce an adequate temporal representation of the formants. Formant phase-locking appears to be enhanced by a process of synchrony suppression. In physiological recordings from cats 共e.g., Miller et al., 1997; Young and Sachs, 1979兲, one harmonic shows greater phase locking relative to the other harmonics in the AN output than in the input signal spectrum. Bruce et al. 共2003兲 demonstrated through selective ‘‘impairment’’ of their cat auditory model that this synchrony suppression is largely generated on the BM, with a small additional contribution from the IHC/AN complex. Synchrony suppression in the context of the current guinea pig model is investigated in Sec. IV, and appears to be somewhat different, showing more suppression in the IHC/AN than the BM. The current poor understanding of low frequency hearing does mean we must be careful to conclude that BM nonlinearity does not contribute significantly to speech representation. However, this study highlights the importance of the continuing and more accurate measurement of the auditory periphery if we are to understand the basis of speech perception. It also demonstrates the value of computational models in the investigation of important issues, such as the value of nonlinear filtering in auditory processing. II. MODEL DESCRIPTION A. Middle ear filtering
Middle ear filtering is modeled by two cascaded linear band-pass Butterworth filters. One filter is second-order, with lower and upper cutoffs of 4 and 25 kHz. The second is third-order and has lower and upper cutoffs of 0.55 and 30 kHz. A scaling factor of 1.41⫻10⫺10 m/s/uPa produces realistic stapes velocities. B. Mechanical BM filtering
A bank of dual-resonance nonlinear 共DRNL兲 filters is used to simulate the mechanical bandpass filtering of the BM. The DRNL filter has been described in detail elsewhere 共Meddis et al., 2001; Sumner et al., 2003b兲. Figure 1 shows the architecture of a single filter, representing a single BM place. Each DRNL filter consists of two pathways, one linear and the other nonlinear. These represent the passive BM vibration, and the active process within the cochlea, respectively. Each pathway consists of a cascade of first-order gamHolmes et al.: Guinea pig cochlear model speech response
3535
FIG. 1. Schematic diagram of the DRNL filter structure, representing a single BM location.
matone filters 共Patterson et al., 1988兲 and a cascade of second-order Butterworth low-pass filters. In the nonlinear pathway a compression function is sandwiched in the middle of the gammatone filter cascade. The output of the linear and nonlinear pathways are summed to produce the filter output. The compression function in the nonlinear pathway is defined by y 关 t 兴 ⫽SIGN共 x 关 t 兴 兲 ⫻MIN共 a 兩 x 关 t 兴 兩 ,b 兩 x 关 t 兴 兩 v 兲 ,
共1兲
where x 关 t 兴 is the input, y 关 t 兴 is the output, and a, b, and v are parameters. Sumner et al. 共2003b兲 fitted the DRNL to the pure tone responses of guinea-pig AN fibers across a wide range of BFs. To implement a complete filterbank, several of the model parameters vary as a function of the nonlinear filter BF. The relationship of parameter value and BF nl is defined by Parameter⫽10 0 ⫹m log10 BF nl ,
共2兲
where 0 and m are different for each parameter that varies with BF. Values for these variable parameters are shown in Table I. The compression exponent, v , is set to 0.1 dB/dB for all filter BFs. Initially the number of filters in each cascade TABLE I. Basilar membrane filtering 共DRNL兲 parameters that vary as a function of nonlinear BF where p 0 and m refer to Eq. 共2兲 in the text. Where the parameters have changed from Sumner et al. 共2003b兲, this is highlighted by inclusion of the earlier parameter values in the final column. Dashes indicate no change.
Current values Parameter CF lin BW Lin g BW nl a b
3536
Description Best frequency of linear path gammatone filters Bandwidth of linear path gammatone filters Linear path gain Bandwidth of nonlinear path gammatone filters Low level gain in nonlinear path Compressive region gain in nonlinear path
p0
m
Sumner et al. 共2003b兲 values p0
m
0.339
0.895
¯
¯
1.42
0.5
1.3
0.53
5.68 0.8
⫺0.97 0.58
¯ ¯
¯ ¯
1.87
0.45
¯
¯
0.875
¯
¯
⫺5.65
was also fixed across BF. In the present study, it was found that improved frequency threshold curves 共FTCs兲 were produced by varying the linear path cascade with BF. This is detailed in Sec. II D. Other parameters fixed across BF are shown in Fig. 1. Here, the entire filterbank comprises 100 filters, with BFs from 0.1 to 5 kHz, evenly spaced on a log scale.
J. Acoust. Soc. Am., Vol. 116, No. 6, December 2004
C. IHC transduction
The process of mechanical to electrical transduction is simulated by a model of inner hair cell/auditory nerve processes 共Sumner et al., 2002, 2003a兲. This model includes simulations of cilia transduction and receptor potential response, presynaptic calcium processes, neurotransmitter dynamics at the synapse, and AN refractory effects. The parameters used in all of the simulations described here are those for the HSR fiber in Sumner et al. 共2003b, Table I兲. In the simulations that follow, spikes were generated for 100 HSR AN fibers at each BF.
D. Model development
It was found that few changes to the model parameters from Sumner et al. 共2003b兲 were required in order to match the new data closely, while retaining the correct response to Sumner et al.’s simulations. Table I shows the DRNL parameter values. The linear path bandwidth was increased at lower BFs and the gammatone cascade of the linear pathway was altered. Previously a cascade of three gammatone filters was used at all BFs. This produced too much tail response at low BFs and too little at high BFs. Sumner et al. fitted FTCs using data from Evans 共1972兲. Better fits were obtained here with a cascade of 4 at BFs below 8 kHz and 2 at higher BFs. The only other change was to reduce the lower cutoff of the second middle ear filter from 700 to 550 Hz, as it was noted that thresholds were slightly too high at very low BFs. Otherwise the model was unchanged from Sumner et al. Holmes et al.: Guinea pig cochlear model speech response
FIG. 2. Period histograms locked to the vowel period 共10 ms兲 showing data from Palmer et al. 共1986兲 and model simulation of the response to the vowel /Ä/ presented at 80 dB SPL, of six AN fibers with BFs as indicated. The firing rate has been normalized to the value of the largest histogram bin.
FIG. 4. Period histograms locked to the stimulus period 共40 ms兲 showing data from Palmer 共1990; right column兲 and model simulation 共left column兲 of the response to the double vowel /Ä共100 Hz兲/⫹/i共125 Hz兲/ presented at 85 dB SPL, of four AN fibers with BFs as indicated. The firing rate has been normalized to the value of the largest histogram bin.
III. MODEL EVALUATION
Period histograms 共PHs兲 were accumulated from model AN fibers in response to vowel sounds identical to those used by Palmer et al. 共1986兲 and Palmer 共1990兲. Figure 2 shows the data from Palmer et al. 共right column兲 and the model response 共left column兲 for six fibers in response to /Ä/ at 80 dB SPL, lasting 400 ms. Conditions for the model were as close as possible to the data. BFs were set equal to those of the guinea-pig AN fibers. The period histograms were set to the fundamental period 共10 ms兲. The first 40 ms and the last 20 ms were excluded to avoid onset and offset effects. The model replicates the fine structure of the response for each fiber quite closely. The FFT magnitude spectra calculated from each PH are shown in Fig. 3. They show the degree of phase locking to each stimulus harmonic. The
model responses are similar to the data, and show peaks at similar frequencies for all BFs, although sometimes with a somewhat broader range of harmonics picked out. A further test of the model is its response to double vowels, where twice the number of formants are more closely packed in frequency. PHs recorded from four guineapig fibers in response to the double vowel /Ä/⫹/i/ presented at 85 dB SPL for 500 ms 共Palmer, 1990兲, together with the output of the model AN at the same BFs, are shown in Fig. 4. The fundamental frequencies of the vowels /Ä/ and /i/ were 100 and 125 Hz, respectively. Therefore these PHs have a 40-ms period, in order to include an integer number of stimulus cycles for both vowels. At each of the four BFs, the model and data correspond closely. This is confirmed in the FFT magnitude spectra for the corresponding PHs, shown in Fig. 5. The responses of all four channels show almost the same pattern of phase locking to stimulus components as the
FIG. 3. FFT magnitude spectra obtained from the period histograms in Fig. 2. Data from Palmer et al. 共1986; right column兲 and model 共left column兲 simulations are shown. The firing rate has been normalized to the value of the first FFT bin.
FIG. 5. FFT magnitude spectra obtained from the period histograms in Fig. 4. Data from Palmer 共1990; right column兲 and model simulations 共left column兲 are shown. The firing rate has been normalized to the value of the first FFT bin.
A. Individual fiber period histograms and FFT magnitude spectra
J. Acoust. Soc. Am., Vol. 116, No. 6, December 2004
Holmes et al.: Guinea pig cochlear model speech response
3537
FIG. 7. Dominant component versus best frequency for the synthesized double vowel /Ä共100 Hz兲/⫹/i共125 Hz兲/ presented at 85 dB SPL. The model response is shown as solid points, data by Palmer et al. 共1986兲 as crosses. Horizontal broken lines indicate frequencies of the vowel formants, the details of which are indicated to the right of the figure. The diagonal line shows where the dominant component frequency is equal to the fiber BF.
FIG. 6. Dominant component versus best frequency for the synthesized vowels /Ä/, /i/, and /u/ presented at 80 dB SPL. The model response is shown as solid points, data by Palmer et al. 共1986兲 as crosses. Horizontal broken lines indicate frequencies of the first three vowel formants. The diagonal line shows where the dominant component frequency is equal to the fiber BF.
data. The one difference occurs in the 2.2-kHz model channel, which shows more response to the second formant 共F2兲 of /i/ at 2.29 kHz. This suggests the model may not have quite wide enough filters at this frequency. However, as will be seen in the next section, only a small number of model channels show this response.
The vowel formants are indicated by horizontal broken lines on the figures. Formants are highly salient in the pattern of dominant component phase locking by AN fibers, with a range of BFs showing synchronization to each formant frequency. The figures show that at certain BFs, the animal data can show more than one pattern of phase locking. At higher BFs, the fiber response may be dominated by either a high frequency formant or the vowel fundamental. These differences at the same BF are likely to be due to differences between individual animals. The only major difference between animal and model data is seen in the analysis for /i/, where F1 is under-represented between 0.5 and 1 kHz in the model. The differences are small though, in comparison to the strong overall correspondence of model and data across all three vowels. The same comparison is made for the /Ä/⫹/i/ double vowel response recorded by Palmer 共1990; crosses兲 and the model output 共dots兲 in Fig. 7. Again, the model captures the typical phase locking pattern shown by the data, although it is unable to show the split in dominant component in the data around 1–2 kHz for reasons discussed above. There is also too much phase locking to the high frequency formants 共F2,F3兲 of /i/. However, the single set of model parameters used does produce phase locking to the components around which the data is most densely packed at most BFs and so reproduces the key features. C. Average localized synchronized rate profiles
B. Dominant component analysis
From the FFT magnitude spectra obtained for model channels/AN fibers, it is possible to conduct a dominant component analysis across the entire frequency range. For each channel/fiber the stimulus component with the largest value is selected. The channel/fiber BF is then plotted against the frequency of the dominant component. For the single vowels /Ä/, /i/ and /u/ that Palmer et al. 共1986兲 analyzed, the dominant component analysis is shown in Fig. 6 共crosses兲. Also shown is the model response 共dots兲. 3538
J. Acoust. Soc. Am., Vol. 116, No. 6, December 2004
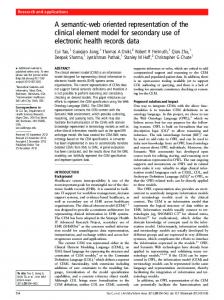
The average localized synchronized rate 共ALSR兲 was first introduced by Young and Sachs 共1979兲 as a way to combine both rate-place and phase-locked temporal information in a single representation. It is a measure of the synchronization to each stimulus harmonic, averaged across AN fibers whose BF is close to the frequency of each harmonic. In order to calculate the ALSR, an FFT is calculated from the PSTH of each fiber. From this the synchronization index (R k ) is obtained for each stimulus harmonic. The ALSR for the kth harmonic of the vowel is then defined as Holmes et al.: Guinea pig cochlear model speech response
FIG. 8. ALSR functions on a logarithmic frequency scale calculated from the response to the synthesized vowels /Ä/, /i/, and /u/ presented at 60 and 80 dB SPL. Data for 60 dB SPL is displaced one order of magnitude down. The model response is shown on the left, data from Palmer et al. 共1986兲 on the right. Vowel formant frequencies are indicated by vertical lines.
ALSR共 k 兲 ⫽
1 R , M k l苸C k kl
兺
共3兲
where R kl is the Fourier magnitude of the kth component of the response of the lth fiber expressed in spikes/second, C k is the set of fibers with CFs within ⫾0.25 oct of k f 0 , M k is the number of fibers in C k , and f 0 is the fundamental frequency of the vowel. Data points are excluded from plots where the frequencies correspond to harmonics of F1 or F2, or sum or difference tones of the same. Studies have shown that the ALSR captures the important spectral features of a stimulus well and is robust across large changes in signal level 共Young and Sachs, 1979兲 and background noise 共Sachs et al., 1983兲. Palmer et al. 共1986兲 and Palmer 共1990兲 used ALSRs to display the response to vowels in their studies. ALSRs for the three vowels they used, at signal levels of 60 and 80 dB SPL, together with the J. Acoust. Soc. Am., Vol. 116, No. 6, December 2004
response of the model to the same synthesized stimuli are shown in Fig. 8. The harmonics closest to F1–F3 of each vowel are indicated by broken vertical lines. Overall, there is very close correspondence between the model and the data. Formant peaks are apparent in both, and where the peaks are small, or peaks unrelated to formants are present in the data, the same peaks are generally present in the model. Changes with level are reproduced reasonably well. Synchronization to F2 and F3 of /i/ is, however, too strong in the model. Nevertheless the relatively high synchronization to harmonics in the trough between F1 and F2 of /i/ are reproduced at 80 dB, if less so at 60 dB. Palmer 共1990兲 recovered separate ALSRs for the constituent vowels of the double vowel /Ä/⫹/i/. The two vowels had different fundamental frequencies, one of 100 Hz, the second of 125 Hz. Thus ALSR values were calculated for Holmes et al.: Guinea pig cochlear model speech response
3539
FIG. 9. ALSR functions on a logarithmic frequency scale calculated from the response to the synthesized double vowel /Ä共100 Hz兲/⫹/i共125 Hz兲/ presented at 85 dB SPL. The model response is shown on the left, data from Palmer 共1990兲 on the right. Plots are shifted vertically by one order of magnitude for clarity. The scales refers to 80 dB SPL. Vowel formant frequencies are indicated by vertical lines.
frequencies spaced 25 Hz apart. The ALSRs for the two vowels were recovered by sampling the complete ALSR at multiples of their respective fundamental frequencies. Palmer found that the recovered ALSRs showed almost the same pattern of peaks and troughs as those for the vowels presented singly. The ALSRs for /Ä共100 Hz兲/ and /i共125 Hz兲/ based on Palmer’s data, and the corresponding model ALSRs obtained in the same manner, are shown in Fig. 9. Shared harmonics of the two vowels are excluded from these plots. The model ALSRs correspond well with the data. They also closely match the ALSRs derived from single vowels in Fig. 8. There is greater synchronization to F2 of /i/, as per the results of the dominant component analysis in Fig. 6. Other than this difference, the ALSRs recovered from the combined activity show a close correspondence. In order to determine how robust the ALSRs are across a wider range of signal levels, Fig. 10 shows ALSRs for the single vowel /Ä/ at levels of 27 to 77 dB SPL. No comparable guinea pig data has been published for this simulation, however Young and Sachs 共1979兲 show similar analyses recorded from the cat. Figure 10 includes their data for the vowel /Ä/, chosen since this was the vowel with the closest match in formant frequencies to the vowels used here. Direct comparisons must be made with caution due to the different species, but Fig. 10 shows that the formant peaks are retained down to the lowest signal levels, much like Young and Sachs’ data. The guinea pig ALSRs do show less prominent formant peaks than the cat data, but this is also shown in Palmer et al.’s guinea pig data at 60 and 80 dB SPL 共Fig. 8兲. 3540
J. Acoust. Soc. Am., Vol. 116, No. 6, December 2004
This may be due to differences in filter bandwidths, or synchrony suppression which is investigated in the next section. IV. THE ROLE OF TUNING AND NONLINEARITY
In this section the properties of the model which affect the quality of representations are investigated, in particular the contributions of BM filter shape and synchrony suppression. Figure 11 shows the responses of various filterbank models to the vowel /Ä/, presented at 80 dB SPL, represented as a dominant component analysis. The responses to other vowels showed similar differences between the models. Figure 11共a兲 shows the response of a gammatone filterbank with the output fed through the older version of the IHC model 共Meddis, 1986兲. The filters have been tuned to give the same 10-dB bandwidths as the DRNL using the same method described by Sumner et al. 共2003b兲. The middle-ear model was modified slightly from that described in Sec. II A to produce the same audiogram as the DRNL model.2 This filterbank shows a quite different response at low BFs to the nonlinear DRNL 共cf. Fig. 6兲. At low BFs F1 is over represented. This is due to the high frequency slope of the gammatone filters, which is too shallow compared to guinea pig auditory filters. Gammatone filters are symmetric about BF on a linear frequency scale, and so alter the representation, which in animals is based upon more asymmetric filter shapes at high input intensities. At BFs from 1 to 2 kHz F0 is overrepresented. At 80 dB SPL input level, the gammatone filters are too narrow to pick out the formants, since Holmes et al.: Guinea pig cochlear model speech response
FIG. 10. ALSR functions on a logarithmic frequency scale calculated from the model response to the synthesized vowel /Ä/ 共left column兲 and corresponding cat data 共data from Young and Sachs, 1979兲 共right column兲 presented at intensities from 27 to 77 dB SPL. Plots are shifted vertically by one order of magnitude for clarity. The scales refers to 77 dB SPL. Vowel formant frequencies are indicated by vertical lines.
FIG. 11. Dominant component analysis of the reponse to /Ä/ for four auditory nerve models. 共a兲 Linear gammatone filterbank with guinea-pig bandwidths, and Meddis 86 IHC. 共b兲 Linearized version of the DRNL filterbank model. 共c兲 Linearized DRNL filterbank model only 共without the IHC/AN stage兲. 共d兲 Linear gammatone filterbank with human bandwidths, and Meddis 86 IHC. J. Acoust. Soc. Am., Vol. 116, No. 6, December 2004
Holmes et al.: Guinea pig cochlear model speech response
3541
the filter bandwidths do not vary with level. The broad low frequency tail characteristic of the physiological response at high intensities is absent. Figure 11共b兲 shows the response of the DRNL filterbank presented in previous sections, but with the compression removed ( v ⫽1, b( 0 )⫽1e5) so the output of the normally nonlinear pathway is allowed to grow linearly at all input levels. The pure tone thresholds for this model are identical to the full nonlinear model. The response is more similar to that of the nonlinear DRNL 共cf. Fig. 6兲 than the gammatone. Detail differences exist in the representation of lowfrequency components, and there is less response to F2 共1100 Hz兲 in the linearized DRNL. These comparisons suggest that BM nonlinearity is not crucial for reproducing the data, and introduces only small differences at low BFs. The lack of a major nonlinear effect is not surprising since the pure tone response of the model is mostly linear at low BFs. At high BFs nonlinearity is more significant, and the differences would likely be larger. Figure 11共c兲 shows the linearized DRNL filterbank output alone, with no IHC/AN complex. As a consequence of phase-locking limits—shown by the DRNL response to high frequency components in 共c兲 which is lacking in 共b兲—the fit to the data is slightly degraded when the AN response is omitted. Otherwise, this simulation shows that the IHC/AN complex does contribute much to the vowel representation. Finally, Fig. 11共d兲 shows the response of a gammatone filterbank with the old 共Meddis, 1986兲 haircell, with bandwidths set to match human ERBs. The representation here is remarkably different, with BF components dominating at all BFs, and no widespread response to the formants. Figures 11共b兲 and 共c兲 suggest that in this model BM nonlinearity makes a small contribution to vowel formant representation, while the IHC/AN complex mostly effects higher stimulus frequencies. However, this conclusion is drawn from a dominant component analysis, which may obscure more detailed changes through the discarding of all but the largest response in each model channel. Bruce et al. 共2003兲 have shown that synchrony suppression, particularly on the BM, but also within the IHC, contributes to the dominance of vowel formants in temporal representations of vowels in the cat AN. The current model is now compared to the only available guinea pig data in order to understand whether this is also true in the guinea pig. Palmer 共1990兲 derived FFTs from AN spikes in a guinea pig AN fiber with a BF of 2.01 kHz when the double vowel /Ä/⫹/i/ was presented at signal levels of 55–95 dB SPL. Figure 12 shows the model response and the corresponding data 共b兲, derived in the same way as those in Sec. III A. The model response includes both the full model 共a兲 and the model BM output only 共c兲. The data 关Fig. 12共b兲兴 shows the way in which phase locking shifts to different vowel harmonics as the compression and filter bandwidth characteristics vary with level. The response shifts from formant harmonics close to BF at low levels, when the filter is sharply tuned, to more intense but remote formant harmonics at high intensities with broader BM tuning. The full model shows a similar shift with level to the data, although there are detail differences. At higher intensities, the model is dominated by the 1100-Hz harmonic, 3542
J. Acoust. Soc. Am., Vol. 116, No. 6, December 2004
whereas the data shows 700 Hz as the largest component. Figure 7 shows that in the data there are fibers showing 700, 800, and 1100 Hz as dominant components around 2 kHz BF. Therefore the model does match some fibers, but not the single illustrative fiber chosen by Palmer. Of more interest is the lack of synchrony suppression in the data. Multiple harmonics are strongly represented, even at high levels. This contrasts strongly with the pattern shown in the cat 共Bruce et al., 2003, Fig. 8兲, where one component almost completely dominates the output at high intensities. The guinea pig data looks more like an impaired cat fiber 共assumed to have lost BM nonlinearity and some IHC sensitivity兲 with little synchrony suppression. This difference explains the contrast in the formant peaks in the ALSRs for the model and cat data in Fig. 10. The full model 共a兲 does show synchrony suppression at 85 and 95 dB SPL, when the 1100-Hz component dominates strongly. The BM-only model 共c兲 shows much less synchrony suppression than the full model even at 95 dB. The prominent 2.25-kHz peak at lower signal levels in the BM response is a consequence of the narrow filters at this level, not suppression. The decline in phase locking in guinea pig AN fibers above 1.5–2 kHz explains why this prominent harmonic on the BM is not as strongly represented in the full model output. The suppression that exists in the model is generated more within the IHC/AN complex, not on the BM. In fact the current model probably shows too much suppression within the IHC at high input levels. V. DISCUSSION
Simulations of the guinea pig cochlea have been described in Sec. III. These have produced results that match physiological data closely in terms of phase locking to stimulus components. The simulated AN response of individual model channels to both single- and double-vowels captures the important features of phase locking in the data. When all of these channels are combined to give the population response, in both the dominant component analysis and the ALSR, a close correspondence is found. The ALSR response across a wide range of signal levels also shows a similarly robust formant representation to the available cat data. The filterbank was initially based upon parameters derived from the response of the guinea pig AN to pure tones 共Sumner et al., 2003b兲. Very little modification to those filterbank parameters was necessary in order to produce close matches to the response to vowels. The modifications simply improved the lower BF thresholds and FTC shapes. The change from the parameters used in the earlier simulations may indicate that the data previously modeled did not sufficiently constrain the low-BF responses. The focus in Sumner et al. 共2003b兲 was upon higher BF fibers, which may have led to less optimal parameters for lower-BF fibers. In order to determine whether the parameters adopted in this study retained the correct responses to pure tones, the simulations in Sumner et al. 共2003b兲 were repeated. Results were not seriously affected, and the good match to data was repeated. Therefore the current parameters can be viewed as a refinement of the previous ones. Holmes et al.: Guinea pig cochlear model speech response
FIG. 12. FFT magnitude spectra obtained from period histograms locked to the stimulus period for a fiber with BF of 2.01 kHz, showing 共a兲 full model AN spike rate, 共b兲 AN spike data from Palmer 共1990兲 and 共c兲 BM model response magnitude. Stimulus is the double vowel /Ä共100 Hz兲/⫹/i共125 Hz兲/ presented at levels of 55–95 dB SPL. The spike rate/BM response has been normalized to the value of the largest histogram bin.
The results in Fig. 11 compare different linear and nonlinear models and highlight the usefulness of computational models in investigating the role of nonlinearity in speech representation. They suggest, perhaps surprisingly, that filter shape and not nonlinearity is crucial for the observed representations in the guinea pig. The current results contrast with those of Bruce et al. 共2003兲 and Deng and Geisler 共1987b兲. Deng and Geisler demonstrated that when a linear and a nonlinear model were matched for frequency threshold curve 共FTC兲 shape, the nonlinear model produced a better match to the animal data. The response of their linearized model resembled our gammatone simulation of human auditory filJ. Acoust. Soc. Am., Vol. 116, No. 6, December 2004
ters, locking to harmonics rather than formants. The removal of BM nonlinearity had a much larger effect in Deng and Geisler’ model than in the current one. This is due to differences in the degree of nonlinearity at low BFs. Deng and Geisler assumed significant nonlinearity across all BFs. Sumner et al. 共2003b兲 fitted the current model to data from Cooper and Yates 共1994兲 which showed less nonlinearity at a 1.8-kHz place than at higher BFs. Therefore, although parameters for BFs below 1.8 kHz are extrapolated using the logarithmic function in Eq. 共2兲, they are more constrained than Deng and Geisler’s parameters. The parameters do produce a good match to the data, although more physiological Holmes et al.: Guinea pig cochlear model speech response
3543
measurements are required at low BFs in order to confirm the degree of nonlinearity at low frequencies in the guinea pig. In our guinea pig cochlear model, the broad frequency selectivity allows intense harmonics below BF to be picked out. The asymmetrical shape of the DRNL filters, with a steep slope on the high frequency side and a shallow slope below BF, causes harmonics with frequencies greater than the filter BF to be rejected. Thus harmonics lower in frequency than the first formant are apparent in the dominant component analysis of even the linearized DRNL, while the more symmetrical gammatone filters do not show this property. Even if the bandwidths of the gammatone filters were adjusted manually according to the expected input level, they would not show the correct formant representation due to their symmetry about BF. Section IV also suggests that the spread of temporal coding of formants along the cochlear partition might be less in humans than some other species. It is true that human cochlear filters are sharper than many animals 共Shera et al., 2002兲 and may be sufficient to support a reasonable spectral code. However, any conclusions drawn from our simulations about the importance of a temporal code for speech must be made with caution. Emerging evidence suggests that low frequency hearing in humans is in fact quite nonlinear 共LopezPoveda et al., 2003; Nelson and Schroder, 2004兲. Therefore the gammatone filterbank may not provide a realistic representation of responses to broadband signals. The human auditory nerve may behave more like the model of Deng and Geisler 共1987b兲, which assumed significant nonlinearity at all BFs. Given suitable human compression and tuning data, the DRNL model architecture should be able to predict the human temporal response to speech. This highlights the need for further psychophysical characterization of the human auditory periphery to more tightly constrain computational models. The results presented in Figs. 11 and 12 suggest that BM nonlinearity has only a small effect on speech representation, at least in guinea pigs. However, most of the spectral energy of vowel stimuli falls at frequencies well below those at which guinea pigs are maximally sensitive. At higher BFs nonlinearity is far more significant and the differences between a nonlinear and linear model would probably be much larger. Attempts have been made to generate vowel sounds that are normalized to account for cochlear differences between species 共Recio et al., 2002兲. Unfortunately such stimuli are not suitable for assessing temporal responses since their formant frequencies fall well outside the range of phase locking in guinea pigs. Therefore no attempt was made to study responses to normalized vowels at higher BFs. The reduced nonlinearity of low-BF places may explain the relatively weak BM synchrony suppression shown in Fig. 12 for the current model compared to the cat model of Bruce et al. 共2003兲. Our results may appear contradictory to their demonstration of the importance of BM-generated synchrony suppression. However we feel that the current simulations are not opposed to their findings, but may illustrate a species difference. Of course the relative lack of guinea pig data makes these conclusions tentative. 3544
J. Acoust. Soc. Am., Vol. 116, No. 6, December 2004
The guinea pig cochlea model presented here can effectively reproduce an average AN population response to vowels. As described here, it is a suitable model for further investigation of speech coding in the AN. A future goal is the transfer of principles extracted from animal studies to models of human hearing and hearing impairment in particular. For example, it has been shown that one kind of human hearing loss may be simulated in our model by a single change to the DRNL compression function parameter a 共Lopez-Poveda and Meddis, 2000兲. Similarly, Sachs et al. 共2002兲 and Bruce et al. 共2003兲 showed that auditory trauma in the cat could be modeled through a small set of parameter changes. A fuller appreciation of these issues should lead to improvements in speech coding algorithms in digital hearing aids. Another future application is the use of peripheral models as inputs to more ambitious models of processing in the central nervous system itself. In such cases, any errors in modeling the periphery will propagate throughout the system. As a consequence, detailed and rigorous evaluation of the peripheral model against available physiological data will assume even more importance. ACKNOWLEDGMENTS
The work was supported by an Essex University studentship and a grant from the Wellcome Foundation. The authors would like to thank the two anonymous reviewers for their helpful comments and suggestions on an earlier version of this paper. 1
The software used for the simulations in this study is available for download in two forms. DSAM 共Development System for Auditory Modelling兲 is a C library containing an extensive collection of auditory model components, and support routines. AMS 共Auditory Model Simulator兲 is a crossplatform application, providing a flexible GUI interface for all the models supported by DSAM. These can be downloaded from www.essex.ac.uk/ psychology/hearinglab/dsam, together with the simulation scripts required to configure the model correctly. 2 The order of the second bandpass is raised to 3; lower cut-offs for the two filters are 100 Hz and 6 kHz, respectively; overall gain is adjusted to a scalar value of 5.62⫻105 ; a first-order low-pass-filter with gain of 1.68 ⫻10⫺2 and a cutoff of 10 Hz acts as an integrator to convert stapes velocity to displacement. Bruce, I. C., Sachs, M. B., and Young, E. D. 共2003兲. ‘‘An auditory-periphery model of the effects of acoustic trauma on auditory nerve responses,’’ J. Acoust. Soc. Am. 113, 369–388. Cooper, N. P., and Yates, G. K. 共1994兲. ‘‘Non-linear input-output functions derived from the responses of guinea-pig cochlear nerve fibers: Variations with characteristic frequency,’’ Hear. Res. 78, 225–243. Deng, L., and Geisler, C. D. 共1987a兲. ‘‘Responses of auditory-nerve fibers to nasal consonant-vowel syllables,’’ J. Acoust. Soc. Am. 82, 1977–1988. Deng, L., and Geisler, C. D. 共1987b兲. ‘‘A composite auditory model for processing speech sounds,’’ J. Acoust. Soc. Am. 82, 2001–2012. Evans, E. F. 共1972兲. ‘‘The frequency response and other properties of single fibers in the guinea-pig cochlear nerve,’’ J. Physiol. 共London兲 226, 263– 287. Goldstein, J. L. 共1995兲. ‘‘Relations among compression, suppression, and combination tones in mechanical responses of the basilar membrane: data and MBPNL model,’’ Hear. Res. 89, 52– 68. Irino, T., and Patterson, R. D. 共2001兲. ‘‘A compressive gammachirp auditory filter for both physiological and psychophysical data,’’ J. Acoust. Soc. Am. 109, 2008 –2022. Johannesma, P. I. M. 共1972兲. ‘‘The pre-response stimulus ensemble of neurons in the cochlear nucleus,’’ in Proceedings of the Symposium on Hearing Theory 共IPO Eindhoven, The Netherlands兲, pp. 58 – 69. Holmes et al.: Guinea pig cochlear model speech response
LePrell, G., Sachs, M. B., and May, B. 共1996兲. ‘‘Representation of vowellike spectra by discharge rate responses of individual auditory-nerve fibers,’’ Aud. Neurosci. 2, 275–288. Lopez-Poveda, E. A., and Meddis, R. 共2000兲. ‘‘A computational model for simulating basilar membrane nonlinearity in subjects with normal and impaired hearing,’’ International Hearing Aid Research Conference, PA9, Lake Tahoe, CA. Lopez-Poveda, E. A., and Meddis, R. 共2001兲. ‘‘A human nonlinear cochlear filterbank,’’ J. Acoust. Soc. Am. 110, 3107–3118. Lopez-Poveda, E. A., Plack, C. J., and Meddis, R. 共2003兲. ‘‘Cochlear nonlinearity between 500 and 8000 Hz in listeners with normal hearing,’’ J. Acoust. Soc. Am. 113, 951–960. Meddis, R. 共1986兲. ‘‘Simulations of mechanical to neural transduction in the auditory receptor,’’ J. Acoust. Soc. Am. 79, 702–711. Meddis, R., O’Mard, L. P., and Lopez-Poveda, E. A. 共2001兲. ‘‘A computational algorithm for computing nonlinear auditory frequency selectivity,’’ J. Acoust. Soc. Am. 109, 2852–2861. Miller, M. I., and Sachs, M. B. 共1983兲. ‘‘Representation of stop consonants in the discharge patterns of auditory-nerve fibers,’’ J. Acoust. Soc. Am. 74, 502–517. Miller, R. L., Schilling, J. R., Franck, K. R., and Yound, E. D. 共1997兲. ‘‘Effects of acoustic trauma on the representation of the vowel /e/ in cat auditory nerve fibers,’’ J. Acoust. Soc. Am. 101, 3602–3616. Nelson, D. A., and Schroder, A. C. 共2004兲. ‘‘Peripheral compression as a function of stimulus level and frequency region in normal-hearing listeners,’’ J. Acoust. Soc. Am. 115, 2221–2233. Palmer, A. R. 共1990兲. ‘‘The representation of the spectra and fundamental frequencies of steady-state single- and double-vowel sounds in the temporal discharge patterns of guinea pig cochlear-nerve fibers,’’ J. Acoust. Soc. Am. 88, 1412–1426. Palmer, A. R., Winter, I. M., and Darwin, C. J. 共1986兲. ‘‘The representation of steady-state vowel sounds in the temporal discharge patterns of the guinea pig cochlear nerve and primarylike cochlear nucleus neurons,’’ J. Acoust. Soc. Am. 79, 100–113.
J. Acoust. Soc. Am., Vol. 116, No. 6, December 2004
Patterson, R. D., Holdsworth, J., Nimmo-Smith, I., and Rice, P. 共1988兲. ‘‘An efficient auditory filterbank based on the gammatone function,’’ 共SVOS final report, Part B兲, MRC Applied Psychology Unit Tech. Rep. 共unpublished兲. Recio, A., Rhode, W. S., Kiefte, M., and Kluender, K. R. 共2002兲. ‘‘Responses to cochlear normalized speech stimuli in the auditory nerve of cat,’’ J. Acoust. Soc. Am. 111, 2213–2218. Sachs, M. B., and Young, E. D. 共1979兲. ‘‘Encoding of steady-state vowel in the auditory nerve: Representation in terms of discharge rate,’’ J. Acoust. Soc. Am. 66, 470– 479. Sachs, M. B., Voight, H. F., and Young, E. D. 共1983兲. ‘‘AN representation of vowels in background noise,’’ J. Neurophysiol. 50, 27– 45. Sachs, M. B., Bruce, I. C., Miller, R. L., and Young, E. D. 共2002兲. ‘‘Biological Basis of Hearing Aid Design,’’ Ann. Biomed. Eng. 30, 157–168. Secker-Walker, H. E., and Searle, C. L. 共1990兲. ‘‘Time-domain analysis of auditory nerve firing rates,’’ J. Acoust. Soc. Am. 88, 1427–1436. Shera, C. A., Guinan, J. J., and Oxenham, A. J. 共2002兲. ‘‘Revised estimates of human cochlear tuning from otoacoustic and behavioral measurements,’’ Proc. Natl. Acad. Sci. U.S.A. 99, 3318 –3323. Sumner, C., Lopez-Poveda, E. A., O’Mard, L. P., and Meddis, R. 共2002兲. ‘‘A revised model of the inner-hair cell and auditory-nerve complex,’’ J. Acoust. Soc. Am. 111, 2178 –2188. Sumner, C., Lopez-Poveda, E. A., O’Mard, L. P., and Meddis, R. 共2003a兲. ‘‘Adaptation in a revised inner-hair cell model,’’ J. Acoust. Soc. Am. 113, 893–901. Sumner, C., O’Mard, L. P., Lopez-Poveda, E. A., and Meddis, R. 共2003b兲. ‘‘A non-linear filter-bank model of the guinea pig cochlear nerve: Rate responses,’’ J. Acoust. Soc. Am. 113, 3264 –3274. Young, E. D., and Sachs, M. B. 共1979兲. ‘‘Representation of steady-state vowels in the temporal aspects of the discharge patterns of populations of auditory-nerve fibers,’’ J. Acoust. Soc. Am. 66, 1381–1403. Zhang, X., Heinz, M. G., Bruce, I. C., and Carney, L. H. 共2001兲. ‘‘A phenomenological model for the responses of auditory-nerve fibers: I. Nonlinear tuning with compression and suppression,’’ J. Acoust. Soc. Am. 109, 648 – 670.
Holmes et al.: Guinea pig cochlear model speech response
3545