ATTENDANCE AT ENVIRONMENTAL HORTICULTURE. EXTENSION PROGRAMS. By. ALEXIS ...... individuals with a final response number of 276. They did a ...
THE THEORY OF PLANNED BEHAVIOR IN PREDICTING ATTENDANCE AT ENVIRONMENTAL HORTICULTURE EXTENSION PROGRAMS
By ALEXIS A. CLARK-RICHARDSON
A THESIS PRESENTED TO THE GRADUATE SCHOOL OF THE UNIVERSITY OF FLORIDA IN PARTIAL FULFILLMENT OF THE REQUIREMNTS FOR THE DEGREE OF MASTER OF SCIENCE UNIVERSITY OF FLORIDA 2003
For my family
ACKNOWLEDGEMENTS Conducting this research has been a great learning experience for me. I would like to thank the members of my committee, Dr. Rick Schoellhorn, Dr. Jim Barrett, Dr. Tracy Irani and Elizabeth Felter, for giving me the opportunity to work with them during this time. Their patience and assistance, as well as much needed advice, have been greatly appreciated. I would also like to thank my parents and sisters, and my husband for their neverending encouragement of my educational journey. The support and blessings of my family and friends will always be remembered.
iii
TABLE OF CONTENTS page ACKNOWLEDGMENTS .............................................................................................. iii LIST OF TABLES.......................................................................................................... vi ABSTRACT.................................................................................................................. viii CHAPTER 1
INTRODUCTION .....................................................................................................1 Cooperative State Research, Education and Extension Service ................................2 Environmental Horticulture in Florida.......................................................................5 Purpose and Objective ...............................................................................................6 Theoretical Framework..............................................................................................7
2
LITERATURE REVIEW ........................................................................................13
3
METHODOLOGY ..................................................................................................20 Subjects ....................................................................................................................20 Research Design.......................................................................................................20 Pilot Study................................................................................................................21 Procedure .................................................................................................................21 Instrumentation ........................................................................................................23 Data Interpretation ...................................................................................................27 Reliability.................................................................................................................27 Hypotheses...............................................................................................................31 Data Analysis ...........................................................................................................31
4
RESULTS ................................................................................................................33 Descriptive Information ...........................................................................................33 Testing the Hypotheses ............................................................................................39 Summary ..................................................................................................................44
5
DISCUSSION ..........................................................................................................45
iv
Key Findings and Implications ................................................................................45 Limitations ...............................................................................................................48 Conclusions and Directions for Future Research.....................................................48 Recommendations....................................................................................................49 APPENDIX A COVER LETTER AND QUESTIONNAIRE .........................................................51 B THEORY OF PLANNED BEHAVIOR (figure) .....................................................58 LITERATURE CITED ...................................................................................................60 BIOGRAPHICAL SKETCH ..........................................................................................63
v
LIST OF TABLES Table
page
3-1 Independent Samples Test for Early Respondents vs. Late Respondents ...............23 3-2 Attitude Scale Item (Direct Measure)......................................................................24 3-3 Behavioral Belief Scale Items .................................................................................24 3-4 Subjective Norm Scale Items ..................................................................................25 3-5 PBC Scale Items ......................................................................................................26 3-6 Motivation ...............................................................................................................26 3-7 Perceived Level of Knowledge................................................................................26 3-8 Behavioral Intent Scale Items..................................................................................27 3-9 Cronbach Alpha Reliability Coefficients: Behavioral Beliefs ................................28 3-10 Cronbach Alpha Reliability Coefficients: Outcome Evaluation ...........................28 3-11 Cronbach Alpha Reliability Coefficients: Attitude (direct measure) ....................28 3-12 Cronbach Alpha Reliability Coefficients: Normative Beliefs...............................28 3-13 Cronbach Alpha Reliability Coefficients: Motivation to Comply........................29 3-14 Cronbach Alpha Reliability Coefficients: Subjective Norm (direct measure) ......29 3-15 Cronbach Alpha Reliability Coefficients: Control Belief Strength......................29 3-16 Cronbach Alpha Reliability Coefficients: Control Belief Power .........................29 3-17 Cronbach Alpha Reliability Coefficients: PBC (direct measure)..........................29 3-18 Cronbach Alpha Reliability Coefficients: Intent ...................................................29 3-19 Descriptive Statistics: TPB Model Constructs ......................................................30
vi
3-20 Descriptive Statistics: TPB Model Constructs: Attendees/Non-attendees ............30 3-21 Pearson Correlations between the TPB Model Constructs....................................31 4-1 Cross-tabulation: Attendance/Sales.........................................................................35 4-2 Cross-tabulation: Attendance/Production System ...................................................35 4-3 Cross-tabulation: Motivation to Attend Extension Programs..................................36 4-4 Descriptive Statistics: Direct/Belief-based Attitude Measures ...............................37 4-5 Descriptive Statistics: Belief-Based Attitude Measures: Attendee/Non-attendee...38 4-6 Independent Samples Test: Attendee/Non-attendee................................................40 4-7 Independent Samples Test: Knowledge/Attendance ...............................................42 4-8 Multiple Regression Coefficients: Entire Sample ...................................................42 4-9 Multiple Regression Coefficients: Attendees ..........................................................43 4-10 Multiple Regression Coefficients: Non-attendees.................................................44
vii
Abstract of Thesis Presented to the Graduate School of the University of Florida in Partial Fulfillment of the Requirements for the Degree of Master of Science THE THEORY OF PLANNED BEHAVIOR IN PREDICTING ATTENDANCE AT ENVIRONMENTAL HORTICULTURE EXTENSION PROGRAMS By Alexis A. Clark-Richardson August 2003 Chair: Dr. Rick Schoellhorn Major Department: Environmental Horticulture The Florida Cooperative Extension Service has a long tradition of serving clientele via many different channels. One primary technique used by many agents is hosting workshops or demonstrations. Horticulture extension agents have a large audience and target this clientele for their major programs by using flyers, newsletter announcements, email, and phone calls. These agents have expressed a need to discover why a larger percentage of this audience is not participating. Therefore, the Theory of Planned Behavior was utilized to determine how attitudes, subjective norms and perceived behavioral control predict the intent of horticulture professionals to attend horticulture-based Extension programs. A purposive sample of 3000 professionals was surveyed. Overall, results showed that the TPB model explained 53% of the variation in behavioral intent, and all three constructs were significant predictors of intent. However, significant differences existed among attendees and non-attendees with regard to the model. Attitude was the only significant predictor of intent for non-attendees. It was
viii
concluded that in order to boost participation of horticulture professionals at Extension programs, a specific need exists for understanding and, possibly, changing the attitudes and beliefs of non-attendees.
ix
CHAPTER 1 INTRODUCTION Interviews with various extension agents and specialists reveal that horticulture industry professionals in Florida are targeted for extension programs, but attendance at programs does not seem to represent this effort (L. Felter, T. Hurt, R. Schoellhorn, personal communication, 2002). Agents are interested in learning what would motivate more people to attend their programs. Therefore, the purpose of the current study was to determine why horticulture industry professionals participate in Extension programs and what would possibly motivate those who do not attend to become more active in these programs. Client satisfaction and program accountability is a driving force behind the Extension service (Habeeb, Birkenholz, & Weston, 1987; Martin & Omer, 1987; UF/IFAS Fact Digest, 2003). Therefore, a constant need for understanding the program environment and target audience exists for Extension Agents (Martin & Omer, 1987). Literature suggests that quality programming is important to maintaining and promoting new audiences (Bowling, 2001; Israel, 2001; Norland, 1992; Summerhill & Taylor, 1992). Suggestions for improving program planning include gathering valuable information about the target audiences and their needs, having the clientele participate in the planning process, understanding the program life cycle and knowing when to end a program, and properly evaluating the programs (Bowling, 2001; Israel, 2001; Norland, 1992; Summerhill & Taylor, 1992).
1
2 Anecdotal information reveals that agents are targeting large groups of growers and nursery owners, but attendance at programs does not seem representative of this effort (L. Felter, T. Hurt, R. Schoellhorn, personal communication, 2002). Primary marketing tactics used to disseminate information about programs are flyers, newsletter announcements, emails and phone calls. Agents have expressed an interest in understanding the basic question of what factors would help increase the number of people at their programs. Even though these agents do many evaluations of their programs, they indicate that the data collected from the evaluations fails to answer that question. One reason may be instrument design (Jacob & Ferrer, 2000)). Many program evaluations indicate likes and dislikes of attendees, such as the delivery method, presenter, or location, but fail to discover a deeper understanding of what motivated the grower to actually attend (Jacob & Ferrer, 2000). Cooperative State Research, Education, and Extension Service The three main objectives of the U. S. Cooperative State Research, Education and Extension Service are to offer the information gathered at the land-grant universities; encourage the adoption of new techniques and ideas; and use the educational process to improve lives of clientele. In essence, the motto encompasses all that the Extension service does: “Help people help themselves” (Habeeb, Birkenholz, & Weston, 1987; N. Place, personal communication, 2001). The Florida Cooperative Extension Service (FCES) is one of three branches in the University of Florida’s Institute of Food and Agricultural Sciences (UF/IFAS), which was established in April 1964 when The University of Florida’s College of Agriculture, School of Forestry, Agriculture programs Experiment Stations and the Cooperative
3 Extension Service were combined. FCES is a partnership between UF/IFAS, the United States Department of Agriculture, and county governments in Florida. Each of Florida’s 67 counties is home to an Extension office and many agents. In addition, IFAS incorporates 17 on-campus academic departments, 14 Research and Education Centers (REC), 7 research and demonstration sites and 5 locations with Degree Program Partnerships. The Extension service utilizes three conceptual models when delivering educational information. Agents attempt to balance technology transfer, problem solving, and knowledge change when developing and delivering educational programs. The goal of these programs is to elicit a behavioral change in the target group (Habeeb, Birkenholz, & Weston, 1987). Therefore, Extension agents are continually searching for the most effective way to meet the needs of their audience (Martin & Omer, 1987). Many different types and sizes of Extension programs exist in the various areas of agriculture, such as pest management, water conservation, horticulture, forestry, child development, business, marketing and many more. Delivery methods range from workshops and demonstrations to one-on-one sessions and web-based activities. Program development is defined as the activities involved in building, creating, planning or developing an educational program (Taylor, 1994). Furthermore, the Extension service has a variety of categories for their programs, including routine program, maintenance program, impact program, and major program designations. Extension program development is challenging to the agent and specialists involved, requiring large amounts of time and personal commitment that directly affects the success or failure of their programs (Israel, 2001; Place, 2001). Research has
4 indicated that the extension service is a major supplier of farmer education about new technology and farming practices (Ford, 1995). Many studies have been conducted that explain the importance of the Extension service to its clientele. The audience of each of these programs range from the general public to specialized industry professionals such as teachers, farmers, and business owners. Most of the respondents in these studies are satisfied with the services provided and state that the knowledge gained from meetings, workshops, phone calls, etc., are important to the success of their businesses (Alston & Reding, 1998; Ford, 1995; Habeeb, Birkenholz, & Weston, 1987; Martin & Omer, 1987). Many dollars are spent each year on producing extension programs. The total national CREES budget for 2003 is over $1 billion (USDA, 2003). In 2002, local finances to fund Extension in Florida amounted to $29.2 million. Therefore, suggestions have been made to the Extension service regarding better planning techniques that could increase participation (Alston & Reding, 1998; Bruening, Radhakrislma, & Rollins, 1992; Martin & Omer, 1987). Identifying the target audience is a common theme throughout the literature (Alston & Reding, 1998; Bruening, Radhakrislma, & Rollins, 1992; Habeeb, Birkenholz, & Weston, 1987; Martin & Omer, 1987; Schmitt, Durgan, & Iverson, 2000). Agents should understand the characteristics of their audience and focus on specific needs and expectations as they relate to the real problems of the participants (Alston & Reding, 1998; Place, 2001; Schmitt, Durgan, & Iverson, 2000). Therefore, understanding who participates and why are major factors that need to be addressed when planning educational programs (Alston & Reding, 1998; Bruening, Radhakrislma, & Rollins, 1992; Martin & Omer, 1987).
5 Environmental Horticulture in Florida The Horticulture Industry in Florida is growing. The entire nursery and landscape industry was worth about $8.5 billion in 2001. This figure has almost doubled since 1997 (DeSousa, 2002). The 2000 figures provided by FNGA indicate that the value added to the economy was $4.38 billion. Also, the industry provided employment for approximately 170,000 people, and paid total wages and salaries of $2.91 billion. Information provided by the Florida Agriculture Statistical Service (2002) suggests that ornamental production, which includes cut flowers, potted plants, hanging baskets, potted foliage, cut foliage, bedding and garden plants, and woody ornamentals is a large business in Florida. The state is ranked second to California. However, Florida is leading the country in wholesale sales of potted foliage for use indoors and in hanging baskets. Sales for this particular industry were $361.2 million in 2001. Lake, Orange and Seminole counties alone accounted for 35% of these sales (FASS, 2002). According to this information, the industry is economically important to Florida. Of all the agriculture commodities in the state, the nursery industry is the "single largest dollar producer" (DeSousa, 2002). Over $1.5 billion is contributed to Hillsborough County alone, which is equivalent to the revenues of the Port of Tampa or hosting a Super Bowl every weekend (DeSousa, 2002). The industry is highly aware of issues concerning pest management, labor relations, technology advances and various other business related items. The people involved in this industry are a major contribution to its success. Therefore, it can be argued that the extension service, through its commitment to sharing resources and knowledge, should be a common link between the issues and the people.
6 Purpose and Objectives The main goal of the Extension service is to generate information through research and education, and ultimately pass this information on to the public. Agriculture Extension programs have been developed to supply hands-on knowledge that consumers can use immediately (Habeeb, Birkenholz, & Weston, 1987). Developing and delivering these Extension programs is challenging for agents and usually requires immense amounts of time and resources (Place, 2001). It has been established that effective program planning in the Extension service begins and ends with clientele satisfaction. Therefore, identifying target audiences and understanding their needs are essential to planning and maintaining a successful program. Therefore, the purpose of the current research was to determine why horticulture industry professionals participate in Extension programs and what would motivate those who do not attend to become more active Based on the above, the objectives of the study are as follows. •
To describe Florida commercial nursery professionals in terms of demographics and perceptions toward the Florida Cooperative Extension Service and its programming.
•
Utilizing the Theory of Planned Behavior framework, determine how differences in attitudes, subjective norms and perceived behavioral controls toward extension programming affect intent to participate. Past research studies utilizing the Theory of Planned Behavior model have
concluded that attitude and PBC correlate most strongly with behavioral intent, and subjective norm was the weakest predictor of intent (Ajzen, 1988; Beedell & Rehman, 2000; Eagly & Chaiken, 1993; Pouta & Rekola, 2001). Therefore, the study was designed to test the following null hypotheses.
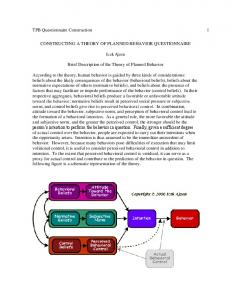
7 H1: No significant difference exists between attendees and non-attendees regarding possible motivational factors. H2: No significant difference exists for attendees and non-attendees regarding perceived level of knowledge about the Florida Cooperative Extension Service. H3: No significant difference exists for attendees and non-attendees regarding perceived level of knowledge about Institute of Food and Agricultural Sciences. H4a: No relationship exists between behavioral intention of horticulture professionals to attend Extension programs and the three determinant variables: attitude, subjective norm and perceived behavioral control. H4b: No relationship exists between behavioral intention of horticulture professionals to attend Extension programs and the three determinant variables: attitude, subjective norm and perceived behavioral, controlling for attendees and non-attendees. Theoretical Framework One theoretical framework that has been used to look at the constructs of attitude, subjective norms and perceived behavioral controls is Icek Ajzen’s Theory of Planned Behavior (TPB, see figure B-1). Developed in the late 1980s, the theory is an extension of Ajzen’s Theory of Reasoned Action (Fishbein and Ajzen, 1975). Intention to perform a particular behavior is the central factor of the theory (Ajzen, 1988; Eagly & Chaiken, 1993). The three independent determinants of intentions developed by Ajzen are attitude toward the behavior, subjective norms, and perceived behavioral control (PBC). According to Ajzen (2001), three sets of salient beliefs guide human behavior and create the determinants mentioned above. In the model, attitude refers to the individual’s positive or negative evaluation of performing a behavior, and is determined by beliefs
8 relating to the behavior (behavioral beliefs) and the evaluation of performing the behavior (outcome evaluations). Subjective norms are the individual’s perceptions of social pressures that exist pertaining to performance of the behavior (Ajzen, 1988; Eagly & Chaiken, 1993). This concept is comprised of beliefs about social expectations (normative beliefs) and the need to adhere to those expectations (motivation to comply). Perceived behavioral control is related to an individual's perception of how difficult the task will be to perform. According to Ajzen, PBC includes past experience and anticipated obstacles. PBC is based on beliefs about factors that are for or against performing the behavior and the perceived power of those factors (control belief strength and control belief power). Generally, the intention to perform a behavior is strong when performance of a particular behavior elicits a favorable attitude from the individual, the surrounding social environment is conducive to the behavior, and the individual feels confident of their ability to perform the behavior (Ajzen, 1988; Eagly & Chaiken, 1993). Another theory pertaining to adult participation in extension programs is the theory of adult learning or andragogy (Knowles, 1990). This theory is has six main assumptions regarding adult education. Knowles (1990) states that adults must have an understanding of why the new information is important and how it will affect them. Selfconcept is also a major factor for adults when they are approached with possible learning situations. Past learning experiences such as school create anxiety in the adult and may directly affect their desire to continue with the educational process (Knowles, 1990; Rogers, 2001). The level of experience an adult has pertaining to the educational
9 program also influences the success of the adult. This allows for adult educational sessions to be enriched with a more diverse group of people with different backgrounds and experience levels (Knowles, 1990). This factor must be taken into consideration because if past experience of the learner is not given due justice, then the educator risks insulting the self-identity of the adult learner (Knowles, 1990). The adult must also be ready to learn, meaning they are in need of the information at that point in time (Knowles, 1990). For example, no need exists for adults to attend an information session on greenhouse irrigation if they have no intention of building a greenhouse. When they make the decisions to build, then irrigation will become more important to them. This factor is similar to Knowles' (1990) orientation to learn, which states that adults need learning situations to be related to realistic situations. Adults want to be able to apply what they learn to something tangible in their lives. Finally, the last assumption of Knowles' andragogy theory is motivation. Both extrinsic and intrinsic motivation exists within adults, and Knowles (1990) states that intrinsic is the most important. Intrinsic motivation centers on the internal well-being of the individual and can serve to influence the participation in adult learning activities more than extrinsic motivational factors such as increased salary or bonus points (Knowles, 1990; Rogers, 2001). Increasing evidence exists that the theory of adult learning is serving as a foundation for adult educators when producing programs and is changing the organization of these programs (Knowles, 1990). An extensive amount of literature is available regarding the Theory of Planned Behavior (TPB) and its use in predicting behavior. Studies have been conducted using
10 the TPB in areas such as health (Sparks & Sheperd, 1992), leisure activities (Ajzen & Driver, 1992), education (Ingram, Cope, Harju, & Wuensch, 2000), and agriculture (Beedell & Rehman, 2000). As a consequence of the theory's extensive use, several metaanalyses have been performed to determine the validity of the theory and its constructs. For example, a 1998 study by Sutton sought to evaluate the effectiveness of the TRA/TPB models. He uses a series of other meta-analyses to gather data about the predictive power of the models regarding intention and behavior. In the study, he also made a distinction between prediction and explanation. Explanation is the process of identifying and specifying intention or behavior determinants. Models regarding explanation are causal in nature and can be represented graphically. For this reason, Sutton states that both TRA and TPB models are causal in nature. However, prediction does not require explanations. This means that if the exact reason for a behavior or process is not completely understood, a prediction can still be made. According to Sutton, targeted interventions are easer to make if a prediction is available. However, he stressed that understanding the reasoning behind an action is much more useful. Sutton’s conclusions, based on the findings of the research, indicated that the models explained between 40% and 50% of the variance in intention, and between 19% and 38% of the variance in behavior in the studies he analyzed. He concluded that the models’ performance depended on the comparison standard and he suggested nine reasons for poor predictions. These may be regarded as limitations in some research studies. These possible limitations were: (1) intentions may change, (2) intentions ma be provisional, (3) violation of the principal of compatibility, (4) violation of scale
11 correspondence, (5) unequal number of response categories for intentions and behavior, (6) random measurement error, (7) Restrictions of range or variance, (8) marginal distributions do not match, (9) intention not sufficient causes of behavior. Finally, Sutton recommended some strategies for further research using the models based on the nine reasons. Some suggestions were to include the role of memory, situational factors, and past behavior. A 2001 study of the efficacy of the TPB by Armitage and Conner used a “quantitative integration and review” of 161 published journal articles and book chapters utilizing the theory. Major findings include support for PBC as a determinant for intention. This analysis concluded that the correlation of PBC and intention accounted for 27% of the variance in predicting behavior. PBC was added to the original model and many studies have been conducted regarding its usefulness. Not only is PBC used to predict intention, but it also has a direct link with prediction of behavior (Ajzen, 1988; Eagly & Chaiken, 1993). It is important to remember that PBC refers to perceived control, not actual control. Actual control takes into account actual factors of available resources and opportunity, whereas perceived control is only the perception of ability to perform a behavior (Ajzen, 1988; Eagly & Chaiken, 1993). The analysis found supporting evidence for the use of attitude and subjective norms in the models as well. However, subjective norm was determined to be the weakest predictor of intention. Other literature suggests the same finding (Pouta & Rekola, 2001; Sparks & Shepherd, 1992). Armitage and Connor offer the suggestion that measurement error was the cause of the weak predictive power of subjective norms. Use of "multi-item" scales verses "single-item" scales could be more reliable for measuring this construct. Overall,
12 the model was successful for predicting intention and behavior. The analysis also supported Ajzen’s theory that PBC independently contributes to the prediction of intention and behavior.
CHAPTER 2 LITERATURE REVIEW A broad base of literature is available regarding the Cooperative Extension Service, the Theory of Planned Behavior, and adult participation in educational programs. This review is organized conceptually based on these factors. First, literature pertaining to Extension participation studies will be presented. These are articles that attempt to explain why adults may or may not participate in educational programs. They offer suggestions to professionals in the industry about successful marketing and retention of clientele. This information also suggests reasons for effective or non-effective Extension programs and indicates clientele perceptions of the extension service. Last, a review of agriculturally-based items that specifically utilize the TPB. This is important to understand the success of the theory when predicting farmers’ behavior. Norland (1992) synthesized information from various sources and a 1987 study of Ohio Cooperative Extension Service clientele. She sought to answer some of the questions that plague Extension personnel on a daily basis. Why do adults participate? What barriers exist to participating? Why do some adults drop out of programs or stop attending? She cited Johnstone and Riveria (1965) when referring to situational barriers, institutional barriers, sociodemographic barriers, and dispositional factors that describe adult participation. Norland cited a 1987 Ohio study as her main source of information and made conclusions based on the results. The survey studied Extension clientele who
13
14 had previously been involved in Extension programs. Questionnaires were sent to 599 individuals with a final response number of 276. They did a principal-component factor analysis of the results and discovered five main factors related to participation: low anticipated difficulties with arrangements, high commitment to Extension organization, anticipated positive social involvement, anticipated high quality of information, and possession of high internal motivation to learn. The implications of the study were that people participate in Extension programs based on what they know about extension and what learning opportunity is available for them from the program. Therefore, the image of Extension as perceived by potential or existing clients is important and can be used as a marketing tool for recruitment. Opportunity for social interaction among clientele and convenience of the programs were also major factors of participation. Dollisso and Martin (1999) determined that young farmers are both intrinsically and extrinsically motivated to participate in educational programs. They mailed a questionnaire to 148 members of the Iowa Young Farmers Educational Association (IYFEA) to determine their perceptions toward learning, preferred learning methods, participation motivators, and barriers of participation. Major findings focused on the idea that adults desire a sense of choice. The young farmers preferred hands-on activities and individual projects. Economic sustainability was a motivator for most farmers to participate. The study indicated that farmers’ participation might increase as a result of their inclusion in the planning process. The authors inferred that researchers and teachers could use this information to better prepare programs for their audiences. The authors recommended that program planners focus on profitability and new technology when
15 targeting this audience. Current information and practicality of the subject matter were also important tips for planners. They also recommended that larger populations, including non-farmers and agribusinesses, be studied using various methods for comparability and reliability purposes. A previous study of IYFEA by Martin and Omer (1987) sought to determine their use of various agriculture agencies, especially the agriculture extension service. Their main purpose was to discover awareness and participation factors. They mailed surveys to approximately 75 people, and had a final response rate of 68% (51 respondents). The extension service awareness and satisfaction levels were high among the young farmers. The indicated an interest in programs that focused on marketing, record keeping, and management techniques. The authors determined that understanding the characteristics of participation and profiles of the audience were important factors in program planning. They also concluded that involvement of the young farmers in the planning process was needed. The process would begin with the clientele input, guiding the direction of the program to meet their needs. Alson and Reding (1998) conducted a study to determine what factors were associated with adoption and educational techniques of the integrated pest management program in Utah. Two hundred sixty two fruit tree growers and 1,700 field crop producers in Utah received questionnaires. Results indicated that both groups preferred the Extension service (agent and/or office) for information regarding pest management practices. Other growers and trained employees were also important sources of information. The publications and workshops provided by the extension service were the
16 preferred information sources. Computer access was on the list of least preferred sources for pest management facts. Growers whose major source of income was their farm placed more emphasis on the use of Extension services and recommendations than those whose farm was not their primary employment. The conclusion was that in order to reach these grower audiences with information about IPM programs, grower backgrounds, perceptions, practices and preferences should be given extreme consideration. Ford (1995) assessed the educational priorities of small farmers in West Tennessee. Specifically, the study was designed to determine the preferred delivery methods, programs, and program activities of their Extension service. Descriptive research methods were used to survey a sample of 150 small farmers who made less than $20,000 in gross income from farm sales. Farmers rated their feelings on a one-99 scale, with individual values given to no importance, little importance, etc. Farm visits were used to gather data because extension agents in the area indicated that response rates with mailed questionnaires were historically very low with the small farmers. A final response rate of 72% was achieved with this method. The author discovered that crop marketing, soil conservation, and pesticide use were areas that needed more emphasis from educational programs. The small farmer also expressed an interest in the use of extension agents for one-on-one help with solving various problems. Recommendations were made regarding the development of programs that would focus on technical and business related skills, especially marketing. A 1987 study by Habeeb, Birkenholz, and Weston sought to determine the perceptions of county extension officers and extension clientele toward the Missouri Extension service. Four hundred farmers with some extension background and
17 prominence in the community, and 150 extension officers were stratified by counties and then selected randomly. A 43-item questionnaire was used to determine their level of extension knowledge and opinions. Significant differences were found between officers and clientele perceptions of extension information and extension specialists. Amount of extension contact, attendance of extension meetings, and innovativeness level of the respondent explained some of the variability associated with the differing opinions. Overall, extension information, specialists, methods, and programs were considered satisfactory. The higher the level of contact with the extension service and agents, the higher the satisfaction ratings of the extension service tended to be. The recommendations of the authors included planning and conducting meetings for a larger target audience, and increasing the amount of clientele/agent contact. With respect to adoption behavior of extension clientele and the general public, Pouta and Rekola (2001) tested the TPB model for predicting the “willingness to pay [WTP] for abatement of forest regeneration”. They used survey research methods to gather data for the contingent valuation (CV) study of 600 people in Loppi, Finland. Two rounds of surveys were administered—one concerned forest recreation and respondent background, and the other focused on WTP measures and regeneration attitudes. One important aspect of the study was that it focused on predicting WTP responses using the attitudes, subjective norms, and perceived behavioral controls of the respondents. Two attitudes were used—attitude toward forest regeneration and attitude toward supporting the abatement policy. The results indicated that the use of both attitude variables explained WTP significantly. PBC contributed significantly to the
18 prediction of WTP, suggesting that respondents fully understood their personal limitations. Subjective norms were not significant. Beedell and Rehman (2000) studied farmers’ conservation behavior by using the TPB model. One hundred twenty five farmers in Bedforshire, England participated in the study and were divided into three groups: farmer, FWAG farmers, and conservationist (FWAG: Farming and Wildlife Awareness Group). The authors added moral obligation to the model because respondents indicated an obligation to the land and this obligation affects business decisions. Six behaviors were studied: hedge management, field margin management, tree planting management, hedge removal, hedge planting, and pesticide use. FWAG farmers viewed these behaviors more importantly than farmers. Hedge removal was not regarded as good because it is an “anti-conservation” practice. FWAG farmers felt a stronger moral obligation than farmers, suggesting that farmers have an internal obligation to the land and the FWAG farmers feel both social pressures and internal motivation to conserve. The two groups also behaved differently regarding managing field margins. However, the authors explained that the definition of a “good” field margin might differ among groups. They suggest further research in that particular area. Results of the study showed that FWAG farmers were more aware of conservation concerns than non-member farmers. FWAG farmers were more concerned with environment issues than business issues regarding farming behavior. From these results, the authors concluded that the TPB model was an acceptable tool for predicting farmer behaviors.
19 Based on the review of literature, understanding audience profiles and characteristics are an important aspect to program planning in Extension. Clientele are interested in learning about practical, current information that is relevant to their interests and will attend programs based on this information. Regarding the prediction of particular behaviors, the TPB model has been successful in many different fields of study, including agriculture. Therefore, utilizing the TPB model to predict attendance at horticulture-based Extension programs is a logical step toward improved program planning.
CHAPTER 3 METHODOLOGY This study utilized the Theory of Planned Behavior as a model for determining the intention of nursery industry professionals in Florida to attend Florida Cooperative Extension Service programs. This behavior is under investigation for several reasons. Mainly, Extension agents in Florida have expressed a need to understand what motivates nursery professionals to attend programs that are targeted specifically for them. The TPB was used because it has been widely accepted as a framework for predicting and attempting to understanding specific behaviors. Subjects The population for the current study was horticulture industry professionals in Florida, which included the wholesale, retail, landscape and allied trade industries. To conduct the study, two mailing lists were obtained and combined. One was from the Florida Nurserymen and Growers Association (N=2700), and the other was from a Commercial Horticulture Extension agent in Central Florida (N=300). Because the entire group of professionals, (N=3000), was utilized, it is known as a purposive sample. Research Design The basic design of this study is known as ex post facto research. In Latin, ex post facto means “after the fact” and is conducted once the variable of interest has already been altered or changed in some fashion (Ary, Jacobs, and Razavieh, 2002).The purpose of this method is to determine cause and effect relationships among independent variable,
20
21 which is why this design is sometimes referred to as causal comparative research. One of the main reasons this method is used is when the research does not allow for manipulation of variables, as is the case with a true experiment. Instead of exposing a group of people to different treatments, ex post facto research begins with the group having already been exposed and attempts to determine what differences exist and why. In the present study, nursery industry professionals were examined to determine what factors strongly influence their attendance at horticulture based Extension programs. Pilot Study The Theory of Planned Behavior model is based on beliefs about a particular behavior. Behavioral beliefs lead to the formation of attitudes. Normative beliefs lead to an understanding of the perceived level of social pressure that exists about a behavior, and control beliefs about the behavior lead to overall perceived behavioral control. These beliefs can be measure directly (direct measures) and indirectly (belief-based measures). In order to identify the salient beliefs of horticulture industry professionals, a series of pilot studies was conducted at various Extension programs in Central Florida. Participants were asked a range of closed- and open-ended questions that addressed various aspects of the Extension programs they attend or would like to attend. A list of the most common beliefs were constructed and used to create the final questionnaire. A panel of 10 experts examined and approved the final questionnaire. Procedure In order to attempt to achieve a good response rate with a high-quality mailed survey, Dillman (2000) suggests the Total Design Method (TDM). Basically, the TDM
22 focuses on creating a user friendly survey environment that “increases perceived rewards for responding, decreases perceived costs and promotes trust in beneficial outcomes from the survey (Dillman, 2000).” It is based on multiple personalized contacts with the participants, also known as waves. This method has been proven to increase response rates when compared to traditional mail surveys (Dillman, 2000). The five main elements of the TDM include a respondent-friendly questionnaire, up to five contacts with the participants, stamped return envelopes, personalized correspondence and a financial incentive (Dillman, 2000). The current study involved sending a packet containing a cover letter, a 62-item questionnaire and a business reply envelope to the nursery professionals in Florida (N=3000). The second wave was a reminder post card sent to all participants. No financial incentive was offered. On November 8, 2002, the packets were mailed to all 3000 professionals. A reminder post-card was mailed six weeks later. By February 12, 411 surveys had been returned for a response rate of 14% (N=411). The majority of those responses, 75% (N=308), had been returned by the end of November. Considering that the response rate was low, a comparison of early to late respondents was conducted for validity reasons. According to Ary, Jacobs and Razavieh (2002) nonrespondents and late respondents are usually similar. Therefore, the two respondent groups were created. The 411 respondents were divided into four quartiles for the purpose of comparing the first quartile (early respondents) to the fourth quartile (late respondents). The two groups were compared via an independent sample t-test based on the following variables: attitude, subjective norms, perceived behavioral control and
23 intent. With an alpha level of .05, none of the differences were significant, and it was concluded that late respondents were similar to the nonrespondents. Table 3-1 displays the results. Table 3-1: Independent Samples Test for Early Respondents vs Late Respondents Variable N Mean t Attitude Early respondents 98 4.91 1.21* Late respondents 109 4.78 Subjective Norm Early respondents 96 3.09 .910* Late respondents 107 2.10 PBC Early respondents 96 4.30 .389* Late respondents 108 4.27 Intent Early respondents 94 4.18 .951* Late respondents 103 4.18 *p > .05 Instrumentation The Theory of Planned Behavior served as the theoretical framework of this study as well as supplying the basic model for the questionnaire and interpretation of the results. The 62-item instrument utilized in this research elicited responses, directly and indirectly, based on the constructs of the model, as well as several factors outside the model used for profiling the industry. Thirty-five questions were directly based on the theory and were used to create indices of each construct. Answers were given using a 5point Likert scale where responses ranged from 1=Strongly Agree to 5=Strongly Disagree. Attitude was measured directly using a 7-point semantic differential scale comprised of six items. Table 3-2 provides an example. Two attitudinal variables were
24 measured: the attitude toward attending extension programs related to the horticulture industry, and the attitude toward the Florida Cooperative Extension Service. Table 3-2: Attitude Scale Item (Direct Measure) My attitude toward attending extension programs is Favorable:____:____:____:____:____:____:____:Unfavorable Useful:____:____:____:____:____:____:____:Useless Good:____:____:____:____:____:____:____:Bad Pleasant:____:____:____:____:____:____:____:Unpleasant Reliable:____:____:____:____:____:____:____:Unreliable Valuable:____:____:____:____:____:____:____:Worthless
Attitude was also measured indirectly based on the behavioral beliefs and outcome evaluations of the respondents (belief-based measures). According to Ajzen (2001), these beliefs and evaluations impart important information regarding an individual’s decision to behave in a particular manner. Seven behavioral belief questions and five outcome evaluation questions were constructed. Table 3-3 presents an example. Table 3-3: Behavioral Belief Scale Items Extension programs offer up-to-date information on the horticulture industry.¹ Strongly Agree 1 2 3 4 5 Strongly Disagree Keeping up-to-date on the horticulture industry is important to me.² Strongly Agree 1 2 3 4 5 ¹Behavioral Belief ²Outcome Evaluation
Strongly Disagree
To construct the belief-based measures index for attitude, the beliefs were multiplied by the outcomes as shown in the following equation. AB % 3 bi ei
25 Subjective norms were also measured directly and indirectly. The questions were used to determine the respondent’s perception of social pressure regarding attendance at Extension programs. Two questions elicited the direct measure for subjective norms, and eight normative belief- and motivation to comply-type questions were used to create an index for indirect measuring. Example questions for subjective norm are in Table 3-4 and, the equation for creating the index based on multiplying normative beliefs strengths and motivation is: SN % 3 ni mi Table 3-4: Subjective Norm Scale Items It is expected of me to attend as many extension programs as I can that are about horticulture issues.¹ Strongly Agree 1 2 3 4 5 Strongly Disagree The opinions of horticulture professionals in my industry are important to me.² Strongly Agree 1 2 3 4 5 Strongly Disagree Generally speaking, I do what other horticulture industry professionals think I should do regarding attendance at extension programs.³ Strongly Agree 1 2 3 4 5 Strongly Disagree ¹Direct measure ²Normative belief ³Motivation to comply Perceived behavioral control was also measured directly and indirectly. Seven questions were designed to create the index for perceived behavioral control, measuring the respondent’s evaluation of how easy or difficulty it would be to attend extension programs. Example questions for PBC are in Table 3-5, and the equation for constructing the PBC index is: PBC % 3 ci pi
26 Table 3-5: PBC Scale Items It is mostly up to me whether or not I attend extension programs relating to the horticulture industry.¹ Strongly Agree 1 2 3 4 5 Strongly Disagree If I wanted to, I could attend an extension program relating to the horticulture industry.² Strongly Agree 1 2 3 4 5 Strongly Disagree I feel in complete control over whether I attend an extension program relating to the horticulture industry.³ Strongly Agree 1 2 3 4 5 Strongly Disagree ¹Direct measure ²Control Belief Strength ³Control Belief Power Also on the survey were several questions designed to determine what would motivate horticulture industry professionals to attend more Extension programs. Two open-ended questions and five questions using the Likert scale were created for this purpose. An example of each of these questions is in Table 3-6. Table 3-6: Motivation If I knew that I could learn about employee management techniques, I would be more likely to attend extension programs. Strongly Agree 1 2 3 4 5 Strongly Disagree The biggest problems facing the horticulture industry are…¹ ¹open-ended question Two questions asked the respondents’ perceived level of knowledge about the Florida Cooperative Extension Service and the Institute of Food and Agricultural Sciences (IFAS) and are displayed in Table 3-7. Table 3-7: Perceived Level of Knowledge My knowledge of the Florida Cooperative Extension service is: Extremely High:____:____:____:____:____:____:____:Extremely Low My knowledge of the Institute of Food and Agricultural Sciences (IFAS) is: Extremely High:____:____:____:____:____:____:____:Extremely Low
27 Finally, behavioral intent was measured directly via four questions on the instrument. Ajzen (1988) states that behavioral intention of an individual is comprised of the motivational factors involved in making the decision to engage in the behavior. Basically, intention is an indicator of the individuals’ willingness to attempt the behavior. If the individuals state their intent to perform the behavior, they can be relied upon to do so (Ajzen, 1988). Therefore, we should be able to accurately predict behavior by determining intentions. Two examples are shown in Table 3-8. Table 3-8: Behavioral Intent Scale Items I intend to attend extension programs relating to the horticultural industry within the next year. Strongly Agree 1 2 3 4 5 Strongly Disagree I will try to attend extension programs relating to the horticultural industry within the next year. Strongly Agree 1 2 3 4 5 Strongly Disagree Data Interpretation The questionnaire was initially written with higher numbers representing lower evaluations of the questions (i.e. Strongly Agree=1 to Strongly Disagree=5). Therefore, the data was recoded in the Statistical Package for Social Science (SPSS) in order to have higher numbers represent higher evaluations of the items (i.e. Strongly Agree=5 to Strongly Disagree=1). Reliability To measure the internal consistency of the items prior to creating the indices for each construct, Cronbach alpha coefficients were determined. Cronbach alpha is used when items are scaled and the scores can be a range of values, as is the case with Likert scales and semantic differential scales (Ary, Jacobs and Razavieh, 2002). Alphas in the
28 range of .50 to .60 are acceptable when making decisions regarding groups of people for research purposes (Ary, Jacobs and Razavieh, 2002). Cronbach alphas are listed in Tables 3-9 through 3-18 Table 3-9: Cronbach Alpha Reliability Coefficients: Behavioral Beliefs Item Mean Standard Corrected itemDeviation total correlation Belief 1 4.27 .71 .72 Belief 2 4.04 .83 .64 Belief 3 4.31 .87 .54 Belief 4 4.28 .75 .65 Belief 5 3.51 .90 .45 Belief 6 4.43 .69 .52 Belief 7 4.32 .88 .51 Behavioral Belief Scale Alpha = .83
Alpha if item deleted .78 .79 .81 .80 .82 .80 .81
Table 3-10: Cronbach Alpha Reliability Coefficients: Outcome Evaluations Item Mean Standard Corrected itemAlpha if item Deviation total correlation deleted OE 1 4.47 .59 .65 .68 OE 2 4.54 .56 .66 .67 OE 3 4.42 .74 .65 .66 OE 4 4.27 .77 .52 .70 OE 5 3.88 1.11 .33 .83 Outcome Evaluation Scale Alpha = .75 Table 3-11: Cronbach Alpha Reliability Coefficients: Attitude (direct measure)* Item Mean Standard Corrected itemAlpha if item Deviation total correlation deleted Attitude 1 6.22 1.12 .88 .95 Attitude 2 6.17 1.10 .89 .95 Attitude 3 6.24 1.00 .93 .95 Attitude 4 6.10 1.10 .82 .96 Attitude 5 6.08 1.12 .88 .96 Attitude 6 6.10 1.15 .89 .95 Attitude Scale Alpha = .96 *measured on 7-point scale
Table 3-12: Cronbach Alpha Reliability Coefficients: Normative Beliefs Item Mean Standard Corrected itemDeviation total correlation Norm 1 3.45 .94 .59 Norm 2 3.28 1.01 .67 Norm 3 2.88 1.03 .51
Alpha if item deleted .68 .57 .76
29 Table 3-12. Continued Normative Belief Scale Alpha = .78 Table 3-13: Cronbach Alpha Reliability Coefficients: Motivation to Comply Item Mean Standard Corrected itemAlpha if item Deviation total correlation deleted MC 1 2.31 1.05 .73 .78 MC 2 2.40 1.02 .76 .74 MC 3 2.23 .99 .66 .84 Motivation to Comply Scale Alpha = .85 Table 3-14: Cronbach Alpha Reliability Coefficients: Subjective Norm (direct measure) Item
Mean
Standard Deviation
SN 1 SN 2
3.84 3.59
.92 1.03
Corrected itemtotal correlation .47 .47
Alpha if item deleted . .
Subjective Norm Scale Alpha = .64 Table 3-15: Cronbach Alpha Reliability Coefficients: Control Belief Strength Item Mean Standard Corrected itemAlpha if item Deviation total correlation deleted Strength 1 4.37 .71 .57 . Strength 2 4.47 .68 .57 . Control Belief Strength Scale Alpha = .72 Table 3-16: Cronbach Alpha Reliability Coefficients: Control Belief Power Item Mean Standard Corrected itemAlpha if item Deviation total correlation deleted Power 1 4.29 .85 .56 . Power 2 4.35 .68 .56 . Control Belief Power Scale Alpha = .71 Table 3-17: Cronbach Alpha Reliability Coefficients: Perceived Behavioral Control (direct measure) Item Mean Standard Corrected itemAlpha if item Deviation total correlation deleted PBC 1 4.02 1.08 .49 . PBC 2 4.31 .73 .49 . PBC Scale Alpha = .62 Table 3-18: Cronbach Alpha Reliability Coefficients: Intent Item Mean Standard Corrected itemDeviation total correlation Intent 1 4.26 .87 .78 Intent 2 4.21 .86 .82
Alpha if item deleted .82 .81
30 Table 3-18. Contintued Intent 3 Intent 4
4.07 .96 .66 4.27 .75 .70 Behavioral Intent Scale Alpha = .88
.88 .86
An overall descriptive analysis revealed the means for each of the constructs based on the averages of each of their respective measures. The results can be found in Table 3-19. Table 3-19: Descriptive Statistics: TPB Model Constructs Variable N Mean Attitude 402 4.85 Subjective Norm 394 3.03 PBC 395 4.30 Intent 385 4.18
SD .65 .71 .58 .72
In addition, the descriptive analysis of each of the TPB constructs was conducted on attendees and non-attendees. Table 3-20 displays the results. Table 3-20: Descriptive Statistics: TPB Model Constructs: Attendees/Non-attendees Variable N Mean Attitude Attendee 321 4.97 Non-attendee 72 4.41 Subjective Norm Attendee 320 3.10 Non-attendee 73 2.75 PBC Attendee 320 4.37 Non-attendee 74 3.99 Intent Attendee 312 4.30 Non-attendee 72 4.18 Pearson product moment correlations between each of the variables for the entire sample indicated significant relationships with behavioral intention at the .05 alpha level. In addition, significant relationships were observed among each of the variables. The results can be found in Table 3-21.
31 Table 3-21: Pearson Correlations between the TPB Model Constructs Variable 1. Attitude 2. Subjective Norm 3. PBC 4. Intent
1 --.463* .393* .686*
2
3
4
--.150* .403*
--.393*
---
*p < .01
Hypotheses Based on the objectives of this study, the following hypotheses were developed. H1: No significant difference exists between attendees and non-attendees regarding possible motivational factors. H2: No significant difference exists for attendees and non-attendees regarding perceived level of knowledge about the Florida Cooperative Extension Service. H3: No significant difference exists for attendees and non-attendees regarding perceived level of knowledge about Institute of Food and Agricultural Sciences. H4a: No relationship exists between behavioral intention of horticulture professionals to attend Extension programs and the three determinant variables: attitude, subjective norm and perceived behavioral control. H4b: No relationship exists between behavioral intention of horticulture professionals to attend Extension programs and the three determinant variables: attitude, subjective norm and perceived behavioral, controlling for attendees and non-attendees. Data Analysis The following data analyses were conducted using SPSS. •
Frequencies and Cross-tabulations were used to gain an understanding of the demographics of the respondents.
•
Correlational analyses using the Pearson product moment correlation coefficient were conducted to determine the strengths and directions of relationships between variables.
32 •
Multiple linear regression was used to examine the amount of variation in the dependent variable that was explained by the independent variables.
•
Analysis of variance was used to compare the differences in means of the independent variables on the dependent variable.
CHAPTER 4 RESULTS The purpose of this study was to determine what factors affected the behavioral intent of a sample of horticulture industry professionals to participate in Extension programs. The Theory of Planned Behavior was chosen as the theoretical framework and basic model for this study because it has been shown to aid in the prediction and understanding of how people behave (Ajzen, 1988). When applying the model to this study, behavioral beliefs about Extension programs relating to the horticulture industry create a particular attitude toward attending these programs. Normative beliefs regarding the social pressure to attend these programs create an individual’s subjective norm. Control beliefs about the ability to attend these programs indicate the perceived behavioral control of the individual (Ajzen, 1988). All of these variables combined were utilized to provide an explanation of the intentions of a sample of horticulture industry professionals to attend Extension programs targeted for them. Descriptive Information One of the main objectives of this research was to gather demographic profiling information on the horticulture industry in Florida. The instrument contained 12 questions used for this purpose. As to demographics, the majority, 76% (N=313), of the respondents were male and 19% (N= 79) were female. Regarding position of the respondents in the business, 61% (N=254) were owners, 16% (N=66) were managers and 3% (N=11) said they were both. To assess possible differences between men and women,
33
34 a cross-tabulation was created and revealed that 68% (N=209) of the male respondents were owners and 16% (N=51) were managers, while 50% (N=38) of the women respondents were owners and 18% (N=14) were managers. Nineteen business positions were stated other than the five offered on the survey. Answers included representatives of the education field, parks and recreations department, as well as combinations of positions such as owner/manager/sales or sales/support staff. When respondents were asked if they attended Extension programs relating to the horticulture industry, 78% (N= 321) answered yes and 21% (N=86) said no. Twentynine percent (N=120) stated that they attended the programs themselves, 3% (N=15) sent employees and 31% (N=130) stated that they attended the programs with their employees. Forty-three percent (N=178) of the respondents were in wholesale production and 25% (N=105) classified themselves in the landscape industry. Twopercent (N=10) of the respondents said they were in allied trade, and 4% (N=18) stated they had a retail nursery operation. Twenty-one other business categories were represented ranging from golf courses to municipalities. Overall, 44% (N=183) of the respondents had average annual sales over $500,000, and 12% (N=50) had sales in the $250,000-$499,000 range. To determine if differences existed between attendees and non-attendees regarding annual sales, a crosstabulation was created. Of those who attend, 58% (N=155) have average annual sales over $500,000, while 36% (N=27) of those who do not attend have average annual sales over $500,000. This cross-tabulation between attendees and non-attendees regarding average annual sales also indicated that 85.3% (N=155) of the respondents indicating sales above $500,000 attend programs, while 14.8% (N=27) do not. The respondent
35 group with the next highest level of attendance had average sales between $50,000 and $149,999. Of this group, 80% (N=32) attended programs and 20% (N=8) did not. Results are displayed in Table 4-1. Table 4-1: Cross-tabulation: Attendance/Sales $0 $20,000 $50,000 $19,999 $49,999 $149,999 Attend Yes No Total
$150,000 $249,999
$250-000 $499,999
$500,000 +
15 (62.5%)
10 (52.6%)
32 (80%)
16 (59.3%)
39 (78%)
155 (85.2%)
9 (37.5%)
9 (47.4%)
8 (20%)
11 (40.7%)
11 (14.6%)
27 (14.8%)
24
19
40
27
50
182
When asked about production systems, container production was the primary answer, 58% (N=239), and field production was the least chosen system, 38% (N=156). To determine the differences among attendees and non-attendees, a cross-tabulation was conducted. It revealed that, of those who attend, 55% (N=140) use greenhouses, 61% (N= 159) use shadehouses, 52% (N=124) use field production and 69% (N=188) use container production. Of those who do not attend programs, 46% (N=30) use greenhouses, 46% (N=31) use shadehouses, 49% (N=32) use field production, and 66% (N=50) use container production. Table 4-2 displays the results. Table 4-2: Cross-tabulation: Attendance/Production System Production System used Attend Yes Container 188 (69%) Shadehouse 159 (61%) Greenhouse 140 (55%) Field 124 (52%)
No 50 (66%) 31 (46%) 30 (46%) 32 (49%)
Furthermore, cross-tabulations revealed that of the respondents who utilize container production (N=238), 79% (N=188) attend programs and 21% (N=50) do not.
36 Of those respondents who stated they used greenhouses (N=170), 82% (N=140) attend programs and 18% (N=30) do not. Eighty-three percent (N=159) of the 190 respondents who utilize shadehouses attend programs, while 16% (N=31) do not. For the respondents who use field production (N=156), 79% (N=124) attend programs and 21% (N=32) do not. These results indicate that horticulture professionals who utilize greenhouse production systems and container production systems might be a large target audience for the Commercial Horticulture Extension Agents. Another aspect of this study was to determine various motivating factors that might influence the participation level of horticulture professionals at Extension programs. Five questions were designed using a 5-item Likert scale ranging from Strongly Disagree (1) to Strongly Agree (5). An example of one of the questions was “If I could learn about business management techniques, I would be more likely to attend Extension programs.” Overall, of the five questions, results indicated that learning about the programs at least one month in advance would be a possible motivational factor (M=4.08). Another important factor to respondents was learning about the latest pesticides, herbicides and fungicides available on the market (M=4.09). Table 4-3 displays the results. Table 4-3: Motivation to attend Extension programs Question Learn about latest pesticides, herbicides and fungicides Learn about programs at least one month in advance Learn about employee management techniques Learn about business management techniques Receive CEUs
N 384 389 379 382 379
Mean 4.09 4.08 3.75 3.71 3.55
SD .85 .83 .96 1 1.07
In addition to the general demographic information, descriptive statistics were obtained for the direct and belief-based measures of attitude. These analyses were
37 conducted on attendees and non-attendees to further understand some of the differences that exist among the two groups. Attitude toward attending Extension programs was measured directly using a 7point semantic differential scale comprised of six items, with higher values representing positive attitudes and lower values representing negative attitudes. Results indicated that attendees had a higher mean attitude (M=6.31) than non-attendees (M=5.46). This suggests that respondents who attend horticulture-based Extension programs had a more positive attitude toward attending those programs than respondents who do not attend. Results are shown in Table 4-4. In addition to the direct measure of attitude toward attendance, the belief-based measures were also analyzed. The behavioral beliefs of the sample of horticulture professionals as well as their evaluation of those beliefs (outcome evaluations) were measured using a 5-point Likert scale ranging from Strongly Agree (5) to Strongly Disagree (1). For attendees, the mean for behavioral beliefs was 4.27, and the mean for non-attendees was 3.73. The means for the outcome evaluations were also higher for attendees (M=4.39) than for non-attendees (M=4.04). These results support the conclusion that respondents who attend Extension programs have more positive beliefs about Extension than non-attendees. Results are displayed in Table 4-4. Table 4-4: Descriptive Statistics: Direct/Belief-Based Attitude Measures Measure N Mean Attitude (direct)* Attend 313 6.31 Not attend 73 5.46 Behavioral Beliefs Attend 320 4.26 Not attend 77 3.73 Outcome Evaluations Attend 319 4.39
SD .83 1.45 .47 .74 .50
38 Table 4-4. Continued Not attend
73
4.04
.67
*measured on a 7-point scale
Examples of the behavioral beliefs that were analyzed and their means for each group (attendee/non-attendee) are displayed in Table 4-5. This analysis revealed that attendees agreed with the following two statements more than non-attendees: (1) Extension programs offer up-to-date information; (2) Extension programs offer an opportunity to increase their knowledge of new products on the market more than nonattendees. Attendees also strongly agreed that Extension programs offer an opportunity to obtain CEUs. Furthermore, non-attendees agreed more than attendees with the following two statements: (1) Horticulture professionals do not benefit from participating in Extension programs; (2) Extension programs are not an effective way to spread information to the horticulture industry. Table 4-5: Descriptive Statistics: Belief-Based Attitude Measures: Attendees/Nonattendees Belief N Mean Extension programs offer opportunity to obtain CEUs Attendee 295 4.56 Non-attendee 67 3.94 Extension programs offer up-to-date information Attendee 293 4.39 Non-attendee 70 3.75 Extension programs offer an opportunity to increase knowledge of latest chemicals Attendee 294 4.37 Non-attendee 67 3.83 Extension programs offer an opportunity to increase knowledge of products on the market Attendee 294 4.09 Non-attendee 69 3.73 Extension programs provide information about business management techniques
39 Table 4-5. Continued Attendee 291 3.49 Non-attendee 68 3.37 Horticulture professionals do not benefit from participating Attendee 292 1.53 Non-attendee 67 2.36 Extension programs are not an effective way to spread information to the horticulture industry Attendee 294 1.55 Non-attendee 68 2.26 Testing the Hypotheses The current study was designed to determine how the attitudes, subjective norms and perceived behavioral control of horticulture industry professionals in Florida affect their intent to attend Cooperative Extension Service programs. The TPB model constructs as well as motivational factors and perceived knowledge were analyzed separately for respondents who attend programs and for those who do not attend programs. Therefore, this section is organized in the following manner. To understand some of the differences between attendees and non-attendees, the first three hypotheses concerning motivation and knowledge were analyzed. Then, to determine the influence of attitude, subjective norm and PBC on the behavioral intent of this sample of horticulture professionals, the final two hypotheses were tested. H1: No significant difference exists between attendees and non-attendees regarding possible motivational factors. To determine if a difference existed between attendees and non-attendees, an independent samples t-test was conducted with regard the five motivational questions. At the alpha level of .05, the means for all five questions differed significantly among the
40 two groups. The null hypothesis was rejected. The means for attendees were consistently higher than the means of non-attendees. Learning about the latest pesticides, herbicides and fungicides (chemicals) was the most important factor for respondents who attend programs (Chemicals, M=4.19). The second factor that was important to attendees was learning about the programs at least one month in advance (Time, M=4.18). For respondents who do not attend programs, chemicals and time were also the factors with the highest means. However, time had a slightly higher mean (Time, M=3.70) than chemicals (Chemicals, M=3.68). For both attendees and non-attendees, the questing regarding CEU availability received the lowest means (attendees, M=3.68; non-attendees, M=3.00). These results indicate that chemical update programs are important to horticulture professionals. Timely promotion of programs dealing with pesticides, fungicides and herbicides might increase attendance levels at these programs. The results can be found in Table 4-6. Table 4-6: Independent Samples Test: Attendees/Non-attendees Question N Mean SD Chemicals Attend 311 4.19 .78 Not attend 72 3.68 .97 Time Attend 314 4.18 .74 Not attend 74 3.70 1.05 Employee Mgmt Attend 306 3.84 .90 Not attend 72 3.39 1.10 Business Mgmt Attend 310 3.77 .96 Not attend 71 3.48 1.13 CEU Attend 308 3.68 1.02 Not attend 70 3.00 1.11 *Significant at the 0.05 level
t -4.71* -4.51* -3.65* -2.24* -4.93*
41 H2: No significant difference exists for attendees and non-attendees regarding perceived level of knowledge about the Florida Cooperative Extension Service. H3: No significant difference exists for attendees and non-attendees regarding perceived level of knowledge about the Institute of Food and Agricultural Sciences. Two questions on the survey were designed to gather information regarding the perceived level of knowledge that respondents believe they have about the Florida Cooperative Extension Service and the Institute of Food and Agricultural Sciences. The 7-item semantic differential scale ranged from extremely low (1) to extremely high (7). Overall, the mean knowledge level for the Extension service was 5.08 with a standard deviation of 1.5 (N=396). The mean level for IFAS was 4.40 with standard deviation of 1.8 (N=393). To analyze these hypotheses, an examination of the differences between attendees and non-attendees was conducted. An independent samples t-test revealed a significant difference in means between attendees and non attendees with regard to the perceived level of knowledge about the Extension service (t= -8.86; p=.000) and perceived level of knowledge of IFAS (t= -5.63; p=.000). The null hypotheses were rejected. Those who attended Extension programs had higher perceived knowledge levels about both the Extension service and IFAS than those who did not attend programs. This indicates that Extension programs might be successful at relaying information about other services provided by the Cooperative Extension Service, but may not be helping horticulture professionals make the connection between Extension and IFAS. The results are displayed in Table 4-7.
42 Table 4-7: Independent Samples Test: Knowledge/Attendance Variable N Mean Knowledge of Extension Attend 316 5.40 Not attend 79 3.87 Knowledge of IFAS Attend 315 4.66 Not attend 77 3.39
SD
t
1.2 1.9
8.86*
1.7 1.9
5.63*
*Significant at the 0.05 level
H4a: No relationship exists between behavioral intention of horticulture professionals to attend Extension programs and the three determinant variables: attitude, subjective norm and perceived behavioral control. To test the hypothesis, a multiple linear regression analysis using the TPB variables in the enter method was performed. The regression was significant (F=145.57; p