shop system in all pcrform,mcc measures employed in this study, The simulation results and the ..... hybrid group technology manufactUling systems using computer simulation techniques. International ... Hafliurd Business. Review, J uly/A ...
The threshold value of a quality index for formation of cellular manufacturing systems H. SEIFODDINlt and M. DJASSEMIt rhe superiority of cellular ma.nufacturing to job shop manufactUling has been questioned by a numher of~imulation studies. The initial structure orthe machine part matrix seems to play an important role in the failure of cellular manufacturing systems in these sLlIdies. In this paper a grouping measure called 'quality index- QI' will be lIsed to evaluate the relationship between the quality of a machine-pari matrix and the performance of the corrc'iponding cellular manufactming system. A simulation study will be conducted to demonstrate how the procedure can be used to determine the threshold value for QI beyond \:vhich the cellular manu facturing system outperforms the corresponding joh shop manufacturing system.
Introduction Manufacturing is undergoing one of its most profound changes since the introduction of mass production. Glohalization has created a competitive environ ment in \vhich only the most efficient corporations survive. As a response to this challenge manufacturers aH over the world arc using the most innovative manufac turing techniques available. One t;ueh technique is cellular manufacturing (CM) which overcomes the inefficiencies of traditional batch-type manufacturing through reduction in setup times, in-proccs:~ inventories, and throughput times. In eM the benefits of economy of scale is achieved by grouping similar parts into part-families and processing them into dedicated machine cells (Burbidge 1975, Hyer 1984). Ideally a part-family is processed in a single machinr, cell for its entire operations. 111 practice. hmvcver, some parts (exceptional parts) have operations on machines (bottleneck machines) outside their parent cell (King 1980). Data for formation of machine cells and part-families is organized in the machine part (M-P) matrix which is a binary matrix with zero one entries. A 'one' entry in row i and columnj of the matrix indicates that part.i has an opcration(s) on machine i \vhile a zero entry indicates it docs not. The machine ceIl formation algorithms convert the M-P matrix into a block diagonal form in which 'one' entries are concentrated in blocks along the diagonal of the matrix. Each block represent a machine-component group in the corresponding eM system (Seifoddini and Wolf 1986). The initial structur., or a M-P matrix to a grcat extent determines the performance of the corresponding eM system. As an attempt to evaluate the goodness of a M-P matrix, a number of grouping measures such as bond energy (McCormick, el al. 1972), grouping efficiency (Chandrasekharan and Rajagopalan 1989), grouping ellicacy (K ulllar and Chandra sekharan 1990) and grouping capability index (Hsu 1990) have bcen developed. Most I.
·i-Industrial and Manufacturing Engineering Department, Univt:rsity of Wisconsin,
Milwaukee, USA. ;Industrial Studies Department, University of Wiseon sin, Platteville, USA.
of these measures are based on the relative num ber of 'one' entries inside and outside the diagonal blocks. Grouping efficiency tends to have a high valne for complete block diagonal matrices in which all 'one' entries are inside the blocks. While successful cases of CM are well documented (Wemmerlov and Hyer 1989) and (Hyer 1984), several simulation studies show that conversion from job shop to eM may result in inferior performance in some manufacturing systems. Contributing factors to performance deterioration include long queues in front of bottleneck machines, under ntilization of non-bottleneck machines, and infexibility of dedicated machine cells in dealing with changes in product mix (Ang and Willey 1984, Flynn and Jacobs 1986). A study by authors indicates that there are some common characteristics in failed CM cases including dense M-P matrices. Therefore, the identification of sneh characteristics and establishment of their relations to the performance of the corresponding eM systems are two crucial steps toward more successful development of snch systems. In this paper a grouping measure called 'qnality index-QI' is used to evaluate M-P matrices. Then simulation modelling will be employed to measure the performance ofthe corresponding eM system by estimating the average flow times, in-process inventories, and so on. Finally, a number of different M-P matrices are used to determine the relationship between different values of QI and the performance of the corresponding CM system. The purpose is to determine the threshold value of the QI beyond which CM system will outperform the corresponding job shop manufacturing system. 2,
Definition of the problem The benefits of CM has been questioned by a number of simulation studies including Christy and Udayan (1986), Flynn and Jacobs (1986), Sarpcr (1988), Garza (1990), Sassani (1990), and Shafer and Meredith (1990). These studies indicate that the formation of dedicated machine cells generally reduces the availability of machines for the processing of parts in the product mix. This leads to high inventory accumulation in front of bottleneck machines, low utilization of non-bottleneck machines and imbalanced workload distribution among machine cells. Cellular manufacturing is also less flexible in dealing with changes in the product mix. Some of the above mentioned problems including the imbalanced workload distribution can be overcome by using alternative routeing (Burbidge 1992), out sonrcing (Bnrbidge 1975), machine duplication (Seifoddini, 1989) and the formation of hybrid machine cells (Seifoddini 1992). Some other problems, such as the inflexibility of dedicated machine cells in the case of changing product mix, merit careful analysis prior to any decision regarding the development of a CM system. Yet other problems, such as excessive intercellular moves and inefficient shopfloor operations, may be signs of illsuited situations for conversion to cellular manufactur ing. Therefore each manufacturing situation should be carefully evaluated before conversion to eM. In a simulation study by Flynn and Jacobs (1986), the conversion from job shop manufacturing to eM led to longer queues, higher work-in-process inventories, and longer waiting lines. In this study the characteristics of the manufacturing system including its dense M-P matrix (Shafer and Meredith 1990) might have been the main reason for the poor performance of the corresponding CM system. Generally, the structure of the M-P matrix has a great impact on the performance of the correspond ing CM system. Therefore, the evaluation of the block diagonal M-P matrix provides
useful information on its suitability for the development of a eM system. The three important components of such an evaluation include a grouping measure, perfor mance measures, and a simulation model. Among the existing grouping measures, quality index (QI) is the most effective one (Seifoddini and Djassemi 1994). QI is the measure of independence of machine component groups. Since independent machine cells arc ideal for the formation of CM systems, a high valne of QI is expected to lead to a high performance level in the corresponding CM system. QI can be defined as, QI = I
_lew PW
where, ICW
,~
Total intercellnlar workload
PW= Total plant workload ICW. on the other hand, can be defined as
where, Y
mc
=
I, { 0,
if machine m is assigned to cell c othenvise if part p is assigned to cell c
Zpc={I, O. otherwise X mp
=
I, { 0,
if part p has operation on machine m otherwise
Yp = volume of part p Tmr
=
processing time of part p on machine m
M = total number of machines P = total number of parts C = total number of cells PW can be defined as. M
P
PW= L::L::Xmp,Yp.Tmp lil"" I p""" I
X mp , Vp and T mp as defined before. For performance evaluation, measures slich as mean flow time, mean work-in process inventories, mean set-up time, mean number ofintcrcellular moves, and mean operator productivity are widely used in the literature and will be employed here (Djassemi 1994). In order to compare the performance of a manufacturing system under job shop
and eM configuration. a simulation model is used. In the simulation analysis, the performance of the manufacturing systems with different M-P matrices will be evaluated by llsing one of the above mentioned performance measures. Then the relationship between values of QI and the performance of the corresponding manufacturing system will he determined using statistical analysis. Finally, threshold value of QI beyond which the CM system outperforms its corresponding job shop manufacturing system is determined. 3. Comparison of job shop and ccllnlar manufacturing The comparison of manufacturing systems under job shop and eM configurations is done in three phases. In the first phase the M-P matrix is converted into a block diagonal form which is used to develop a CM system. The value of QI for the block diagonal fOfm is also calculated at this phase. In the second phase, a simulation model of both job shop and CM system is constructed. This simulation model is used to estimate different performance measures for the two systems based on a number of different M-P matrices and their corresponding QI values. Finally, statistical analysis is used to test the significance of the differences between the performances of the two systems at different QIlevcls. The algorithmic form of the procedure can be summarized as follows: (1) Convert the M-P matrix into a block diagonal form using one of the existing machine-component grouping algorithms such as ROC (King 1980) or SCM (Seifoddini and Wolf 1986). (2) Calculate the value of QI for the block diagonal form. (3) Use simulation to estimate the performance measures for both job shop and CM systems under a specific manufacturing situation. (4) Determine the statistical significance of the difference between the perfor mances of the two systems. (5) Repeat steps 1 to 4 for a set of different M-P matrices and QI's. The value of QI can be changed, (a) by redistribution of entries of the M-P matrix or (b) by changing the density of the M-P matrix. (6) Determine the value of QI beyond which CM system outperforms its corresponding job shop mannfacturing system. Since a number of different performance measures have been employed in this study, it is expected that a range of QI values is determined as a threshold value for converting a job shop system to a cellular manufacturing system. The procedure presented here is based on the following assumptions. (I) An efficient machine-component grouping algorithm is used to form machine cells for CM. (2) Raw materials are ready at the beginning of the shift. (3) Machine breakdowns arc not considered (this can be a serious problcm if the effects of machine breakdowns is significantly different in CM and job shop). (4) There is one operator for every two machines and job rotation occurs in machine cells. This is a comparative study and hence it does not seem that these assumptions impose any serious limitation on the viability of results. Assumption 4, however, requires more exploration and can be the subject of a new study.
Since simulation is a major pari of this procedure a brief discussion of important features of the simulation model will be presented in the following section. 3.1.
Simulation modelbng SIMAN/CINEMA IV simulation language is used for model translation (Pegdcn ('I 01. 1990). SIMAN provides a flexible modelling environment for manufacturing systems induding built in features for modelling of work stations, transportations, waiting lines, and so on. (~JNEMA animation is also helpful, especially for model verification (Djassemi 1994). Continuity and degeneracy tests (removing some machines and checking for performance deterioration) were conducted for model validation. Common random numbers were used for minimizing variations. The replication/deletion graphical method (Law and Kelton 1991) was used to minimize the effects of the transient period and the results for 100 days of simulation (50000 time units) were discarded. Finally, batching method was used for parameter estimation (Law and Kelton 1991). Data for the steady state period were divided into 20 batches of size 13 days. 3.2.
Input data The main input to the simulation model include; (I) A M-P matrix whICh provides the information for the development of job
shop and CM syw,ms. (2) Routing and operational data including processing times and base setup times. (3) Product mix and arrival patterns. M-P matrices for two manufacturing situations used in this paper arc given in Figs 1 and 7. Additional M-P matrices for different QJ values arc given in appendix A of Djas~emi (1994). The interarrival times for parts in thc M-P matrices in Figures I and 7 are exponentially distributed with mean intcrarriva1 time of 10 minutes and 60 minutes, respectively. Data on the processing times of parts and their routeings are given in appendix A of Djassemi (1994). In addition, it is assumed that the general time coefficient (GTC) for different sequencing possibilities is as follows: (1) For two identical paris loaded sequentially, GTC ~ 0'1, (2) For two parts from the same part-family loaded sequentially, GTC ~ 0,5, (3) For two parts from dilIer----.........-----.;.
E
o.. ~
;; CIl
....o
15
~
.~ 10 o 0.. o
et:
5
CM
-+-----+----~---~
.;.
•
O-'---i-----·--i---------i-------i-------i--...-J
75
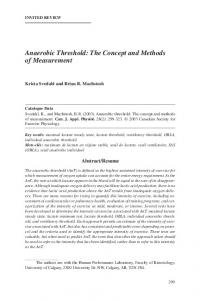
65 Figure 4.
85 90
Grouping Efficiency (%)
Comparison of proportion of setup time.
25
~
20
~
> 0
Shop ·i Job . ~: -til ·: . ··· ..
..
,.
::E ~
g
15
~
]1
...
....0
10 : CM
~ ~
::E
5
· . ·~: .... ····
..
:
0
~
75
65 figure 5.
85 90 Grouping Efficiency (%)
Comparison of mean of intercell moves.
oj,
4.1 - , - - . . . . , - - - - - - , . - - - - - , - - - - -
4
~ 3.9 til
~ 3.8 ~
e:-,., 3.7 :~ 3.6
eM
u~ 3.5
""o