Defect and Diffusion Forum Vols. 323-325 (2012) pp 295-300 Online available since 2012/Apr/12 at www.scientific.net © (2012) Trans Tech Publications, Switzerland doi:10.4028/www.scientific.net/DDF.323-325.295
The transition from internal to external oxidation of Ni - X wt.% Cr at 950°C A. Nicolas1, 2, 3, a, E. Aublant1, b, E. Feulvarch2, c and K. Wolski3, d 1
AREVA NP, Technical Center, Corrosion-Chemistry Department, 30 Bd de l’industrie, 71200 Le Creusot, France 2
Univ Lyon, ENISE, UMR 5513, LTDS, Université de Lyon, 58 Rue Jean Parot, 42023 Saint Etienne, France
3
Ecole des Mines de Saint-Etienne, Laboratoire Claude Goux UMR CNRS 5146, Centre SMS, 158 Cours Fauriel, 42023 Saint Etienne, France a
[email protected],
[email protected],
[email protected],
[email protected]
Keywords: Internal Oxidation, Ni-Cr alloys, Wagner’s Analytical Solution, Oxygen Diffusion Coefficient
Abstract. The paper’s focus is to establish the criterion for the transition from internal to external oxidation. This criterion is a simple value of oxide volume fraction where the coalescence of the nodular oxide in the continuous layer is considered as inevitable. It is obtained by the Wagner’s analytical solution and by the data of Giggins et al. [1], which give the experimental transition from internal to external oxidation between 10 and 11 weight percent of chromium in the initial alloy. This paper also enables to obtain the oxygen diffusion coefficient in pure nickel thanks to the experimental results of oxidation at 950 °C during 10 hours on Ni-0.2Cr, Ni-1Cr and Ni-5Cr model alloys. Introduction The transition from the internal to the external oxidation in Ni-xCr alloys is known to occur as a function of chromium content in the initial alloy. For alloys with low Cr content, oxidation results in the formation of chromium-rich subsurface precipitates. With an increasing Cr content their volume fraction is increased and eventually results in the formation of a chromium oxide continuous layer by coalescence. Coalescence of chromium nodular oxides obeys to complex mechanisms which are difficult to be quantified at this time. Wagner’s analytical model of internal oxidation proposes a criterion, however this criterion is based on an arbitrary value of the g parameter, and in practice is difficult to be implemented in numerical simulations. Therefore, we suggest a criterion based on the critical volume fraction of chromium oxide separating the formation of nodular oxides in the case of internal oxidation mechanism from their coalescence into the continuous layer and subsequent formation of the continuous oxide layer, which is the characteristic of the external oxidation mechanism. Such an approach allows to separate numerical simulations into two areas based on inward oxygen diffusion on the one hand and vacancies transport in the oxide scale and substrate on the other hand. In our approach, Wagner’s analytical model has been extended to take into account the dependency of the oxygen diffusion coefficient in Ni-Cr alloys on the volume fraction of oxide precipitates. Additionally, the physical transition from internal to external oxidation provided by Giggins and al. [1], between 10 and 11 weight percent (wt.%) of chromium at 950 °C, has been used as input data. The criterion of the transition from internal to external oxidation has been obtained by comparison between such an analytical solution and the experimental transition found by Giggins. The entire study has been conducted at 950 °C on three Ni-xCr model alloys.
All rights reserved. No part of contents of this paper may be reproduced or transmitted in any form or by any means without the written permission of TTP, www.ttp.net. (ID: 193.50.200.66-09/11/12,14:22:48)
296
Diffusion in Materials - DIMAT 2011
Wagner’s analytical solution Data and model equations NO(s) is the mole fraction of oxygen at the surface: 371 ppm mol. [2]. υ is equal to a/o for AaOo: 2/3. NA(o) is the mole fraction of A in initial alloy. Φ is the ratio of oxygen effective diffusion coefficient to A diffusion coefficient. γ is an unknown coefficient, to be calculated. ξ is the thickness of the nodular oxidation layer. DO/al is the oxygen diffusion coefficient in the alloy. DOeff is the oxygen effective diffusion coefficient. DCr is the chromium diffusion
coefficient in nickel: 5.10 -12 cm 2 .s -1 [3]. NAox is the mole fraction of A element. FX is the weight fraction of X species. NX is the mole fraction of X species. MX is the atomic mass of X species. ρ is the density. Vm is the molar volume (mol.m-3). P is the oxide volume fraction. FCrox max is the weight fraction of chromium in pure chromium oxide: 68.4 wt.% of chromium. ρNi is the density of pure nickel: 8900 kg.m-3. ρox is the density of chromium oxide: 5200 kg.m-3.
Internal oxidation occurs when the difference between the flux of oxygen and the flux of the highest oxidizable element in the alloy is high enough to prevent the coalescence of nodular oxides into a continuous oxide layer. In accordance with the flux expression of the first Fick's law, several conditions must be fulfilled to satisfy this configuration: • High oxygen solubility in alloy, • Low content of oxidizable elements, • Ratios of oxygen effective diffusion coefficient to the diffusion coefficient of the oxidizable element largely in favor of oxygen. The maximum of oxygen solubility in pure nickel is relatively high [4]: 500 ppm. The oxygen diffusion coefficient in nickel [4,5,6] is 100 to 1000 times higher than the diffusion coefficient of chromium in nickel [3]. Thus, the conditions for internal oxidation are achieved for low content of chromium. The Wagner’s analytical model of internal oxidation assumes that the dissociation pressure of chromium oxide is equal to zero, i.e., the coexistence between oxygen and the oxidizable element in the same place is not possible. This assumption seems to be correct with regard to the value of the dissociation pressure of chromium oxide [7]. The Wagner’s model is based on the competition between the oxygen flux through the nodular oxidation layer and the flux of oxidizing elements through the chromium depleted layer. The Wagner’s solution allows to obtain (i) the volume fraction of oxides formed within the alloy, which is constant in the nodular oxidation layer, and (ii) the thickness affected by the nodular oxides. The analytical model is described by the Eq. 1:
(1)
NO(s) is obtained from the dissociation pressure of nickel oxide [2]. γ characterizes the competition between oxygen diffusion and A element diffusion. The definition of DOeff is discussed afterwards. NAox corresponds to the number of moles of A element passed through the interface alloy / nodular oxidation zone during dt divided by the number of moles contained in the nodular oxidation zone produced during dt. This fraction may have a limited physical sense due to the
Defect and Diffusion Forum Vols. 323-325
297
difference of crystal lattice between chromium oxide and chromium within the lattice of the alloy. It is suggested to use either the weight fraction or the volume fraction to describe the diffusion mechanisms of external oxidation. The connection between mole fraction, weight fraction and volume fraction can be made from the following expression:
(2)
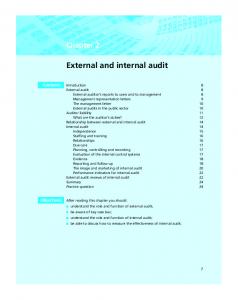
Impossible solution 64 %vol.
47,5 %vol. 11 %wt. 10 %wt.
DO/al=0.35 µm2.s-1
Weight percentage of chromium in intial alloy (wt.%)
Oxide volume percentage P (vol.%)
Eq. 2.1 enables to easily convert the mole fraction ratio to the weight fraction ratio. Nevertheless, in order to compare analytical and experimental results, it is easier to describe the nodular oxidation content by the volume fraction of chromium oxide. Eq. 2.2 gives the conversion between weight fraction and volume fraction of oxide. Eq. 2.2 assumes that the oxide volume fraction is equal to the weight fraction of chromium in the nodular oxidation zone produced during dt over the weight fraction of chromium in pure chromium oxide if these weight fractions are considered in the same crystal lattice. The density ratio in Eq. 2.2 results from the crystal lattice differences between FCrox (nickel- rich alloy) and FCr ox max (chromium oxide). The assumption of Eq. 2.2 is verified because the weight fraction ratio multiplied by the density ratio is equal to the mole fraction ratio of the same elements in the same crystal lattice.
Oxygen effective diffusion coefficient Doeff (µm2.s-1)
Figure 1: Tridimensional representation of the oxide volume fraction as a function of the oxygen effective diffusion coefficient and the chromium weight fraction in initial alloy. Several curves are plotted on this tridimensional surface: the isovalue of the oxygen diffusion coefficient in pure nickel DO/al=0.35 µm2.s-1 (white and black curve), the experimental transition determined by Giggins et al. (10 wt.% and 11 wt.%) and the minimum and maximum of the criterion for the transition between internal to external oxidation. Finally, the description of Wagner’s model by Eq. 1 and Eq. 2 allows to obtain Fig. 1. This figure gives the volume fraction of chromium oxide as a function of the oxygen effective diffusion coefficient and the weight fraction of chromium in the initial alloy. This figure allows to describe all cases of internal oxidation as a function of the oxygen effective diffusion coefficient.
298
Diffusion in Materials - DIMAT 2011
It is important to note that the solution proposed by Wagner’s model is valid only within the framework of internal oxidation. Therefore, the results’ validity in Fig. 1 is assured only if the volume fraction of chromium oxide does not allow the coalescence of nodular oxides into a continuous layer. This requires that the oxide volume fraction is lower than the criterion for the transition from internal to external oxidation. This criterion is of capital importance for both the analytical model and numerical simulations, in particular for high chromium contents. Oxygen diffusion coefficient Volume fractions of oxide have been compared between the analytical model and the experimental tests following the oxidation of Ni-0.2Cr, Ni-1Cr and Ni-5Cr model alloys. However, the comparison cannot be directly done from the oxygen effective diffusion coefficient because this value depends on the volume fraction of chromium oxide. The oxygen effective diffusion coefficient can only be obtained from the oxygen diffusion coefficient in nickel. In fact, two fluxes are considered: one through oxide particles and one through the matrix which becomes pure nickel as internal oxidation proceeds. Making the assumption that the oxygen diffusion coefficient in oxide particles is negligible compared to the oxygen diffusion coefficient in a nickel matrix, the oxygen effective diffusion coefficient can be defined as follows: (3) Based on data from the literature, the diffusion coefficient of oxygen in nickel varies within a range of an order of magnitude [4,5,6]. Yet, the accuracy of oxygen diffusion coefficient is essential to obtain the criterion of transition from internal to external oxidation. Therefore, the diffusion coefficient of oxygen in pure nickel has been determined from the Wagner’s analytical solution and the oxidation of Ni-xCr model alloys. Experimental work Experimental procedure Oxidations were carried out on cylindrical plates (Ø = 18mm, h = 1 mm) for Ni-0.2Cr, Ni-1Cr and Ni-5Cr alloys with impurity concentrations below 10 ppm (LECO analysis of C, S, O and N). The sample surface was polished mechanically using SiC papers down to ¼ of micrometers. No chemical attack was performed. Oxidations have been carried out in a furnace at 950 °C for 10 hours in reconstituted air. The samples were then cooled by air quenching, cut with a crosscut saw and polished in order to analyze the transverse cross-sections.
20 µm
20 µm
Fig. 2. Example of image treatment on Ni-1Cr. A same threshold was chosen for all micrographs. Observation of transverse sections was performed using an optical microscope equipped with a digital camera. The image processing was performed by a simple threshold method on normalized histograms. This technique requires images taken in the same conditions. Fig. 2 illustrates the accuracy of the image processing.
Defect and Diffusion Forum Vols. 323-325
299
Once this image processing done, the continuous layer of nickel oxide is numerically deleted and the nickel oxide/ nodular oxide layer interface is positioned on the top of the image. Finally, the black fraction corresponding to nodular oxides is calculated line by line to obtain a surface fraction of precipitates as a function of the depth and consequently an average profile. The surface fraction will be considered as volume fraction of chromium nodular oxide [5]. Experimental results
0,8% 0,7% 0,6%
analytical solution with Doeff = 0.35 µm2.s-1 average profile of 33 optical micrographies tendency curve (gaussian distribution function)
0,5% 0,4% 0,3%
0,2% 0,1%
0,0% 0 10 20 30 40 50 60 70 80 Depth from the nickel oxide / alloy with nodular oxide interface (µm) a
Surface and volume percentage of nodular oxide (vol.%)
24% 20%
Surface and volume percentage of nodular oxide (vol.%)
Surface and volume percentage of nodular oxide (vol.%)
Fig. 3 shows the average profile and the Wagner’s solution with a given DOeff for Ni-0.2Cr, Ni1Cr and Ni-5Cr alloys. The oxygen effective diffusion coefficient can be obtained by comparison with the oxide volume fraction of Wagner’s solution or with the depth of the nodular oxide layer of Wagner’s solution. Nevertheless, the aim of these fits is to establish the oxygen diffusion coefficient in pure nickel. According to Eq. 3 giving a relation between DOeff and DO/al, the oxygen diffusion coefficient in pure nickel is obtained by fitting all oxygen effective diffusion coefficients of Ni-xCr model alloys. The oxide weight fraction has been chosen as the criterion of this fit to have the best correlation with the criterion for the transition between internal and external oxidation. The initial part, close to the NiO / internal oxidation zone interface, of the average experimental profile on Fig. 3 corresponding to each Ni-xCr is distorted due to the method used to delete the nickel oxide which deletes also the chromium nodular oxide close to the interface. Fig. 3 shows how the DOeff of each Ni-xCr has been obtained. These coefficients have been adjusted to obtain the best correlation with the chromium oxide volume fraction. Note that the noise in Fig.3a comes from a very low volume fraction of oxides in Ni-0.2Cr alloy. This noise reduces as chromium content increases to 1wt.% (Fig. 3b) and to 5wt.% (Fig. 3c). The oxygen diffusion coefficient in pure nickel, obtained by this method, is 0.35 µm2.s-1. analytical solution with Doeff = 0,34 µm2.s-1 average profile of 28 optical micrographies tendancy curve (gaussian distribution function) numerical solution with Do/al = 0.35 µm2.s-1
4,0%
3,0% 2,0% 1,0% 0,0% 0
10 20 30 Depth from the nickel oxide / alloy with nodular oxide interface (µm) b
analytical solution with Doeff = 0.29 µm2.s-1 average profile of 36 optical micrographies tendancy curve (gaussian distribution function)
16% 12% 8% 4% 0%
0 2 4 6 8 10 12 Depth from the nickel oxide / alloy with nodular c oxide interface (µm)
Fig. 3. Surface and volume fractions of internal oxide as a function of depth on the Ni-0.2Cr (a), Ni1Cr (b) and Ni-5Cr alloys (c). An example of numerical profile is proposed in Fig. 3.b. This profile is obtained by the numerical model of Feulvarch et al. [8] with the oxygen diffusion coefficient in pure nickel and the assumption of Eq. 3. The numerical profile reproduces the analytical solution on the Ni-1Cr alloy.
300
Diffusion in Materials - DIMAT 2011
Discussion Giggins et al. [1] described the oxidation of Ni-xCr, in particular the transition from internal to external oxidation. They determined the transition between 10 and 11 wt.% of chromium. Thus, the range of chromium oxide volume fraction where the oxidation goes from internal to external must be determined by the expression of the oxygen diffusion coefficient in pure nickel in the tridimensional curve of Fig. 1 and the boundary values introduced by Giggins et al. Fig.1 illustrates this approach. The isovalue of DO/al is represented by two types of color. The white curve represents the analytical solution which is physically acceptable and the black curve the one which goes beyond the physical solution because in this part the highest chromium content in the initial alloy implies the lowest volume fraction of chromium oxide. Finally, the criterion for the transition between internal and external oxidation has been found to be between 47.5 and 64vol.% of chromium oxide. Conclusion 10-hour oxidations at 950 °C were performed on Ni-0.2Cr, Ni-1Cr and Ni-5Cr model alloys. Experimental results were compared with Wagner’s analytical model of internal oxidation in order to obtain the oxygen effective diffusion coefficient for each Ni-xCr model alloy. The oxygen effective diffusion coefficients obtained from experimental measurements allow to calculate the oxygen diffusion coefficient in pure nickel, the value of which is 0.35 µm2.s-1. A criterion for the transition between internal and external oxidation based on the volume fraction of oxide precipitates was proposed. A tridimensional representation of Wagner’s solution and the comparison with the experimentally determined transition between 10 and 11 wt.% of chromium resulted in a criterion in the range of 47.5 to 64 vol.% of chromium oxide. Such a criterion can be easily implemented in numerical codes for the simulation of oxidation and allows separating internal oxidation below 47.5 vol.% and formation of a continuous oxide layer above 64 vol.%, with a mixed oxidation mode in the transition range. Literature References [1] C.S. Giggins, F.S. Pettit: Trans. Met. Soc. AIME, vol. 245 (1969), p. 2495. [2] O. Knache, Thermochemical properties of inorganic substances, 2nd ed., Springer-Verlag Berlin, Heidelberg New York (1991), p. 1455. [3] A. Nicolas, V. Barnier, E. Aublant and K. Wolski: submitted to Scripta Materialia (2011). [4] J.W. Park, C.J. Altstetter: Met. Trans. A, Vol. 18A (1987), p.43. [5] S. Goto, K. Namaki, S. Koda: NASA TT F-12 (1969), p.276. [6] C.J. Smithells, E.C. Ransley: Proc. Roy. Soc., Vol. 55 (1936), p.195. [7] O. Knache, Thermochemical properties of inorganic substances, 2nd ed., Springer-Verlag Berlin, Heidelberg New York (1991), p. 521. [8] E. Feulvarch, J.M. Bergheau, and J.B. Leblond: Int. J. Num. Met. Eng., Vol. 78 (2009), p. 1492.
Diffusion in Materials - DIMAT 2011 10.4028/www.scientific.net/DDF.323-325
The Transition from Internal to External Oxidation of Ni - X Wt.% Cr at 950°C 10.4028/www.scientific.net/DDF.323-325.295