International Archives of the Photogrammetry, Remote Sensing and Spatial Information Sciences, Volume XL-2/W2, ISPRS 8th 3DGeoInfo Conference & WG II/2 Workshop, 27 – 29 November 2013, Istanbul, Turkey
THE USABILITY OF ONLINE GEOGRAPHIC VIRTUAL REALITY FOR URBAN PLANNING S.Zhang a, b, A.B.Moore a, * a
b
School of Surveying, University of Otago, PO Box 56, Dunedin, New Zealand –
[email protected],
[email protected] Land Information New Zealand (LINZ), PO Box 5501, Wellington, New Zealand 3D GeoInfo Conference 2013
KEY WORDS: 3D virtual environments, GIS, CAD, urban design, efficiency, effectiveness, satisfaction
ABSTRACT: Virtual reality (VR) technology is starting to become widely and freely available (for example the online OpenSimulator tool), with potential for use in 3D urban planning and design tasks but still needing rigorous assessment to establish this. A previous study consulted with a small group of urban professionals, who concluded in a satisfaction usability test that online VR had potential value as a usable 3D communication and remote marketing tool but acknowledged that visual quality and geographic accuracy were obstacles to overcome. This research takes the investigation a significant step further to also examine the usability aspects of efficiency (how quickly tasks are completed) and effectiveness (how successfully tasks are completed), relating to OpenSimulator in an urban planning situation. The comparative study pits a three-dimensional VR model (with increased graphic fidelity and geographic content to address the feedback of the previous study) of a subdivision design (in a Dunedin suburb) against 3D models built with GIS (ArcGIS) and CAD (BricsCAD) tools, two types of software environment well established in urban professional practice. Urban professionals participated in the study by attempting to perform timed tasks correctly in each of the environments before being asked questions about the technologies involved and their perceived importance to their professional work. The results reinforce the positive feedback for VR of the previous study, with the graphical and geographic data issues being somewhat addressed (though participants stressed the need for accurate and precise object and terrain modification capabilities in VR). Ease-ofuse and associated fastest task completion speed were significant positive outcomes to emerge from the comparison with GIS and CAD, pointing to a strong future for VR in an urban planning context.
1. INTRODUCTION 1.1 Motivation Virtual Reality (VR) has been investigated as a technology that could aid the urban planner (Camara and Raper, 1999; Axford et al, 2007; Döllner, 2007). VR is also a human-oriented technology, which suits the typical collaborative process of urban planning. Its emphasis on 3D modelling represents a welcome shift from the 2D-oriented tools – GIS and CAD (Campagna, 2006) – that these professionals typically use. Yet all three tools now have 3D capability, making them suitable for comparison. VR, through which one creates Virtual Environments (VE) interacted with via an avatar, have only recently become widely and freely accessible. There are abundant networked examples, enabling remote communication and collaboration, but real-time processing is a condition of this. Specific instances include Second Life (Linden research Inc., 2013; e.g. Hudson-Smith, 2008) and its open source emulation OpenSimulator (OpenSim, 2013; e.g. Lopes and Lindstrom, 2012). An initial usability testing (for satisfaction) on a virtual subdivision development of a Dunedin suburb implemented in OpenSimulator (Zhang and Moore, 2013) revealed that there is much potential in urban design for free online VR as a 3D
communication and marketing tool, if graphical limitations imposed by the need for real-time feedback whilst online and OpenSim’s inherent lack of geographic sensibility could be mitigated. This paper details the follow-on study, which compares VR with GIS and CAD in terms of the three aspects of usability testing (ISO, 1998): efficiency (“resources expended in relation to the accuracy and completeness with which users complete goals” e.g. time) and effectiveness (“accuracy and completeness with which users achieve specified goals”) as well as satisfaction (“… positive attitudes towards the use of a product”). The approaches to virtual world building and rendering were modified for the follow on study, to address the geographical and graphical feedback from the previous study. 1.2 Aims The ultimate purpose of this project is to determine the feasibility of using the Virtual Reality (VR) technology that is geographically supported, is graphically realistic (and enables remote collaboration) as a primary tool for urban planning and design. Therefore, the major research objective is the comparative usability assessment of proposed urban planning scenarios
* Corresponding author
This contribution has been peer-reviewed. The peer-review was conducted on the basis of the abstract.
145
International Archives of the Photogrammetry, Remote Sensing and Spatial Information Sciences, Volume XL-2/W2, ISPRS 8th 3DGeoInfo Conference & WG II/2 Workshop, 27 – 29 November 2013, Istanbul, Turkey realised by CAD, GIS and online VR software. Efficiency, effectiveness and satisfaction dimensions of usability will be tested. To meet this objective, the building and testing of 3D environments based on a proposed urban (subdivision) development (containing existing buildings and potential developments) will be carried out. An account of this will be provided in the methods section. This is while applying a rendering method to improve the realism of the VE, particularly the quality of the building models, that can work effectively for urban planners in real time. Also, the effects of improving the transfer of geographic data into the environment (via georeferenced orthophotos) were of interest, especially in the role of virtual navigation.
2. METHODS The study area (Grand Vista) is located in a suburb of Dunedin. Grand Vista was originally designated as a rural area but Dunedin City Council had rezoned it due to substantial residential demand. Figure 1 indicates the zone of development and the subzone that will be the focus of virtual environment, CAD and GIS implementations. With the exception of a gully in the western part of the site that runs to the northern corner, all land in the zone is suitable for residential development. N
In the study, tasks and a questionnaire were set for the participants, all of which were practicing or training in the urban planning field. The results of the study will be presented later on in the paper, followed by a discussion and concluding statements. 1.3 Definitions and Previous Research Virtual reality is delivered via an environment, normally computer-generated, that replicates a real or imagined world that instils a sense of presence in the user. Virtual environments with geographic content – such as is needed for urban planning – are termed Virtual Geographic Environments (VGE – Gong and Lin, 2006). A collaborative VGE (CVGE) brings in distributed elements that enable remote communication and planning (Hui et al, 2010). Urban planning is a process term covering a variety of professional activities (e.g. urban design, landuse planning, transportation planning) and using a variety of tools (e.g. housing programmes, zoning). It purports to represent the needs of all urban groups, including minorities, is political in nature, stresses evaluation of alternative solutions and is future-oriented (Laurini, 2001). The link between VR and urban planning is strong: “… exposure to computer games is generating an expectation that similar techniques could be used to show what a future city will ‘look’ and ‘feel’ like” (p.284) and the inner city redevelopment trend within the profession is such that demands like this will increase due to an increased need for consultation. However, there has been a slow uptake within urban decision making arenas due to fear of cost and lack of awareness of new technological developments of this kind (Axford et al, 2007). Lopes and Lindstrom (2012) report on an application of OpenSimulator to city planning in Uppsala, Sweden, in the context of a possible Personal Rapid Transit (PRT) system for the city. They characterise the existing network of stakeholders involved with urban planning and the associated use of technology as fragmented (small disparate groups involved on specific and localised projects). Accordingly, they see and apply online VR as a tool that acts holistically, with communication capability to link stakeholders and comprehensiveness of digital modelling approach to model whole cities or substantial parts thereof. Although VR and urban planning have been linked to each other for a long time now in the literature and through diverse projects, this is the first time the implications of the new generation of free, online VR has been explored in the context of a comprehensive usability study.
Stage 1
Figure 1. The study site, Grand Vista. The yellow boundary highlights the whole re-designated zone. The red line indicates the target area for the 3D design environments. Figure 2a details the development and assessment process, covered in the next three subsections. 2.1 Preparation of geographic data for GIS, CAD and VE Figure 2b outlines the steps taken to prepare the data for the GIS environment and Figure 2c details the preprocessing stages for the VE (the CAD process is relatively simple and is embedded in Figure 2a). The input data comprised the site terrain (raster DEM), site extent polygon and existing features (existing parcel boundaries and road edges next to the site), originally in CAD (12D) format. For CAD 3D modeling, this original DEM was the main dataset needed. Finally, a subdivision parcel boundary plan for the site was designed and digitized in CAD. For GIS and VE, all data (including CAD) were subsequently imported into ESRI ArcGIS 10. A Triangulated Irregular Network (TIN) was created with the DEM and mass points from neighbouring 2 metre contour data as input. The resultant TIN filled a 768 metre x 768 metre area sufficient to enclose the development site. This underpins the 3D GIS model to be tested. For the VE only, vector CAD data was converted to 3D GIS data which in turn was used to “emboss” a copy of the TIN so
This contribution has been peer-reviewed. The peer-review was conducted on the basis of the abstract.
146
International Archives of the Photogrammetry, Remote Sensing and Spatial Information Sciences, Volume XL-2/W2, ISPRS 8th 3DGeoInfo Conference & WG II/2 Workshop, 27 – 29 November 2013, Istanbul, Turkey that there was an imprint of road edges and the site boundary apparent on the TIN surface. This was achieved by giving each feature a constant z-value that could be added to the level of the underlying terrain. The augmented TIN was converted to raster GRID format.
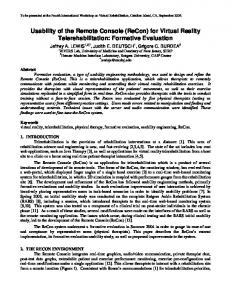
In ERDAS Imagine the raster was tiled into nine (3x3) 256m x 256m tiles (1 metre resolution), each of which was affine reflected across the x-axis then converted to a generic binary format (bit interleaved, 32-bit floating point, Big Endian ordering). This last group of steps ensured that the terrain matched the necessary terrain input parameters for the Open Simulator Virtual Environment engine. However, to bring more geographical cues into the virtual environment, an orthophotograph tiled similarly was combined tile by tile with the terrain. The results were stored in OpenSimready XML files, generated by a C# script adapted from one provided by Christa Lopes at the University of California (avatar name Diva Canto). 2.2 Realising the proposed development CAD: With the DEM and subdivision plan as a basis, solid shapes such as cubes, planes and prisms were used to create house objects (see VR subsection for more on the origin of these house designs) which were then textured. Figure 3 shows the CAD model.
2
Attribute
window
1
Command
window
Figure 3. The proposed development in CAD GIS: The aforementioned house designs (see VR subsection for more details) were constructed and textured in the Trimble SketchUp 8 3D modeling package. These were imported into ArcGIS ArcGlobe, with the TIN and specifically the 2D footprints from the original plan as guidance – the latter were replaced by the 3D SketchUp models. Figure 4 shows a SketchUp model of the modern 2-storey house used in the 3D models, also the final subdivision model in ArcGlobe. The final model also has a draped orthophoto as well as the other features (e.g. road edges).
Figure 2. Process flow diagrams: (a) Whole development and assessment process for VE, CAD and GIS; (b) Processing for the GIS 3D model (c) Processing in GIS and image processing environments for VE content
Figure 4. The GIS 3D environment in ArcGlobe – the green polygon is reserve area.Inset: Modern 2-floor house (SketchUp)
This contribution has been peer-reviewed. The peer-review was conducted on the basis of the abstract.
147
International Archives of the Photogrammetry, Remote Sensing and Spatial Information Sciences, Volume XL-2/W2, ISPRS 8th 3DGeoInfo Conference & WG II/2 Workshop, 27 – 29 November 2013, Istanbul, Turkey VR: Each of the nine tiles was imported into the OpenSimulator environment, which powers the New Zealand Virtual World Grid (NZVWG), an open access grid. OpenSimulator is an open-source server platform for hosting the virtual world, used with the one of the client viewers Imprudence / Hippo OpenSim Viewer. In this way the 768m2 area of terrain was transplanted from the GIS environment, carrying with it other embedded parcel, road and boundary geographic information, sufficient for subsequent virtual world building to occur.
photos (e.g. bricks) or an OpenSim library texture (e.g. roof), increasing the fidelity of appearance (Zhang and Moore, 2013). These houses (as well as fences and walls constructed using a similar workflow) were duplicated to fill the virtual development plot, interspersed with landscape objects such as trees, grass and water features on top of the grass texture chosen to drape the underlying terrain. The boundary imprint in the terrain that had been propagated from geographic data in ArcGIS forms the spatial constraint for the proposed development. Once all the primitive building was complete, the augmented terrain was replaced with actual terrain (which had been similarly processed in ArcGIS and Imagine – Figure 2c) to leave the finished virtual environment. This VE has most of Döllner’s (2007) desired elements and attributes for VEs. 2.3 Testing of the GIS, CAD and Virtual Environments
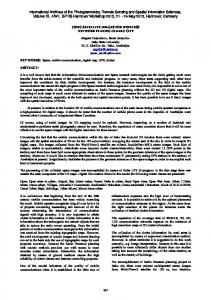
Figure 5. Part of the proposed subdivision plot in OpenSim, viewed through the Hippo Viewer. The spikes set out the parcel boundaries within the plot to guide virtual development. Figure 5 shows a visual representation of this embossed guide terrain, and the limit of the area to be virtually developed. Figure 6 shows an aerial view of part of the finished interface, featuring the subdivision zone, environs and the avatar, the digital representation of the user, which is used to explore and assess the VE. There is also an inset of one of the developed properties in OpenSim sandpit space.
The assessment, performed by a mix of urban planners, designers, surveyors and senior students in urban design around New Zealand, was divided into five parts. Firstly there was a set of questions to ascertain previous experience with technology (CAD software, GIS, 3D modeling packages and virtual reality) and if applicable, how they are used to support their professional activities. The next three stages were testing the usability of each of the environments in turn, through set tasks on the three 3D models built. The environments, built in BricsCAD (CAD), GIS (ArcGIS) and OpenSim (VR), were accessed through the first author’s laptop with pocket WiFi. The order in which each subject encountered the environments was randomized. By way of tasks, the participants were asked to create a 3D object, alter viewing parameters on the object (pan, rotate view), edit its geometric attributes (scaling, rotation) and change the texture of the object. The conditions of the test stated that they were only reliant on the printed instructions as an indication of how to perform each task. They were timed as they performed each task (efficiency), assessed as to the correctness – the percentage of tasks completed without error or verbal instruction - of performing that task (effectiveness) and asked about the experience of using the environment in a post-task questionnaire (satisfaction) e.g. in terms of learning curve, ease of doing simple tasks, visual and geographic quality, and potential for use in the workplace. The final part of the questionnaire comprised nine additional questions which were used to investigate the participants’ satisfaction on the VE’s unique capabilities (i.e. online realtime feedback and telepresence).
Figure 6. Overview of the finished virtual development. Inset: 3D virtual representation of bungalow in ‘sandpit’ virtual space. This procedure can be defined as developing an entity based three- dimensional model consisting of buildings, public spaces and transport systems, the key elements for urban designers when building a visual simulation for their design (Zhang and Moore, 2013). In terms of the dwellings modelled, the external form and dimensions principally referenced three generic house plans, specifically two 2-storey styles, one traditional, one modern, and the other is bungalow style. The interiors were also defined, as well as fencing, vegetation, landscaping and roads. Simple planar primitives, mostly thin planes, were used to construct the wall and roof elements of the three types of house to be developed within the OpenSim VE. The last stage is texturing these complete and linked models with either real
The questionnaires mostly comprised statements followed by a five-point Likert scale to record the degree to which the participant agreed or disagreed with the statement, from completely disagree (1) to completely agree (5), with neutral in between (3). The statements covered the aspects of the three environments that relate to the urban designer’s or planner’s professional work That is, the ease of use, learning curve, visual quality of the 3D objects, geographic truth, potential usefulness in a professional context, and sense of involvement / telepresence (VE only). The satisfaction test was complemented by open-ended (qualitative) questions on advantages, drawbacks suggestions for future development and any other comments on the environments. Statistical analysis was applied to the results. The Chi Square (satisfaction) and ANOVA tests (efficiency, effectiveness) in particular were run to ascertain if there was any significant difference between results for GIS, CAD and VR, in terms of the three usability dimensions.
This contribution has been peer-reviewed. The peer-review was conducted on the basis of the abstract.
148
International Archives of the Photogrammetry, Remote Sensing and Spatial Information Sciences, Volume XL-2/W2, ISPRS 8th 3DGeoInfo Conference & WG II/2 Workshop, 27 – 29 November 2013, Istanbul, Turkey 3. RESULTS
3.4 Satisfaction
3.1 Participant experience There were 16 participants in this study, either working in the urban planning and design field or senior students, having completed the urban design paper supplemented by practical experience. Most had used CAD software for their urban design tasks, a couple GIS and a couple more pen and paper. Only five had already applied 3D functionality in their role. CAD was rated as being powerful for tasks such as precise drawing and structuring (e.g. for road design), but was not too user-friendly. Despite not many using GIS for urban design, all had some experience of GIS in other contexts, used for cartography, analysis and spatial data management. The learning curve was an issue here, however, as well as speed. Although all participants had heard of VR, only two had used it, one for public briefings i.e. as a communication tool. 3.2 Efficiency
Table 2 reports the comparative satisfaction results. There is a definite trend of more positive assessments (average Likert score > 3) for the VE, with CAD and GIS both less positive to similar degrees. The spread of opinion (standard deviation) is also more definite and narrow with VE. A Chi-square test working on the null hypothesis that there is no significant difference between the type of technology and frequency of positive response (Likert score > 3) revealed that four of the sets of statement responses yielded significant differences (p = 0.05: χ2 > 5.99; df = 2). Therefore, we can say that the participants as a whole asserted that the VE is the most user-friendly interface, with easy to understand editing facilities and a fast learning curve to master basic and 3D operations. statement
SD
Chi sq
CAD GIS VE CAD GIS VE User-friendliness
Table 1 and Figure 7 show comparative results for efficiency. The times for each of the four specific tasks are shown. On the whole, completion of the tasks in the VE was on average quicker than in CAD and GIS environments. The ANOVA test marked the difference between VR and each of the other types as being statistically significant (p < 0.05). There was no significant difference between performance in GIS and CAD.
Avg. Likert
simple to master basic operations easy to master 3D operations easy to edit details
2.81 2.38 3.75 0.98 0.96 0.77 6.33 3.09 2.38 4.06 1.07 1.15 0.93 7.75 2.84 2.38 3.81 1.15 0.96 0.65 7.88 2.81 2.50 3.97 1.22 1.15 0.59 9.10
Visualize accurately 3.06 2.88 3.62 1.29 1.31 0.81 1.75 Object
CAD
GIS
VE
rapid / efficient 3D
Create 3D object
4.37
9.49
3.49
Edit size of the objects
2.63
3.35
1.93
Pan/rotate round the object
8.14
2.57
2.69
Change texture of the object
1.01
2.29
1.86
Sum
16.15
17.69
9.97
3D models have high fidelity Estimating need for earthworks / landuse can be used for professional work can save time in design progress
Table 1. Time taken for the tasks per environment (efficiency)
Plot of efficiency
2.91 2.56 3.84 1.24 1.36 0.99 2.33 3.47 3.25 4.19 1.09 1.11 0.83 2.39 3.40 3.63 3.69 1.04 1.09 1.01 0.08 3.69 3.40 4.00 1.35 1.18 0.78 1.36 3.03 2.60 3.43 1.19 1.59 1.21 0.47
Time-taken (in minutes)
Table 2. Comparative satisfaction: Average and standard deviation of Likert scale scores (significant chi-squares in bold) The VE-specific results revealed positive opinion on inenvironment awareness, navigation, graphics, real-time aspects and sense of engagement / presence within the environment. 4. DISCUSSION
CAD
GIS
VR
Figure 7. Time taken (in minutes) per environment (efficiency) 3.3 Effectiveness The comparative results for effectiveness was measured in terms of percentage of tasks completed without error or verbal instruction. The plot shows that there is visually not much difference between the three technologies, which is reinforced by non-significance (p