The use of fluid inclusion oils to reconstr uct the charge reconstruct y of petroleum reser voirs – an e xample from the histor history reserv example Tar anaki Basin aranaki Herber ve D Killops2, Mar k Lisk1, Manzur Ahmed1 and Herbertt Volk1, Simon C George1, Ste Stev Mark Robinson Aw Quezada1 1
CSIRO Petroleum, PO Box 136, North Ryde, NSW 1670, Australia. Telephone: ++61 (0)2 9490 8954, E-mail:
[email protected]
2
Institute of Geological & Nuclear Sciences, PO Box 30368, Lower Hutt, New Zealand
Abstract The hydrocarbon charge history of the McKee oil field (Taranaki Basin) has been investigated by comparing the geochemical signatures of two production oils (POs) from the Toetoe-2D and-1A wells with two fluid inclusion oils (FIOs, 2103 mRT and 2154 mRT) from the Toetoe-2 well. Petrographic analyses, recording the abundance of oil bearing fluid inclusions, suggest these FIOs are part of a palaeo-oil accumulation within the current gas cap. Published geochemical studies in the Taranaki Basin suggest coals of the Palaeogene Kapuni Group are the most likely source rocks for oil reservoired in the Eocene McKee Formation at the McKee Field. The oils are waxy and paraffinic and show no evidence of biodegradation or water-washing. High Pr/Ph ratios >7, a slight to moderate odd-over-even predominance for high molecular weight n-alkanes and a predominance of C29 over C27 and C28 steranes indicate terrestrial source rocks for all of the oils. Biomarker and aromatic maturity parameters suggest that the oils were generated in the peak oil window (VRE ˜ 0.8– 0.9%), with the POs being slightly more mature. Although there is a close similarity between the FIOs and the POs, and although the composition of the FIOs is almost identical, subtle differences indicate either that the POs were generated from a slightly different source rock facies compared to the FIOs, or that early expelled oil had a different biomarker composition. Source-related differences can be seen in the higher content of angiosperm-derived biomarkers in the POs compared to the FIOs, including oleanane and various A-ring degraded isomers [de(A)-oleanane, de(A)lupane and de(A)-ursane], and consequently a lower angiosperm/gymnosperm index (AGI) for the FIOs. Tricyclic terpanes occur in greater abundance in the FIOs compared to the POs. This suggests an early diagenetic influence of marine, saline water, followed by a reworking of organic matter by halophilic bacteria, and is consistent with early generation from a marine-influenced coal. Overall the fill history of the McKee oil field is relatively simple, but the composition of hydrocarbon charge to the McKee oil field has changed over time. Two charge phases can be differentiated in the McKee oil field. An early petroleum change still preserved in the FIOs was sourced from coaly source rocks infiltrated by marine water and reworked by halophilic bacteria. The close similarity of the two FIOs indicates that they were trapped from the same palaeo-oil column, located in the current gas zone tested by Toetoe-2. Over time the reservoired oil has been displaced by gas and diluted by a second oil charge from a somewhat different type III source rock facies that lacked the early diagenetic marine influence. However, the close range of AGI and the similarity of many geochemical features points to a local source within the Palaeogene Kapuni Group. The differences between the FIO and the PO could reflect early generation from source rock intervals containing the more labile kerogen, which can be found in marine influenced coals, with the main oil charge being sourced from sections lacking this marine influence and requiring higher maturity levels to achieve
2002 New Zealand Petroleum Conference Proceedings • 24-27 February 2002
221
expulsion into the carrier bed. The analyses of these FIOs has enabled a more comprehensive description of the hydrocarbon charge history, and whilst only relatively subtle changes to the interpreted filling history are inferred the similar results underpin the reliability of the MCI technique, allowing more confident application in areas where there are more major geochemical differences between inclusion and production oils.
222
Egm
N
km
25
Tara ta
M ob
ile
Be
lt
Fault
0 Kapuni
Study area
Man a
ia
er n st Ea
Fault
Zone Tariki
Ahuroa
Waihapa Ngaere
e Maui
McKee
Taranaki
Zon e
Ngatoro
ont
le P
Fau
Kaimiro
Thrust
lt
lat f
orm
Zon e
The Taranaki Basin (Fig. 1) extends over and offshore of the Taranaki Peninsula of New Zealand’s North Island and contains a predominantly terrigenous Late Cretaceous to Holocene succession, with an estimated maximum thickness
Ca p
Concerns about the comparability of geochemical data obtained from the analysis of petroleum inclusions and crude oils have been raised by the fact that inclusion oils have sometimes been shown to be substantially different to presently reservoired oils (e.g. George et al. 1998a; 1998b). Thus, one might argue differences in the composition of inclusion and crude oils reflect differences in the nature of the sample rather than genuine differences between different oil charges. A number of processes are conceivably the reason for such differences, including the fractionation of oil during trapping of inclusions. Some fractionation has been shown to occur during inclusion formation, both by laboratory experiments (e.g. Stasiuk and Snowdon 1997) as well as studies on a suite of naturally occurring oil inclusions (Pang et al. 1998).
Geological setting and samples
rn Sta b
Oils trapped in fluid inclusions commonly occur in presentday and palaeo oil columns, and the analysis of these fluid inclusion oils (FIOs) offers a unique opportunity to gather information on the development of the petroleum composition over time. Numerous geochemical studies have shown source and maturity differences between production oils and FIOs (e.g. Karlsen et al. 1993; George et al. 1997a, 1997b; Isaksen et al. 1998). Most of these studies have indicated a lower maturity for the FIOs compared to the associated production oils. Therefore it is likely that oil inclusions are mainly trapping oil from a first charge of petroleum. The reason for this time-specific trapping of firstcharge petroleum is probably due to the dependence of inclusion cementation during diagenesis, because diagenetic processes often slow down once a certain threshold of petroleum saturation is reached (e.g. Worden et al. 1998).
In this study, analyses have been conducted on samples of production oil and compared with palaeo-oils trapped as fluid inclusions within the sandstone reservoir. A combination of petrographic and geochemical techniques has been applied to produce a more comprehensive evaluation of the filling history of the McKee Field.
ste
The composition of reservoired petroleum may be the result of a complex charge history, where oils from different source rocks have contributed petroleum charges over a wide maturity spectrum. Over geological time, petroleum charges of different composition tend to form a homogeneous mixture (England et al. 1987). In addition, early petroleum charges may have been lost due to seal leakage, tilting, or displacement by subsequent gas charges. All these processes make it difficult to analyse a charge history based on the composition of reservoired or residual oils alone. Therefore, it is desirable to compare the present-day geochemical composition of petroleum with the composition of palaeooil charges.
In this study we will show that comparison of FIOs and crude oils will yield similar results in case histories where there were only minor changes in the composition of early and late petroleum charge during the fill history of a petroleum reservoir. The fluid inclusion geochemical data have been obtained using the Molecular Composition of Inclusions (MCI) technique, following a standardised sample work-up procedure and where rigorously tested against system blanks to rule out the possibility of background contamination. Therefore, this gives confidence in data where more major differences in the composition of FIOs and crude oils have been detected, and where inclusion oils have been analysed using the same analytical procedure.
We
Introduction
Kupe South
Figure 1: Location map of the Taranaki Basins with major tectonic elements and oil and gas fields.
of ca. 8 km. Most of New Zealand’s oil discoveries occur in this basin, and are commonly accompanied by large volumes of gas and condensate. So far all petroleum discoveries have been associated with structural traps developed in the Neogene (Killops et al. 1994). In the “Eastern Mobile Belt”, extensional structures of the Late Cretaceous-Early Tertiary
2002 New Zealand Petroleum Conference Proceedings • 24-27 February 2002
Figure 2: GOI results for Toetoe-2 relative to gamma, caliper and resistivity logs. The threshold for oil accumulation is empirically derived from a database of GOI values from known oil fields (Eadington et al. 1996).
period are overprinted by an inversion dated as Early Miocene (King and Thrasher 1992). The McKee oilfield (PPL 38705) was discovered during drilling of the McKee-2A well in 1980 and is situated in an onshore compartment of the “Eastern Mobile Belt” (Fig. 1).
Petroleum in the McKee oil field is reservoired in the siliciclastic Eocene sediments of the McKee Formation. Previous geochemical studies suggest that the Eocene Mangahewa Formation is the source of petroleum reservoired in the stratigraphically overlying siliciclastic sediments of the McKee Formation (Cook 1988; Killops et al. 1994).
2002 New Zealand Petroleum Conference Proceedings • 24-27 February 2002
223
3
Toetoe-2 inclusion oil at 2103 m (177.5 ng C 12-C 36 n-alkanes / g rock) Toetoe-2 inclusion oil at 2154 m (58.9 ng C 12-C 36 n-alkanes / g rock) Toetoe-2D crud e oil (alip hatic hyd rocarbon fraction) Toetoe-1A crud e oil (w hole oil)
ox
id
is i
ng
M
U AT
O
N
Legend: Toetoe-2 FIO 2103 m Toetoe-2 FIO 2154 m Toetoe-2D cru d e oil Toetoe-1A cru d e oil
1
80
Pristane/n-C 17
Relative abund ance (%)
10 0
TI RA
60
0.5
40
n l ge s r ia r o a l st I k e co e ic r r II te p e u m ty d h n a
r ke II I-I s I p e re t y ix t u m
20
og
en
, en og , g e n cin II a r i d u e e m r p t y g a l, g ly al r on t s r ke
0
12
15
20
25
30
36
O BI
RA
I AT
O
N
g e cin lin d u er sa e r p hy
0.1 0.5
0.1
Carbon num ber of n-alkane
D
EG
D
1
2
Phytane/n-C 18
Figure 3: Normalised n-alkane profiles of FIOs and production oils from the Taranaki Basin.
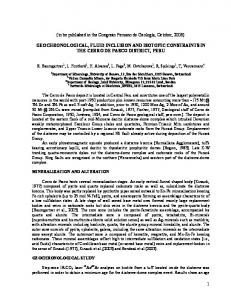
Figure 4: Distribution of pristane/n-C17 versus phytane/n-C18 for the FIOs and production oils from the Taranaki Basin. Interpretation fields adopted from Hunt (1996, p. 542).
However, the production history of the undercharged McKee oilfield shows a complex reservoir geometry, and indicates substantial compartmentalisation (Rickard 2000). Analyses conducted in this study have focused on the most crestal part of the accumulation, tested by the Toetoe section of the field. The Toetoe hydrocarbon accumulation was initially considered separate from the McKee Field, but the results of more recent drilling has confirmed the connection between the Toetoe area and the rest of the McKee Field (pers. com. David Waghorn, Fletcher Challenge Energy Ltd, 2000).
acid) disintegrated, and quartz grains were separated from other lithologies using magnetic separation. Potential surface contaminations on the quartz grains were removed using successive treatments of solvents, hot hydrogen peroxide and chromic acid, and quartz grains were not crushed until a final outside solvent rinse was analysed and deemed to be clean. The quartz concentrates were crushed under solvent (dichloromethane) to release oil from the inclusions into the solvent (off-line analytical technique). For each FIO extract the level of background contamination was determined by preparing and analysing a system blank under exactly the same conditions.
Methods To elucidate the filling history of the McKee oilfield, two fluid inclusion techniques have been applied. The evaluation of fluid inclusion populations contained in these samples was initially achieved by petrographic evaluation of thick sections (70-80 µm) prepared from selected core and cuttings samples. The abundance of oil inclusions was determined for each sample using the Grains containing Oil Inclusions (GOI) technique of Eadington et al. (1996). These analyses allowed samples with abundant oil inclusions to be identified for subsequent geochemical analysis of the included oil. Following petrographic analysis, two cuttings samples were selected and their FIOs were extracted for detailed geochemical analysis. These were then compared with the geochemical composition of production oils taken from the Toetoe-2D (sampled in August 2000), and Toetoe-1A wells, both located in the south-western part of the McKee oilfield. The oil trapped within inclusions in quartz grains of the reservoir sandstone was extracted and analysed according to the MCI technique. A detailed description of this technique is provided in George et al. (1998c). Briefly, the core or cutting samples were mechanically (using mortar and pestle) and chemically (using hydrogen peroxide and hydrochloric 224
The FIOs and production oils were analysed by gas chromatography-mass spectrometry (GC-MS) using an AutoSpecQ system (George et al. 1998c). The GC was fitted either with a DB5MS or a DB5 60 m fused silica column (i.d. 0.25 mm, film thickness 0.25 mm). Quantification was carried out using single ion monitoring (SIM) and metastable reaction monitoring (MRM). Peak identifications of diterpanes and A-ring degraded angiosperm markers were verified using mass spectra from magnet-scan runs (50-550 amu).
Petrographic results Three sandstone samples from the currently gas-bearing reservoir tested by the Toetoe-2 well were selected for GOI analyses. All three samples have high GOI values, ranging from 7.2% to 21.8% (Fig. 2). These values are above an empirical threshold for oil accumulation (Eadington, et al. 1996) and are interpreted to reflect the presence of a palaeooil column within these currently gas filled sandstones. Early oil accumulation, subsequently displaced by a later gas charge, represents the likely charge history. The lack of the samples with GOI values consistent with high water saturation (GOI 7 for all samples (Table 1), consistent with a terrestrial, oxic source facies for all of the oils (Fig. 4). The Pr/n-C17 and Ph/n-C18 ratios are
Table 1: Geochemical parameters based on saturated hydrocarbons.
Pr/Ph ‡
Toetoe-2 FIO
Toetoe-2 FIO
Toetoe-2D
Toetoe-1A
(2103 mRT)
(2154 mRT)
crude oil
crude oil
9.3
7.5
7.9
8.4
Pr/n-C17 ‡
1.92
1.58
1.19
1.32
Ph/n-C18 ‡
0.19
0.19
0.15
0.16
CPI
1.25
1.24
1.19
1.18
8β(H)-drimane/n-C15 ∆
0.010
0.007
0.007
0.005
8β(H)-homodrimane/n-C16 ∆
0.017
0.014
0.009
0.022
8β(H)-phyllocladane/n-C20 ∆
0.004
0.0013