The User’s Satisfaction of Graphic User Interface in Designing for Health Care Mobile Application Orawit Thinnukool1 and Noodchanath Kongchouy2 1
Department of Modern Management and Information Technology, College of Arts, Media and Technology, Chiang Mai University, 50200, Chiang Mai, Thailand. 2 Department of Mathematics and Statistics, Faculty of Science, Prince of Songkla University, 90100, Songkhla, Thailand.
[email protected]
Abstract—Health Care Mobile Application (HCMA) is a popular mobile application which is nowadays used to assist in the treatment of symptoms for patients in primary healthcare. Appropriate development processes, in terms of designing characteristics for the graphic user interface (GUI) is a hot topic for developers when involved with design. Graphics, color scheme, size, buttons, menu, navigational functions, and screen space are important points that need to be considered when designing an application. User characteristics such as age range is a main variable which directly affects user satisfaction and system acceptance. Therefore, it is important to determine how to develop appropriate GUI in HCMA for a variety of user characteristics simultaneously increasing user satisfaction. The aim of this study is to test five different layouts of the GUI, design level and elasticity of the GUI and depth level of smart phone screen. Numerous aspects of user satisfaction related to GUI will be illustrated. Based on the development of android operation system devices, satisfaction has been tested by statistical analysis to show which GUI-pattern is appropriately designed for each age range and which layout encourages or discourages the user in terms of satisfaction in the HCMA design. Index Terms—Graphic User Interface; Mobile Health Care; User’s Satisfaction.
I. INTRODUCTION Nowadays, smart-phones or cell-phones can be operated by a variety of operating systems, such as Android, iOS, Windows or Symbian [1]. Advanced technology in mobile phone manufacturing has improved the size and the material of the phone, and this improvement has direct effects on end-users. The size of smart phones has decreased and stronger materials are now used in its production. According to the report by Ericsson, it is estimated that there are 2.6 billion smart-phone subscriptions in the world today and the number will increase to 6.1 billion smart-phones in worldwide circulation by 2020 [2]. Several researchers reported in their publications that the purposes of mobile phone are communication using voice and text, multimedia, as well as using applications to meet their needs [3]. Analyses of various operating systems on the market show that Android dominates the market with a share of about 85% [4]. Android is an operating system with open source code released by Google under open source licenses. Numerous applications are available to end users via Google Play store. Applications can be grouped into entertainment, education, medical, game, continence application, etc. The majority of the applications provide useful functions to handle and support the needs of end users. The increase of mobile applications for health care in the market over the last
decade has encouraged developers around the world to develop applications to support health care [5]. The main purpose of such applications is to provide initial health care for users in the treatment process, as well as to avoid errors and monitor patients [6-10]. The benefit of the application is that it helps people to be concerned and interested in health care. For this reason, HCMA has become popular. While in the past people consulted a doctor if they experienced any unpleasant symptoms, nowadays people usually use a search engine or an application to match their symptoms to a disease. HCMA displays information related to the symptoms and can help users by providing preliminary health care, which has no risk for treatment. HCMA is a convenient tool to use, but it has some limitations. Pharmacists were surveyed to discover whether they have any smart device or application to use when suggesting a treatment or medication. It was found that some pharmacy shops have a system to track sales only, while other pharmacy shops have no systems in place. Some pharmacists had applications that allow them to refer to other pharmacies for information about medications. However, some users (typically the age group which is not used to handling mobile applications) rarely used the application because of inconvenience. Some texts in the application is small, whereas pictures that display information are large and some functions are challenging to use. On other hand, when suggested to young people, they appreciated the GUI functions, but did not give any positive feedback. This has resulted in the discontinuation of the use of this application at pharmacies. It is clear that the application did not meet user needs, which directly affected user’s satisfaction. The question of developing an application that would satisfy users of various ages remains. Specifically, the question is how to design HCMA in a way that will increase user satisfaction when they use it. User’s satisfaction has been defined by Philip Kotler as a personal feeling associated to something such as a services or products [11][12]. Positive reactions equate to the encouragement to purchase, trust and use of application. Satisfaction relates to end-user’s confidence, especially in health care, due to the need for accurate information. Thus, a health care mobile application needs to be developed cautiously, especially the elements of the GUI which directly affect user’s convenience. Nowadays, designing a mobile application presents a powerful challenge to developers. The elements on the screen such as color, size, and design affect user satisfaction [13]. Useful information that can facilitate developers is paramount because it directly affects user’s satisfaction. Reports of
e-ISSN: 2289-8131 Vol. 9 No. 1-5
11
Journal of Telecommunication, Electronic and Computer Engineering
mobile optimization from well-known online sources highlight the important points that can increase the number of users [14]. A responsive design is a characteristic of an application that can automatically resize and adjust the appropriate display elements on screen via each device’s screen. Each development has been designed so that GUI has a different purpose for the end-user. The majority of the developers agreed that the size of the screen directly affects the screen space and the size of each element on the screen such as button, textbox, font size, etc. [15][16]. The elements that are put on the screen in the application are symbols that convey communication between the user and the system. Graphics, color, size, buttons, menu, navigational function, and screen space are important aspects that need to be considered when designing the application. Android is different from iOS: screen contrast, sensitivity, speed, and device standard do not perform like iOS, especially in GUI design. Thus, when designing GUI for Android, the appropriate design will be directly indicated by user’s satisfaction. Moreover, the users’ confidence will increase when they appreciate the design of the GUI, especially with the HCMA. The focus of this research is how to design an appropriate GUI for HCMA. The research will address the following questions: 1) Which GUI-layout is appropriately designed and 2) Which layout encourages or discourages the end users in terms of their satisfaction in the HCMA design. Our research collected information from the questionnaires which were completed by users after they had tested the applications in each GUI layout. The results of user’s satisfaction have been analyzed by statistical methods to show the user’s satisfaction and correlation between age ranges of users. In this paper, the results from the study will indicate aspects of design and development for user age ranges by useful graphical information, such as a bar chart and bubble plot. Thus, this paper might be appropriate for a beginner developer when developing a prototype.
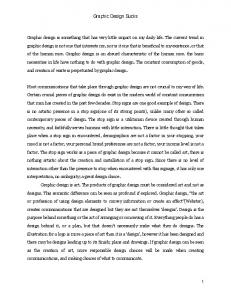
only displays information for suggestions on health care. B. Methodology The conceptual framework for our study is divided into three parts. In the first part, the design of the graphic user interface, involving which layout users appreciate, and find convenient, is ascertained. Five patterns of the GUI have been simulated with a smartphone while taking the questionnaire. In the second part, the sample size was calculated, and the questionnaire was checked for consistency and accuracy between the questions and purposes of the questions. Finally, in the third part, statistical analysis was used to analyze the correlation of user satisfaction based on specific criteria. Designing Graphic User Interface. Three levels of depth of the application indicate the application’s structure regarding the graphic user interface as shown in Figure 1. The first type includes main page (depth level 1), which shows the graphical display to introduce or show the details, such as the main page or icons to travel within the application. Depth level 2 contains the working area of the application, which is associated with functional tasks from level 1 and displays the working area. In depth level 3, we assume that the applications have more than one level to show each detail or sub-function from level 2. Figure 2 indicates three main pages of the application, which were displayed immediately when a user opens the application. The small icons are represent the tasks in the application. The graphic user interface pattern is as follows; the first panel displays 3 columns, 4 rows (GU-M01), whereas the middle panel shows bigger icons (bigger than the first one), and the last one is the main page that indicates even bigger icons (bigger than GU-M01), and GU-M03 indicates the icons that can slide up and down to show the function tasks.
II. EXPERIMENTAL A. Characteristics of the Health Care Mobile Application (HCMA) Nowadays, the increasing number of mobile devices associated with health care mobile application shows that it is now a popular tool as people around the world find it interesting. The estimated number of health care applications released in the market is more than 40,000 [17]. Mobile health care is a subset of eHealth, which has been defended by Free C., et. al. [18] for the use of mobile computing technology and communication in health care and health publications. Preethi, R.S. defines the characteristics of HCMA, which contains a function for treatments, for example the self-monitoring tools can suggest treatment information to a patient [19]. The development of the HCMA can increase the number of mobile health applications. The HCMA operates on various platforms, such as smart-phones, PDAs, tablets computers, and so on. These devices can support the HCMA’s functions, which depend on the operation system (Android, iOS, Windows phone). For this reason, HCMA is convenient and provides easier access to health care information at any time and place, and this leads to an increased number of end-users. This research is focused on the GUI of the HCMA, which
12
Figure 1: Depth levels of designing the graphic user interface of the health care mobile application have been designed for illustration application structure
e-ISSN: 2289-8131 Vol. 9 No. 1-5
The User’s Satisfaction of Graphic User Interface in Designing for Health Care Mobile Application
Figure 2: Three main pages of patterns for ascertaining a suitable main page for a graphic user interface for the health care mobile application on depth level 1
Figure 4: The examples of GUI of each layout were installed in a mobile device (ASUS Zenfone)
Sample. The sample was obtained by a stratified (by age) random technique. The selected survey participants took the questionnaire when buying medications at pharmacy in Chiang Mai city. The number of respondents in our study was 129, (62 males and 67 females). The number of sample is of an appropriate size because the total number of pharmacy in Chiang Mai city is 87, according to the Bureau of Drug Control (2015). Table 2 shows the details of sample based on gender, whereas Table 3 shows the age range of respondents. Table 1 Distribution of Gender of the Sample Sex Male Female Total
n 62 67 129
Percentage 48.1 51.9 100.0
Table 2 Age Range of the Sample Age range 15-20 21-25 26-30 30-35 36-40 41-45 46-50 Total
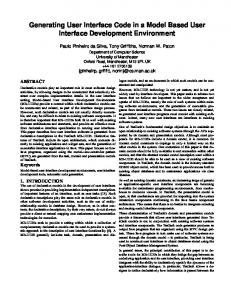
Figure 3: Five GUI pattern models in health care mobile application, which is used for simulation
Figure 3 shows layout of the function tasks in the GUI, namely the static screens in both GU-A01 and GU-A02, whereas, GU-A01, GU-A02, and GU-A03 show the working area with 100% proportion of the screen horizontally, and vertically at 80%. The last three are dynamic screens that can slide up and down; the proportion in vertical mode is 100% and horizontally is 80% except in GU-A03. GU-A01 and GUA02 show the screen pattern on a static screen which has been fixed appropriately on a mobile device screen. GU-A03 is designed in a dynamic pattern which shows icon adjustment when the user touches on the menu icon. GU-A04 shows the icons that have been designed on the right hand side of the screen and working area, located on the right hand side of the screen. GU-A05 show the icons and working area (task area) like list card pattern and the user can slide it up and down. Figure 3 shows the difference on the screen of each design. Five layouts have been created based on the popular screen size nowadays that is 4 to 4.49 inches [20][21]. ASUS Zenfone is an example device to display the elements on the screen similar to Figure 3, where the survey participants fill in the questionnaire. Figure 4 shows an example of simulation developed on the mobile device for survey participants when answering the questionnaire.
n 36 20 14 14 16 13 16 129
Percentage 27.9 15.5 10.9 10.9 12.4 10.1 12.4 100.0
Hypothesis. The purpose of the research is to find a suitable GUI to display the information. Five layouts of GUI and depth levels were tested to obtain the correlation between the layouts of GUI and the age ranges, and the depth level and age range. The hypotheses which show the correlation and differences of user satisfaction are as follows; i. All age ranges of survey participants have a similar satisfaction trend in depth level layout. ii. Static screen and dynamic screen give different user’s satisfaction. The Data Analysis. Both descriptive and inferential statistics were used in this study. Descriptive statistics analyzed research questions (i) using t-test, One-way ANOVA (ANalysis Of VAriance). The post-hoc Tukey HSD (Honesty Significant Difference) Test calculator was used to compare the multiple treatments Analysis with the 0.05 significant levels when the data is normal and homogeneous. F0requency and percentage of the user acceptance were used for research question two (ii). These methods were analyzed by R program version 3.23.
e-ISSN: 2289-8131 Vol. 9 No. 1-5
13
Journal of Telecommunication, Electronic and Computer Engineering Table 3 Questions Asked to the Respondents of User's Acceptance Item Easy to touch Clear screen Easy to read text Easy to see picture Easy to type Easy to find Easy to understand function Appropriate menu size Appropriately designed GUIs Appropriate proportion of working area
Details The elements in screen are easy to touch? (such as button, icon menu) Each screen pattern is clearly visible, clear with eye contact Text size in each screen easy to read The picture in each screen is easy to see Each screen pattern allows easy typing Each screen pattern is easy to find, such as the button to access in each function. Each screen pattern is immediately understood such as direction to move in the application Menu size on the screen is appropriate to see and touch The GUI design is appropriate The proportion of the working area allows for a convenient operation
the application should have more level depth, hence allowing it to provide beneficial information. A few of age group females (A5, A6, A7) have low satisfaction for using applications that have more level. Table 4 Compare User’s Acceptance in Three Main Page Patterns between Sex and Age Group by using Tukey Method Factor Sex: Female Male Age group: (A1):15-20 (A2): 21-25 (A3): 26-30 (A4): 30-35 (A5): 36-40 (A6): 41-45 (A7): 45-50
n
GU-M01 mean sd
GU-M02 mean sd
GU-M03 mean sd
67 62
4.1a 4.0a
1.0 1.0
3.9a 3.8a
1.1 1.0
3.5a 3.9b
1.2 0.9
36 20 14 14 16 13 16
4.9a 4.6ab 4.4ab 3.9bc 3.3cd 2.9cd 3.2d
0.4 0.6 0.5 0.9 1.3 0.5 0.7
4.9a 4.5a 4.9a 3.1b 2.7cb 2.7cb 2.5c
0.4 0.6 0.4 0.5 0.6 0.5 0.5
4.4a 4.7a 4.2a 3.4b 2.4bc 3.2bc 2.5c
0.6 0.6 1.0 1.2 0.5 0.8 0.6
III. RESULTS AND DISCUSSION This section covers an overview of acceptance displayed in interval plot as shown in Figure 5.
Figure 6: 95 % confident interval of the mean user’s acceptance in depth levels of designing on graphical user interface compare with age group and sex of the users Figure 5: 95 % confident interval of the mean user’s acceptant in three main page patterns compare with age group and gender of user
The main page patterns were compared with age group and gender of users in each GUI pattern. In Table 4, the first comparison was between GUI and gender. The result shows that there was no difference in the user’s acceptance between gender, which means there was an agreement between males and females with each GUI. With respect to age range, there was no difference in user acceptance for age group A1. However, there was a different in user acceptance for age group A2 and A3. Users appreciation on GU-M01 differ based on user’s acceptance. There was no difference in the appreciation on GU-M02 and GU-M03 for group A4. The result shows that each age range has 95 % confident interval of the mean user’s acceptance in three user acceptance. This means they like GU-M01. A05 and A06 show not difference in user’s acceptance for each GUIs, implying that they like GU-M01 more than the other GUIs. A7 has different user acceptance in each of GUIs patterns, in which their highest satisfaction is on GU-M01 in comparison to the other GUIs. Figure 6 shows the result of user acceptance based on the depth levels of designing on graphical user interface by comparing the age group and gender of the users. The result shows that for depth 1 and depth 2, there was disagreement between the age group and female (A5, A6, A7). The majority of the sample, particularly the males and females agreed that
14
Table 5 Results from t-test, ANOVA and Tukey HSD to Compare Mean in Depth Levels of Designing on Graphic User Interface between Sex and Age Group
Factor Sex: Female Male Age group: (A1):15-20 (A2): 21-25 (A3): 26-30 (A4): 30-35 (A5): 36-40 (A6): 41-45 (A7): 45-50
n
Depth Level1
Depth Level2
Depth Level3
mean
sd
mean
sd
mean
sd
67 62
2.9 a 3.21a
0.9 1.0
3.6a 4.2b
1.2 1.0
4.4a 4.6a
0.9 0.6
36 20 14 14 16 13 16
3.3a 3.3a 3.23ab 3.0ab 3.15ab 2.5ab 2.3b
0.9 1.1 0.7 1.1 0.9 0.9 0.6
4.3a 4.6a 4.2ab 4.0ab 3.6abc 3.2bc 2.8c
0.9 0.8 0.9 1.0 1.3 1.4 1.2
4.6a 4.8a 4.6a 4.6a 4.3a 4.2a 4.1a
0.5 0.4 0.5 0.5 1.2 1.2 1.1
When we tested the differences between females and males, the results show that user’s satisfaction levels were different depending on the gender. Females agreed with the two-level depth application, while males preferred the application with more depth levels. When we tested each age group, group A1 and A2 were not different in terms of user acceptance. Group A3 and A4 agreed with depth level 3, whereas group A5, A6 and A7 have different user’ satisfaction for each level. Table 6 shows the results of user acceptance in each GUI pattern. A3 agreed that GUI meets user’s needs in several points, while A05 were satisfied with the screen design and the easy reading text experience. A04 admitted that the design
e-ISSN: 2289-8131 Vol. 9 No. 1-5
The User’s Satisfaction of Graphic User Interface in Designing for Health Care Mobile Application
of GUI and working area are useful, while A02 were satisfied only with the easy touch option.
and Technology, Chiang Mai University for funding the academic publication.
Table 6 Percentage of user acceptance in each GUI
REFERENCES
Item A01* A02* A03** A04** Touch 1(0.8) 46(35.7) 44(34.1) 28(21.7) Screen 19(14.7) 7(5.4) 31(24) 17(13.2) Reading Text 11(8.5) 9(7.0) 1(0.8) 34(26.4) See Picture 29(22.5) 20(15.5) 60(46.5) 15(11.6) Typing 3(2.3) 34(26.4) 65(50.4) 15(11.6) Finding 27(20.9) 7(14) 18(14) 67(51.9) Function 28(21.7) 6(4.7) 11(8.5) 69(53.5) Menu Size 2(1.6) 6(4.7) 62(48.1) 36(27.9) Working Area 18(14) 6(4.7) 40(31) 43(33.3) Design GUIs 17(13.2) 8(6.2) 42(34.1) 44(34.1) * Group of Static screen / ** Group of dynamic screen
A05** 10(7.8) 55(42.6) 74(57.4) 5(3.9) 12(9.3) 10(7.8) 15(11.6) 23(17.8) 22(17.1) 18(14)
[1]
[2]
[3]
[4]
IV. CONCLUSION [5]
The research aimed to find which aspects make a suitable design for the HCMA. Statistical analysis shows that the static screen and the dynamic screen each give a different satisfaction according to the age of the respondent. The result of statistical analysis claims that the first hypothesis is rejected based on the following findings: i. Sex and age ranges of respondents have a similar acceptant trend in depth level pattern Thus, sex and age ranges provide different user acceptance. The second hypothesis is accepted as follows: ii. Static screen and dynamic screen give different user’s acceptance levels when users agree with group of dynamic screen more than Static screen. Moreover, the depth level of the application affects user’s acceptance, which means users still found the application convenient. Regarding the details of a suitable design for the HCMA, these important suggestions follow: i. Depth level in the application affects user’s acceptance because user can specify a function in application. ii. The GUI pattern was received by each age range differently and the majority finds that the dynamic screen design is more appropriated than the static screen. iii. The age range of 15 to 30 years appreciated a dynamic screen pattern whereas the age range of 31 to 50 years appreciated the static screen pattern. iv. Dynamic screen provides more visibility and consistency than the Static screen. v. Dynamic screen has an appropriate menu size and provides easier access for browsing pictures, reading and typing texts, searching information than the static screen. vi. The GU-A5 uses a simple design and provides convenient reading experience for users. As discussed, in terms of preliminary design for the health care mobile application (HCMA), developers finds many positive points which motivated for further development of useful applications, especially the applications associated with health care.
[6]
[7]
[8]
[9]
[10]
[11]
[12] [13]
[14]
[15]
[16]
[17]
[18]
[19]
[20]
ACKNOWLEDGMENT The authors would like to thank the College of Art Media
International Data Corporation (IDC), IDC Press Release Worldwide Smartphone 2015-2019 Forecast and Analysis, according to IDC. (2015), Retrieved on May 2, 2015 from http://www.idc.com/getdoc.jsp?containerId=254912. Lunden, I., 6.1B Smartphone Users Globally By 2020, Overtaking basic fixed phone subscriptions. Techcrunch.com, (2015) Retrieved on May 3, 2015 from http://techcrunch.com\/2015/06/02/6-1bsmartphone-users-globally-by-2020-overtaking-basic-fixed-phonesubscriptions. Dehlinger, J., and Dixon, J., “Mobile application software engineering: challenges and research direction”, In: MobiCase 2011- Mobile Software Engineering Workshop, Santa Monica. 2001. Tim, H., “Android grabs record 85 percent smartphone share”, 2015. Retrieved on July 2, 2015 from http://www.pcworld.com/article/2460020/. Fiordelli, M., Diviani, N., and Schulz, P.J., “Mapping mHealth research: a dcade of evolution”, Journal Medicine Internal Res., vol.15, 2013, pp.95. Wang, H. Y., and Guo, Z. J., “Overseas mobile health information development”, Mod. Electron. Information Technology., vol.04, 2011, pp.10-14. Wang, H.Y., and Ma, L., “The Whole Intervention service model used in the rehabilitation of patients with schizophrenia”, Chin. Nurs. Manage, vol.04, 2012, pp.22-24. Guerri, J. C., Anton, A.B., Pajares, A., Minfort, M., and Sanchez, D., “A Mobile device application applied to low back disorders”, Multimedia Tools and Application, vol.42, 2009, pp.317-340. Li, J., Moore, N., Akter, S., Bleisten, S., and Ray, P., “Health for Influenza Pandemic Surveillance in Developing Countries”, In: Processing of 42rd Hawaii International Conference on System Sciences, 2011, pp.236-2375. Office of Disease Prevention and Health Promotion, National Action Plan to Prevent Health Care-Associated Inflection Road Map to Elimination, 2015. Retrieved on May 2, 2015 from http://www.health.gov/hcq/pdfs/hai-action-plan-ltcf.pdf. Hennig-Thurau, T., and Klee, A., “The impact of customer satisfaction and relationship quality on customer retention: a critical reassessment and model development”, Psychology and Marketing., vol.14,no.8, 1997, pp.737-764. Oliver, R. L., “Whence customer loyalty”, Journal of Marketing, vol.63, no.1, 1999, pp.33-44. Lee, Y. S., “Older Adults’ User Experiences with Mobile Phones: Identification of User Clusters and User Requirements”, Doctoral dissertation, 2007. Christian A., “Mobile Optimization: 4 Tips for Tapping into the Asian Market”, February 12, 2015. From: http://www.clickz.com/clickz/column/2394962/mobile-optimization4-tips-for-tapping-into-the-asian-market. Chen, H. M., Chen, S. Y., and Li. J. S., “User interface design and evaluation for a mobile application with travel news reader”, Lecture Notes in Electrical Engineering, vol.329, 2015, pp.197-204. Nilsson, G. E., “Design patterns for user interface for mobile applications. Advances in Engineering Software”, vol.40, no.12, 2009, pp.1318-1328. Rebecca, S., and Sarah, J. I., “Review and analysis of existing mobile phone applications for health care associated infection prevention”, American Journal of Infection Control, vol.43, no.6, 2015, pp.572-6. Free, C., Phillips, G., Galli, L., Watson, L., Felix, L., Edwards, P., Patel, V., and Haines, A., “The effectiveness of mobile-health technology-based health behavior change or disease management interventions for health care consumers: A systematic review”, PLOS Medicine, 2013, pp.2-45. Nanji, A., “Mobile Trends: Most Popular Phones, Screen Sizes, and Resolutions”, Marketing prof., 2014. Retrieved on May 3, 2015 from http://www.marketingprofs.com/charts/2014/25740/mobile-trendsmost-popular-phones-screen-sizes-and-resolutions. Wiredu, G., “User appropriation of mobile technologies: Motives, conditions and design properties”, Information and Organization, vol.17, no.2, 2007, pp.110-129.
e-ISSN: 2289-8131 Vol. 9 No. 1-5
15