tained by conventional light scattering. (Brice Phoenix Light Scattering Photom- ...... James, R. O., Davis, J. A., and Leckie, J. O.,. J. Colloid Interface Sci. 65, 331 ...
The Viscoelastic Properties of Ordered Latices: Experiments D. W. BENZING 1 AND W. B. RUSSEL Department of Chemical Engineering, Princeton University, Princeton, New Jersey 08544 Received October 10, 1980i accepted January 26, 1981 Osmotic pressures, shear moduli, and dynamic viscosities are reported for ordered polystyrene latices of three different particle sizes over a range of ionic strengths and volume fractions. The pressures and moduli increase by orders of magnitude with increasing volume fraction and decreasing radius or ionic strength. The dynamic viscosity remains within a factor of 2 of that for water for all conditions. The data are compared with calculations from the self-consistent field model presented previously by the authors and a pairwise additive theory in the literature. The tbrmer provides reasonably accurate predictions when the surface potential is obtained from electrophoresis measurements at an ionic strength equivalent to that in the concentrated suspension. The latter, in its original form, fails to predict the effect of added electrolyte on the modulus. INTRODUCTION
The elasticity of the ordered array in the equilibrium state can be detected by static As described in the preceding paper (1), or dynamic techniques. Crandall and Wilordered latices behave as linear viscoelastic liams (2) measured, by Bragg diffraction, solids when subjected to small-amplitude the vertical compression of the ordered deformations. Several experimental techstructure due to gravity. These elegant niques have been developed or adapted for experiments at very low volume fractions, measuring their mechanical properties, The t~ ~ 10 -4, indicated moduli as low as motivation for these studies stems in some 10 -~ N/m 2. For opaque suspensions at higher cases from the analogy between the latices concentrations the velocity of propagation and electron gases (2) or ordered biological systems (3); for others (4, 5) the intent is to of shear waves will determine the elastic probe interparticle forces in concentrated modulus. The pulse shearometer, built by Goodwin and Khidher (6) and used by suspensions. Osmotic pressures were measured first Buscall (7), operates at 300 Hz and detects with a compression cell (4, 5). The sus- moduli as low as 30 N/re. The resonance pension is confined between two mem- method of Okano and co-workers (3) embranes, one semipermeable and the other ploys a surface-loaded quartz torsional impermeable. Excess pressure on the latter oscillator at 70 kHz. The device has a forces electrolyte solution from the sus- sensitivity similar to the shearometer, but pension into the dialysate, providing a meas- the higher operating frequency lies beure of the osmotic pressure as a function yond the low-frequency plateau for the of the volume fraction. These instruments shear modulus, complicating the interpresense pressures above 102 N/m 2, including tation. Both techniques provide, in principle, those inducing coagulation at conditions estimates of the dynamic viscosity for the ordered suspension, but none are reported approaching closest packing. for the pulse technique and the values obtained with the torsional oscillator lie bePresent address: Signetics Corporation, P.O. Box 9052, Sunnyvale, Calif. 94086. low those of the fluid alone. 178 0021-9797/81/090178-13 $02.00/0 Copyright © 1981 by Academic Press, Inc. All rights of reproduction in any form reserved.
Journal of Colloid and Interface Science, Vol. 83, No. 1, September 1981
VISCOELASTIC PROPERTIES OF ORDERED LATICES TABLE I Latex Parameters NaC1 (mole/din ~)
u/E= (m2/V-sec)
aK
e$__..£.o kT
Latex A: a = 5.25 x 10-s m -10-6 10-5 10-4 10-~ 10-z 10-1
2.55 x 10⁻⁸ 2.53 2.50 2.45 2.38 2.06 1.38
0.053 0.167 0.53 1.67 5.3 16.7 53
2.20 2.17 2.11 2.01 1.82 1.38 0.85
179
the membrane osmometer and the oscillatory viscometer used for the mechanical measurements. Both devices are considerably more sensitive than those described above. Finally we discuss the results in detail, comparing them with both the self-consistent field model (1) and the pairwise theory (6). The success of the former and the failure of the latter indicate how a modified pairwise additive, or mean-field, theory might be developed. EXPERIMENTAL METHODS
Latex B: a = 1.83 x 10⁻⁷ m --
10-6 10-5 10-4 10 ~ 10-2 10-1
1.92
x
10 -8
1.90 1.86 1.81 1.74 1.52 0.93
0.19 0.61 1.9 6.1 19 61 190
1.64 1.60 1.52 1.36 1.15 0.93 0.55
Latex C: a = 4.33 x 10⁻⁷ m --
10-6 10 5 10-4
7.6 × 10⁻³ 7.5 7.3 7.0
0.46 1.45 4.6 14.5
0.64 0.62 0.57 0.47
Our objectives for the experimental program were twofold: (1) complete characterization of the latices including their electrostatic properties at infinite dilution and (2) measurement of all three viscoelastic p r o p e r t i e s - - o s m o t i c pressure, shear modulus, and dynamic v i s c o s i t y - - u n d e r the conditions assumed in the theory (1). The existing data do not suffice. Neither electrophoretic mobilities nor titration curves are reported and no single study involves all three properties. These measurements have now been performed for latices of three different sizes at volume fractions and ionic strengths ranging from completely disordered suspensions to ordered systems with quite significant elasticities. In the next 'section on experimental techniques we describe first the synthesis and characterization of the latices and then
Preparation and Characterization of the Latices Monodisperse polystyrene latices of three different diameters were used in this study. I. R. Krieger of Case Western Reserve donated Latex A; we synthesized Latices B and C by a surfactant-free process of Krieger (8) with K2SO4 as the initiator. Each was subsequently ion exchanged with Rexsyn 1-300 (Fisher Scientific) to remove free electrolyte. Volume fractions were determined gravimetrically. The particle sizes (Table I) were obtained by conventional light scattering (Brice Phoenix Light Scattering Photometer). The mean radii a and the standard deviations were deduced from the positions and amplitudes of the extrema in the angular spectrum via the technique of Wallace and Kratohvil (10). Electrophoretic mobilities u/E~ at 25°C were measured directly by microelectrophoresis (Apparatus Mark II, Rank Brothers, Cambridge, England) at infinite dilution for a range o f NaC1 concentrations, p H was not controlled. The cylindrical cell was emp l o y e d with platinum electrodes. The dimensionless surface potentials e~bo/kT (Table I) were evaluated from H e n r y ' s equation (10), which conforms to the full numerical solution under these conditions (11). The values decrease monotonically with increasing ionic strength or decreasing Debye length K-1. kT is the thermal energy Journal of Collold and Interface Science, Vol. 83, No. 1, September 1981
180
BENZING AND RUSSEL
or Boltzmann temperature electronic charge.
and e the
Membrane Osmometer
The membrane osmometer fabricated for this w o r k was patterned after that of Vilker et al. (12). Our cell coincides exactly to Fig. 2 in their paper. The associated high-pressure control system proved unnecessary with latices, however, since osmotic pressures could always be observed directly as the height of a column of water. The Plexiglas cell consists of two cylindrical chambers separated by a membrane (MF-Millipore, with 0.10- or 0.22/xm pore) impermeable to the latices. A porous glass frit on the fluid side supports the membrane. Two small-bore capillaries, with 1.0-mm divisions, project from the top of the cell and communicate with the individual reservoirs. During measurements the entire cell was immersed in a constanttemperature bath maintained at 25.0 _ 0. I°C. Two considerations governed the procedure for the osmotic pressure measurements. First, for convenience in interpreting the results the average electrolyte concentration within the suspension (n) should conform as closely as possible to that in the corresponding measurement of viscoelastic properties. Second, the slow rate of mixing within the solution chambers dictates that solvent transport through the membrane be minimized during the approach to equilibrium. The former condition was approached by adjusting the salt concentrations on the fluid side no to (n) no
-
1-4,
This accounts for the particle volume fraction 4, excluded to the ions but not for the presence of counterions. The latter consideration required judicious filling of the capillaries to the expected pressure difference before connection to the cell. This Journal of Colloid and Interface Science, Vol. 83, No. 1, September 1981
t~.1
-
-
BEAKERw/ SAMPLE
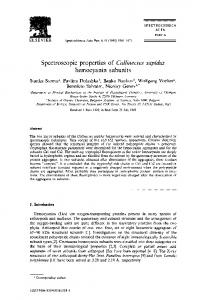
FIG. 1. Schematic of oscillatory viscometer from Konno et al. (13). combination provided liquid levels in the capillaries which remained constant over a 24-hr period, indicating true equilibrium values. The resulting osmotic pressures generally were measurable and reproducible to better than ___0.5 mm H20. Oscillatory V i s c o m e t e r
Measurement of the linear viscoelastic response, of ordered latices requires an instrument with rather specific characteristics. First, viscoelastic suspensions tend to become nonlinear at strains of a few percent, necessitating very small amplitude motions. Since the moduli less than 1 N/m 2 are of interest, the forces fall below the range easily measured directly. The domain of frequencies relevant to this work is rather modest though. As indicated by the theory (1) the low-frequency plateau for the shear modulus, or dynamic rigidity, obtains below a few thousand Hertz. Fortunately, a relatively simple instrument first reported by Konno et al. (13) and described further by Ferry (14) provides the desired sensitivity at these low frequencies. The device (Fig. 1) comprises a surface loaded resonance oscillator, similar in principle to that of Mitaku et al. (3), which detects the full mechanical impedence of the fluid. The thin glass or metal plate, immersed in a beaker of fluid maintained at 25.0 _+ 0.1ec by a circulating water bath (Haake Type F), is mounted via a metal rod to the coil of an audio speaker (Realistic, Radio Shack Inc.). The speaker
VISCOELASTIC PROPERTIES OF ORDERED LATICES is driven by a function generator (Hewl e t t - P a c k a r d Model 3311A) and the frequency monitored with a counter ( H e a t h Schlumberger Model SM109A). The phase shift between the input sine wave and the voltage drop across the coil is observed with a dual beam oscilloscope (Tektronix Model 551). Resistances are measured with a digital multimeter (Heathkit Model IM102). The response of the coil depends on its intrinsic impedance when clamped, Z0, the interaction between the static magnetic field of the speaker B and the time-varying current in the coil, and the various mechanical impedances. The last arise from three sources: the fluid in contact with the plate, Zm ; the resistance Rs and the elasticity k of the spider holding the coil in the speaker; and the inertia of the coil and plate. The total electrical impedance of the coil moving at frequency 6O consequently has the form (14)
H e n c e , the shear modulus G' and the dynamic viscosity 7' each depend on both components of the impedance. At resonance the output from the coils varies in phase with the input and the Lissajous figure formed by their trace on the oscilloscope collapses to a straight line. Then Xe = 0 and k - M6O2 Xm
A6O
for negligible X0. Measurements of the resistance of the moving coil Re and the resonance frequency 6Othen suffice to determine the two moduli once the various instrument constants are known. Calibration of the instrument involves measurements in air for which Rm = Xm 0, SO that 6O~ = k / M ,
[5]
R ° - Ro = (Bl)2/Rs,
[1] A Z m + Rs + i(M6O - k/6O) '
--
Re - R0
(Bl) 2
Ze = Zo +
181
and in several Newtonian fluids with G ' = 0 and ~/ = /x, so that
where I = length of the coil, A = surface area of the plate, M = mass of the moving parts.
M
6O
Re - Ro
R°
Ro
and
Each impedance, Z = R + iX,
(6o~ - 092)2
[2]
I { A ~2
- ~ )
p/x.
[6]
6O3
consists of a real part or resistance R and an imaginary part or reactance X. The properties of the fluid enter through Zm. For an infinite flat plate immersed in an infinite reservoir containing a linear viscoelastic fluid of density p, solution of the equations of motion for small-amplitude oscillations determines (14) R~ - X2m G;
_
P 2RmXm -q' - - p6O
[3]
The results for the four unknown parameters obtained with air and five different liquids (water, silicon oil, and several glyce r o l - w a t e r mixtures) are displayed in Table II. Note that two different speakers with plates differing in mass and area by a factor of 2 provide a modest range of frequencies, 200-350 Hz. The sensitivity of the device follows from [3]-[6]. Normally, (6O0 - to)/6O0 ~ 1 so that 1 A2(BI) 4 (Re
-- R ° ) 2 ~
2
-
-
R~
P6Oo'0'
Journal of Colloid and Interface Science, Vol. 83, No. 1, September 1981
182
BENZING
AND RUSSEL
T A B L E II Calibration Results (Bl)
Rs
M
~o
Speakers
Plates
[Wb/m]
[N-sec/m]
[10-3 kg]
[Hz]
Small
Small (A = 1.70 × 10 -3 m z)
0.322
0.048
1.35
209
0.109
2.21
200
0.085 0.180
2.98 3.83
349 336
Large (A = 3.41 × 10 ~ m 2) Large
Small Large
0.474
and ~o -
A oJn-
G' [7]
M 4(2oJ07'/p) 1/z
Here COnrepresents the resonance frequency for a Newtonian fluid with viscosity/z = 7'. These indicate that for our instrument 7' 10-3 N-sec/m 2 generates a 1-ohm reduction in resistance while G' - 1 N/m 2 induces a frequency shift of - 1 Hz. The electronics described above can detect resistances accurately to - 0 . 0 1 ohm and frequencies shifts to less than 0.1 Hz. For the measurement to reflect the bulk properties of the suspension, rather than the structure near the plate, the oscillations must penetrate many lattice spacings. Furthermore, the assumption of an infinite reservoir of fluid, implicit in [3], requires that viscous effects damp the motion before waves reflected from the walls return to the plate. The penetration distance is ( G'
/1/2 C '
comparable to the diameter of the beaker, - 5 0 mm, introducing some uncertainty at higher volume fractions. Nonetheless, with G' - 200 N/m 2, a reduction in the diameter to - 3 7 mm produced less than a 0.5% effect. Preliminary measurements with a fairly elastic sample (particle radius 5.25 x 10⁻⁸ m, volume fraction 0.20, no added salt) demonstrated the validity of the other assumptions in the analysis. First, the amplitude of the input signal had no effect on the moduli at settings below 75% of full scale on the function generator, assuring linear viscoelastic behavior. Edge effects, neglected in deriving [3], were discounted through measurements with plates of two different sizes. Furthermore, resonance frequencies of 245 and 365 Hz, obtained with plates of different mass, produced the same moduli, confirming the low-frequency limit. In all cases G' = 212.2 _ 0.4 N/m 2 for this sample, indicating the reproducibility of the measurements as well. DISCUSSION
OF RESULTS
General
× [1 +
l [1 + (1 + (097'/G')2)a/212J
"
[8]
With c o - 10~ sec -1, 7' ~ 10-~ N-sec/m2, and G' ~> 1 N / m z we find that S ~> 102 txm, easily satisfying the first condition. When G' exceeds -102 N/m 2, however, ~ becomes Journal o f Colloid and Interface Science, Vol. 83, No. 1, September 1981
Our measurements of the shear moduli for ordered polystyrene latices of several different particle sizes generally conform with those reported by Goodwin and Khidher (6), Buscall (7), and Mitaku et al. (3). The magnitudes, e.g., -102-103 N/m 2 for 0.1-/xm particles at a volume fraction
VISCOELASTIC PROPERTIES OF ORDERED LATICES of 0.3 without added salt, are comparable. Suppression of the electrostatic interactions by an increase in the particle size or amount of added salt, or the dilution of the suspension, markedly reduces the elasticity as expected. Precise quantitative comparisons with previously published results are not possible because of the unknown charges or potentials of the latices used in the latter. The present work couples a complete study of the shear modulus as a function of the volume fraction, particle size, and added salt with corresponding measurements of the osmotic pressure and dynamic viscosity plus characterization of the particles via electrophoresis, albeit at infinite dilution. As demonstrated in the following sections this data poses a comprehensive test for theories predicting the viscoelastic properties. Our data include no quantitative observations of the order-disorder transition. The intensity of the iridescence characteristic of the ordered system did correlate qualitatively with the magnitude of the shear modulus as expected, since disordered suspensions possess no static elasticity.
Effect o f Volume Fraction on the Surface Potential Since microelectrophoresis measurements are feasible only at infinite dilution, the electrical properties of the latices cannot be characterized directly at the conditions of interest. Electrostatic interactions between particles at finite concentrations dictate that either the surface potential O0 or the surface charge density q must deviate from the value measured at infinite dilution. In fact both may vary for nonideal interfaces. For example, our electrophoresis measurements with the latices at infinite dilution (Table I) indicate that the potential decreases and the charge density,
E+0
q = --(1 a
+ aK),
[9]
183
increases with increasing ionic strength. e is the dielectric permittivity. Increasing the volume fraction also alters the ionic environment by introducing more counterions; thus one might expect a corresponding change in both the potential and the charge. Four means of characterizing the electrical properties of the concentrated latices from the electrophoresis data at infinite dilution were tested in conjunction with the self-consistent field model (1): (a) surface potential fixed at the infinite dilution value, (b) surface charge fixed at the infinite dilution values, (c) surface potential determined by the ionic environment at the finite concentration, or (d) surface charge determined by the ionic environment at the finite concentration. The predictions were then compared with the data for the smallest particles without added salt, corresponding to the largest electrostatic effects. For all cases the theory was adapted to reflect the experimental procedure of adjusting the average concentration of added electrolyte in the suspension (n) rather than no, the concentration in the equilibrium dialysate. The definition 34) I[ ° ( n ) = --~ n +r2dr, with Eqs. [19] and [26] of (1), leads to the relationship n0-
1
--
4)
1+ 3 - - 6 eaz(n)
.
[101
Here e is the electronic charge and z the valence of the ions. Note that only for (3q/ e a z ( n ) ) 6 < 1 does
no - - , 1-4~
[11]
as assumed in adjusting no for the osmotic Journal of Colloid and Interface Science, Vol. 83, No. 1, September 1981
184
BENZING AND RUSSEL
pressure experiments. At low electrolyte concentrations the difference is insignificant since the added salt contributes little to the shielding. F o r ( 3 q / e a z ( n ) ) 4~ ~ 0 (1), however, the actual ion concentrations in the osmotic pressure experiment differ from those for the shear modulus. In the theoretical calculations the effect is accounted for by determining no from [11] for the osmotic pressures, 17. Predictions based on (a) and (b) deviate significantly from the measured values of G' and II, particularly at the higher concentrations. The theoretical values are on the high side for the constant potential condition and on the low side for constant charge. This suggests the possibility of reasonable agreements with a potential which decreases, and a charge which increases, with increasing volume fractions, exactly the behavior to be expected from (c) and (d). Within the concentrated suspensions the effective Debye length K-a, determined from e2zZno 1 + R(1 + R2) 112 q- R z
K2 = 2 - -
(1 + R2) 1/2 + R
ekT
,
[12]
characterizes the ionic environment. Here - oh) measures the ratio of counterions to excess electrolyte in the fluid. Equation [29] in Ref. (1) relates q to tOo. At infinite dilution no = ( n ) and
R = 3/2(q/eazno)ch/(1
K~
2eZz2 ( n ) -
Kg,
[13]
~kT
corresponding to the conventional Debye length for an isolated particle. When R >> 1, however, as at finite concentrations with little or no excess electrolyte, K2 ~ 3
ezq eakT
c~ 1 - ch
[14]
indicating that the counterions are entirely responsible for shielding the surface charge. If we now denote the potentials measured electrophoretically at infinite dilution as tOe(a, K0), the two assumptions can be Journal of Collold and Interface Science,
V o l . 8 3 , N o . 1, S e p t e m b e r
1981
103
/../ 3. Despite these differences and the ad hoc nature of the corrections the approach looks promising.
(aK°)2 + 1 + x / 2 a CONCLUSIONS
+
1
2(1 + x / 2 a ) 2) "
[17]
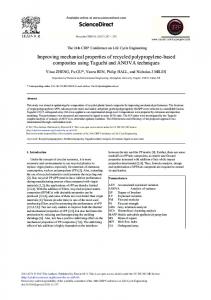
As shown by Fig. 10a, Eqs. [16] and [17] predict the volume fraction dependence of the shear modulus measured with our smallest particles (a = 0.053 /zm) without added salt (no = 10-7 mole/dm3) fairly well. In accord with the postulates of the theory ezOo/kT = 2.20 and aK0 = 0.053 were maintained for all volume fractions. The theory errs dramatically, however, with respect to the effect of added electrolyte (Fig. 10b). The data decreases monotonically with increasing ionic strength, but the theoretical curve passes through a pronounced maximum at (n) - 2 × 10⁻⁴ mole/dm3. The pairwise additive theory fails by not recognizing the change in the electrostatic
For small-amplitude, low-frequency motions, ordered polystyrene latices behave as linear viscoelastic solids with moduli which are independent of frequency. The osmotic pressures and shear moduli increase markedly with increasing volume fraction and decreasing particle size. The added electrolyte only becomes significant above a threshold concentration dependent on the counterion concentration; thence the additional screening of the electrostatic fields suppresses both the osmotic pressure and the shear modulus. The dynamic viscosity, on the other hand, only slightly exceeds that of water and depends rather weakly on the ionic strength, the volume fraction, and the particle size. Quantitative, or at least semiquantitaJournal of Colloid and Interface Science, Vol. 83, No. 1, September 1981
190
BENZING AND RUSSEL
104
jJ
J
103
~ G~
~400 o
jJ
1200 I000
IOz
G' 800
[.,m~]
600~ 400 200 0.1
0.2
0,~
10-4
I 10-3
I 10-2
I i0-1
I ~00
~, ~.-o
(11> [M/m3 ]
FIG. 10. Comparison of predictions from the pairwise additive theory with data (O) for Latex A: (a) without added electrolyte; (b) q5 = 0.30. ( , theory from Ref. (6); - - - - , modified theory.)
tive, predictions of all three properties appear possible with the self-consistent field model. In addition to these specific predictions, the model reveals more generally the potentially large differences between the ionic environment of a particle in a concentrated suspension and that at infinite dilution. This may provide a means for correcting pairwise additive theories for multiparticle electrostatic effects. REFERENCES 1. Russel, W. B., and Benzing, D. W., J. Colloid Interface Sci. 83, 163 (1981). 2. Crandall, R. S., and Williams, R., Science 198, 293 (1977). 3. Mitaku, S., Ohtsuki, T., Enari, K., Kishimoto, A., and Okano, K., Japan J. Appl. Phys. 17, 305 (1978). 4. Barclay, L., Harrington, A., and Ottewill, R. H., Kolloid Z. -Z. Polym. 150, 655 (1972). 5. Homola, A., Snook, T., and van Megen, W., J. Colloid Interface Sci. 61,493 (1977). 6. Goodwin, J. W., and Khidher, A. M., in "Colloid and Surface Science," (M. Kerker, Ed.), Vol. IV, p. 529. Academic Press, New York, 1976. 7. Buscall, R., presented at Euromech 104: MechanJournal of Colloid and Interface Science, Vol. 83, No. 1, September 1981
ics of Colloidal Dispersions, Leuven, Belgium, September 1978. 8. Krieger, I. M., private communication (1976). 9. Wallace, T. P., and Kratohvil, J. P., J. Polym. Sci. A2 8, 1425 (1970). 10. Henry, D. C., Proc. Roy. Soc. London Sect. A 133, 106 (1931). 11. O'Brien, R. W., and White L. R., J. Chem. Soc. Faraday Trans. 2 74, 1607 (1978). 12. Vilker, V. L., Colton, C. K., and Smith, K. A., J. Colloid Interface Sci. 79, 548 (1981). 13. Konno, A., Makino, S., and Kaneko, M., Japan J. Appl. Phys. 7, 89 (1968). 14. Ferry, J. D., "Viscoelastic Properties of Polymer Solutions." Wiley, New York, 1970. 15. James, R. O., Davis, J. A., and Leckie, J. O., J. Colloid Interface Sci. 65, 331 (1978). 16. van Megan, W., and Snook, I., J. Colloid Interface Sci. 57, 40 (1976). 17. Krieger, I. M., and Eguiluz, M., Trans. Soc. Rheol. 20, 29 (1976). 18. Okano, K., and Mitaku, S., J. Phys. (Paris) 41, 586 (1980). 19. Stone-Masui, J., and Watillon, A., J. Colloid Interface Sci. 28, 187 (1968). 20. Snook, I., and van Megen, W., Faraday Trans. 276, 216 (1976). 21. van Megen, W. J., Snook, I. K., and Watts, R. O., J. Colloid Interface Sci. 77, 131 (1980). 22. Snook, I., and van Megen, W., J. Colloid Interface Sci. 57, 47 (1976).
I0I