The current issue and full text archive of this journal is available at www.emeraldinsight.com/1469-1930.htm
JIC 7,2
254 Received 1 October 2004 Revised 1 February 2005 Accepted 2 February 2005
The voluntary reporting of intellectual capital Comparing evidence from Hong Kong and Australia James Guthrie Faculty of Economics and Business, The University of Sydney, Sydney, Australia
Richard Petty Macquarie Graduate School of Management, Sydney, Australia, and
Federica Ricceri Department of Economic Sciences, University of Padova, Padova, Italy Abstract Purpose – The purpose of this paper is to investigate the voluntary reporting of intellectual capital (IC) by listed companies in Australia and Hong Kong and to evaluate size, industry and time effects on IC disclosure levels. Design/methodology/approach – The study is an empirical one conducted in two stages. Stage one is an exploratory study of voluntary IC disclosure for the 20 largest listed Australian companies in 1998. Stage two, using 2002 data, examines voluntary disclosure of IC attributes for 50 listed entities in Australia and 100 in Hong Kong. Content analysis is used to collect data. Findings – Levels of voluntary IC disclosure are found to be low and in qualitative rather than quantitative form in both locations. Disclosure level is positively related to company size, a finding that is consistent with the previous literature on voluntary reporting. Research limitations/implications – External validity may be compromised somewhat by the relatively small sample size. Managers are not observed in the process of making decisions, so management intent is inferred. Practical implications – Documenting variations in types of reporting and in reporting frequency enables a greater understanding of why some companies voluntarily report whilst others do not. Such an understanding holds the potential to guide policy-makers, creditors and investors in giving prescriptions to firms over whom they have control or with whom they have dealings. Originality/value – This study is the first to comparatively examine the voluntary reporting of IC in a longitudinal setting using Australasian data. Keywords Intellectual capital, Disclosure, Annual reports, Hong Kong, Australia, Data analysis Paper type Research paper
Journal of Intellectual Capital Vol. 7 No. 2, 2006 pp. 254-271 q Emerald Group Publishing Limited 1469-1930 DOI 10.1108/14691930610661890
1. Introduction For many firms, intellectual capital (IC) represents a significant proportion of total value. However, while the balance sheet of a firm ordinarily shows the historical and book values of a firm’s fixed and current assets, it often fails to disclose the value of a firm’s intangible assets and IC. This reluctance to report on IC items has the effect of
making IC rich companies appear less valuable than they actually are (Petty and Guthrie, 1999). Wayne (2001), comparing Financial Accounting Standards Board (FASB) and International Accounting Standards Committee (IASC) frameworks, pointed out that IC cannot be recognised within financial statements because it does not meet the accounting definition of an asset. The lack of a correlation between the cost incurred and the value of the future benefit means that the financial information on IC provided under existing reporting standards inadequately measures its value. For many assets, but particularly in the case of IC, seldom is it the case that the value shown in the books of a company even closely resembles actual market value. In an attempt to better understand this problem, and in the hope of improving disclosure and reporting practices, we conducted a study that looked at the voluntary disclosure of IC by large listed entities in both Australia and Hong Kong. The substance and content of the disclosures made by firms in their annual reports is an area of interest to many researchers. An early study into IC disclosure used content analysis to capture IC data from annual reports (Guthrie et al., 1999). Several subsequent studies have adopted this research method to capture and organise diverse empirical data. Such studies have been conducted in Australia (Guthrie and Petty, 2000), Hong Kong (Petty, 2003a), Ireland (Brennan, 2001), Italy (Bozzolan et al., 2003), Sri Lanka (Abeysekera and Guthrie, 2003) and Sweden (Olsson, 2001). The current study was conducted in two stages. The first stage, an exploratory investigation, was conducted in Australia using a sample of Australian company data during 1998. The second stage was conducted in both Hong Kong and Australia during 2002, was far more in-depth, and involved a much larger sample size. The focus of investigation into the reporting practices of the companies in the 2002 data set for Australia and Hong Kong was to a large extent informed by the results of the 1998 Australian study. During that study, the literature review and early investigations revealed annual reports to be a key communication tool that are used to legitimise corporate activity (Lang and Lundholm, 1993). For this reason the annual report was chosen as the primary source for examining voluntary disclosure. When performing content analysis in corporate social, ethical and environmental reporting, the impact of two independent variables, size and industry, is commonly assessed (see, Gray et al., 1995; Mathews, 1997). In line with the purpose of this study, which was primarily exploratory, the effect these two variables have on voluntary disclosure practices was assessed. Results of the exploratory 1998 Australian study have already been published (Guthrie and Petty, 2000). The Australian study established a methodology and developed a recording instrument that has been used in its pure or derivative form in several other studies since (Brennan, 2001; Bozzolan et al., 2003). The second stage of the study adds to the extant literature in several ways. First, it uses a larger sample size than previous studies. Second, it is the first study to use data taken from companies listed in Asia. Finally, it is the first study to compare data from two countries in the broader Australasian region. 2. Literature review Several theoretical traditions have drawn on content analysis as a method of data collection and analysis. Two of these, stakeholder theory and legitimacy theory, are examined.
Voluntary reporting of IC
255
JIC 7,2
256
Stakeholder theory According to stakeholder theory, an organisation’s management is expected to undertake activities deemed important by their stakeholders and to report on those activities back to the stakeholders. This theory suggests that all stakeholders have a right to be provided with information on how organisational activities impact them (for example, through pollution, community sponsorship, safety initiatives, etc), even if they choose not to use the information, and even if they cannot directly play a constructive role in the survival of the organisation (Deegan, 2000). Stakeholder theory highlights organisational accountability beyond simple economic or financial performance. It suggests that organisations will elect to voluntarily disclose information about their intellectual, social, and environmental performance, over and above mandatory requirements, in order to meet real or perceived stakeholder expectations. Stakeholder theory has an ethical (moral) branch, and a positive (managerial) branch. The ethical branch argues that all stakeholders have the right to be treated fairly by an organisation, and that managers should manage the organisation for the benefit of all stakeholders (Deegan, 2000). The positive branch argues that a stakeholder’s power to influence corporate management should be viewed as a function of the stakeholder’s degree of control over resources required by the organisation (Watts and Zimmerman, 1986). The more critical the stakeholder resources are to the continued viability and success of the organisation, the greater the expectation that stakeholder demands will be addressed. Thus, the positive version of stakeholder theory predicts that management is more likely to focus on the expectations of powerful stakeholders (Deegan, 2000). This theory can be tested in a number of ways by applying content analysis to company annual reports. The annual report is the most efficient way for an organisation to communicate with those stakeholder groups deemed to have an interest in controlling certain strategic aspects of an organisation. A content analysis of IC disclosures can be used to determine whether this communication is in fact taking place. Are companies responding to stakeholder expectations, real or perceived, by offering a voluntary account of their IC? This is a question that has received some attention (Petty, 2003b), but more work is needed to form a conclusive opinion. Legitimacy theory Legitimacy theory is closely linked to stakeholder theory. It posits that organisations continually seek to ensure that they operate within the bounds and norms of their respective societies. From the perspective of legitimacy theory, a company would voluntarily report on activities if the management perceived that this was what the community expected. Legitimacy theory relies on the notion that there is a “social contract” between the company and the society in which it operates. The social contract is a way of describing the multitude of expectations that a society has on how an organisation should conduct its operations. These societal expectations are not fixed, but change over time. This requires the company to be responsive to the environment in which it operates (Deegan, 2000). Lindblom (1994) proposes that, if an organisation perceives that its legitimacy is in question, it can adopt a number of combative strategies. First, the organisation can seek to educate and inform its stakeholders about (actual) changes in the organisation’s performance and activities. Second, it can seek to change the perceptions of the
stakeholders – without changing its actual behaviour. Third, it can seek to manipulate the perceptions of the stakeholders by deflecting attention from the issue of concern to other related issues and appealing to emotive symbols. Finally, the organisation might seek to change and influence external expectations of its performance. According to Lindblom (1994), a company can use the public disclosure of information to implement each of the above strategies. Many empirical studies of Social and Environmental Reporting (SER) have adopted this perspective to explain the voluntary disclosure of IC by firms. According to legitimacy theory, organisations must continually appear to be operating in a manner that is consistent with societal values (Guthrie and Parker, 1989). This is often achieved through the medium of company reports. Lindblom (1994) suggests that organisations may use disclosures to demonstrate management’s concerns for societal values, or to divert community attention from the prevailing negative impact of the organisations’ activities. A number of prior studies examined voluntary annual report disclosures and viewed the reporting of social and environmental (SEA) information as a method that organisations used to respond to public pressure (Deegan and Rankin, 1996; Guthrie and Parker, 1989; Neu et al., 1998; Patten, 1992; Walden and Schwartz, 1997). Legitimacy theory is closely tied to the reporting of IC and to the use of content analysis methods as a measure of such reporting. Companies are more likely to report on their IC if they have a specific need to do this. This may happen when companies find themselves unable to legitimise their status on the basis of the hard assets that are traditionally recognised as the symbols of corporate success. The extent of IC reporting is, at this juncture, best measured using content analysis. Thus, legitimacy theory, IC reporting, and content analysis are linked. 3. A review of the use of content analysis in the IC literature Content analysis involves codifying both qualitative and quantitative information into pre-defined categories in order to track patterns in the presentation and reporting of information. This methodology seeks to determine the manifest content of written or other published communications by means of a systematic, objective and reliable analysis (Krippendorf, 1980; Guthrie, 1983). Content analysis of annual reports has been used in the corporate social, ethical and environmental reporting fields of accounting research (see, for example, Holsti, 1969; Krippendorf, 1980). IC researchers also have made extensive use of content analysis in examining annual reports. Annual reports have been used to investigate the IC reporting practices of firms (Bozzolan et al., 2003; Brennan, 2001; Guthrie et al., 1999; Olsson, 2001), and also to investigate the differences in reporting across firms in different countries (Subbarao and Zeghal, 1997). Researchers in Australia were early adopters of content analysis as a method for examining organisational practices in managing and reporting IC. Guthrie and Petty (2000) carried out a content analysis of the annual reports of the 20 largest Australian listed companies (according to market capitalisation) in an attempt to understand the extent to which these companies report their IC. The authors used a framework developed by Sveiby (1997), which categorises IC according to whether it relates to an organisation’s internal structure, external structure, or employee competence within an organisation. Using this framework, it
Voluntary reporting of IC
257
JIC 7,2
258
was found that the key components of IC are poorly understood, inadequately identified, inefficiently managed and inconsistently reported (Guthrie and Petty, 2000). Brennan (2001) carried out a similar study of companies in Ireland. The author analysed the annual reports of 11 listed companies and ten private companies. Brennan used an identical framework to code data for the content analysis of annual reports as that used by Guthrie and Petty (2000), and reported results similar to the Australian study. However, cultural and other cross-country differences mean that the findings of this study are not meaningfully comparable with Guthrie et al. (1999). A study by Olsson (2001) examined the annual reports of the 18 largest Swedish companies, selected on the basis of market capitalisation on the Swedish stock market. Olsson developed a list of five elements with which to ascertain the level of human capital reporting. The study found that none of the companies devoted more than 7 per cent of their reporting space to deliver human resource information in their annual reports. Furthermore, the information reported was found to be highly deficient in terms of both the quality and the extent of the disclosure. 4. Collecting and analysing the data Exploratory Australian study The largest 20 listed Australian companies were identified for the financial year ending 30 June 1998. Large companies were chosen in accordance with the view that they are likely to be more progressive and innovative because they have the financial resources that enable this type of behaviour. As noted earlier, it is generally expected that, due to resource and visibility factors, large companies are more likely to be active in the area of IC reporting. Size and industry factors Two criteria were used to group the data; size and industry. As previously stated, the largest companies by market capitalisation were selected. Presumptively, such companies have large numbers of staff and are rich in human capital, as well as, we expect, other forms of IC. Additionally, the Australian Stock Exchange (ASX) two-digit industry classification code was used to classify all companies by industry. The large number of ASX industry codes and the small number of firms in the sample meant that, for meaningful comparisons to be made, some of the codes needed combining. This resulted in six main industry classifications (beverages, financial services, media and telecommunications, other services, resources, and retail). In the first stage of the research, a content analysis was performed on the annual reports of each company. The content analysis was done with the aim of forming an overall perspective on the status quo for IC reporting by large Australian companies. An alternative to this approach might have been to conduct interviews with corporate finance officers. This approach was initially explored. However, questions such as “to what extent do you report external IC issues?” resulted in the officer referring to the annual report and relaying the information contained therein. It was therefore determined to be simpler and more productive to extract the information from the annual report first-hand. Conducting the content analysis The content analysis involved reading the annual report of each company and then coding the information contained therein in accordance with a selected framework of IC
indicators. The original IC framework was derived from several professional pronouncements on IC (see, IFAC, 1998; SMAC, 1998). This framework, which was modified for the present study, was as comprehensive as any available at the time of the research, and contained over 30 indicators across the three IC categories (internal, external, and human capital). The content categories and materials used for the content analysis were categorised according to the contemporary classification scheme for intangibles used in Sveiby’s IC Framework (Sveiby, 1997, pp. 8-11), which consists of three components: (1) internal structures (organisational capital); (2) external structures (customer/relational capital); and (3) employee competence (human capital). Internal structure includes the organisational structure, legal parameters, manual systems, research and development, and software of a company. External structure includes brands, and customer and supplier relationships. Employee competence includes education and training of the professional staff that are the principal generators of revenue. For the purpose of our analysis, the IC framework presented by Sveiby (1997) was modified to achieve a better convergence with items likely to be reported by Australian companies. For instance, in the internal capital category, the number of variables was reduced by recording measures of “design rights”, “trade secrets”, and “service marks” under the headings of “patents”, “copyrights”, and “trademarks” respectively. Also eliminated were the “backing order”, “occupational assessment” and “psychometric assessment” variables, since in the Australian reporting environment information relating to these variables is only likely to be obtained from internal management reports. Following these changes, 24 variables remained: nine relating to internal capital, nine to external capital, and six to human capital (see Table I). The content analysis involved reading the annual reports and recording information related to each variable on a coding sheet[1]. A numerical coding scheme was employed for each variable. For each company, a value of zero was used if the variable did not appear in the annual report; a value of one denoted that the variable appeared in a discursive form; a value of two was assigned if the variable was expressed in numerical terms; and a value of three was assigned if the variable was quantified in dollar (currency) terms. If disclosure of the same item was repeated in the annual report, it was recorded only once. The primary recording unit used was sentences. Complete phrases on any individual item that were included within sentences were also recorded. In this way, we were able to address the context issues raised by Milne and Adler (1999) relating to the semantics of words within sentences being imputed with a meaning other than that intended by the context. For each attribute investigated, the highest order of disclosure was recorded. So, for instance, if an item scored a two and then, later on, further disclosure warranted a score of three, the item was scored as three. Only voluntary disclosure was measured. Information relating to IC that was reported only because accounting standards required disclosure of the item in the annual report was excluded from the data set. The study investigated the total disclosure levels for each company, as well as for the overall sample of companies. Disclosure was initially analysed as follows:
Voluntary reporting of IC
259
JIC 7,2
Internal: organisational (structural) capital Intellectual property Infrastructure assets
260 External: customer (relational) capital
Employee competence: human capital
Table I. Selected elements of the IC framework
Patents Copyrights Trade marks Management philosophy Corporate culture Management processes Information systems Networking systems Financial relations Brands Customers Customer loyalty Company names Distribution channels Business collaborations Licensing agreements Favourable contracts Franchising agreements Know-how Education Vocational qualification Work-related knowledge Work-related competencies Entrepreneurial spirit, innovativeness, proactive and reactive abilities, changeability
Note: This Modified Intangible Assets Monitor has since been used in pure or derivative form by Guthrie and Petty (2000) and others (see Brennan, 2001; Bozzolan et al., 2003) in conducting research into the reporting of intellectual capital information in annual reports
(1) level of disclosure by each attribute; (2) level of disclosure by category (internal structure, external structure, employee competence); and (3) overall level of disclosure (for each company as well as for the total sample of the companies). Except for the points mentioned below, the collection of data for the Australian and Hong Kong 2002 studies mirrored the path followed for the 1998 Australian study. Annual reports for the 2002 financial year were collected and analysed using the content analysis method. The 2002 Australian and Hong Kong studies The 2002 Australian study used data collected from the annual report of the 50 largest companies by market capitalisation. For the 2002 Australian study we slightly modified the elements contained in the IC framework in order to account for recent developments in the country. In particular, the elements favourable contracts (external capital) and vocational qualification (human capital) were deleted. Also, the customer satisfaction category was renamed customer loyalty in order to take into account the
entire range of information about positive feedback from customers. Further, training was added as an IC element. Finally, patents, copyright and trademarks were incorporated under the heading of intellectual property; licensing agreements and franchising agreements under the heading of licensing agreements; information systems and networking systems under the heading of information systems; and, work-related knowledge and work related competencies under the heading of work-related knowledge. Size and industry For the 2002 study, size was once again used as the criterion to select the sample companies. The 2002 study considered the top 50 companies by market capitalisation as at 31 December 2002. The sample companies were grouped according to the industry groups used in the 1998 study. The 2002 Hong Kong study At the same time, 100 Hong Kong company reports were examined, permitting a more robust analysis than previously achieved during the 1998 Australian study. For the Hong Kong study, we slightly modified the elements contained in the IC framework in order to account for recent developments. Also, a further three IC attributes were added to the framework previously used, so as to account for recent developments resulting from the work of Bozzolan et al. (2003) and others in extending the classification schema used in Guthrie and Petty (2000). Specifically, the following variables were added; customer satisfaction, employees, training and work related knowledge. Other elements were combined, namely, franchising agreements and licensing agreements; patents, copyright, trademarks as a general category; information system and information/networking systems; know how and work related competencies, and work related knowledge. Still other variables, such as favourable contracts and customer loyalty, were deleted, as they were not considered relevant in much of the empirical analysis on IC reporting. This was done in order to reduce the number of elements in the framework. Overall, the result was a total of 18 IC attributes being investigated in the Australian and Hong Kong data sets for 2002. Size and industry There were a number of ways in which the size variable could have been operationalised. Considering the data set in hand, however, the most logical and appropriate method seemed to be to characterise companies as large or small by a split at the median. Large companies were those whose market capital scored above the median, while small companies were those whose market capital scored below the median. Companies were then grouped into industry sectors in accordance with the Hong Kong Stock Exchange industry classification. This differed slightly to the ASX classification used for grouping companies by industry in the Australian study. For the Hong Kong data, seven industry classifications were used as follows: (1) consolidated enterprises; (2) finance; (3) hotels;
Voluntary reporting of IC
261
JIC 7,2
262
(4) (5) (6) (7)
general industry; property; utilities; and growth enterprise.
5. Findings Australian data set Our analysis of the 1998 Australian data led to the conclusion that the key components of IC are poorly understood, inadequately identified, inefficiently managed and inconsistently reported. The companies did not have a consistent framework for reporting IC. Aggregate numerical findings of the 1998 Australian study are summarised in Table II. Entrepreneurial spirit was the most frequently reported attribute. Companies favoured the reporting of external capital, which constituted 40 per cent of total reporting. The reporting of human capital (30 per cent) and internal capital (30 per cent) items was evenly distributed. This breakdown accords with the emphasis in recent years on rationalising distribution channels, reconfiguring firm value chains and reassessing customer value through exercises such as customer profitability analysis. Australian companies did not compare favourably with several European counterparts in terms of their ability to manage, develop, support, measure and report IC. Further, few Australian enterprises appeared to have taken a conceptual approach to reporting IC. The frequently made claim in the annual reports that human resources represented the most important resource for a firm was not supported by actual disclosure of human capital in the annual report. Results of the study suggests that there is a gap between recognising the importance of IC and steps taken to place IC reporting higher on the agenda of Australian enterprises and Australian public policy. The 2002 Australian and Hong Kong data sets Our more recent analysis of the IC reporting practice of companies in Australia and Hong Kong revealed three key results. First, there continues to be a gap between the rhetoric and the reality with regard to the measuring, valuing and reporting of IC. Second, nearly 90 per cent of the information disclosed is expressed in discursive rather than numerical terms. Thus, what is lacking is a clear attempt to translate the rhetoric into benchmark measures that would enable performance in managing the IC elements of the firm to be assessed, and therefore improved, in a systematic way. Given the difficulty involved in trying to quantify what is, in many instances, essentially a qualitative item, this finding was not unexpected.
Table II. Descriptive statistics for the Australian sample for 1998
Number of sample companies Number of industry groups Number of IC elements in model Average number of elements reported per company Minimum number of elements reported for any one company Maximum number of elements reported for any one company
20 6 24 8.9 2 17
The third key finding is that the reporting of IC is inconsistent and varied in nature between different companies. The descriptive statistical evidence presented in Table III constructs a basic picture of the reporting practices of the companies in the sample. The above figures indicate that, while nearly all the companies (one Australian company being the exception) reported on some aspect of their IC, the extent of the reporting varied greatly. Further, the type of element reported for each individual company appears fairly randomly distributed. There is no obvious pattern or trend in the data set. However, the average number of elements reported for each company is high enough to suggest that there is an awareness of the importance of reporting IC. In Australia, WMC Ltd was the company most active in reporting IC, with 105 elements reported. Evidence of WMC Ltd’s commitment to broad annual reporting is evident from claims made in the annual report:
Voluntary reporting of IC
263
Our focus on sustainability is clear. Our continued licence to operate, and therefore our future, is determined by the quality of relationship that we have with employees, communities and the environment. This is the fundamental business case to ensure high quality performance (WMC Ltd, 2001, p. 12).
With reference to stakeholder reporting the annual report continues by stating: We aim to be objective, open and honest when discussing these matters, as our public reporting helps us maintain our licence to operate (WMC Ltd, 2001, p. 12).
The second most active firm in terms of IC reporting was the National Australia Bank Ltd, with 72 reported items. The National Australia Bank Ltd has given great attention to customer service and satisfaction. This is evidenced by the development of its own customer relationship management system, which it holds as a point of competitive differentiation. Interestingly, the National Australia Bank Ltd was in 2002 recognised as the top company in Australia in reporting social environment and other information to stakeholders (Reptex, 2002). Yet only one annual report, that of Fosters Ltd, specifically mentioned IC as a concept. This report referred to the process of leveraging IC in both wine making and brand management, stating that: [. . .] the division continues to leverage that [IC] by expanding its extra sourcing practices: partnering external wine growers and wine production facilities, while using its own well-honed skills and expertise to manage production and marketing. In both the USA and Australia, extra sourcing is extending the use of BBWE’s intellectual capital, keeping costs and capital investment down and increasing the range of its brands (Fosters Ltd, 2002, p. 19).
Number of sample companies Number of industry groups Number of IC elements in model Average number of elements reported per company Minimum number of elements reported for any one company Maximum number of elements reported for any one company
Hong Kong
Australia
100 7 27 13.2 2 29
50 6 18 31.6 0 105
Table III. Descriptive statistics for the Australian and Hong Kong samples for 2002
JIC 7,2
264
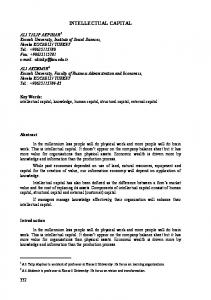
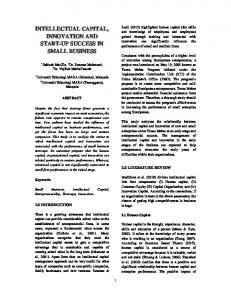
The only company whose annual report did not mention any IC items was Harvey Norman Ltd. (2002) Surprisingly, this report did not contain any extra information other than that required by regulation, and therefore no voluntary reporting was found. The Harvey Norman Ltd report can be best described as an old-fashioned “black letter” report, similar in many ways to some of the Hong Kong reports. While the incidence of reporting in the above sample is not great enough to be considered systematic, it is significant enough to support the contention that firms have a loose commitment to the notion of communicating information about their IC to an external audience. However, this commitment is qualified by an inability to report IC in a consistent, quantitative manner, and is thus largely limited to discursive reporting. Findings by reporting category The incidence of reporting by category of IC (internal, external, and human capital) in Australia was also examined, to determine whether there was a particular focus on a specific category of capital. Figure 1 shows the breakdown of reporting in terms of IC category for the 2002 Australian data set. The internal capital and external capital categories accounted for most of the IC reported (90 per cent). By comparison, the human capital category was significantly less reported (10 per cent). The reporting of external capital accounted for almost half of the observed reporting practices (49 per cent). This patterning of IC reporting is slightly different from the results found in the 1998 study of the annual reports of the top 20 Australian listed companies (Guthrie and Petty, 2000). It also differs from the results of the 2002 Hong Kong study. The Hong Kong findings are illustrated in Figure 2.
Figure 1. Reporting by IC category – Australia
Figure 2. Reporting by IC category – Hong Kong
The disclosure of the IC information of Hong Kong companies seems to be much more evenly split across the three categories. In any case, disclosure of IC attributes relating to external capital is again the most popular, standing at 37 per cent of the total. Disclosure of IC attributes relating to internal capital stands at 28 per cent of the total, making it the least popular category for disclosure, while human capital attributes account for 35 per cent. Looking at the IC reporting within categories, it was found that, for internal capital, the elements “management philosophy” and “management processes” account for over 70 per cent of reported. In the external capital category, “business collaborations” and “brands” account for over 50 per cent of reported IC. In the human capital category, the two elements “employee” and “work related knowledge” account for nearly 70 per cent of IC reported. Table IV shows these results. In summary, the absence of systematic reporting of IC in Australia may be due to the lack of an established, and generally accepted, framework for reporting. Some companies may view the development of IC as being something that is an internal management issue and therefore outside the scope of the annual report (Guthrie et al., 1999).
Voluntary reporting of IC
265
Findings at individual element levels Our study also involved the examination of the incidence of reporting at an individual element level. Table V illustrates the relative popularity of the reporting of specific IC elements. As shown in Table V, the two elements most disclosed were business collaborations with other partners and management philosophy (reporting frequency ¼ 257). Only five companies did not mention business collaboration. The importance placed on reporting business collaborations is not surprising, as alliances and other forms of collaborative arrangements are a common way of conducting business and implementing growth strategies. For instance, Telstra Ltd’s annual report (Telstra Ltd, 2002, p. 28) mentioned that: On 5 March 2002 we and Foxtel announced an agreement [which] will enable us to bundle Foxtel’s pay-TV service with telephone and Internet services and charge customers for them on a single Telstra bill.
The other most frequently reported element was management philosophy, with only four firms not reporting this in their annual report. Management philosophy refers to the way in which managers translate the mission of the company into more tangible objectives. As would be expected, this element scored highly, as nearly all firms had either a mission statement or some other formal expression of the way that senior Category
Element
Internal capital
Management philosophy (IC) Management processes (IC) Business collaborations (EC) Brands Employees Work-related knowledge
External capital Human capital
Incidence 257 213 257 143 76 37
Table IV. The two IC elements most disclosed per IC category
JIC 7,2
Item 1.
266 2.
3.
Table V. Frequency of reporting specific IC elements
Reporting frequency
Internal capital Intellectual property Management philosophy Corporate culture Management processes Information/networking systems Financial relations External capital Brands Customers Customer satisfaction Company names Distribution channels Business collaborations Licensing agreements Human capital Employees Education Training Work-related knowledge Entrepreneurial spirita
652 33 257 77 213 65 7 761 143 104 14 78 128 257 40 164 76 3 24 37 24
Note: aEncompasses: innovativeness; proactive and reactive abilities; and changeability Source: Australian data 2002
leaders in the firm think about the future strategy of the company and its relationship with its stakeholders. For instance, the WMC Ltd annual report states that the company: [. . .] is committed to protecting and enhancing shareholder value and adopting benchmark governance policies and practices. This includes ensuring regulatory requirements are met and ethical standards maintained. We manage resources responsibly, and maintain a high level of transparency in reporting to shareholders and stakeholders (WMC Ltd, 2001, p. 37).
The third most reported element was management processes (reporting frequency ¼ 213). This is an internal capital element covering policies, procedures, re-engineering and other processes, and quality certifications associated with the firm. Only six firms in the sample did not report management processes. In contrast, the National Australia Bank Ltd placed great value on this element: [We] are proud of our customer relationship Management System, which is the product of 15 years of development and refinement. It is a highly focused system that is designed to provide staff with the most complete understanding of customer needs (National Australia Bank, 2001, p. 6).
Apart from Harvey Norman Ltd, there was no other firm that did not report the three most disclosed elements. It must be noted, however, that there seemed to be no discernable pattern with regard to the reporting of the most popular elements across the industry groups.
The three least reported elements were education (reporting frequency ¼ 3), financial relations (reporting frequency ¼ 5), and customer satisfaction (reporting frequency ¼ 14). Although only six companies had reported information on customer satisfaction, they had all provided quantitative measurements for this element. However, once again there is no discernable pattern as to the reporting of the least popular elements across the industry groups.
Voluntary reporting of IC
267 Overall location of IC reporting in the annual reports The IC information collected from the analysis of annual reports was coded according to the section of the annual report in which the item appeared. Annual reports are typically divided into the following sections: the vision/strategy section; the director’s section; the business/operational section; the financial section; and the “other” section. The section where IC elements were most widely reported was the “business/operational” section. This section accounted for nearly half of all reporting. The second most popular section was “other”, which carried nearly one quarter of all IC items. This section was a catch-all section that included any items that did not fit into the classification of the remaining sections. The least amount of disclosure was in the financial section. This was to be expected, as there are no corporation laws or accounting standards that require the quantification of IC. These results are shown in Table VI . The size factor – Australian and Hong Kong 2002 data sets Descriptive statistics for the Australian and Hong Kong data are given in Tables VII and VIII. Table VII shows that, on average, large Australian companies have a higher level of disclosure (mean ¼ 37.7) than small companies (mean ¼ 25.4). This observation holds for the sample as a whole and also for each of the three categories. Table VIII shows that, on average, large companies in Hong Kong exhibit the same size trait as Australian companies. That is, large companies have a higher level of Location
Incidence
Vision Directors Business Financials Other
166 303 695 53 360
Source: Australian data 2002
n Large companies Small companies
25 25
Overall index Mean St. Dev. 37.7 25.4
Source: Australian companies
4.6 2.2
Internal capital Mean St. Dev. 14.8 11.2
28.1 1.1
External capital Mean St. Dev. 19.1 11.4
2.9 1.7
Table VI. Location of IC disclosure
Human capital Mean St. Dev. 3.72 2.8
0.6 0.4
Table VII. Descriptive statistics on size for 2002
JIC 7,2
268
disclosure (mean ¼ 14.6) than small companies (mean ¼ 11.8). Once again, this observation holds for the sample as a whole and also for each of the three categories. The t-test for the means in the Australian study shows that the difference between the means of the small and large companies is significant only in relation to the overall index (p ¼ 0.022) and the external capital category (p ¼ 0.025). The results of the t-test for the means in the Hong Kong study show that there is a significant difference between small and large companies on the overall index (p ¼ 0.01). The difference with regard to internal structure is also significant, though at a lower level of significance (p ¼ 0.08). The difference for external structure is also significant (p ¼ 0.02), as is the difference for human capital (p ¼ 0.07). For the Australian study, a regression model was used to assess the significance of the size variable in explaining differences in IC reporting. The model used size as the independent variable and level of disclosure as the dependent variable. The results show that size is a significant variable in explaining the different levels of IC reporting even if the explanatory power of size is low (R-squared ¼ 0.10). This result suggests that, as in the voluntary disclosure literature, other variables (i.e. industry, ownership structure and profitability) as well as other size measures (i.e. turnover, total assets) may be used in order to arrive at a better explanation of different reporting behaviours. 6. Conclusions The results show that Australian companies in 2002 disclosed more IC information than Australian companies in 1998 and Hong Kong companies in 2002. However, in all three studies, it was revealed that nearly every instance of IC reporting involved expression in discursive rather than numerical terms. What is lacking is a clear attempt to translate the rhetoric of IC reporting into benchmark measures that enable the performance of a firm in managing IC to be assessed in a systematic fashion. This is to some extent understandable given the difficulty involved in trying to quantify what is, in many instances, essentially a qualitative item. Therefore this finding was not unexpected. The low incidence of quantitative expressions of IC items seems to confirm the widely held view that companies are not motivated to assign dollar values to IC. The greatest voluntary IC disclosure occurred in the “business/operational” section of the annual report. The very high incidence of IC reporting in this section is likely attributable to the trend by firms to relate IC to the operations of their organisation via the human capital nexus. In the Australian 2002 data the internal and external capital categories of IC were found to account for the majority (90 per cent) of the IC reported. This result is different from the results obtained from the 1998 Australian data and the 2002 Hong Kong data,
n Table VIII. Descriptive statistics on size for 2002
Large companies Small companies
50 50
Overall index Mean St. Dev. 14.6 11.8
Source: Hong Kong companies
5.99 4.6
Internal capital Mean St. Dev. 4.04 3.3
2.33 1.76
External capital Mean St. Dev. 5.54 4.2
3.06 2.54
Human capital Mean St. Dev. 5.02 4.3
2.16 1.81
which revealed a more even distribution of disclosure across the three IC categories. In all the studies, it was shown that the external capital category is the category with the highest level of disclosure. This study has both theoretical and practical implications. From a theoretical point of view, it provides an overview of the evolution of IC reporting over a period of four years, suggesting that there is a growing awareness of the need to report IC. Further, it provides useful comparative insights into IC reporting, by comparing findings using Australian and Hong Kong data. Finally, from a practical point of view, the study may be of interest to regulators and standard-setting bodies as they seek to evaluate mandatory disclosure. The results of this study confirm that what is lacking is a common accepted framework for IC reporting, as there is no obvious pattern or trend in the data set. As a consequence, we can conclude that market forces alone do not seem to be sufficient to guarantee the full satisfaction of the information needs of shareholders and stakeholders. Note 1. To ensure recording accuracy and validity, a professionally qualified accountant independently confirmed the coding of each item. References Abeysekera, I. and Guthrie, J. (2003), “Human capital reporting in a developing nation: an analysis of practice”, paper presented at the 7th IPA Conference, Madrid, 13-16 July. Bozzolan, S., Favotto, F. and Ricceri, F. (2003), “Italian annual intellectual capital disclosure: an empirical analysis”, Journal of Intellectual Capital, Vol. 4 No. 4, pp. 543-58. Brennan, N. (2001), “Reporting intellectual capital in annual reports: evidence from Ireland”, Accounting, Auditing & Accountability Journal, Vol. 14 No. 4, pp. 423-36. Deegan, C. (2000), Financial Accounting Theory, McGraw-Hill Book Company, Sydney. Deegan, C. and Rankin, M. (1996), “Do Australian companies report environmental news objectively? An analysis of environmental disclosures by firms prosecuted successfully by the Environmental Protection Authority”, Accounting, Auditing & Accountability Journal, Vol. 9 No. 2, pp. 52-69. Fosters Limited (2002), Annual Report, Fosters, Melbourne. Gray, R.H., Kouchy, R. and Lavers, S. (1995), “Constructing a research database of social and environmental reporting by UK companies: a methodological note”, Accounting, Auditing & Accountability Journal, Vol. 8 No. 2, pp. 78-101. Guthrie, J. (1983), “Corporate social accounting and reporting: an Australian empirical study”, paper presented at the AAANZ Annual Conference, Griffith University, Brisbane. Guthrie, J. and Parker, L.D. (1989), “Corporate social reporting: a rebuttal of legitimacy theory”, Accounting and Business Research, Vol. 19 No. 76, pp. 343-52. Guthrie, J. and Petty, R. (2000), “Intellectual capital: Australian annual reporting practices”, Journal of Intellectual Capital, Vol. 1 No. 3, pp. 241-51. Guthrie, J., Petty, R., Ferrier, F. and Wells, R. (1999), “There is no accounting for intellectual capital in Australia: a review of annual reporting practices and the internal measurement of intangibles within Australian organisations”, paper presented at the International Symposium on Measuring and Reporting of Intellectual Capital: Experiences, Issues and Prospects, OECD, Amsterdam.
Voluntary reporting of IC
269
JIC 7,2
Harvey Norman Limited (2002), Annual Report, Harvey Norman Limited, Albury. Holsti, O.R. (1969), Content Analysis for the Social Sciences and Humanities, Addison-Wesley, Reading, MA. International Federation of Accountants (IFAC) (1998), The Measurement and Management of Intellectual Capital: An Introduction, Study 7, IFAC, London.
270
Krippendorff, K. (1980), Content Analysis: An Introduction to its Methodology, Sage Publications, Beverly Hills, CA. Lang, M. and Lundholm, R. (1993), “Cross sectional determinants of analysts’ ratings of corporate disclosures”, Journal of Accounting Research, Vol. 31 No. 2, pp. 246-71. Lindblom, C.K. (1994), “The implications of organizational legitimacy for corporate social performance and disclosure”, paper presented at the Critical Perspectives on Accounting Conference, New York, NY, April. Mathews, M.R. (1997), “Twenty-five years of social and environmental accounting research – is there a silver jubilee to celebrate?”, Accounting, Auditing & Accountability Journal, Vol. 10 No. 4, pp. 481-531. Milne, M. and Adler, R. (1999), “Exploring the reliability of social and environmental disclosures content analysis”, Accounting, Auditing & Accountability Journal, Vol. 12 No. 2, pp. 237-56. National Australia Bank (2002), Annual Report, National Australia Bank, Melbourne. Neu, D., Warsame, H. and Pedwell, K. (1998), “Managing public impressions: environmental disclosures in annual reports”, Accounting, Organizations and Society, Vol. 23 No. 3, pp. 265-82. Olsson, B. (2001), “Annual reporting practices: information about human resources in corporate annual reports in major Swedish companies”, Journal of Human Resource Costing and Accounting, Vol. 6 No. 1, pp. 39-52. Patten, D.M. (1992), “Intra-industry environmental disclosures in response to the Alaskan oil spill: a note on legitimacy theory”, Accounting, Organizations and Society, Vol. 17 No. 5, pp. 471-5. Petty, R. (2003a), “The disclosure of intangible information by listed companies in Hong Kong”, working paper, University of Hong Kong, Hong Kong. Petty, R. (2003b), “The correlation between the voluntary disclosure of intellectual capital indicators and financial success”, working paper, Citigroup Global Consumer and Investment Bank Conference, Hong Kong. Petty, R. and Guthrie, J. (1999), “Managing intellectual capital: from theory to practice”, Australian CPA, Vol. 69 No. 7, pp. 18-20. Reptex (2002), Annual Report, Reptex, Melbourne. (The) Society of Management Accountants of Canada (SMAC) (1998), The Management of Intellectual Capital: The Issues and the Practice, Issue Paper No. 16, The Society of Management Accountants of Canada, Hamilton. Subbarao, A.V. and Zeghal, D. (1997), “Human resources information disclosure in annual reports: an international comparison”, Journal of Human Resource Costing and Accounting, Vol. 2 No. 2, Autumn, pp. 53-73. Sveiby, K.E. (1997), The New Organizational Wealth: Managing and Measuring Knowledge Based Assets, Berrett-Koehler Publisher, San Francisco, CA. Telstra Limited (2002), Annual Report, Telstra Limited, Brisbane.
Walden, D. and Schwartz, B.N. (1997), “Environmental disclosures and public policy pressure”, Journal of Accounting and Public Policy, Special Environmental Issue, Vol. 16 No. 2, pp. 125-54. Watts, R.L. and Zimmerman, J.L. (1986), Positive Accounting Theory, Prentice-Hall, Englewood Cliffs, NJ. Wayne, S.U. (2001), Business and Financial Reporting: Challenges from the New Economy, Financial Accounting Series, 219/A, FASB, Norwalk, CT. WMC Limited (2002), Annual Report, WMC Limited, Melbourne. Further reading Lend Lease Limited (2002), Annual Report, Lend Lease Limited, Melbourne. Corresponding author James Guthrie can be contacted at:
[email protected]
To purchase reprints of this article please e-mail:
[email protected] Or visit our web site for further details: www.emeraldinsight.com/reprints
Voluntary reporting of IC
271