Leens …
2/07/08
14:41
Page 38
Vo l u m e 4 - N u m b e r 5 - M a y 2 0 0 8 ( 3 8 - 4 2 )
The Water Footprint of Energy Consumption : an Assessment of Water Requirements of Primary Energy Carriers
Winnie Gerbens-Leenes, Arjen Hoekstra, Theo van der Meer University of Twente, Drienerlolaan 5, P.O. Box 217, 7500 AE Enschede, the Netherlands E-mail:
[email protected]
1. Introduction
pete with other uses such as urban utilization and industrial activities (Falkenmark, 1997; Postel et al., 1996; UNESCO, 2006). In some river basins, all water is already in use with no possibility to increase extraction (Molden et al., 2007). Competition occurs where urbanization takes place and water demand for households and industry grows, often at the cost of the availability of water for agriculture. But there is also competition between upstream and downstream users, or between water for human use and water for nature. The large scale introduction of energy crops in an effort to mitigate the effects of climate change might introduce another unprecedented competition for water, the one between water for food and water for energy.
Internationally, there is consensus that climate change is one of the major issues on a global level of scale (IPCC, 2001). The ever increasing use of fossil energy carriers, such as crude oil, natural gas and coal, goes along with large emissions of carbondioxide, an important factor in climate change. Solutions are sought in different directions, such as increasing energy efficiency by improving technology in production, or by decreasing the consumption of energy intensive products. Another solution is the substitution of fossil energy carriers by renewable energy carriers, such as electricity from hydropower, wind or solar photophotalic cells, or biomass. The energy from electricity can be stored in secondary energy carriers, for example in hydrogen, that could have a wide application as a clean transport fuel. Biomass can be derived from a large variety of crops, such as sugar cane and maize to produce ethanol, jathropa and sunflower to produce oil, or miscanthus to produce heat. The production of energy crops, however, requires the input of water, a scarce natural resource in a highly competitive context.
The energy system and the water system are interrelated. For the energy system, to make energy carriers available, almost always water is needed, for example, for oil drilling, the washing of coal or for the growth of crops. The aim of this study is to provide insight into the water-energy relationship and to quantify water requirements for primary energy carriers (m3/GJ) by applying the concept of the water footprint (WF) adopted from Hoekstra and Hung (2002). Research questions are: (i) How much water is needed to provide energy from fossil energy carriers, hydropower, wind and sun?; (ii) What is the WF per unit of energy of biomass, i.e. food crops (e.g. crops for sugar, starch and oil) and energy crops (e.g. trees and grasses); (iii) Does the location where biomass is produced influence the WF? Although the results obtained in this study are still preliminary in nature, they provide insight into
Internationally, there is also consensus that the competition for scarce water resources is intense and that the world faces unprecedented challenges of using water in a sustainable way (Molden et al., 2007). Today, agriculture providing food and materials requires about 86% of the worldwide fresh water use (Hoekstra and Chapagain, 2007). In many parts of the world, the use of water for agriculture already has to com-
38
Leens …
2/07/08
14:41
Page 39
Winnie Gerbens-Leenes, Arjen Hoekstra, Theo van der Meer/ISESCO Science and Technology Vision - Volume 4, Number 5 (May 2008) (38-42)
ved data from Gleick (1994). The WF of hydropower was calculated by dividing global evaporation of reservoirs (Shiklomanov, 2000) by the hydroelectric generation (Gleick, 1993) for the year 1990.
the WF of different energy carriers. These insights can contribute to a better understanding of the relationship between energy and water use. 2. Methodology
2.3. The water footprint of energy from biomass
In general, there is almost always water needed in a supply chain to make energy available for human activities. For the assessment of the WF of energy carriers, this study only took the primary energy carriers that derive from sources in the first link of the supply chain into account. It distinguished between primary, non-renewable energy carriers (uranium, crude oil, coal, and natural gas) and primary, renewable energy carriers (wind, sun, hydropower and biomass).
The study considered four categories of crops: (i) trees; (ii) bioenergy crops; (iii) food crops and (iv) crops for materials. It made assessments for sixteen crops from the four categories mentioned above: poplar (trees), miscanthus (bioenergy crops), and for cassava, coconut, groundnuts, maize, oranges, palm oil, potato, wheat, rapeseed, sugar beet, sugar cane, sunflower, soyabean (food crops), and cotton (crops for materials). The study considered four different countries, Brazil, the Netherlands, the United States and Zimbabwe. For these countries, climatic data that were used as input for the model CROPWAT (FAO, 2007), were derived from the database of Hennings and Müller (2000). Areas were specific crops are grown were derived form the United States Department of Agriculture (USDA, 2007). Finally, it calculated the water footprint of energy from biomass (m3 GJ-1) by dividing virtual water (m3 kg-1) by the energy content (GJ kg-1) (ECN biomass, 2007).
2.1. The concept of the Water Footprint A tool that addresses water requirements for crops as well as international virtual water flows related to the trade of crops and crop products is the concept of the Water Footprint (WF). This tool has been introduced by Hoekstra and Hung (2002) and has been developed further by Chapagain and Hoekstra (2004). Those authors define the WF as the total annual volume of freshwater used to produce the goods and services related to a certain consumption pattern. It shows water use for consumption, termed utilization, inside and outside the national territory. Results are expressed as m3 per kg of product, m3 per capita per year, or as m3 on a national level. Globally, the main virtual water flows are related to utilization of soybeans (11%), wheat (9%), coffee (7%), rice (6%) and cotton (4%) (Chapagain and Hoekstra, 2004).
3. Results and discussion 3.1. The water footprint of energy from biomass Table 1 shows the results for the WF of biomass for the sixteen crops grown in four different countries. Differences among WF's of biomass were large, dependant on the type of biomass, the agricultural system applied and climatic conditions.
The WF consists of three components: green, blue and gray virtual-water. The green virtual-water content of a product refers to the rainwater that evaporated during the production process, mainly during crop growth. The blue virtualwater content of a product refers to the surface and groundwater applied for irrigation that evaporated during crop growth. The gray virtual-water content of a product is the volume of water that becomes polluted during production. It is defined as the amount of water needed to dilute pollutants emitted to the natural water system during the production process to the extent that the quality of the ambient water remains beyond agreed water quality standards (Hoekstra and Chapagain, 2007). The WF of an individual or a country consists of the total volume of water used (m3 year-1), directly or indirectly, to produce goods and services consumed by the individual or the country (Chapagain and Hoekstra, 2004). The WF distinguishes between the internal WF and the external one. The internal WF is defined as the use of domestic water resources related to a country's utilization, while the external WF is defined as the use of water resources in countries outside the national border related to domestic utilization.
Table 1. WF of biomass for sixteen crops grown in the Netherlands, the United States, Brazil and Zimbabwe.
m3 per GJ Crop Cassava Coconut Cotton Groundnuts Maize Miscanthus Oranges Palmoil and kernels Poplar Potatoes Soyabeans Sugarbeets Sugarcane Sunflower Wheat Winteroilseedrape Average
2.2. The water footprint of energy carriers (without biomass) For the assessment of the WF of non-renewable energy carriers and for electricity from wind and sun, the study deri-
39
The United Netherlands States ----9.1 19.7 --22.2 20.9 -13.4 -26.9 13.8 67.3 24.2
--135.0 57.6 18.3 37.1 9.8 -41.8 45.8 99.3 23.3 30.0 60.6 84.2 113.3 58.2
Brazil Zimbabwe 29.7 48.8 95.6 51.4 39.4 48.8 16.3 75.2 55.0 307 61.1 -25.1 54.3 81.4 205.2 61.2
204.7 204.7 355.6 253.6 199.6 63.8 51.6 -72.0 64.8 138.0 -31.4 145.5 68.7 -142.6
2/07/08
14:41
Page 40
Winnie Gerbens-Leenes, Arjen Hoekstra, Theo van der Meer/ISESCO Science and Technology Vision - Volume 4, Number 5 (May 2008) (38-42)
of deep mining of coal is 0.012 m3 per GJ, onshore oil extraction and production 0.006 m3 per GJ, and surface mining of coal only 0.004 m3 per GJ. For the non-renewable energy carriers, the WF increases in the following order: uranium (0.09 m3 per GJ), natural gas (0.11 m3 per GJ), coal (0.16 m3 per GJ), and finally crude oil (1.06 m3 per GJ). In this category, the WF of crude oil is ten times the WF of uranium.
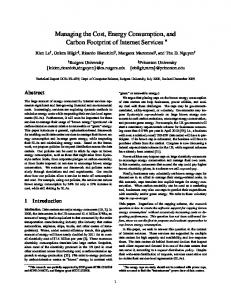
For the types of biomass included in this study, the largest difference was found between maize grown in the Netherlands and cotton grown in Zimbabwe; the WF of the cotton was forty times the WF of Dutch maize. In general, some crops have a lower WF per unit of energy than other crops. In order to compare the WF of crops, Figure 1 shows the relative WF per country, where the WF of maize in that country is set to 1. Figure 1 shows that in the Netherlands, maize has the smallest WF, the WF of sugar beet is 50% larger, whereas the WF of miscanthus is twice the WF of maize, of poplar and potato two and a half the WF of maize, of sunflower three times and of oilseedrape seven and a half times the WF of maize. In the US, oranges show a WF of half the WF of maize, all other crops have larger WF's. Sugarbeet and sugar cane about 50% larger, poplar and potato two and a half times larger, groundnut and sunflower three times, and oilseedrape and cotton six and seven and a half times larger respectively.
Table 2. Average water footprint for operations that make energy carriers available and average total water footprint for coal, uranium, crude oil, natural gas, electricity from active solar space heat and electricity form wind energy (m3 per GJ).
Operation
cotton
winteroilseedrape
soyabeans
palmoil and kernels
poplar
sunflower
miscanthus
groundnuts
maize
coconut
cassava
potatoes
oranges
sugarcane
sugarbeets
Relative WFP (maize = 1)
Leens …
Figure 1: Relative WF in the Netherlands, the United States, Brazil and Zimbabwe, where the WF of maize in the country considered is set to 1.
In Brazil, oranges and sugar cane show about half the WF of maize, cotton and oilseedrape two and a half and five times the WF of maize. The other crops have WF's in the same order of magnitude than maize. In Zimbabwe, only cotton has a WF that is substantially larger than the WF of maize, twice the value of maize. All other crops have WF's in the same order of magnitude or smaller. In general, the WF of maize is favorable, the WF of oilseedrape and cotton unfavorable. Figure 1 also shows that some crops that are specifically grown for energy, i.e. miscanthus, poplar and winteroilseedrape have a relatively large WF compared to a food crop such as maize. An exception is poplar grown in Zimbabwe. For this crop, however, the study applied general yield data that probably overestimated yield levels in that country, so that it underestimated the WF of poplar. From a water perspective, crops grown for energy do not have a more favorable WF than crops grown for food. Table 2 shows the WF of operations that make the nonrenewable energy carriers coal, uranium, crude oil and natural gas available. Large differences among the WF of operations occur, resulting in large differences among average, total WF's of non-renewable energy carriers. The WF of underground uranium mining, for example, is negligible, whereas the WF
40
Average water footprint (m3 per GJ)
Coal Surface mining Deep mining Slurry Pipelines Beneficiation Other plant operations Total (average)
0.004 0.012 0.063 0.004 0.090 0.164
Uranium Open pit uranium mining Underground uranium mining Uranium milling Uranium hexafloride conversion Uranium enrichment: gaseous diffusion Uranium enrichment: gas centrifuge Fuel fabrication Nuclear fuel processing Total (average)
0.020 0.000 0.009 0.004 0.012 0.002 0.001 0.050 0.086
Crude oil Onshore oil exploration Onshore oil extraction and production Enhanced oil recovery Water flooding Thermal steam injection Forward combustion/air injection Micellar polymer Caustic injection Carbon dioxide Oil refining (traditional) Oil refining (reforming and hydrogenation) Other plant operations Total (average)
0.000 0.006 0.120 0.600 0.140 0.050 8.900 0.100 0.640 0.045 0.090 0.070 1.058
Natural gas Gas processing Pipeline operation Plant operations Total (average)
0.006 0.003 0.100 0.109
Other Electricity from hydropower Electricity from solar active space heat Electricity from wind energy
22.300 0.265 0.000
Leens …
2/07/08
14:41
Page 41
Winnie Gerbens-Leenes, Arjen Hoekstra, Theo van der Meer/ISESCO Science and Technology Vision - Volume 4, Number 5 (May 2008) (38-42)
3.2. The water footprint of primary energy carriers (without biomass)
3.3. Comparisons of the water footprint among different energy carriers
As mentioned before, however, that the WF includes three types of water, green water, blue water and gray water. The first two are related to water use, the latter to water pollution. Gray water is defined as the amount of water needed to dilute pollutants emitted to the natural water system during the production process to the extent that the quality of the ambient water remains beyond agreed water quality standards. To make energy carriers available, it is possible that water becomes polluted. For example, underground coal mining sometimes leads to contamination of water (Gleick, 1994). This study did not take pollution, and thus gray water into account. In this way, it probably underestimated the WF of some energy carriers that show large water pollution.
The comparison of the water footprint among different energy carriers shows large differences, for example, between the category of fossil energy carriers on the one hand and the category of biomass on the other. The average WF of a mix of uranium, natural gas, coal and crude oil is only 0.35 m3 per GJ. The average WF of high yielding biomass grown in the Netherlands is 24.2 m3 per GJ. This means that a shift from fossil energy towards energy from biomass puts large claims on scarce freshwater resources. Based on the energy use of 100 GJ per capita per year in western societies (Kramer et al., 1994; Vringer and Blok, 1995; Noorman and Schoot Uiterkamp, 1998; Moll et al., 2005), a mix from coal, crude oil, nuclear energy and gas requires 35 m3 of water, while 100 GJ from biomass requires 2420 m3, about seventy times as much water. In the United States, where yields are lower than in the Netherlands, the WF of 100 GJ from biomass is 5820 m3, in Brazil 6120 and in Zimbabwe even 14260 m3. This means that the WF of biomass is 70 to 400 times larger than the WF of the non-renewable, primary energy carriers. This requirement competes with water for food, which lies in the same order of magnitude. Strategies towards larger biomass use for energy should take this large water footprint into account.
Table 2 also shows that the WF of electricity from solar active space heat and from wind is negligible, but that the WF of electricity from hydropower is substantial. The large WF of hydropower is mainly caused by large evaporation of water from reservoirs required to generate electricity. 4. Conclusion
The aim of this study was to define the relationship between water and energy, especially between water and biomass for energy purposes. Results show large differences between the average WF of non-renewable energy carriers on the one hand and the average WF of energy from biomass on the other. But the WF of hydropower is also substantial. The WF of nonrenewable energy carriers increases in the following order: uranium, natural gas, coal and finally crude oil, which shows a WF of ten times the WF of uranium. Within the category of biomass for energy purposes, differences are even larger. These differences are caused by differences in crop characteristics, agricultural production situations, climatic circumstances, as well as by local factors. For example, the WF per unit of energy of cotton grown in Zimbabwe is forty times the WF of maize grown in the Netherlands. Biomass grown for energy purposes, such as poplar, miscanthus or winteroilseedrape, do not show more favorable WF's than food crops, such as, for example, maize. The study showed that the WF of energy from biomass is 70 to 400 times larger than the WF of a mix of energy from non-renewable sources. The current and future economic development causes an ever increasing need for natural resources, such as freshwater. A shift towards CO2-neutral energy carriers, as promoted to decrease the impact of fossil energy on the climate system, will bring with it a need for more water. The concept of the WF and the results for biomass presented in this paper have led to new insights with respect to the large impact of energy from biomass on the use of fresh water resources. This knowledge can be a valuable contribution to research concerning energy needs and fresh water availability for the near future.
References
[3] ECN Biomass. Phyllis, the composition of biomass and waste, 2007 http://www.ecn.nl/phyllis/
[1] Chapagain AK and Hoekstra AY. Water footprints of nations. Value of Water Research Report Series No. 16, 2004. Delft, the Netherlands: UNESCO-IHE. www.waterfootprint.org
[4]. Falkenmark M. Meeting water requirements of an expanding world population. In: Greenland DJ, Gregory PJ and Nye PH (eds) Land Resources: On the edge of the Malthusian principle? 1997, p 929-936.
[2]. Costanza R and Daly HE. Natural capital and sustainable development. Conserv. Biol.Vol 6, 1992, p 37-46.
[5]. FAO, 2007. http://www.fao.org.
41
Leens …
2/07/08
14:41
Page 42
Winnie Gerbens-Leenes, Arjen Hoekstra, Theo van der Meer/ISESCO Science and Technology Vision - Volume 4, Number 5 (May 2008) (38-42)
[6]. Gleick PH. Water and energy. In: Gleick PH (eds.), Water in crisis. A guide to the world's fresh water resources, 1993. p 67-79 (Oxford University Press, New York, Oxford).
assessment of water management in agriculture, 2007. Molden, London: Earthscan, and Colombo: International water management institute. [14]. Müller MJ and Hennings D. Climate 1, the global climate data atlas, 2000. University Flensburg, Inst. F. Geografie, Flensburg, Germany.
[7]. Gleick PH. Water and energy. Annu. Rev. Energy Environ. Vol 19, 1994. p 267-99.
[15]. Moll HC, Noorman KJ, Kok R, Engström R, Throne-Holst H and Clark C. Pursuing more sustainable consumption by analyzing household metabolism in European countries and cities. Journal of Industrial Ecology 9(1-2). 259-275.
[8]. Hoekstra AY and Chapagain AK. Water footprints of nations: Water use by people as a function of their consumption pattern. Water Resour. Manage. Vol 21, 2007, p 35-48.
[16]. Noorman KJ and Schoot Uiterkamp AJM. Green Households? Domestic Consumers, Environment and Sustainability, 1998 Earthscan publications, London.
[9]. Hoekstra AY and Hung P.Q. Virtual water trade: a quantification of virtual water flows between nations in relation to international crop trade. Value of Water Research Report Series, Vol. 11, 2002. UNESCO-IHE, Delft, the Netherlands.
[17]. Postel SL, Daily GC and Ehrlich PR. Human appropriation of renewable fresh water. Science 271(1996) 785-788.
[10]. IPCC. Climate Change 2001: Synthesis Report. A Contribution of Working Groups I, II, and III to the Third Assessment Report of theIntegovernmental Panel on Climate Change [Watson RT and the Core Writing Team (eds.)], 2001. Cambridge University Press, Cambridge,United Kingdom, and New York, NY, USA, 398 pp.
[18]. Shiklomanov IA. 2000. Appraisal and assessment of world water resources. Water International 25 (1). 11-32. [19]. UNESCO. Water a shared responsibility, The United Nations world water development report 2, 2006. UNESCO Publishing, Paris/ Berghahn Books, Oxford.
[11]. Kramer KJ, Biesiot W, Kok R, Wilting HC and Schoot Uiterkamp AJM. Energie geld(t). Interfacultaire Vakgroep Energie en Milieukunde (IVEM). IVEM-onderzoeksrapport 71, 1994. Groningen, the Netherlands.
[20]. USDA. World Agricultural Outlook Board. Joint Agricultural Weather Facility, 2007. www.usda.gov/ [21]. Vries De BJM, Vuuren Van DP & Hoogwijk MM. Renewable energy sources: their global potential for the first-half of the 21st century at a global level: an integrated approach. Energy Policy Vol 35, 2006, p 2590-2610.
[12]. Ma J, Hoekstra AY, Wang H, Chapagain AK and Wang D. Virtual versus real water transfers within China. Phil. Trans.R.Soc. B, Vol 361, 2006, p 835-842. [13]. Molden D, Faurès JM, Finlayson M, Gitay H, Muylwijk J, Schipper L, Vallée D and Coates D. Setting the scene. In: Comprehensive assessment of water management in agriculture. Water for food water for life: Comprehensive
[22]. Vringer, K., & Blok, K. 1995. The direct and indirect energy requirement of households in the Netherlands. Energy Policy 23(10). 893-910.
42