Image segmentation by mathematical morphology is a methodology based upon the notions of watershed and homotopy modification. This paper aims at.
THE WATERSHED TRANSFORMATION APPLIED TO IMAGE SEGMENTATION S. BEUCHER Centre de Morphologie Mathématique Ecole des Mines de Paris 35, rue Saint-Honoré 77305 FONTAINEBLEAU CEDEX (France) Abstract Image segmentation by mathematical morphology is a methodology based upon the notions of watershed and homotopy modification. This paper aims at introducing this methodology through various examples of segmentation in materials sciences, electron microscopy and scene analysis. First, we define our basic tool, the watershed transform. We show that this transformation can be built by implementing a flooding process on a grey-tone image. This flooding process can be performed by using elementary morphological operations such as geodesic skeleton and reconstruction. Other algorithms are also briefly presented (arrows representation). Then, the use of this transformation for image segmentation purposes is discussed. The application of the watershed transform to gradient images and the problems raised by over-segmentation are emphasized. This leads, in the third part, to the introduction of a general methodology for segmentation, based on the definition of markers and on a transformation called homotopy modification. This complex tool is defined in detail and various types of implementation are given. Many examples of segmentation are presented. These examples are taken from various fields : transmission electron microscopy, SEM, 3D holographic pictures, radiography, non destructive control and so on. The final part of this paper is devoted to the use of the watershed transformation for hierarchical segmentation. This tool is particularly efficient for defining different levels of segmentation starting from a graph representation of the images based on the mosaic image transform. This approach will be explained by means of examples in industrial vision and scene analysis. =====================================
INTRODUCTION The watershed transformation is a powerful tool for image segmentation. In this paper, the different morphological tools used in segmentation are reviewed, together with an abundant illustration of the methodology through examples of image segmentation coming from various areas of image analysis. There exist two basic ways of approaching image segmentation. The first one is boundary-based and detects local changes. The second is region-based and searches for pixel and region similarities. We shall see that the watershed transformation belongs to the latter class. Beucher and Lantuejoul were the first to apply the concept of watershed and divide lines to segmentation problems [3]. They used it to segment
1
images of bubbles and SEM metallographic pictures. Unfortunately, this transformation very often leads to an over-segmentation of the image. To overcome this problem, a strategy has been proposed by Meyer and Beucher [7]. This strategy is called marker-controlled segmentation. This approach is based on the idea that machine vision systems often roughly "know" from other sources the location of the objects to be segmented. This approach is applied as follows : first, we define the properties which will be used to mark the objects. These markers are called object markers. The same is done for the background, i.e., for portions of the image in which we are sure there is no pixel belonging to any object. These markers constitute the background markers. The rest of the procedure is straightforward and is the same for all applications : the gradient image is modified in order to keep only the most significant contours in the areas of interest between the markers. This gradient modification consists in changing the homotopy of the function. Then, we perform the final contour search on the modified gradient image by using the watershed transformation. No supervision, no parameter and no heuristics is needed to perform the final segmentation. The parameterization controlling the segmentation is concentrated in the marker construction step where it is easier to control and validate it. The gradient image is often used in the watershed transformation, because the main criterion of the segmentation is the homogeneity of the grey values of the objects present in the image. But, when other criteria are relevant, other functions can be used. In particular, when the segmentation is based on the shape of the objects, the distance function is very helpful. In the first part, we describe the main morphological tools used in segmentation : gradient, distance function, geodesic distance function and watershed transformation. For this last transformation, some algorithms are presented. In the second part, we introduce the concept of markers and the homotopy modification of the transformed function for solving over-segmentation problems. Many examples illustrate this methodology. The final part of this paper is devoted to the use of the watershed transformation for hierarchical segmentation. This tool is particularly efficient for defining different levels of segmentation starting from a graph representation of the images based on the mosaic image transform. This
2
approach will scene analysis.
be
explained
by
means
of
examples
in
industrial
vision
and
I - THE BASIC TOOLS FOR SEGMENTATION For the sake of simplicity, we will consider only digital pictures. A grey-tone image can be represented by a function f : Z2 Z. f(x) is the grey value of the image at point x. The points of the space Z2 may be the vertices of a square or of a hexagonal grid. A section of f at level i is a set X i (f) defined as : Xi(f) = {x ∈ Z2 : f(x) ≥ i} In the same way, we may define the set Z i (f) : Zi(f) = {x ∈ Z2 : f(x) ≤ i} We have obviously : Xi(f) = Zci+1(f) L
I-1) Morphological gradient ======================================================================================================
The morphological gradient of a picture is defined as : g(f) = (f s B) - (f x B) where f s B and f x B are respectively the elementary dilation and erosion of f [1].
figure 1. Construction of the morphological gradient of an image When f is continuously differentiable, the modulus of the gradient of f (figure 1) :
3
this
gradient
is
equivalent
to
!( )2 ( )2@1/2 g(f) = || ∂f | + | ∂f | | 9 ∂y 0 2| 1|9 ∂x 0 The simplest way to approximate this modulus is to assign to each point x the difference between the highest and the lowest pixels within a given neighborhood of x. In other words, for a function f, it is the difference between the dilated function f s B and the eroded function f x B. ==========
==========
I-2) Distance function ==============================================================================
Let Y be a set of Z2. For every point y of Y, define the distance of y to the complementary set Yc (figure 2) : ∀ y∈Y, d(y) = dist(y, Yc) It can easily be shown that a section of d at level i is given by : Xi(d) = {y : d(y)≥i} = Y x Bi where Bi is a disk of radius i.
(a) (b) figure 2. Distance function (b) of a set (a) I-3) Geodesy, geodesic distance ==========================================================================================================================
Let X ⊂ Z2 be a set, x and y two points of X. We define the geodesic distance dX(x,y) between x and y as the length of the shortest path (if any) included in X and linking x and y (figure 3a) [4]. Let Y be any set included in X. We can compute the set of all points of X that are at a finite geodesic distance from Y :
4
RX(Y) = {x ∈ X : ∃ y ∈ Y, dX (x,y) finite} RX(Y) is called the X-reconstructed set by the marker set Y. It is made of all the connected components of X that are marked by Y.
(a) (b) figure 3. Shortest path and geodesic distance (a) SKIZ of a set Y in X (b) Suppose now that Y is composed of n connected components Y . The i
geodesic zone of influence zX(Yi) of Yi is the finite geodesic distance from Yi and closer to (figure 3b) : zX(Yi) = {x ∈ X : dX(x,Yi) finite and ∀j ≠ i, The boundaries between the various zones of skeleton by zones of influence of Y in X. We shall write : IZX(Y) = ∪i zX(Yi) and : SKIZX(Y) = X / IZX(Y) where / stands for the set difference.
set of points of X at a Yi than to any other Yj dX(x,Yi) < dX(x,Yj)} influence give the geodesic
I-4) Minima, maxima of a function ===========================================================================================================================================
Among the various features that can be extracted from an image, the minima and the maxima are of primary importance. The set of all the points {x,f(x)} belonging to Z2 x Z can be seen as a topographic surface S. The lighter the grey value of f at point x, the higher the altitude of the corresponding point {x,f(x)} on the surface. The minima of f, also called regional minima, are defined as follows.
5
Consider two points s1 and s2 of this surface S. A path between s1(x 1 ,f(x 1 )) and s2 (x2 ,f(x2 )) is any sequence {si } of points of S, with si adjacent to si+1. A non ascending path is a path where : ∀ si(xi,f(xi)), sj (xj ,f(xj )) i ≥ j ⇔ f(xi ) ≤ f(xj ) A point s ∈ S belongs to a minimum iff there exists no ascending path starting from s. A minimum can be considered as a sink of the topographic surface (figure 4). The set M of all the minima of f is made of various connected components Mi (f).
figure 4. Minima and maxima of a function A similar definition holds for the maxima. I-5) The watershed transformation ======================================================================================================================================
Consider again an image f as a topographic surface and define the catchment basins of f and the watershed lines by means of a flooding process. Imagine that we pierce each minimum Mi (f) of the topographic surface S, and that we plunge this surface into a lake with a constant vertical speed. The water entering through the holes floods the surface S. During the flooding, two or more floods coming from different minima may merge. We want to avoid this event and we build a dam on the points of the surface S where the floods would merge. At the end of the process, only the dams emerge. These dams define the watershed of the function f. They separate the various catchment basins CBi (f), each one containing one and only one minimum Mi(f) (figure 5).
6
(a) (b) figure 5. Flooding of the relief and dam building (a) catchment basins and divide lines (b) I-5-1) Building the watershed =======================================================================================================
The definition of the watershed transformation directly transposed by using the sections of the function f.
by
flooding
may
be
figure 6. Watershed construction using geodesic SKIZ Consider (figure 6) a section Zi (f) of f at level i, and suppose that the flood has reached this height. Consider now the section Zi+1 (f). We see immediately that the flooding of Zi+1(f) is performed in the zones of influence of the connected components of Zi (f) in Zi+1 (f). Some connected components of Zi+1(f) which are not reached by the flood are, by definition, minima at level i+1. These minima must therefore be added to the flooded area. Denoting by Wi(f) the section at level i of the catchment basins of f,
7
and by Mi+1(f) the minima of the function at height i+1, we have : Wi+1(f) = IZZ (Xi(f) ∪ Mi+1 (f) i+1(f) The minima at level i+1 are given by : Mi+1(f) = Zi+1(f) / RZ (Zi (f)) i+1(f) This iterative algorithm is initiated with W-1 (f) = Ø. At the process, the watershed line DL(f) is equal to : DL(f) = WNc (f) (with max(f) = N) q
e
z
c
the
end
of
I-5-2) Other algorithms ===========================================================================
The watershed algorithms can be divided in two groups. The first group contains algorithms which simulate the flooding process. The second group is made of procedures aiming at the direct detection of the watershed points. The previous algorithm belongs to the first group : it simulates the flooding of the surface S starting from the minima of f. We will now briefly present another algorithm belonging to the second group and based on the arrows representation of a function f [1].
(a) (b) figure 7. Function f (a) and its complete graph of arrows (b) From f : Z 2 Z, we may define an oriented graph whose vertices are the points of Z 2 and with edges or arrows from x to any adjacent point y iff f(x) < f(y) (figure 7). The definition does not allow the arrowing of the plateaus of the topographic surface. This arrowing can be performed by means of geodesic dilations. The operation is called the completion of the arrows graph. Moreover, in order to suppress problems due to the fact that a watershed L
8
line is not always of zero thickness, a more complicated procedure called over-completion is used, which leads to a double arrowing for some points. Then, starting from this complete graph (over-completed), we may select some configurations which, locally, correspond to divide lines. These configurations are represented on figure 8 for the 6-connectivity neighborhood of a point on a hexagonal grid (up to a rotation). 1
0
1
0
\
0
1
1
\ >
0
J----------
1
\ >
0
0
0
0
U
0
0
0 \
0
1
1
0
J----------
1
/
0
0
1
0
1
0
O /
0
M
/ >
O
1
/ >
O
\
M
0
0 1
/
/
0
\
1
1 0
1 \
M
U \
>
1
/ >
1
M
0
0
U \
1
figure 8. Configurations of arrows corresponding to possible divide points (hexagonal grid) Any point receiving arrows from more than one connected component of its neighborhood may be flooded by different lakes. Consequently, this point may belong to a divide line. In a second step, the arrows starting from the selected points must be suppressed. These points, in fact, cannot be flooded, so they cannot propagate the flood. Doing so, we change the arrowing of the neighboring points and consequently the graph of arrows.
(a) (b) figure 9. Watershed by arrowing : primary divide points (a) final result (b) Provided that the over-completion of this new graph has been made, some new
9
divide points may then appear. The procedure is re-run until no new divide point is selected (figure 9). This algorithm produces local watershed lines. The true divide lines can be extracted easily. They are the only ones which form closed curves. Many watershed algorithms exist. They aim at reducing the computation time by only taking into account the points in the image that need to be modified at each step of the process. These algorithms are detailed in [6],[8]. II - APPLICATION TO IMAGE SEGMENTATION II-1) Principle =======================================
The application of the watershed to image segmentation will be explained through a didactic example : the segmentation of single dots in an image (radon gas bubbles in a radioactive material). The dots in figure 10a appear as domes with a round summit. Each dome has a unique summit. Our problem is to find the best contour. A solution consisting in simply using a threshold is not sufficient because with a low threshold, the lowest domes are correctly detected, but the highest domes are much too large. A higher threshold, while detecting correctly the higher domes, misses the lower. Since absolute values cannot be used, we may try instead the variation of the function, that is its gradient (figure 10c). The corresponding gradient image should present a volcano-type topography as depicted in figure 10b. The contours of the proteins blobs correspond therefore to the watershed lines of the gradient image g(f) (figure 10d). In the new image, each dot of the original image becomes a regional minimum surrounded by a closed chain of mountains, like a basin. The varying altitude of the chain of mountains expresses the contrast variation along the contour of the original dot. II-2) The over-segmentation problem =============================================================================================================================================
We can try to solve a similar problem, the contouring of proteins in an electrophoresis gel, by the same procedure (figure 11). Unfortunately, the real watershed transform of the gradient, given in figure 11b, present many catchment basins. Each catchment basin corresponds
10
(a)
(b)
(c) (d) figure 10. Simple blobs in a radioactive material (a), topographic surface of the initial function and of the gradient image (b), morphological gradient (c), watershed transform of the gradient image (d) to a minimum of the gradient. These minima are produced by small variations, mainly due to noise, in the grey values. This over-segmentation could be reduced by appropriate filtering. But a better result will be obtained if we mark the patterns to be segmented before performing the watershed transformation of the gradient. Suppose that we mark each blob of protein of the figure 11a. This marking can be performed by extracting the minima of f. We must also define a marker for the background. In order to get a connected marker surrounding the blobs, we apply the watershed to the initial image. Then, we obtain a set of markers M (figure 11c). We consider again the
11
(a)
(b)
(c) (d) figure 11. Electrophoresis gel (a), watershed of the gradient image (b) set of selected markers (c), final segmentation (d) topographic surface of the gradient image and the flooding process, but, instead of piercing the minima of this surface, we will only make holes through the components of the marker set M. The flooding will invade the surface and produce as many catchment basins as there are markers in the marker set. Moreover, the watershed lines corresponding to the contours of the objectswill occur on the crest lines of this topographic surface (figure 11d). This algorithm can be written as follows. If Wi(g) is the section at level i of the new catchment basins of g, we
12
have : Wi+1(g) = IZZ ∪ M (Wi(g)) i+1 with : W-1(g) = M, marker set Surprisingly, this algorithm is simpler than the pure algorithm, because we do not take the real minima of g into account.
watershed
II-3) Homotopy modification =======================================================================================================
The previous procedure can be implemented in two steps. The first one consists in modifying the gradient function g in order to produce a new gradient g’. This new image is very similar to the original one, except that its initial minima have disappeared and have been replaced by the set M. This image modification also called homotopy modification can be performed by reconstructing the sections of g with the markers M. We have : ∀i, Z (g’) = R (M) i Zi(g)UM This transformation is called geodesic reconstruction of a function. The gradient function g controls the reconstruction of a function defined from the markers M as illustrated in figure 12.
figure 12. Principle of the homotopy modification of a function f by a set of selected minima The second step modified gradient g’.
simply
consists
13
in
performing
the
watershed
of
the
III - THE SEGMENTATION PARADIGM This first example of segmentation leads to a general scheme. Image segmentation consists in selecting first a marker set M pointing out the objects to be extracted, then a function f quantifying a segmentation criterion (this criterion can be, for instance, the changes in grey values). This function is modified to produce a new function f’ having as minima the set of markers M. The segmentation of the initial image is performed by the watershed transform of f’ (figure 13).
figure 13. Synopsis of the morphological segmentation methodology The segmentation process is therefore divided in two steps : an "intelligent" part whose purpose is the determination of M and f, and a "straightforward" part consisting in the use of the basic morphological tools namely : watershed and image modification. A lot of segmentation problems may be solved according to this general scheme. Let us illustrate this procedure with two examples. III-1) Segmentation of overlapping grains ==============================================================================================================================================================
The figure 14a represents a TEM image of grains of silver nitrate scattered on a photographic plate. Some of them are overlapping and they need to be segmented in order to measure without bias their size and shape. To apply the methodology described above, the background, the grains and the overlapping regions must be pointed out. To do so, we first threshold the initial image (an automatic thresholding can be performed without difficulty) (figure 14b). Then, the maxima of the distance function
14
d(X) of the binary image X provide the markers of the grains (figure 14c). The markers of the overlapping regions are obtained in a more refined way. The watershed transformation of the inverted distance function -d(X) produces divide lines which cut the overlapping grains (figure 14d). These divide lines pass through the overlapping regions and consequently are used to mark them (figure 14e). The marker of the background is simply the set Xc slightly eroded (figure 14f).
(a)
(b)
(c) (d) figure 14. TEM image of silver grains (a), thresholded image of grains (b) markers of the grains (c), first segmentation of the grains (d) The function (figure 14g).
controlling
the
segmentation
15
is
the
gradient
function
The homotopy modification and the watershed construction are performed. The figure 14h shows the final result, after the elimination of the artifacts.
(e)
(f)
(g) (h) figure 14 (continued). Final markers of the overlapping regions (e) set M of markers (f), gradient image (g), final segmentation (h) III-2) Stereoscopic analysis of a fracture in steel ====================================================================================================================================================================================================
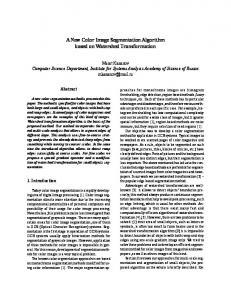
The second example is a problem of segmentation of cleavage facets in a SEM micrograph of a steel fracture (figure 15). The function used for the watershed along with the markers set are built by combining a photometric criterion (contrast between facets due to blazing ridges) and a shape
16
criterion (facets are supposed to be more or less convex).
figure 15. Stereo pair of a cleavage fracture in steel Two functions are defined : the first one, f1 , is the supremum of the gradient function of the initial image f and of a morphological transformation called "Top-Hat" transformation [5]. The Top-Hat transform TH(f) defined as the difference between the function and its morphological opening is a contrast detector suitable for enhancing in the image the blazing zones (figure 16a) : f = Sup (g(f),TH(f)) 1
The second function f2 is the distance function to the blazing zones and to the contours. It can be shown [1] that this function may be built by dilating the previous function f1 by a cone (figure 16b). The markers of the facets are the minima of f2 (figure 16c). We can see that more than one marker may appear in regions which obviously correspond to simple facets. This multiple marking leads to an over-segmentation of the facets. In order to eliminate this over-segmentation, the watershed transformations of the two functions f1 and f2 are performed (figure 16d) and only the divide lines which are superimposed in the two watershed transforms are kept (figure 16e). The methodology of the segmentation based on the primary definition of the markers of the objects to be extracted is particularly helpful here. Indeed, when the first picture of the stereoscopic pair has been segmented and the corresponding facets selected, the markers used in this first step can be used again to segment the homologous facets in the second picture of
17
(a)
(b)
(c) figure 16. First function used for segmentation (a) second function (b), markers of the facets (c) the stereo pair. The procedure is the following : the markers attached to a facet in the first image are "thrown" onto the second image f’2 corresponding for the second picture to the image f2. These markers fall along the steepest slope of f’2 and each one reaches a unique minimum of f’. These 2 minima are the markers of the homologous facet in the second picture (figure 17). Doing so, we establish a one-to-one correspondence between the markers of the two pictures of the stereo pair and therefore, between the segmented facets (figure 18).
18
(d)
(e) figure 16 (continued). Watershed lines of the two functions f final contours (e)
and f
As soon as the same facet (or part of a facet) has been the two pictures of the stereo pair, the computation of orientation in space is relatively easy. By following the points in the two contours, it is possible to calculate the them and hence their height. Assuming that a facet is almost interpolation is performed. Finding the cleavage angle between facets (which is in fact the required parameter) is immediate.
19
(d)
segmented in its size and corresponding shift between a plane, its two adjacent
This approach of the objects instead of trying to
stereovision consisting in segmenting first find immediately the homologous pixels in
the the
(a) (b) figure 17. Markers of the first image (a) corresponding markers in the second one (b) two images is very powerful : the watershed transformation coupled with the markers selection allows to find directly the corresponding objects in the stereo pair. Moreover, this topological approach allows to control very accurately this correspondence (two adjacent objects in the scene are in most cases adjacent in both images of the stereo pair).
figure 18. Homologous facets in the stereo pair
20
IV - HIERARCHICAL SEGMENTATION IV-1) Introduction ====================================================
Unfortunately, in some cases, the markers selection and extraction are not so easy. Some pictures may be very noisy and image processing becomes more and more complex. In other cases, the objects to be detected may be so complex and so varied in shape, grey level and size that it is very hard to find reliable algorithms enabling their extraction. For that reason, we need to go a step further in the segmentation. We know that the initial watershed transformation of the gradient image provides very unsatisfactory results : many apparently homogeneous regions are fragmented in small pieces. Fortunately, the watershed transform itself, applied on another level, will help us to merge the fragmented regions. Indeed, if we look at the boundaries produced by the segmentation, they do not have the same weight. Those which are inside the almost homogeneous regions are weaker. In order to compare these boundaries, we need to introduce neighborhood relations between them through the definition of a new graph. This graph is built from a simplified version of the original image called partition or mosaic image. IV-2) The mosaic image ===================================================================================
Consider a grey-tone image f, and its corresponding morphological gradient image g(f). A simplified image can be computed in the following way : - First, we calculate the watershed of the gradient image. - Secondly, we label every catchment basin of the watershed with the grey value in the initial image f corresponding to the minima of g(f). The figure 19a illustrates this operation. The initial image is a X-ray photograph of metallic particles in the burst produced by a shaped charge weapon. The result is a simplified image (figure 19b), made of a mosaic of pieces (the catchment basins) of constant grey levels, where no information regarding the contours has been lost. This simplified image, also called mosaic image, may then be used to define a valued graph, to which the morphological transforms, and in particular the watershed, can be extended.
21
(a) (b) figure 19. Computation of the mosaic image (a) initial (upper) and mosaic (lower) images (b) IV-3) Hierarchical segmentation ====================================================================================================================
Let us build a new valued graph from the mosaic image. First, two boundaries of the mosaic are considered neighbors if they surround the same catchment basin. Second, the boundaries between two tiles of the mosaic image are valued with the grey tone difference between these tiles.
figure 20. Gradient of the mosaic image (a), and the corresponding graph used in the hierarchical approach (b) All the morphological transformations can be extended to the resulting graph illustrated in figure 20, where the summits correspond to the simple
22
arcs of the primitive watershed transform and the vertices connect the boundaries surrounding the same primitive catchment basin. In particular, the notion of minimum as it is defined above using paths on the graph of a function, can be applied to this valued graph. In our case, the weakest boundaries of the mosaic image correspond to regional minima of the new graph (figure 21a). We may flood the relief of the graph starting from these minima. All the boundaries inside the catchment basins are suppressed. Only the boundaries corresponding to the divide lines of the graph remain. Doing so, we have suppressed the boundaries of the primitive watershed which are
(a)
(b)
(c) figure 21. Initial watershed (a), hierarchical segmentation (b) final result (c)
23
surrounded by the more contrasted ones. The result of this hierarchical segmentation is given in figure 21b. From that picture, the extraction of the particles is straightforward. They correspond to the new catchment basins that contain the maxima of the initial image (figure 21c). IV-4) Other examples ======================================================================
(a)
(b)
(c) figure 22. Road scene (a), first level of segmentation (b) second level of the hierarchy (c) This hierarchical segmentation features from complex scenes. For for delineating the road in figure 22.
can be used efficiently for extracting instance, this technique has been applied
24
The result of the watershed transformation yields to a hierarchical segmentation of the image, as illustrated in the previous example. The selection of some markers can be made at this level to segment features in the image (for example, the road in our case). Further levels of hierarchy may also be defined by iterating this procedure [2]. Starting from a highly fragmented image, we have obtained after simplification a new mosaic. It is obviously possible to iterate this simplification process. By this means we get a hierarchy of simplification stages, the last always being a uniform image. CONCLUSION The segmentation of images by means of the watershed transform and the use of markers has many advantages : - The watershed transform provides closed contours by construction. - When computing the watershed, there is a good match between the contours which undoubtedly appear in the image and the divide lines of the gradient watershed, even when it is severely over-segmented. - It is a general method which can be applied in many situations. The examples given in this paper are in fact a small selection of the domains in image analysis where this technique has been used efficiently. - The great advantage of this methodology is that it splits into two separate steps the segmentation process. First, we must detect what we want to extract : it is the markers selection. Then, we define the criteria required to segment the image. This last assertion means that image segmentation cannot be performed accurately and adequately if we do not construct the objects we want to detect. In this approach, the picture segmentation is not the primary step of image understanding. On the contrary, a fair segmentation can be obtained only if we know exactly what we are looking for in the image. REFERENCES 1. Beucher S., Segmentation d’images et morphologie Thesis, Paris School of Mines, France, June 1990. 2. Beucher S., Bilodeau M.and Yu X., algorithms", Proc. of PROMETHEUS
mathématique,
Doctorate
"Road Segmentation by watershed workshop, Sophia-Antipolis, France, April
25
1990. 3. Beucher S. and Lantuéjoul C., "Use of watersheds Int. Workshop on Image Processing, Real-Time detection/estimation, CCETT/INSA/IRISA, IRISA Report Rennes, France, 17-21 Sept. 1979.
in contour detection", edge and motion n˚132, pp. 2.1-2.12,
4. Lantuejoul C. and Beucher S., "On the use of the geodesic metric in image analysis", J. of Microscopy, Vol. 121, Pt 1, Jan. 1981. 5. Meyer F., Cytologie quantitative et Morphologie thesis, Paris School of Mines, Paris, France, May 1979. 6. Meyer F., "Skeletons and 4, pp. 335-363, April 1989.
perceptual
graphs",
Signal
Mathématique,
Process.,
Vol.
Doctorate
16,
n˚
7. Meyer F. and Beucher S., "Morphological Segmentation", Journal of Visual Communication and Image representation, Vol. 1, n˚ 1, pp. 21-46, Sept. 1990, Academic Press. 8. Soille P. and Vincent L., "Determining watrsheds in digital pictures via flooding simulations", Proceeding SPIE, Vol. 1360, Visual Communications and Image Processing ’90, Oct. 1990.
26