940
SOEPpapers on Multidisciplinary Panel Data Research
SOEP — The German Socio-Economic Panel study at DIW Berlin
940-2017
The working class left behind? The class gap in life satisfaction in Germany and Switzerland over the last decades
Oliver Lipps and Daniel Oesch
2017
The German Socio-Economic Panel study
SOEPpapers on Multidisciplinary Panel Data Research at DIW Berlin This series presents research findings based either directly on data from the German SocioEconomic Panel study (SOEP) or using SOEP data as part of an internationally comparable data set (e.g. CNEF, ECHP, LIS, LWS, CHER/PACO). SOEP is a truly multidisciplinary household panel study covering a wide range of social and behavioral sciences: economics, sociology, psychology, survey methodology, econometrics and applied statistics, educational science, political science, public health, behavioral genetics, demography, geography, and sport science. The decision to publish a submission in SOEPpapers is made by a board of editors chosen by the DIW Berlin to represent the wide range of disciplines covered by SOEP. There is no external referee process and papers are either accepted or rejected without revision. Papers appear in this series as works in progress and may also appear elsewhere. They often represent preliminary studies and are circulated to encourage discussion. Citation of such a paper should account for its provisional character. A revised version may be requested from the author directly. Any opinions expressed in this series are those of the author(s) and not those of DIW Berlin. Research disseminated by DIW Berlin may include views on public policy issues, but the institute itself takes no institutional policy positions. The SOEPpapers are available at http://www.diw.de/soeppapers Editors: Jan Goebel (Spatial Economics) Martin Kroh (Political Science, Survey Methodology) Carsten Schröder (Public Economics) Jürgen Schupp (Sociology) Conchita D’Ambrosio (Public Economics, DIW Research Fellow) Denis Gerstorf (Psychology, DIW Research Director) Elke Holst (Gender Studies, DIW Research Director) Frauke Kreuter (Survey Methodology, DIW Research Fellow) Frieder R. Lang (Psychology, DIW Research Fellow) Jörg-Peter Schräpler (Survey Methodology, DIW Research Fellow) Thomas Siedler (Empirical Economics, DIW Research Fellow) C. Katharina Spieß (Education and Family Economics) Gert G. Wagner (Social Sciences) ISSN: 1864-6689 (online) German Socio-Economic Panel (SOEP) DIW Berlin Mohrenstrasse 58 10117 Berlin, Germany Contact:
[email protected]
The working class left behind? The class gap in life satisfaction in Germany and Switzerland over the last decades Oliver Lipps (Swiss Centre of Expertise in the Social Sciences FORS, Lausanne, Switzerland,
[email protected]) & Daniel Oesch (Life Course and Inequality Research Centre LINES, University of Lausanne, Switzerland,
[email protected])
Abstract The 1990s and 2000s were a gloomy period for Germany’s working class, hit by mass unemployment, welfare retrenchment and wage stagnation. We examine whether the growing economic disparity between the top and the bottom of Germany’s class structure was accompanied by a widening class gap in life satisfaction. We analyse whether there is a social class gradient in life satisfaction and whether, over the last decades, this class gradient increased in Germany, relative to the comparison case of Switzerland. We use panel data for Germany (1984-2014) and Switzerland (2000-2015) and check the robustness of our results by replicating our analysis with the pooled German and Swiss samples of the European Social Survey (2002-2014). In both countries, respondents in higher classes report substantially higher life satisfaction than those in lower classes. The class gap is twice as large in Germany than in Switzerland. In Germany, the class gap in life satisfaction narrowed between 1984 and 1990, strongly widened between 1990 and 2005 and then decreased again after 2010. In Switzerland, the class gap did not follow a clear time trend, but remained basically constant. In Germany, differences in unemployment risks and household income account for half of the class gap and its evolution over time.
Keywords: Germany, inequality, life satisfaction, social class, Switzerland, unemployment, working class
1
Introduction One of the driving forces behind the Brexit vote and the election of Donald Trump was arguably working-class discontent – the increasingly bleak life chances of blue collar workers (O’Reilly et al. 2017). The American and British working classes are not alone in facing difficult prospects. The two decades between the fall of the Wall and the Great Recession were not a good period for Germany’s working class either. Mass unemployment, welfare state retrenchment and the decline of trade unions weakened low educated workers’ position in the labour market. As a result, the 1990s and 2000s brought a rise in low-paid work and wage inequality (Bosch 2009). While real wages increased at the top of the earnings distribution, they declined at the bottom (Antonczyk et al. 2010). The widening gap in life chances between the top and the bottom of Germany’s class structure – between the upper-middle and the working class – is well documented (Streeck 2009). The question raised in this paper is whether this growing economic disparity was also accompanied by an increasing gap in workers’ life satisfaction. We answer this question by analysing for Germany the extent and evolution of the social class gradient in life satisfaction since the mid-1980s. Our paper thus examines whether, over the last decades, the gap in subjective well-being between the upper-middle and the working class widened in Germany. A sizable body of research analyses inequality in life satisfaction over time and across countries, commonly measured using the variance of life satisfaction within the entire population (e. g. Alesina et al. 2004, Delhey and Kohler 2011). Enquiries into the social class gradient of life satisfaction are harder to come by. A recent study suggests that the gap in psychological wellbeing has not widened between the working and the middle classes since the early 1990s in Britain (Richards and Paskov 2016). With respect to Germany, we know that the working class has lost out in terms of earnings between the mid-1990s and the mid-2000s (Bosch 2009). The open question is as to whether 2
it was also left behind in terms of life satisfaction. However, an increasing gap in life satisfaction between social classes in Germany may well be driven by other causes than the increasing disparity in economic opportunities. Notably, it may be the result of international trends such as globalization (and offshoring) or skill-biased technological change (and automation), which arguably make life more difficult for the lower classes everywhere in Western Europe. We address this issue by comparing the evolution in life satisfaction in Germany with that in Switzerland, a neighbouring country that was exposed to the same shifts in trade and technology, but where labour market institutions, wage inequality and the proportion of lowpaid work remained stable over the last two decades (Grabka and Kuhn 2012). Our paper makes three contributions. First, it presents novel evidence on the surprisingly large extent of the class gap in life satisfaction in Germany and Switzerland – and uses the best available microdata to show how it evolved over the last decades. Second, it shows that during Germany’s long economic stagnation of the 1990s and early 2000s, the social class gradient in life satisfaction widened, while it remained basically constant in the comparison case of Switzerland. The main driver behind this growing class gap was the differential exposure of the upper-middle and the low-skilled working class to the risk of unemployment and low earnings. Finally, our paper addresses the scepticism about the feasibility of reliably measuring life satisfaction by replicating our analysis with a second dataset. We present results based on the German Socio-Economic Panel (SOEP), 1984-2014, and the Swiss Household Panel (SHP), 2000-2015 as well as on the German and Swiss samples of the European Social Survey 2002-2014. We first discuss the literature on inequality in subjective wellbeing. We then show that Germany’s working class was left behind during the country’s long economic stagnation of the 1990s and early 2000s, leading to our hypothesis of a widening class gap in life 3
satisfaction in Germany, but not in Switzerland. We then discuss our data, measures and estimation method and present our results for the evolution of the social class gradient in life satisfaction in Germany and Switzerland. The conclusion puts our findings into a larger context.
The link between economic inequality and life satisfaction Research on subjective wellbeing has become a growth industry in recent years, spurred by the increasing availability of surveys that include questions about life satisfaction and happiness. If one focuses on studies covering at least a decade worth of data, the commonly reported finding is that larger income inequality is linked with larger inequality of happiness in a given country and period (Alesina et al. 2004, Delhey and Dragolov 2014, Oishi et al. 2011). Two recent reviews of the literature conclude that higher levels of economic inequality tend to be associated, in Western societies, with lower levels of subjective wellbeing (Senik 2009: 3, Schneider 2016: 1725). At the same time, there is a well-established finding that inequality in life satisfaction has been falling in most Western countries since the early 1980s (Clark et al. 2016, Veenhoven 2005: 474). This evolution is puzzling as we observe, over the same period, a U-turn in income inequality with widening gaps between top earners and low earners (Alderson and Nielsen 2002, OECD 2011a). Unlike for the bulk of countries, the evolution in life satisfaction is ambiguous for the United States and Germany. In the US, happiness inequality decreased from its highest level in the 1970s all the way through the 1990s, but started to rise again in the 2000s (Dutta and Foster 2013). When decomposing changes in the distribution of subjective wellbeing between 1972 and 2006, Stevenson and Wolfers (2008: 74) find that the black-white gap in happiness has declined and the gender gap disappeared. Yet the inequality in happiness by education – 4
possibly a proxy for the social class gradient – has increased: happiness was rising among college graduates, decreasing among respondents with some college, and falling sharply among those with a high school degree or less. In Germany, inequality in happiness seems to have steadily decreased during the 1980s and early 1990s. Starting from the mid-1990s, the evolution has either been described as trendless fluctuation (Clark et al. 2016) or, less persuasively, as showing a slight increase in happiness inequality (Becchetti et al. 2013). What seems undisputed is that the 1990s saw a break in the downward trend towards less inequality in subjective wellbeing. What are the mechanisms that lead from economic inequality to life satisfaction? A first argument is rooted in sociology and expects inequality to increase social distance and reduce the feelings of togetherness. Inequality thus erodes social trust and social capital, thereby making a community less liveable (Delhey and Dragolov 2014, Veenhoven 1995). A second argument draws on social psychology and maintains that growing income inequality exacerbates unfavourable status comparisons and leads to greater status anxiety (Wilkinson and Pickett 2009). A third argument stems from political science and expects rising inequality to result in heightened conflicts over material resources and lower overall life satisfaction (Haller and Hadler 2006). Empirical evidence suggests that perceptions of social trust and status anxiety – but less so of conflicts –, partly mediate the inequality-wellbeing link in Europe (Delhey and Dragolov 2014). While this research strand examines how income inequality observed at the level of a region or country affects the subjective well-being of all individuals, our objective is somewhat different. We aim at uncovering the extent – and the evolution – of the disparity in life satisfaction across social classes. By analysing the social class gradient in well-being and its evolution over time, our focus is on economic mechanisms and on how earnings and unemployment risks affects the life satisfaction of people in different class positions. 5
The German working-class left behind Why would we expect a rising gap in life satisfaction across different social classes in Germany since the 1990s? Our argument is that over the last two decades, the economic destiny of the working and the upper-middle class has diverged strongly. The key mechanism that we expect to have driven a wedge in the life satisfaction of the lower and upper classes relates to the labour market, notably the differential evolution of unemployment risks, working conditions and earnings. During the post-reunification recession, unemployment rose rapidly and remained at over 8 per cent for 15 years in a row, from 1993 to 2007. In Germany, unemployment afflicted low educated workers – mostly set in the low-skilled working class – much more than high educated workers. Over the 1990s, the unemployment rate of workers with no more than ten years of formal education was, on average, 2.6 times higher than that of workers with tertiary education. Over the 2000s, this ratio increased to 3.8 (OECD, Education at a Glance, various years). During this long crisis, there was also a weakening of those collective institutions that impose public obligations on employers and thus primarily benefit workers with little bargaining power: older workers, those in temporary contracts and the working class more generally (Carr and Chung 2014). Trade unions and work councils came under pressure during the long economic stagnation of the 1990s when unemployment rose, while union membership and coverage of collective agreements dropped. In parallel, the Hartz laws redesigned between 2003 and 2005 the German welfare state by making unemployment benefits less attractive. The triple influence of persistently high unemployment, the weakening of collective paysetting institutions and cutbacks in unemployment benefits put Germany’s working class under increased market pressure and reduced the wage floor. The result was, after the 1990s, 6
an unprecedented rise in low-wage (and often atypical) work (Eichhorst and Marx 2011) and income inequality (Antonczyk et al 2010). In the early 2000s, income inequality in Germany increased more than twice as much as in the average of the OECD (OECD 2011b). What do these shifts in the labour market mean for the social class gradient in life satisfaction? As Germany’s institutional safeguards have become less effective at sheltering low-skilled workers from insufficient earnings and unemployment, we would expect an increasing class gradient. More precisely, over the last two decades, the gap in life satisfaction between the upper-middle and low-skilled working class should have widened in Germany.
Contrasting the German experience with Switzerland Our hypothesis of a widening gap in life satisfaction may be countered by the argument that this increasing gap may well be due to other factors than the rise of unemployment and earnings inequality and the dismantling of labour market institutions. Low-educated workers may have come under pressure everywhere in the OECD as a consequence of international trade and offshoring or skill-biased technological change and automation. Life may thus have become more difficult for low-educated workers across Europe, the situation in Germany being by no means particular. An ideal case to contrast the German experience – and the effect of unemployment and income inequality – is neighbouring Switzerland. Switzerland has a majority of Germanspeakers and shares several institutional features with Germany, from vocational education to industry-based collective bargaining. However, contrary to Germany, Switzerland’s unemployment rate remained low, its wage-setting institutions were not dismantled and unemployment benefits are comparatively generous with a replacement rate of 70 to 80 per cent over 18 to 24 months. The generosity of benefits is not irrelevant: the adverse effect of unemployment on life satisfaction in Europe seems to almost double if unemployment 7
benefits are meagre (Wulfgramm 2014, see also Carr and Chung 2014). Most importantly, in Switzerland the trend in wage inequality was basically flat and thus stands in stark contrast to the steep increase in Germany (OECD 2011b, Kuhn and Grabka 2012, Kuhn and Suter 2015). By comparing the evolution of life satisfaction in Germany with that in Switzerland, we obtain a simple difference-in-difference design. Switzerland thus serves us as a contrast case where unemployment and income inequality remained basically constant over the last two decades.
Data, measures and estimation method
Datasets Our empirical analysis uses the German Socio-Economic Panel, waves 1984-2014 (SOEP, Wagner et al. 2007) and the Swiss Household Panel, waves 2000-2015 (SHP, Voorpostel et al. 2014). We increase the robustness of our results by following the practice of “identical analysis of parallel data” (Firebaugh 2008) and thus estimate the same models on two additional datasets, namely the German and Swiss samples of the European Social Survey 2002-2014. The replication across different datasets allows us to gauge the uncertainty in the results that may be due to errors commonly found in surveys such as errors linked to coverage, sampling, non-response and measurement (Groves 2004). All our datasets are nationally representative and collect information on labour market status and life satisfaction. Prior to 1990, the German Socio-Economic Panel only included West German respondents. In order to examine the same population over time, we limit our analytical sample to West Germany. In addition, we only include respondents aged between 30 and 64 years. Thereby, we exclude people who are still in education and who, while in their early work career, have not yet obtained a stable class position. Overall, this leaves us 8
with samples of 35,082 individuals (250,261 observations) (SOEP) and 6,847 individuals (ESS) for West Germany and 11,977 individuals (64,623 observations) (SHP) and 6,181 individuals (ESS) for Switzerland.
Variables and measures Our dependent variable is self-reported life satisfaction and based on the question: ‘How satisfied are you with your life, all things considered?’, with answers ranging from 0 (completely dissatisfied) to 10 (completely satisfied). Although this 11-point scale is, strictly speaking, an ordinal variable, we follow the established practice in the wellbeing literature and treat it as a cardinal variable (Ferrer-i-Carbonell and Frijters 2004). This allows us to compute the mean value of life satisfaction. Our key independent variable is social class where we use an aggregated version of the schema proposed by Erikson and Goldthorpe (1992) and distinguish four hierarchically ordered classes: (i) the upper and upper-middle class containing large employers, managers and professionals; (ii) the lower-middle class including small employers, technicians and associate professionals; (iii) the skilled working class including clerks, craftsmen, skilled service and sales workers; (iv) the low-skilled working class containing assemblers, machine operators, farmhands, low-skilled service and sales workers, and other elementary occupations. Respondents are allocated to one of these four classes based on their current occupation or, if missing, their past occupation. If both variables are missing, we use the partner’s occupation. We thus also attribute a class location to the unemployed and economically inactive. The idea is that unemployed lawyers (or an economically inactive person married to a lawyer) face different life chances than an unemployed assembler (or an economically inactive person married to an assembler).
9
The key information to build our class measure comes from occupations, measured ISCO 4-digit. Additionally, we use information on self-employment and the number of employees to allocate employers with more than 9 employees to the upper-middle class, regardless of their occupation. In a similar vein, small employers (1 to 9 employees) whose occupation is neither manager nor professional are attributed to the lower-middle class. 1 We examine whether class differences in life satisfaction are due to differences in unemployment and income inequality by using variables at both the individual and contextual level. We measure unemployment at the individual level by distinguishing three different employment statuses (in paid work, unemployed, out of the labour force). At the contextual level, we use the annual unemployment rate of a given Bundesland (Germany) or greater region (Switzerland). For earnings, we use the logarithm of the equivalent household (postgovernment) total income, taking into account all sources of income. At the contextual level, we measure income inequality as the ratio p80/p20 of equivalent household incomes in a given Bundesland or greater region in a given year. In addition, we introduce control variables for sex, age group, Bundesland/Greater region, nationality (national vs. non-national) and living together with a partner. Of particular interest are period effects; we introduce calendar year both as a linear term and, to check for a nonlinear evolution over time, as yearly dummies. Table A.1 in the appendix shows the descriptive statistics of our variables.
Method and model We first examine the evolution of life satisfaction across social classes by calculating the yearly means, using weighted scatterplot smoothing (LOWESS). 2 We then analyze a multivariate between-estimator (BE) model which solely uses the cross-sectional (between) variance in life satisfaction, and not the time (within) variance. The rationale behind using 10
between-variance only is that classes are largely composed of the same people over time, as entry into a class is contingent on time-constant factors such as social origin and, above all, education. A medical doctor is likely to belong to the upper-middle class over the entire career and a farmhand without post-mandatory education is unlikely to leave the low-skilled working class. Of course, there is some initial job hopping and (short-range) occupational mobility at the beginning of careers. For this reason, we exclude respondents younger than 30 from our analytical sample. However, most people arrive at their stable class position over the course of their thirties (Erikson and Goldthorpe, 1992: 72, Mayer 2000: 274). A transition matrix for the German Socio-Economic Panel tells us that only a small share of all workers is mobile across classes: on average, 12 per cent in the low-skilled working class and 8 per cent in the upper-middle class change class from one year to the next over our period of observation. Moreover, there is ample evidence that occupational changes are overestimated in panel surveys due to measurement errors (Perales 2014). By using the between-estimator, we do not enquire about how individual mobility between classes affects life satisfaction of the small minority of mobile people. Rather, we focus on how life satisfaction varies between different classes in a given year and over a given period. We therefore treat our longitudinal panel data (SOEP and SHP) the same way as our repeated cross-sectional data (ESS) where the between-estimator corresponds to a simple OLS regression. Of course, this means that our analysis of life satisfaction in two countries has little causal traction. We are much better prepared to describe how life satisfaction varies between different classes over time than to explain why it varies. The equation of our linear regression model is given as: 𝑦𝑦𝑖𝑖𝑖𝑖 = 𝛽𝛽1 + 𝛽𝛽2 𝑐𝑐𝑐𝑐𝑐𝑐𝑐𝑐𝑐𝑐𝑖𝑖𝑖𝑖 + 𝛽𝛽3 𝑦𝑦𝑦𝑦𝑦𝑦𝑦𝑦𝑖𝑖𝑖𝑖 + 𝛽𝛽4 𝑐𝑐𝑐𝑐𝑐𝑐𝑐𝑐𝑐𝑐𝑖𝑖𝑖𝑖 ∗ 𝑦𝑦𝑦𝑦𝑦𝑦𝑦𝑦𝑖𝑖𝑖𝑖 + 𝛽𝛽5 𝑐𝑐𝑐𝑐𝑐𝑐𝑐𝑐𝑐𝑐𝑐𝑐𝑐𝑐𝑐𝑐𝑖𝑖𝑖𝑖 + 𝜖𝜖𝑖𝑖𝑖𝑖
11
The dependent variable yi is the 11-point measure of the life satisfaction of individual i at
time t. 𝐶𝐶𝐶𝐶𝐶𝐶𝐶𝐶𝐶𝐶𝐶𝐶𝐶𝐶𝐶𝐶𝑖𝑖𝑖𝑖 include our measures of unemployment and household income (as well as
sex, age, region, nationality and partnership) and εit is the idiosyncratic error term. Our main
predictor is social class, 𝑐𝑐𝑐𝑐𝑐𝑐𝑐𝑐𝑐𝑐𝑖𝑖𝑖𝑖 , while 𝑦𝑦𝑦𝑦𝑦𝑦𝑦𝑦𝑖𝑖𝑖𝑖 , captures the period effect (entered linearly or as
dummy), allowing us to estimate the interaction between class and period, 𝑐𝑐𝑐𝑐𝑐𝑐𝑐𝑐𝑐𝑐𝑖𝑖𝑖𝑖 ∗ 𝑦𝑦𝑦𝑦𝑦𝑦𝑦𝑦𝑖𝑖𝑖𝑖 . If there is a different evolution in life satisfaction between classes over periods, this effect will
be picked up by the interaction term. We correct for auto-correlation in our panel data by using panel-corrected clustered standard errors.
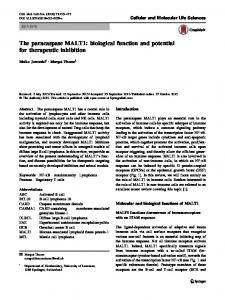
The class gap in life satisfaction over time Before we estimate a multivariate model of life satisfaction, we provide descriptive evidence for the class difference in life satisfaction in Germany and Switzerland. Figures 1 and 2 show the evolution of life satisfaction in each class (left-hand panel) and plot the difference in life satisfaction between the highest and lowest class (right-hand panel). We observe the same class pattern for both countries, with higher classes consistently reporting higher life satisfaction than lower classes. Life satisfaction in West Germany fell during the 1980s for all classes (see Figure 1). In the early 1990s, the fall came to a standstill for the upper-middle class, but continued for the other classes. Life satisfaction decreased for the low-skilled working class until 2007/8, and then began to rise again. Accordingly, the gap in life satisfaction between the top and bottom was the smallest during the reunification boom 1990 to 1991, and the largest in 2008 to 2010, before the recovery of the German labour market finally began in earnest. At its maximum, the class disparity in life satisfaction was 0.73 points on the 11-point life satisfaction scale and hence comparable to the gap between the more satisfied people who have a partner and the less satisfied people who do not have a partner (see Table 1 below for the estimates). 12
Figure 1: the class gradient in life satisfaction in West Germany (based on SOEP 1984-2014) Fig. 1.1 Life satisfaction by social class in West Germany Low working lower middle
7.7
skilled working upper middle
Fig. 1.2 Difference in life satisfaction between the upper-middle and low-skilled working class 1.2
7.4
0.9
7.1
0.6
6.8
0.3
0.0
6.5 1984
1989
1994
1999
2004
2009
1984
2014
1989
1994
1999
2004
2009
2014
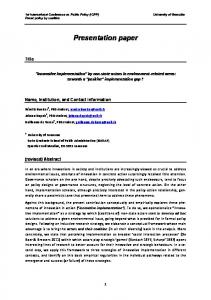
Figure 2: the class gradient in life satisfaction in Switzerland (based on SHP 2000-2015) Fig. 2.1 Life satisfaction by social class in Switzerland Low working lower middle
8.2
Fig. 2.2 Difference in life satisfaction between the upper-middle and low-skilled working class
skilled working upper middle
0.5
8.1
0.4
8.0
0.3
7.9
0.2
7.8
0.1
0.0
7.7 2000
2005
2010
2015
2000
2005
2010
2015
Workers seem more satisfied with their lives in Switzerland than in Germany. Mean levels in Switzerland exceed those in Germany by over half a point (see Figure 2). Yet not only are levels of life satisfaction higher, the class gap in life satisfaction is also much smaller 13
in Switzerland. The disparity between the highest and lowest class is less than half as large as in Germany, fluctuating between a minimum of 0.17 and a maximum of 0.25 between 2000 and 2015. There is no clear trend in the disparity of life satisfaction over time in Switzerland. While we observe a downward trend in life satisfaction for all classes up to 2009, the recovery thereafter came later and was somewhat weaker for the low-skilled working class than the other classes. We check our results by replicating the same analysis with another dataset, the European Social Survey. For both countries, we find again the same hierarchical rank-ordering of life satisfaction by class: the more privileged the class position, the higher the satisfaction with life (see Figures A.1 and A.2 in the appendix). Class differences are somewhat larger in the European Social Survey. Over the period 2002-2014, the gap in life satisfaction between the lowest and the highest class amounts to an average of 0.4 for Switzerland and 0.9 points for Germany (as compared to 0.7 when measured in the SOEP over the period 2002-2014). For the time trend in life satisfaction, the ESS paints a slightly different picture. For Germany, we observe a slight increase – and stability thereafter – in the class gradient between 2002 and 2006 (when life satisfaction declines for all classes). Thereafter, the recovery in life satisfaction is stronger for the working classes than the upper-middle class, leading to a (slight) narrowing of the class gap. In Switzerland, the class gap in life satisfaction widens between 2002 and 2006 and, after a period of stability, increases again between 2012 and 2014. To the extent that the European Social Survey only provides us with data points for every two years, it leads to less precise estimations of the time trend than the two other panel surveys which are carried out annually and, furthermore, use a much larger sample.
14
A multivariate analysis of the class gap in life satisfaction We scrutinize the link between class and life satisfaction more closely in a multivariate model. The coefficients of interest are shown for both datasets for Germany in Table 1 and for Switzerland in Table 2. After controlling for sex, age, nationality, region and year, we still find a large main effect for class in Germany (see model M1). In 1984, the members of the low-skilled working class were less satisfied by 0.47 points (SOEP) than their counterparts of the upper-middle class. The interaction between class and years suggests that with every ten years that passed, the class gap increased by another 0.10 points. Compared with the uppermiddle class, the members of the low-skilled working class have become increasingly dissatisfied with their lives over the last three decades. In the European Social Survey, we obtain a class gap of 0.85 for the early 2000s – without any clear class differences in the evolution over time. If we further control in model M2 for being unemployed or economically inactive as well as for the regional unemployment rate, the main effect decreases only slightly, but the negative time trend in the SOEP for the low-skilled working class disappears. As is visible if we plot these results graphically, this means that the widening class gap between 1990 and 2005 is partly due to the differential effect that unemployment has on different classes. Once we further add our two income measures at the individual and regional level, the class effects are (almost) halved (see model M3). The difference in life satisfaction between the uppermiddle and the low-skilled working class drops from 0.46 to 0.23 in 1984 (SOEP) and from 0.97 to 0.67 in 2002 (ESS). This underlines that class position and earnings are closely correlated – and that lower classes are less satisfied with their lives because they find it harder to make ends meet.
15
Table 1: linear regression coefficients for life satisfaction in West Germany SOEP 1984-2014 M1 baseline Class (ref: uppermiddle) Low-skilled working Skilled working cl. Lower-middle class Year Interactions Low-skilled x year Skilled x year Lower-middle x year Has a partner Labour market status (ref : employed) Out of labour force Unemployed Unemployment rate Household income Regional inequality R2 N
ESS 2002-2014
M3 M2 unemployment unemployment + income
M1 baseline
M3 M2 unemployment unemployment + income
-0.47*** -0.28*** -0.19*** -0.00
-0.46*** -0.23*** -0.19*** -0.00
-0.23*** -0.06 -0.12* -0.02***
-0.97*** -0.60*** -0.36*** 0.02**
-0.90*** -0.55*** -0.36*** -0.00
-0.67*** -0.39** -0.26** -0.01
-0.01*** -0.01** -0.00 0.55***
-0.00 -0.00* 0.000 0.48***
0.00 -0.00 0.00 0.45***
0.02 0.02 0.03 1.19***
0.03 0.02 0.03 1.13***
0.05* 0.03 0.04* 0.83***
-0.29*** -1.42*** -0.03***
-0.16*** -1.10*** -0.03*** 0.56*** 0.06 0.136 250,261
-0.24*** -1.03*** -0.07***
-0.16* -0.76*** -0.08*** 0.14*** 0.07*
0.127 6,847
0.145 6,847
0.084 250,261
0.116 250,261
0.107 6,847
Note: All models additionally control for sex, age group, nationality, region, and, in the SOEP, for the type of sample
Table 2: linear regression coefficients for life satisfaction in Switzerland SHP 2000-2015 M1 baseline Class (ref: uppermiddle) Low-skilled working Skilled working cl. Lower-middle class Year Interactions Low-skilled x year Skilled x year Lower-middle x year Has a partner Labour market status (ref : employed) Out of labour force Unemployed Unemployment rate Household income Regional inequality R2 N
ESS 2002-2014
M3 M2 unemployment unemployment + income
-0.34*** -0.27*** -0.02 0.02***
-0.32*** -0.25*** -0.02 0.02***
-0.19** -0.15** 0.04 0.02***
0.00 0.01 -0.00 0.74***
0.00 0.01 -0.00 0.73***
0.00 0.01 -0.00 0.71***
-0.25*** -1.27*** -0.01
-0.16*** -1.17*** -0.02 0.31*** 1.13*** 0.104 64,623
0.083 64,623
0.091 64,623
M1 baseline
-0.34 -0.11 0.08 0.02 -0.02 -0.02 -0.04** 0.63***
0.059 6,181
M3 M2 unemployment unemployment + income
-0.33 -0.10 0.07 0.01
-0.18 0.00 0.12 0.04**
-0.02 -0.02 -0.04** 0.61***
-0.01 -0.01 -0.03* 0.46***
-0.12** -1.12*** 0.06**
-0.09* -1.01*** 0.02 0.09*** 0.07 0.087 6,181
0.073 6,181
Note: All models additionally control for sex, age group, nationality, and region
16
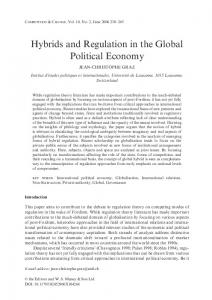
In Switzerland, our two datasets cover almost the same period, and the class coefficients for the two samples are very similar. Both the SHP and ESS indicate that net of sex, age, nationality and region, the life satisfaction of the low-skilled working class trails that of the upper-middle class by 0.34 points. While in Germany the class gap in life satisfaction is almost as large as the gap in life satisfaction between partnered and non-partnered individuals, the class gap in Switzerland is only half as large as that observed for partnership. In terms of time trend, the Swiss Household Panel does not show any class-specific evolution over time, whereas the European Social Survey suggests that in comparison to the upper-middle class all other classes have become somewhat less satisfied with their lives since the early 2000, notably the lower middle class. Household income and income inequality reduce the class coefficient in Switzerland by about a third as in Germany (model M3). In contrast, unemployment has no bearing on the class gap – a finding probably due to the unusually low number of unemployed respondents in our two Swiss datasets. So far, we have assumed that the trend in life satisfaction is linear over time. This assumption is not warranted if the class gap widens during periods of recessions (Germany in the 1990s) and declines during periods of economic recovery (Germany after 2010). Consequently, in a last set of analyses, we enter time into our model as a yearly dummy. Instead of showing 30 coefficients for years and 90 coefficients for class-year interactions, we plot in figures 3 and 4 the predicted values for life satisfaction in each year for each class relative to the baseline of the upper-middle class. Apart from the non-linear terms for years, these results are based on the same three models as the ones shown in Tables 1 and 2 above. Between 1984 and 2014, the class gap in life satisfaction followed four different patterns in Germany. The class gap first decreased during the economic boom from 1984 to 1990. It then strongly increased over the long period of economic stagnation between 1990 and 2005. 17
During the years right before and after the Great Recession (which was not a great recession in Germany), the class gap stabilized and, in the last period, began to decrease after 2010 when unemployment dropped and real earnings finally began to rise.
Figure 3: Net class differences in life satisfaction in Germany (regression coefficients for each class relative to the upper-middle class)
Data: SOEP 1984-2014 Note: The Figures plot the coefficients for each class relative to the horizontal line of class 4 (upper-middle class) net of other control variables. Class 1 refers to “low-skilled working class”, class 2 to “skilled working class”, and class 3 to “lower-middle class. Model 1 refers to the baseline model with controls for sex, age, partnership, region, nationality. Model 2 additionally controls for individual and regional unemployment, and model 3 for household income and regional income inequality.
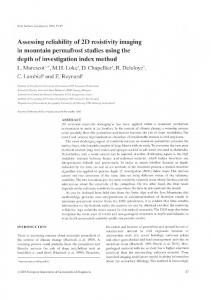
Figure 4: Net class differences in life satisfaction in Switzerland (regression coefficients for each class relative to the upper-middle class)
Data: SHP 2000-2015 For the explication of the models, see notes below Figure 3.
18
Clearly, the differential evolution of unemployment risks and household earnings across classes goes a long way to explain the variation in the class gap over time. If we control for unemployment in model M2, the class gap in life satisfaction decreases substantially and gives rise to a curvilinear evolution without any downward trend, thus simply mirroring the business cycle. If we further account for household earnings and regional inequality, the disparity between classes in a given year and over time becomes small and amounts to no more than 0.1 to 0.3 points. For Switzerland, the Swiss Household Panel suggests that the class gap in life satisfaction slightly increased at the beginning of the 2000s, but then gradually narrowed up to 2014 (see Figure 4). However, this finding is not supported by the European Social Survey which suggests that the class gradient strongly widened in the early 2000s and then dropped again between 2012 and 2014 (Figure A.4 in the appendix).
Conclusion This paper started out with the argument that the 1990s and 2000s were a gloomy period for Germany’s working class. The period between the short reunification boom in 1990 and the mid-2000s when Germany’s labour market finally started to recover were marked by mass unemployment, a spread of atypical jobs, welfare retrenchment and increasing income inequality. When jobs are harder to come by and economic security decreases, workers with little individual bargaining power – the low-skilled working class – are likely to suffer most (Chung and Mau 2014). This is what we observe for Germany over the last decades. The members of the lowskilled working class were systematically less satisfied with their lives than the members of the upper-middle class – and this gap increased during the long economic stagnation between the early 1990s and mid-2000s. This finding contrasts with the evolution in Switzerland 19
where the class gap does not show a clear trend between 2000 and 2014. Our analysis of two different data sources suggests that Switzerland’s social class gradient in life pattern followed a pattern of trendless fluctuations. This finding is consistent with the relative stability of unemployment, earnings inequality and labour market institutions more generally in Switzerland over the last two decades (Kuhn and Suter 2015, Oesch 2013). We find no evidence for the expectation that as societies get richer and have more resources to spend on public goods, the class gradient in life satisfaction automatically falls (Clark et al. 2016). Despite the sluggish labour market and several cyclical slumps, Germany’s economy continued to expand over most of the 1990s and 2000s and German GDP increased by almost a third between 1992 and 2012. However, as these two decades were synonymous with high unemployment and increasing income inequality, there was a widening class gap. Only after 2008, when the German labour market had recovered and unemployment rates were plummeting, did the class gradient in life satisfaction begin to decrease. Our results thus suggest that life satisfaction of different classes diverges over the business cycle. As unemployment rises and work income stagnates, the lower classes are disproportionately affected in their subjective wellbeing. In comparison to their counterparts in the upper-middle class, they are less sheltered from economic downturns and suffer more from the deregulation of institutional safeguards in the labour market. Accordingly, when the economy picks up speed again and the labour market recovers – as during the boom in Germany after 2009 – the low-skilled working class succeeds in reducing the disparity in life satisfaction relative to the upper classes. Finally, it is noteworthy that our comparison of Germany and Switzerland shows an analogous class gradient in life satisfaction in both countries. Respondents in higher classes are, on average, more satisfied with their lives than respondents in lower classes. However, 20
regardless whether we compare the long-running panel datasets or the samples of the European Social Survey, we find the class gap in life satisfaction to be substantially larger in Germany than in Switzerland – and this gap is far from trivial. In Germany, the difference in subjective well-being between the upper-middle class and the low-skilled working class is almost as large as the gap in life satisfaction between partnered and non-partnered individuals.
21
References Alderson, A. and Nielsen, F. (2002). Globalization and the Great U-Turn: Income Inequality Trends in 16 OECD Countries, American Journal of Sociology 107 (5): 1244–99. Alesina, A., Di Tella, R. and MacCulloch, R. (2004). Inequality and happiness: are Europeans and Americans different? Journal of Public Economics 88: 2009-2042. Antonczyk, D., Fitzenberger, B. and Sommerfeld, K. (2010). Rising wage inequality, the decline of collective bargaining, and the gender wage gap, Labour Economics 17: 835– 847. Becchetti, L. Massari, R. and Naticchioni, P. (2013). The drivers of happiness inequality: suggestions for promoting social cohesion, Oxford Economic Papers 66(2): 419-442. Bosch, G. (2009). Low-wage work in five European countries and the United States. International Labour Review, 148(4): 337-356. Carr, E. and Chung, H. (2014). Employment insecurity and life satisfaction: the moderating influence of labour market policies across Europe. Journal of European Social Policy 24(4): 383-399. Chung, H. and Mau, S. (2014). Subjective insecurity and the role of institutions. Journal of European Social Policy 24(4): 303-318. Clark, A., Flèche, S. and Senik, C. (2016). Economic Growth Evens-Out Happiness: Evidence from Six Surveys. Review of Income and Wealth 62(3): 405-419. Delhey, J. and Dragolov, G. (2014). Why inequality makes Europeans less happy: the role of distrust, status anxiety, and perceived conflict, European Sociological Review 30(2): 151165. Delhey, J. and Kohler, U. (2011). Is happiness inequality immune to income inequality? New evidence through instrument-effect-corrected standard deviations, Social Science Research 40 (2011): 742-756. Dutta, I. and Foster, J. (2013). Inequality of happiness in the U.S.: 1972-2010, Review of Income and Wealth 59 (3): 393-415. Eichhorst, W. and Marx, P. (2011). Reforming German labour market institutions: a dual path to flexibility, Journal of European Social Policy 21(1): 73-87. Erikson, R. and Goldthorpe, J. (1992). The Constant Flux. Oxford: Oxford University Press.
22
European Social Survey (ESS), Round 1 (2002) to 7 (2014) data. Data file edition 2.1. NSD Norwegian Centre for Research Data, Norway – Data Archive and distributor of ESS data for ESS ERIC. Ferrer-i-Carbonell, A. and Frijters, P. (2004). How important is methodology for the estimates of the determinants of happiness? Economic Journal, 114: 641–659. Firebaugh, G. (2008) Seven Rules for Social Research. Princeton: Princeton University Press. Grabka, M. and Kuhn, U. (2012). The evolution of income inequality in Germany and Switzerland since the turn of the millennium. SOEPpapers on Multidisciplinary Panel Data Research 464, DIW Berlin. Groves, R. M. (2004). Survey errors and survey costs. Hoboken, NJ: Wiley. Haller, M. and Hadler, M. (2006). How social relations and structures can produce happiness and unhappiness: An international comparative analysis. Social Indicators Research 75(2): 169–216. Kuhn, U. and Suter, C. (2015). Die Entwicklung der Einkommensungleichheit in der Schweiz. Social Change in Switzerland 2: 1-14. Mayer, K. U. (2000). Promises fulfilled? A review of 20 years of life course research, European Journal of Sociology 41(2): 259-282. OECD (2011a). Growing income inequality in OECD countries: What drives it and how can policy tackle it? Paris: OECD. OECD (2011b). Divided We Stand: Why Inequality Keeps Rising. Paris: OECD. Oesch, D. (2006). Redrawing the Class Map. Stratification and Institutions in Britain, Germany, Sweden and Switzerland. Basingstoke: Palgrave Macmillan. Oesch, D. (2013). Occupational Change in Europe. How Technology and Education Transform the Job Structure. Oxford: Oxford University Press. O’Reilly, J. et al. (2017). Brexit: understanding the socio-economic origins and consequences. Socio-Economic Review 14 (4): 807-854. Oishi, S., Kesebir, S. and Diener, E. (2011). Income Inequality and Happiness, Psychological Science 22(9): 1095–1100. Perales, F. (2014). How wrong were we? Dependent interviewing, self-reports and measurement error in occupational mobility in panel surveys. Longitudinal and Life Course Studies 5(3): 299-316.
23
Richards, L. and Paskov, M. (2016). Social class, employment status and inequality in psychological well-being in the UK: Cross-sectional and fixed effects analyses over two decades, Social Science & Medicine 167: 45-53. Schneider, S. M. (2016). Income Inequality and Subjective Wellbeing: Trends, Challenges, and Research Directions. Journal of Happiness Studies 17(4): 1719-1739. Senik, C. (2009). Income Distribution and Subjective Happiness: A Survey, OECD Social, Employment and Migration Working Papers, No. 96, OECD Publishing. Socio-Economic Panel (SOEP), data for years 1984-2014, version 31, SOEP, 2015, doi:10.5684/soep.v31.1. Stevenson, B. and Wolfers, J. (2008). Happiness Inequality in the United States, Journal of Legal Studies 37: S33-S79. Streeck, W. (2009), Re-Forming Capitalism, Oxford: Oxford University Press. Swiss Household Panel (SHP), data for the years 2000 to 2015, based at the Swiss Centre of Expertise in the Social Sciences FORS and supported by the Swiss National Science Foundation. Voorpostel, M., Tillmann, R, Lebert, F., Kuhn, U., Lipps, O., Ryser, V.-A., Schmid, F., Antal, E., and Wernli, B. (2014). Swiss Household Panel User Guide 1999-2013, Wave 15, Lausanne: FORS. Veenhoven, R. (1995). The cross-national pattern of happiness: Test of predictions implied in three theories of happiness. Social Indicators Research 34: 33–36. Veenhoven, R. (2005). Return of inequality in modern society? Test by Dispersion of LifeSatisfaction Across Time and Nations, Journal of Happiness Studies 6: 457–487. Wagner, G., Frick, J. and Schupp, J. (2007). The German Socio-Economic Panel Study (SOEP)—Scope, Evolution and Enhancements. Schmollers Jahrbuch 127: 139–169. Wilkinson, R., and Pickett, K. (2009). Income inequality and social dysfunction. Annual Review of Sociology 35 : 493–511. Wulfgramm, M. (2014). Life satisfaction effects of unemployment in Europe: the moderating influence of labour market policy. Journal of European Social Policy 24(3): 258-272.
24
Appendix - Figures Figure A.1: the class gradient in life satisfaction in Germany (based on ESS 2002-2014) Fig. A.1a Life satisfaction by social class in West Germany Low working lower middle
Fig. A.1b Difference in life satisfaction between the upper-middle and low-skilled working class
skilled working upper middle
8.0
1.5
7.5
1.0
7.0
0.5
0.0
6.5 2002
2004
2006
2008
2010
2012
2002
2014
2004
2006
2008
2010
2012
2014
Figure A.2: the class gradient in life satisfaction in Switzerland (based on ESS 2002-2014) Fig. A.2a Life satisfaction by social class in Switzerland Low working lower middle
8.5
skilled working upper middle
Fig. A.2b Difference in life satisfaction between the upper-middle and low-skilled working class 1.0
0.8 8.3 0.6 8.1
0.4
7.9
0.2
7.7
7.5
0.0 2002
2004
2006
2008
2010
2012
2014
2002
2004
2006
2008
2010
2012
2014
25
Figure A.3: West Germany – plotting the regression results from ESS 2002-2014
Note: class 1 refers to “low-skilled working class”, class 2 to “skilled working class”, class 3 to “lower-middle class”, class 4 to “upper-middle class”
Figure A.4: Switzerland – plotting the regression results from ESS 2002-2014
Note: class 1 refers to “low-skilled working class”, class 2 to “skilled working class”, class 3 to “lower-middle class”, class 4 to “upper-middle class”
26
Appendix - Table Table A.1 Descriptive statistics of variables used
Life satisfaction Social class Year of observation German nationality Male Lives with a partner Age Regional unemployment rate Unemployed Out of labor force Log equiv. household income P80/20 regional househ. income
Life satisfaction Social class Year of observation Swiss nationality Male Lives with a partner Age Regional unemployment rate Unemployed Out of labor force Log equiv. household income P80/20 regional househ. income
German Socio-Economic Panel (SOEP), 1984-2014 N min max mean p50 250261 0 10 7 7 250261 1 4 2.4 2 250261 0 30 16 16 250261 0 1 0.9 1 250261 0 1 0.52 1 250261 0 1 0.69 1 250261 30 64 46 45 250261 2.3 19 6.6 6.3 250261 0 1 0.062 0 250261 0 1 0.16 0 250261 1.6 14 9.7 9.7 250261 1.7 3 2.1 2.1 Swiss Household Panel, 2000-2015 N 64623 64623 64623 64623 64623 64623 64623 64623 64623 64623 64623 64623
min 0 1 0 0 0 0 30 1.5 0 0 2.5 1.8
max 10 4 15 1 1 1 64 7 1 1 15 2.5
mean 7.9 2.7 7.5 0.75 0.51 0.8 46 3.8 0.006 0.08 11 2
p50 8 3 8 1 1 1 46 3.6 0 0 11 2
sd 1.8 0.98 8.6 0.3 0.5 0.46 9.7 2.6 0.24 0.37 0.53 0.2
N 6847 6847 6847 6847 6847 6847 6847 6847 6847 6847 6847 6847
ESS-Germany, 2002-2014 min max mean 0 10 7.4 1 4 2.5 0 12 6.3 0 1 0.94 0 1 0.51 0 1 0.74 30 64 47 2.8 19 6.6 0 1 0.058 0 1 0.24 0.32 12 4.2 1.1 5.3 2.2 ESS-Switzerland, 2002-2014
p50 8 2 6 1 1 1 47 6.3 0 0 4 2.1
sd 1.9 0.97 4.1 0.25 0.5 0.44 9.5 2.9 0.23 0.43 1.7 0.69
sd 1.4 0.99 4.6 0.44 0.5 0.4 9.5 1.2 0.079 0.27 0.53 0.11
N 6181 6181 6181 6181 6181 6181 6181 6181 6181 6181 6181 6181
min 0 1 0 0 0 0 30 1.7 0 0 0.33 1.1
p50 8 3 6 1 1 1 46 3.7 0 0 4.6 2
sd 1.5 0.97 4 0.37 0.5 0.42 9.8 1 0.15 0.41 2 0.62
max 10 4 12 1 1 1 64 6.4 1 1 12 4
mean 8 2.7 5.4 0.84 0.5 0.78 46 3.8 0.023 0.22 4.8 1.8
Note: control variables are also used, but not shown,for regions (Bundesländer in Germany, Greater Regions in Switzerland) and the type of sample in the SOEP.
27
Endnotes
1
For more detail on the concept and measurement of the class variable, see Oesch (2006). The script used for the
construction of this class schema can be downloaded in Stata or SPSS from the authors’ webpage: http://people.unil.ch/danieloesch/scripts/
2
In order to reduce the influence of short-term fluctuations and to better grasp the time trend, we use weighted
scatterplot smoothing (LOWESS). This means that we compute the mean life satisfaction in a given year by borrowing additional information from adjacent years, where nearest neighbouring years get higher weights and more distant years lower weights. This provides us with a line across years which best fits the data, but without imposing a functional form. Note that for these descriptive results, we also use the cross-sectional weights provided by SOEP and SHP.
28