THEORETICAL AND PRACTICAL COMPLEXITY OF UNIFIED MODELING LANGUAGE: DELPHI STUDY AND METRICS ANALYSES John Erickson Department of Marketing and Management College of Business Administration University of Nebraska at Omaha Omaha, NE U.S.A.
[email protected]
Keng Siau Department of Management College of Business Administration University of Nebraska at Lincoln Lincoln, NE U.S.A.
[email protected]
Abstract
Systems have become increasingly complex, and as a result development methods have become more complex as well. The unified modeling language (UML) has been criticized for the often cited and sometimes overwhelming complexity it presents to its users, and those seeking to learn to use it. Using Rossi and Brinkkemper’s (1996) complexity metrics, Siau and Cao (2001) completed a complexity analysis of UML and 36 other modeling techniques, finding that UML is indeed more complex than other techniques. Siau, Erickson and Lee (2002) proposed that Rossi and Brinkkemper’s metrics present the theoretical maximum complexity, known as theoretical complexity. This is different from a practice-based complexity, known as practical complexity, that more accurately reflects the complexity of the language in practice. This research develops a subset of UML (a kernel) composed of the most commonly used constructs, that can be equated with the complexity that practitioners actually face when using the modeling language. A Delphi study is conducted using UML experts in identifying a use-based UML kernel. Metric analyses are then computed and analyzed. Keywords: UML, complexity, complexity metrics, Delphi study, modeling method metrics
Introduction Humans generally have cognitive problems processing information that is overly complex (Anderson and Lebiere 1998; Miller 1956). This problem surfaces often as people build information systems, which tend to be growing increasingly complex. Constructing models of systems is an approach that developers have devised to help manage the task of processing some of the cognitively complex tasks involved in systems development. The unified modeling language (UML) has become increasingly important to systems development efforts in the past five years, and is a tool that agile systems developers have come to depend on as crucial to their efforts. However, UML has also been criticized for its complexity, inconsistent semantics, and ambiguous constructs (Dobing and Parsons 2000; Dori 2002; Duddy 2002; Kobryn 2002; Zendler et al. 2001). In terms of complexity, a set of complexity indices for UML in aggregate, and the nine diagramming techniques individually, was compiled recently by Siau and Cao (2001). In their study, the set of metrics is based on inclusion of all possible constructs in UML, it thus provides an indication of the theoretical (or maximum) complexity of the modeling methods, which we term theoretical complexity.
2004 — Twenty-Fifth International Conference on Information Systems
183
Erickson & Siau/Theoretical & Practical Complexity of UML
In reality, however, it can reasonably be supposed that not all of the constructs are used all of the time when building systems. This phenomenon is known in software development as the (heuristic) 80/20 rule, in which the “rule” supposes that 80 percent of systems are developed using 20 percent of the (programming) language. Kobryn (2002) proposed that the situation might be analogous to and applicable to UML as well. Therefore, theoretical complexity may not be a good indicator of the complexity of UML in practice. Besides, comparing various modeling methods based on theoretical complexity may not be a fair and accurate measure. Those modeling methods that include many “nice-to-have” but nonessential constructs will be unnecessarily penalized in the evaluation process. Since the reason for measuring complexity is mainly to understand the learnability and applicability of modeling methods in practice, it may be necessary to define a new complexity measure, practical complexity, which more accurately reflects the complexity of modeling methods in practice. This research aims to differentiate theoretical and practical complexity, specifically as it relates to UML modeling techniques. The research is conducted from the assumption that practical complexity exists, and that it can also be distinguished or differentiated from theoretical complexity (Siau et al. 2002). In addition, our conjecture is that UML’s practical complexity is measurable, and is less than the existing metrics and results developed and used by others (Rossi and Brinkkemper 1996; Siau and Cao 2001). Thus, in addition to theoretical complexity, a set of metrics for estimating practical complexity can be developed based on the most commonly used constructs rather than all constructs. The goal of the research is to build on the results of Siau et al. (2002) by defining and estimating the practical complexity of UML. The research involves investigating the adequacy of theoretical complexity, as defined by Rossi and Brinkkemper (1996), measured using diagramming techniques by Siau and Cao, and applied to real diagrams (Siau et al. 2002). Those research efforts highlight the need for examining a more “practical” measure of complexity. This research begins with the ideas of Rossi and Brinkkemper, Siau and Cao, and Siau et al., and attempts to develop practical complexity measures. A series of three questionnaires were sent to roughly 40 expert object-oriented (OO) development practitioners in a Delphi-type study, asking them to reach a consensus and determine the UML constructs that are most important to them, and that they most commonly use. The aim was to identify the core UML constructs that are used to construct 80 percent of the systems developed (i.e., the kernel of UML). This research proposes a means to begin studying and exploring the nature of the relationship between theoretical and practical complexity. The results will be useful in developing a set of complexity metrics that are different, more realistic, and, hopefully, that provide valuable information to developers who will soon be moving to UML release 2.0. Programmers and developers spend years honing their craft, so why would it be important for others to be able to comprehend UML? After all, end users and other groups instrumental in developing systems are paying for that expertise. However, the models, diagrams, and drawings of new systems are often used as the focal point for communicating information about the new system to users. Therefore, identifying and measuring practical complexity is critical, even essential, if anyone other than experts realistically expects to quickly learn and use UML or any relatively complex systems development tool.
Literature Review Software Complexity Complexity appears to play a large and ever increasing role in the systems development process as well, since the hardware and software underlying systems have been becoming more complex at almost a geometric rate, with a doubling of capacity, and we argue complexity, every 12 to 18 months, a phenomenon known as Moore’s Law. However, most complexity studies fall under the umbrella of software complexity, and complexity from a strictly cognitive psychological perspective, and as such tend not to focus on the complexity of the underlying software development methodologies (Albrecht 1979; Albrecht and Gaffney 1983; Brooks 1987; Fenton and Pfleeger 1997; Halstead 1977; Pfleeger and McGowan 1990; Sommerville 2001; Weyuker 1988). Software complexity has typically been assessed using such measures as McCabe’s cyclomatic number, Haltstead’s software science model, and Oviedo’s data flow complexity model (Fenton and Pfleeger 1997). In 1988, Weyuker proposed a number of evaluations for software complexity measures. She ended by proposing that none of the complexity measures in existence at the time adequately captured what is meant by complexity, and called for more research on the subject. This research examines complexity in several forms, structural complexity as defined in the next section, being one. Past MIS research has typically skirted complexity. Kim et al.’s (2000) study of diagrams and cognitive diagrammatic reasoning enforced interpretation time limits on the subjects in their experiment, and thus used time as a constraint, but did not really address complexity specifically. Mcleod and Roeleveld (2002) referred to the relationship between interpretation time and complexity by contending that a person’s “ability to learn a concept quickly…depends heavily on the complexity of the model” (p. 7). That implies that there is a relationship between interpretation time and complexity, but again does not explore complexity. Vessey 184
2004 — Twenty-Fifth International Conference on Information Systems
Erickson & Siau/Theoretical & Practical Complexity of UML
and Conger (1994) used time as a measure of interpretation, and Zendler et al. (2001) also used time necessary to structure an application as a construct. However, neither group considered complexity of interpretation directly as part of their research. Siau and Cao’s (2001) research applied Rossi and Brinkkemper’s (1996) complexity metrics to the unified modeling language (UML). Their reasoning for using the particular metric set is that they contend that the metrics are among the most comprehensive, and that Rossi and Brinkkemper’s approach has “been used to evaluate the ease-of-use of OO techniques” (Siau and Cao 2001, p. 33). Siau and Cao also compared UML’s complexity with 36 OO techniques from 14 methods, as well as each of the 14 methods in aggregate. One of Siau and Cao’s (2001) noteworthy findings is that UML is far more complex (from 2 to 11 times more complex) in aggregate than any of the other 13 methods. The relative overall complexity highlights one of the issues regarding UML, with the result that it can appear overwhelming to those new to UML. Additionally, when human cognitive limitations to short-term memory are added to this mix, UML can appear even more difficult to master. This is a critical point because use case and class diagrams, for example, are typically the starting point for system modeling efforts. Since those diagramming techniques are relatively more complex than some of the others, that means that the more complex diagrams or models of the language are what end-users or students just learning the basics of the language interact with first, essentially doubling their cognitive load; they must understand the constructs used in the diagrams while simultaneously understanding their intended meaning in terms of the system under development.
Cognitive Complexity Ericsson and Kintsch (1995) proposed an extension to working memory (short-term memory), which they call long-term working memory (LTWM). According to Ericsson and Kintsch, LTWM is a part of long-term memory (LTM) that acts almost like shortterm working memory (STWM). In this model, domain experts can very quickly recall information relevant to their area of expertise. The relevant information recall is a bit slower than STWM recall speeds, but appears to be significantly faster than LTM recall speeds. Of course, LTWM only “works” for experts in their domain areas, or possibly others, such as experienced users, who have high automaticity for certain tasks. LTWM would help to explain why it is difficult for those learning a modeling language; they do not have the automaticity in short-term or LTWM that more experienced users have. This also helps explain why end users, even users highly familiar with existing systems processes, may still have problems communicating with the developers via the relatively unfamiliar UML diagrams. LTWM is an important concept to consider when thinking about human cognitive limitations regarding information processing, and especially as related to task complexity. What the idea of LTWM conveys is that automaticity can greatly extend the shortterm memory limitations of domain experts. LTWM addresses the problem of the information processing bottleneck, and suggests that as people learn even very complex materials, that they can somewhat overcome some of their own cognitive limitations. This also implies that a person can more easily learn a very complex methodology such as UML by assimilating a small or relatively small part of the overall methodology, such as the most commonly used components, by using LTWM. The atomic components of thought (ACT) theory developed by Anderson and Lebiere (1998) attempts to divide cognition into its component parts. ACT breaks knowledge into two parts, declarative knowledge and procedural knowledge. Declarative knowledge is similar to that knowledge captured in an encyclopedia or dictionary—it is a list of what we know. Procedural knowledge, on the other hand, is knowledge about how things work. Procedural knowledge depends on declarative knowledge as a starting point, but uses that knowledge to help solve problems (Anderson and Lebiere 1998). Declarative knowledge is produced in chunks, and is constrained by our cognitive limits (Miller 1956). Procedural knowledge is used to create production rules that describe productions, or specific steps we use to solve common problems (Anderson and Lebiere 1998). In short, ACT tells us that the more complex a problem is, the longer it will take us to process the problem, and come up with a solution. However, ACT also travels a similar path to that of Ericsson and Kintsch in that it helps to explain how humans overcome cognitive limitations when dealing with unfamiliar and often complex cognitive loads.
Theory, Model, and Research Question Complexity Comprehension relates generally to the ways in which humans make sense of or understand the various stimuli they are continually presented with in the world. According to the ACT theory, humans organize their comprehension into large-scale 2004 — Twenty-Fifth International Conference on Information Systems
185
Erickson & Siau/Theoretical & Practical Complexity of UML
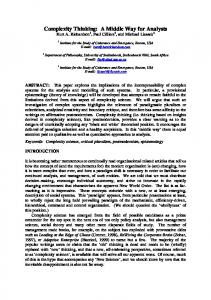
Structural Complexity
Cognitive Complexity affects
Figure 1. Structural and Cognitive Complexity (Adapted from Briand et al. 1999) productions, based on declarative and procedural knowledge. Moreover, in the course of processing productions, a bottleneck develops between what information is waiting in a queue for processing and what is currently being processed. Thus, if one comprehension task is simpler relative to another comprehension task, it will consume fewer resources (processing time, long-term production activation and retrieval, and short-term memory), and thus take less overall time to process. Complexity can take many forms. For the purposes of this research, complexity will be approached from two separate but closely related perspectives: cognitive complexity as related to human perception, and structural complexity as related to the structural properties of the diagramming techniques found in modeling approaches such as UML diagrams. In this context, cognitive complexity can be defined as the mental burden people face as they work with systems development constructs. Further, in addition to the theoretical basis of cognitive complexity detailed previously, the research proposes to adopt the ideas on the definition of structural complexity as proposed by Briand et al. (1999), in which the physical (structural) complexity of diagrams affects the cognitive complexity faced by the humans using the diagrams as aids to understand and/or develop systems (see Figure 1). Since cognitive complexity, as defined for this research, is difficult and arguably even impossible to measure, structural complexity will be used to explain cognitive complexity. Structural complexity can be defined as a function of the number of distinct elements (or constructs) that constitute a given diagramming technique. Rossi and Brinkkemper (1996) formulated 17 distinct definitions relating to the structural complexity of each diagramming technique. Using all available constructs (the metamodel component), these definitions form an estimate of the total structural complexity of the diagramming technique, which this research terms theoretical complexity. Structural complexity is a part of the structural characteristics of the information or modeling system, and for this research refers to the elements or constructs that comprise a given diagramming technique. These constructs would include meta-construct types such as objects (classes and interfaces), properties (class names, attributes, methods, and roles), and relationships and associations (aggregations, generalizations, specializations). The Rossi and Brinkkemper metrics serve as the operational definition (as well as a measure) of the structural complexity of diagrams, which can be equated with theoretical complexity. The current research proposes to define practical complexity as a subset of the Rossi and Brinkkemper metrics, based on the practitioner identification, and artifact-based validation of the UNL kernel. Siau et al. (2002) provided some evidence indicating that the theoretical metrics (total structural complexity) do not adequately capture the complexity practitioners face when using UML class and use case diagrams. This result motivates the research question: Can we differentiate theoretical complexity from practical complexity and illustrate a way of determining the practical complexity of UML based on practitioner usage patterns? The research objectives for this study are (1) to determine the most commonly used constructs in the UML diagrams, and propose that they represent a UML kernel, and (2) to analyze the results using the Rossi and Brinkkemper metrics to determine a practicaloriented assessment of the complexity of UML. The intent of identifying one possible UML kernel is not to say “let’s simply dispense with the non-kernel items,” but rather to focus on how practitioners are using UML. An analogy would be a language kernel. Language kernels are commonly identified by compiling (word) usage frequencies, based on peoples’ actual usage of the language). The resulting kernel is not then used to remove all non-kernel words, but rather to develop understanding of how people learn and subsequently use the language. The original metrics developed by Rossi and Brinkkemper in 1996 minimized the flaws and weaknesses that characterized other work on method measurement. Specifically, much early work in the area did not provide an adequate theoretical basis for the 186
2004 — Twenty-Fifth International Conference on Information Systems
Erickson & Siau/Theoretical & Practical Complexity of UML
metrics, in addition to being loosely and inaccurately derived from software metrics as discussed previously. Rossi and Brinkkemper provided a new approach to measuring models by using computer-aided method engineering combined with a metamodeling approach. They developed their metrics from a strictly mathematical foundation, and defined each metric so that it was directly assessable from the model that encompassed it. As previously noted, the literature generally agrees that UML is extremely complex. Moreover, it is growing even more complex since UML 2.0 includes four additional diagrams and extension specifications for specific application have been published, or are under development now. Therefore, an assessment of complexity and practitioner usage patterns can provide guidance to method engineers (those who create modeling languages such as UML), practitioners, and educators.
Research Methodology and Framework Delphi Studies The research proposes to investigate practical complexity, and the formulation of a UML kernel by means of a Delphi study. Delphi studies attempt to form a reliable consensus of a group of experts in a specialized area (Ludwig 1997). The approach is a process that focuses on collecting information from the expert group though a series of questionnaires, and providing feedback to the group between questionnaires. A Delphi study is ideal for this research as identifying a kernel of UML requires a group of UML experts who have substantial UML experience. Since UML became an Object Management Group (OMG) standard only in 1999, there are only a handful of true UML experts worldwide. This group of UML experts is geographically dispersed, which is another reason a Delphi study is well-suited for this scenario. In this Delphi study, questionnaires are designed to allow the collection of expert opinions on the subject, irrespective of geographical location, and then to facilitate the refinement or focus of the subsequent versions to narrow in on a consensus. In our research, the Delphi study comprised three questionnaires. The three Delphi questionnaires included separate “sheets,” one provided to rank the nine UML diagrams and one provided to rank the constructs of each diagram. The results of the previous questionnaire (after round 1) were provided as a mean of the group response. In addition to rating the diagrams or constructs, the questionnaires asked respondents whether the diagrams or constructs should be included in the kernel. Three rounds were used because past research into the effectiveness of Delphi studies indicates that at least three rounds are necessary for a relatively complete Delphi, but that the benefits gained from additional rounds have sometimes been found to be marginal if more than three rounds are used (Turoff and Linstone 2002).
Subjects A total of 44 subjects agreed to participate in the study, and were sent questionnaire 1. Of these, 29 returned useable surveys; a presentation of their demographic information follows. The average development experience of the 29 respondents was 9.5 years, and the average UML development experience was 4.5 years. The UML experts were identified from Working Group 8.1 (Design and Evaluation of Information Systems) of the International Federation for Information Processing, and from objectoriented practitioners and researchers, among other similar sources. In addition, since UML had been a standard for only about 5 years at the beginning of this study, the average UML development experience of 4.5 years shows that these subjects were truly experts in UML. The average time at current position was 6.9 years, average age was 37.4 years, and wioth 23 males and 6 females responding. Nearly half (14) of the respondents worked outside of the United Sates (Canada, 3; Argentina, 1; Spain, 2; Norway, 3; Netherlands, 1; France, 2; Germany, 1; and Finland 1).
Delphi Study and Metric Analysis Results UML Diagram Results Based on respondent ratings, the final orders of importance and kernel indications are as indicated in Tables 1 through 10. The top 4 diagrams in terms of mean rating scores were selected by the respondents to be included in the kernel, at respective consensus levels of 100 percent, 90.9 percent, 95.5 percent, and 100 percent. The next highest rated diagram in terms of importance attained only a 31 percent consensus level, indicating the respondents clearly distinguished between important and less important diagrams, and kernel and non-kernel diagrams. Note: the means are the arithmetic mean of the subject. 2004 — Twenty-Fifth International Conference on Information Systems
187
Erickson & Siau/Theoretical & Practical Complexity of UML
Table 1. UML Diagram Results
Construct Class Use Case Sequence Statechart Component Activity Collaboration Deployment Object
Mean 1.00 1.61 1.73 1.81 2.31 2.41 2.57 2.69 3.00
Standard Deviation 0.00 0.79 0.70 0.51 0.70 0.55 0.87 0.75 0.86
Table 3. Use Case Diagram Results
% “Yes” for Kernel 100.0% 90.9% 95.5% 100.0% 31.8% 27.3% 22.7% 9.1% 9.1%
Table 2. Class Diagram Results
Construct Association Class Generalization Single inheritance Aggregation Composition Interface Constraint Package Note Dependencyrealization Stereotype Object Dependencyusage Multiple inheritance Instantiate Subsystem Qualified association Tagged value
188
Mean 1.00 1.00 1.09 1.14
Standard Deviation 0.00 0.00 0.29 0.36
% “Yes” for Kernel 100.0% 100.0% 100.0% 100.0%
1.45 1.45 1.67 1.76 1.86 1.95 2.07
0.74 0.60 0.80 0.77 0.57 0.50 0.46
95.5% 100.0% 90.9% 90.9% 90.9% 86.4% 18.2%
2.23 2.38 2.47
0.75 0.67 0.80
45.5% 22.7% 13.6%
2.47
0.96
13.6%
2.50 2.58 2.71
0.76 0.90 0.92
9.1% 13.6% 18.2%
2.89
0.57
9.1%
2004 — Twenty-Fifth International Conference on Information Systems
Construct Actor Use case Uses Note Association Include Extend Package Generalization Stereotype Dependency Constraint Subsystem Tagged value
Mean 1.09 1.09 1.76 1.79 1.80 1.95 2.14 2.42 2.43 2.47 2.53 2.55 2.75 3.13
Standard Deviation 0.29 0.29 0.94 0.51 1.01 0.97 1.04 0.61 0.93 0.90 0.96 1.05 0.86 0.72
% “Yes” for Kernel 95.5% 95.5% 95.5% 90.9% 90.9% 95.5% 86.4% 18.2% 31.8% 27.3% 13.6% 13.6% 9.1% 9.1%
Table 4. Sequence Diagram Results
Construct Object Message Lifeline Actor Note Focus of control Constraint Stereotype Tagged value
Mean 1.05 1.14 1.24 1.32 1.90 1.95 2.29 2.42 2.75
Standard Deviation 0.21 0.35 0.44 0.57 0.44 0.71 0.78 0.90 0.77
% “Yes” for Kernel 100.0% 100.0% 95.5% 100.0% 50.0% 77.3% 27.3% 22.7% 13.6%
Erickson & Siau/Theoretical & Practical Complexity of UML
Table 5. Statechart Diagram Results
Construct Event State Final state Initial state Transition Sub-state Action state Activity state Note Fork Join Branch Constraint Stereotype Object Tagged value
Mean 1.00 1.00 1.15 1.15 1.15 1.40 1.95 2.00 2.16 2.21 2.26 2.35 2.60 2.75 2.82 3.07
Standard Deviation 0.00 0.00 0.37 0.37 0.37 0.60 1.10 1.11 0.50 0.98 0.93 0.93 0.99 1.13 1.07 0.83
% “Yes” for Kernel 100.0% 100.0% 95.0% 95.0% 100.0% 95.0% 80.0% 75.0% 30.0% 15.0% 15.0% 15.0% 20.0% 15.0% 10.0% 10.0%
Table 7. Activity Diagram Results
Construct Activity state Transition Fork Join Branch Action state Initial state Stop state Object Object flow Swimlane Note Constraint Stereotype Tagged value
Mean 1.00 1.00 1.07 1.14 1.21 1.43 1.43 1.43 1.50 1.79 1.83 2.21 2.57 2.62 2.82
Standard Deviation 0.00 0.00 0.27 0.36 0.43 1.16 0.85 0.85 0.65 0.70 0.39 0.58 0.65 0.96 0.60
% “Yes” for Kernel 100.0% 100.0% 100.0% 100.0% 100.0% 92.9% 92.9% 92.9% 100.0% 100.0% 92.9% 14.3% 14.3% 28.6% 14.3%
Table 8. Deployment Diagram Results Table 6. Component Diagram Results
Construct Interface Package Deployment component Dependency Stereotype Subsystem Work product component Execution component Realization Note Association Composition Constraint Dependencyusage Aggregation Generalization single inheritance Tagged value Generalization multiple inheritance
Mean 1.00 1.33 1.42
Standard Deviation 0.00 0.65 0.67
% “Yes” for Kernel 100.0% 100.0% 100.0%
1.50 1.50 1.58 1.64
0.67 0.67 0.67 0.67
91.7% 100.0% 100.0% 100.0%
1.73
1.01
100.0%
1.75 2.25 2.67 2.67 2.67 2.82
0.75 0.62 1.50 1.44 0.98 1.08
91.7% 33.3% 16.7% 8.3% 0.0% 0.0%
3.08 3.17
1.31 1.19
0.0% 0.0%
3.20 3.42
0.79 1.08
0.0% 0.0%
Construct Device Processor Distribution unit Stereotype Note Constraint Association Dependencyrealization Tagged value Dependencyusage Aggregation Composition
Mean 1.25 1.38 1.63 1.89 2.33 2.67 3.00 3.00
Standard Deviation 0.71 0.74 0.74 0.78 0.71 1.12 1.22 1.22
% “Yes” for Kernel 100.0% 100.0% 90.0% 100.0% 20.0% 0.0% 0.0% 0.0%
3.13 3.22
0.64 1.09
0.0% 0.0%
3.33 3.56
1.22 1.13
0.0% 0.0%
Table 9 Collaboration Diagram Results
Construct Object Link Actor Note Stereotype Constraint Tagged value
Mean 1.00 1.33 1.44 2.22 2.24 2.50 2.77
Standard Deviation 0.00 0.49 0.98 0.73 0.75 0.71 0.60
% “Yes” for Kernel 100.0% 94.7% 94.7% 31.6% 36.8% 15.8% 10.5%
2004 — Twenty-Fifth International Conference on Information Systems
189
Erickson & Siau/Theoretical & Practical Complexity of UML
Table 10. Object Diagram Results
Construct Object Link Note Stereotype Constraint Tagged value
Mean 1.24 1.44 2.60 2.64 2.67 3.09
Standard Deviation 0.56 0.63 0.91 1.08 1.05 0.83
% “Yes” for Kernel 100.0% 94.4% 27.8% 16.7% 11.1% 5.6%
Metrical Analyses The kernel resulting from the Delphi study is analyzed in this section using the Rossi and Brinkkemper (1996) metrics. Through participation in the Delphi study, the subjects have identified one possible UML kernel. It appears that there is a relatively clear break between the important constructs and the less important constructs. The important constructs, whether the break occurs at more or less than 20 percent of the constructs, have been identified as a kernel of UML. The kernel is analyzed using two different selection criteria, and the Siau and Cao (2001) results are provided as a comparative basis. For the first analysis, the constructs rated (roughly) between 1.0 and 2.0 by the respondents are used to compile a first estimate of complexity, while for the second analysis those constructs rated at between 1.0 and 2.3 are used to compile the secondary complexity estimate. The rating of 2.3 was chosen because 0.3 represents one-half of the average standard deviation of the ratings for the top four ranked diagrams.
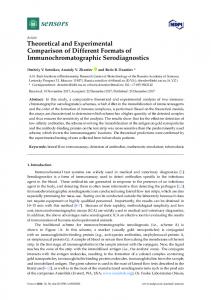
Technique Level Metrics This section presents the complexity analyses results for the constructs of the individual UML diagrams. Three analyses were performed on the Delphi results. The first presents the complexity estimates for all nine UML diagrams and all constructs on the basis of the respondent-identified kernels for each diagram. The second, identified as Kernel A, analyzes only the four respondent-identified kernel diagrams, while the third, identified as Kernel B, analyzes the four kernel diagrams plus one additional diagram (the additional 0.50 standard deviation, as discussed previously). As can be seen from Figure 2, the counts of object, property, and relationship types all decrease or remain equal from the original Siau and Cao results to Kernel B to Kernel A results. It would not have been possible for any of the counts to have increased as a result of this study. However, the same is not the case for a number of the average results. It is possible for the averages to increase, decrease, or remain equal from analysis to analysis. The reason that this is possible is that the averages are just that— averages. For example, for class diagrams, the average number of properties per object type increased because the respondents excluded a higher proportion of the object types that were related to specific property types from the kernel, therefore increasing the ratio (average). This also affects some of the technique level metrical results similarly.
Aggregate Technique Metrics This section presents the aggregate metrics for the nine UML diagrams in terms of division of work, average complexity, and total complexity. For division of work, it appears that all of the diagrams, except collaboration diagram, decreased, as would be expected from a decrease in the number of constructs. It appears that the reason for the increase in division of work for the collaboration diagram can be attributed to the fact that the respondents excluded a higher proportion of property types from the kernel, thereby increasing the ratio (average). The total conceptual complexity remains constant or decreases for all diagrams, indicating an expected result. Figure 3 presents the results.
190
2004 — Twenty-Fifth International Conference on Information Systems
Erickson & Siau/Theoretical & Practical Complexity of UML
9 3 4 9 7 5 3 3 2
9 3 3 8 6 4 2 3 2
1.71 1.00 0.67 1.00 1.00 0.75 1.00 1.00 1.67
1.80 1.00 0.67 1.13 1.00 0.71 1.00 1.00 2.00
Average Number of Relationship Types UML Kernel B that can be connected to a given Object Type UML Kernel A
9
Siau & Cao
Number of Relationship Types UML Kernel B that can be connected UML Kernel A to a certain Object type Siau & Cao
UML Kernel A
Siau & Cao
Siau & Cao
8
Average Number of UML Kernel B Properties per Relationship Type
7
Number of Properties UML Kernel B of a relationship type and its roles UML Kernel A
6
UML Kernel A
Siau & Cao
Number of Properties UML Kernel B for a Given Object Type UML Kernel A
Siau & Cao
UML Kernel A
Count of Property UML Kernel B Types
Siau & Cao
5 18 12 11 18 15 15 12 3 6 4 4 6 3 3 6 5 1 1 1 5 5 4 4 7 4 3 1 11 10 9 10 6 10 2 2 9 8 7 8 6 5 5 5 6 5 4 6 2 1 1 1 7 3 2 4 3 7 0 0 5 3 3 5 1 1 1 1 5 2 2 5
Average Number of UML Kernel B Properties per Object Type
Independent Metrics 4 5
3
UML Kernel A
Count of Relationship UML Kernel B Types
5 3 6 8 7 7 3 3 1
Siau & Cao
7 6 6 10 8 8 4 5 3
2
UML Kernel A
UML Kernel B Count of Object Types
Diagrams Class Use Case Sequence Statechart Component Activity Collaboration Deployment Object
Siau & Cao
1
1.80 22 13 13 1.22 1.08 1.18 18 13 12 2.57 2.60 2.40 1.00 5 4 4 0.83 1.00 1.00 6 4 4 1.00 1.33 1.33 0.60 6 0 0 6.00 0.00 0.00 1 1 1 0.17 0.17 0.20 1.14 2 0 0 0.50 0.00 0.00 4 3 1 0.40 0.38 0.14 1.00 13 1 1 1.30 0.50 0.50 10 0 0 1.25 0.00 0.00 0.67 1 0 0 0.20 0 0.00 5 5 5 0.63 0.71 0.83 1.00 8 0 0 8.00 0.00 0.00 1 1 1 0.25 0.33 0.50 1.00 8 0 0 1.14 7 0 0 1.40 0.00 0.00 2.00 3 0 0 3.00 0.00 0.00 1 1 1 0.33 1.00 1.00
Legend (for all metrical analyses tables and figures): Siau and Cao = all diagrams and all constructs in all diagrams UML Kernel A = all kernel diagrams, and kernel constructs for each diagram (kernel inclusion at mean rating score of approximately 2.0 or less) UML Kernel B = all kernel diagrams, and kernel constructs for each diagram (kernel inclusion at mean rating score of approximately 2.3 or less, roughly 0.5 standard deviation higher than the respondent identified kernels) Figure 2. Technique (Diagram) Level Metrical Results
UML Kernel B Average Complexity
UML Kernel A
0.60 1.00 0.75 0.89 0.86 1.00 1.00 1.00 1.00
0.10 0.17 0.13 0.09 0.11 0.13 0.14 0.20 0.33
0.12 0.33 0.13 0.11 0.13 0.14 0.33 0.33 1.00
0.12 0.33 0.15 0.13 0.14 0.17 0.50 0.33 1.00
UML Kernel A
Siau & Cao
0.60 1.00 0.80 0.90 0.88 1.00 1.00 1.00 1.00
Total Conceptual UML Kernel B Complexity
UML Kernel A
0.67 1.00 0.80 0.91 0.89 1.00 0.57 1.00 1.00
12
Siau & Cao
UML Kernel B Division of Work
Diagrams Class Use Case Sequence Statechart Component Activity Collaboration Deployment Object
Siau & Cao
Aggregate Metrics (Technique) 10 11
26.40 19.85 19.26 10.39 5.83 5.83 7.87 7.87 6.48 15.39 13.15 11.45 15.65 10.82 9.43 11.18 9.95 8.77 8.12 4.36 3.00 9.95 4.24 4.24 5.92 2.45 2.45
Figure 3. Aggregate Technique (Diagram) Metrical Results 2004 — Twenty-Fifth International Conference on Information Systems
191
Erickson & Siau/Theoretical & Practical Complexity of UML
Table 11. Method (Overall UML) Metrics
57
43
38
53
29
26
72
54
49
Kernel A
37
29
26
39
22
19
49
41
38
Kernel B
29
22
20
29
20
17
40
33
31
0.2 1 0.1 6 0.1 6
UML Kernel A
0.1 9 0.1 4 0.1 5
Cumulative Complexity
UML Kernel B
0.1 4 0.1 2 0.1 2
17
Siau & Cao
UML Kernel A
Siau and Cao
UML Kernel B
UML Kernel A
UML Kernel B
Sum of all property types
16 Division of work between objects and relationships
Siau & Cao
15
Siau & Cao
Siau & Cao
UML Kernel A
UML Kernel B
Siau & Cao
Sum of all object types
UML Kernel A
14 Sum of all relationship types
UML Kernel B
13
106
75
67
73
55
50
57
44
41
Method Level Metrics Table 11 shows the effect of the Delphi kernel selection on UML as a whole. The first line indicates the overall complexity of UML when all of the diagrams and constructs are included in the analysis; the second line includes only the Kernel B diagrams (class, use case, sequence, statechart, and component) and their respective (kernel) constructs to calculate the overall complexity; and the third line includes only the Kernel A diagrams (class, use case, sequence, and statechart) and their respective (kernel) constructs for the overall complexity calculations.
Discussion In general, it appears that the research resulted in a relatively clear identification of one possible UML kernel by the subject experts, as evidenced by the mean rating scores and measure of central tendency. The UML kernel identified consists of the class, use case, sequence, and statechart diagrams, with an agreement or consensus level of 90 percent or greater. By contrast only 31 percent of the respondents felt that the next highest diagram, component, should be included in the kernel. What this appears to indicate is that practitioners tend to use UML to model more heavily in the analysis and design stages of the system development process, and less for testing and implementation. From the perspective of these results, it remains unclear as to what role UML plays in the coding stage. The results, however, do highlight what UML actually looks like to practitioners, and that has some definite implications for others who may need to use the language. If practitioners are truly doing what they indicated they were doing in the study, then it appears that users should begin their UML learning with class and use case diagrams. Not coincidentally, that is precisely where the creators of UML also recommend that developers begin the systems creation process. Naturally, that begs the question, “What’s new in the findings?” The point here is that newcomers to UML, and most end-users would fall into that category, likely have no plans to become expert at the language, but rather a more plausible goal for such people regarding UML would be to learn to understand the constructs and diagrams that are most pertinent to them. Even UML experts may not be familiar with those constructs that are hardly ever used in practice. In this research, we identified the most important and useful constructs and diagrams in UML. These comprise a kernel of UML and UML users need to be familiar with these core sets of constructs and diagrams. The kernel of UML is also the place where new UML users should start to learn about UML.
192
2004 — Twenty-Fifth International Conference on Information Systems
Erickson & Siau/Theoretical & Practical Complexity of UML
Complexity From a complexity perspective, if we include just the first four diagrams in the kernel along with just their kernel constructs, and assume that it represents the most commonly used diagrams in UML, then the Briand et al. (1999) structural complexity and related cognitive complexity that users experience should be more manageable than if the users were commonly using all of the diagrams, and all of their related constructs to model systems. The change in overall complexity from 106.03 (Siau and Cao 2001) to 40.62 (Kernel A) represents a nearly 61.7 percent decrease in the measurement. Since all of the diagrams and constructs associated with the non-kernel items essentially disappear, that represents a notable reduction in complexity. There are 116 constructs identified with the nine primary UML diagrams, and 58 of those are included in the top 4 importance rated diagrams. Of those 58 constructs, 31 were identified by respondents as kernel items, and would make up the UML kernel. This results in 26.7 percent of the total number of UML constructs and these constructs comprise the respondent-identified UML kernel. Even if the analysis is conducted on all constructs of the kernel diagrams, the reduction in overall complexity is still more than 29 percent. The research objectives (1) to identify a kernel of UML and (2) to use that identified kernel to propose a more practical assessment of UML’s complexity appear to have been met. The Delphi participants did identify a kernel of UML based on a group of UML experts, and that kernel has been used to provide an alternative assessment of the complexity of UML.
Conclusions, Contribution, and Future Research UML can be used in all stages of the systems development process, but it appears, based on the results of this research, that many developers use it primarily in the early stages of the process, or during systems analysis and design. UML is also criticized for its size and complexity, and while it is true that UML is very large, and arguably complex, at least much more so than almost all other development methods, this research provides an alternative means of looking at UML. So, what we are really trying to say to new UML users, and those teaching UML to others, whether on the job or in the classroom is, “Start here.” In other words, new UML users can learn the kernel of the language first and there may not be a need to learn those constructs that are hardly ever used in practice. While Rossi and Brinkkemper’s (1996) metrics , along with Siau and Cao’s (2001) metrical analysis of UML and other methods, provide an estimate of the theoretical (total) complexity of modeling methods, Siau et al. (2002) provided at least some evidence that theoretical complexity does not adequately capture or measure the complexity that people actually face when using UML. This research has attempted to address the measurement of practical complexity by means of the Delphi study conducted herein. The results appear to support the conjecture that a kernel of UML exists, and the implications for researchers, practitioners, and educators alike should be of interest. The participant-identified UML kernel was identified, and that would mean that, from a user perspective, UML is not as complex and difficult as some researchers have indicated, simply because many of the expert users indicated that they had rarely, if ever, used some of the less important diagrams and constructs. This could render UML more attractive as a modeling tool for agile (lighter) system developers since agile approaches and systems appear poised to be an important wave of the future. For method engineers, the results of this study could be used to change the way modeling languages (methods) are created, because if some of the less-used diagrams are indeed not useful, then a valid question is why are such models constructed? Critics of UML hint that UML is simply the result of negotiation among the original UML proponents and their separate methods rather than a scientifically based development effort. For existing practitioners operating in a more traditional environment, these results should provide validation of their own development efforts. For educators, the results should be useful in course development, or in a broad sense, what to teach and when, if a particular systems analysis and design course uses UML as an integral part of the classroom experience. In other words, educators could spend the majority of their classroom time concentrating on the kernel diagrams and constructs, now that a practical-based kernel has been identified. Pending the imminent release of UML 2.0, it can only be expected for the next version to be larger than ever. However, since it has been demonstrated that one size does not fit all, it should be expected that a kernel would be useful for establishing the base constructs of the language, and providing guidelines for extending UML into multiple application or system areas. While it appears that a language kernel has been identified for UML 2.0, it is not yet available to the general public. This research can be extended in one direction by comparing the OMG/UML defined kernel and that identified by this research. The results provide a possible future direction for researchers studying complexity in development methodologies, since theoretical or total complexity would become a less prominent factor (although still extremely important in determining limits) in dealing with human cognitive limitations involving systems development. A continuation of research involving UML 2004 — Twenty-Fifth International Conference on Information Systems
193
Erickson & Siau/Theoretical & Practical Complexity of UML
extensions to specific application domains also appears necessary at this point. Another area of research would involve trying to measure the success of projects developed using UML.
References Albrecht, A. “Measuring Application Development Productivity,” in Proceedings of the IBM Development, Monterey, CA, October 14-17, 1979, p. 83. Albrecht, A., and Gaffney, J. “Software Function, Source lines of Code, and Development Effort Prediction: A Software Science Validation,” IEEE Transactions on Software Engineering (SE9:6), 1983, pp. 639-648. Anderson, J., and Lebiere, C. The Atomic Components of Thought, Lawrence Erlbaum Associates, Hillsdale, NJ, 1998.. Brooks, F. “No Silver Bullet: Essence and Accidents of Software Engineering,” IEEE Computer (20:4), 1987, pp. 10-19. Dobing, B., and Parsons, J. “Understanding the Role of Use Cases in UML: A Review and Research Agenda,” Journal of Database Management (11:4), 2000, pp. 28-36. Dori, D. “Why Significant UML Change Is Unlikely,” Communications of the ACM (45:11), November 2002, pp. 82-85. Duddy, K. “UML2 Must Enable a Family of Languages,” Communications of the ACM (45:11), November 2002, pp. 73-75. Ericsson, K., and Kintsch, W. “Long-Term Working Memory,” Psychological Review (102:2), 1995, pp. 211-245. Erickson, J., and Siau, K. “Unified Modeling Language? The Good, The Bad, and The Ugly,” in IS Management Handbook, H. Toppi and C. Brown (Eds.), Auerbach, Boca Raton, FL, pp. 483-497. Fenton, N., and Pfleeger, S. Software Metrics A Rigorous and Practical Approach, PWS Publishing, Boston, 1978, pp. 243-278. Halstead, M. Elements of Software Science, Elsevier, New York, 1977. Kim, J., Hahn, J., and Hahn, H. “How Do We Understand a System with (So) Many Diagrams? Cognitive Integration Processes in Diagrammatic Reasoning,” Information Systems Research (11:3), September 2000, pp. 284-303. Kintsch, W. “The Role of Knowledge in Discourse Comprehension: A Construction Integration Model,” Psychological Review (95:2), 1988, pp. 163-182. Kintsch, W. Comprehension: A Paradigm for Cognition, Cambridge University Press, New York, 1988. Kobryn, C. “What to Expect from UML 2.0,” SD Times, February 25, 2002 (available online at http://www.sdtimes.com/ opinions/guestview_048.htm; accessed October 22, 2002). Ludwig, B. “Predicting the Future: Have You Considered Using the Delhi Methodology?,” Journal of Extension (35:5), October 1997 (available online at http://www.joe.org/joe/1997october/tt2.html). Mcleod, G., and Roeleveld, D. “Method Evaluation in Practice: UML/RUP vs Inspired Method,” paper presented at the Workshop on Evaluation of Modeling Methods in Systems Analysis and Design, Tornoto, Canada, 2002. Miller, G. “The Magical Number Seven, Plus or Minus Two: Some Limits on Our Capacity for Processing Information,” The Psychological Review (63:2), 1956, pp. 81-97. Pfleeger, S., and McGowan C. “Software Metrics in a Process Maturity Framework,” Journal of Systems and Software (12:3), 1990, pp. 255-261. Rossi, M. and Brinkkemper, S. “Complexity Metrics for Systems Development Methods and Techniques,” Information Systems (21:2), 1996, pp. 209-227. Siau, K., and Cao, Q. “Unified Modeling Language (UML)—A Complexity Analysis,” Journal of Database Management (12:1), January/March 2002, pp. 26-34. Siau, K., Erickson, J., and Lee, L. “Complexity of UML: Theoretical versus Practical Complexity,” in Proceedings of the 12th Workshop on Information Technology and Systems (WITS), Barcelona, Spain, December 16-18, 2002, pp. 13-18. Sommerville, I. Software Engineering (6th ed.), Addison–Wesley, Essex, UK, 2001. Turoff, M., and Linstone, H. (Eds.). Delphi Method: Techniques and Applications, 2002 (available online at http://www.is.njit.edu/pubs/delphibook; accessed February 20, 2003). Vessey, I., and Conger, S. “Requirements Specification: Learning Object, Process, and Data Methodologies,” Communications of the ACM (37:5), 1994, pp. 102-113. Weyuker, E., 1988, “Evaluating Software Complexity Measures,” IEEE Transactions on Software Engineering (14:4), 1988, pp. 1357-1365. Zendler, A., Pfeiffer, T., Eicks, M., and Lehner, F. “ Experimental Comparison of Coarse Grained Concepts in UML, OML and TOS,” Journal of Systems and Software (57), 2001, pp. 21-30.
194
2004 — Twenty-Fifth International Conference on Information Systems