May 4, 2012 - for-profit organizations should reflect their mission. “In such ...... b asis o f cu rren tly availab le evid en ce.E stim ated co st red u ctio n o f. 5% an d estim ...... services organizations, San Francisco: Jossey-Bass. Rotstein, Z. et ...
Department of Industrial Engineering and Management
Johan Groop
Aalto-DD 47/2012
Theory of Constraints in Field Service
Aalto University School of Science Department of Industrial Engineering and Management www.aalto.fi
Factors Limiting Productivity in Home Care Operations
Johan Groop
BUSINESS + ECONOMY ART + DESIGN + ARCHITECTURE SCIENCE + TECHNOLOGY CROSSOVER DOCTORAL DISSERTATIONS
Aalto University
9HSTFMG*aefjdb+
ISBN 978-952-60-4593-1 ISBN 978-952-60-4594-8 (pdf) ISSN-L 1799-4934 ISSN 1799-4934 ISSN 1799-4942 (pdf)
Theory of Constraints in Field Service
DOCTORAL DISSERTATIONS
Aalto University publication series DOCTORAL DISSERTATIONS 47/2012
Theory of Constraints in Field Service: Factors Limiting Productivity in Home Care Operations Johan Groop
Doctoral dissertation for the degree of Doctor of Science in Technology to be presented with due permission of the School of Science for public examination and debate in Auditorium AS1 at the Aalto University School of Science (Espoo, Finland) on May 4, 2012 at 12:00 p.m.
Aalto University School of Science Department of Industrial Engineering and Management
Supervisor Professor Paul Lillrank Instructor Dr. Anu Helkkula Preliminary examiners Professor John H. Blackstone Jr., University of Georgia, USA Professor Mahesh C. Gupta, University of Louisville, USA Opponent Professor Emeritus James F. Cox III, University of Georgia, USA
Aalto University publication series DOCTORAL DISSERTATIONS 47/2012 © Johan Groop ISBN 978-952-60-4593-1 (printed) ISBN 978-952-60-4594-8 (pdf) ISSN-L 1799-4934 ISSN 1799-4934 (printed) ISSN 1799-4942 (pdf) Unigrafia Oy Helsinki 2012 Finland The dissertation can be read at http://lib.tkk.fi/Diss/
Abstract Aalto University, P.O. Box 11000, FI-00076 Aalto www.aalto.fi
Author Johan Groop Name of the doctoral dissertation Theory of Constraints in Field Service: Factors Limiting Productivity in Home Care Operations Publisher School of Science Unit Department of Industrial Engineering and Management Series Aalto University publication series DOCTORAL DISSERTATIONS 47/2012 Field of research Service Operations Management Manuscript submitted 24 February 2012 Date of the defence 4 May 2012 Monograph
Manuscript revised 7 April 2012 Language English
Article dissertation (summary + original articles)
Abstract Public home care providers are pressured to improve productivity in the face of growing demand, limited budgets, and poor availability of labor. Capacity is already perceived to be short, and the ensuing stress experienced by staff is a common cause of concern. Still, productivity is typically low, suggesting that available capacity is not used to its full potential. This dissertation seeks to explore the mechanisms and practices that inhibit the ability of home care providers to make better use of available resources, and to provide general templates for resolving these issues. Productivity in home care is analyzed using the Theory of Constraints (TOC). It is a management philosophy that focuses improvement efforts on the few constraints that have the greatest impact on overall performance. Originally developed for the process-centric environments of manufacturing and distribution, TOC offers an assortment of tools for translating its principles into practice. These tools have been researched, adopted for, and implemented in a variety of service industries, including health services, with very persuasive results. In most cases so far, the structure of the service processes has resembled manufacturing closely enough to render the tools almost directly applicable. The structure of processes in a field service, such as home care, is, however, very different in several key aspects. The successful adoption of TOC in field services requires these structural differences to be identified, and the tools modified accordingly. This dissertation examines the distinctive characteristics of field service processes, and discusses the implications for the applicability of TOC. It is argued that the differing structure of processes renders certain production management tools inapplicable, while other tools originally designed for distribution management are highly relevant in this context. The study demonstrates that TOC can provide home care with a systematic framework for identifying and resolving factors that limit productivity. The application of TOC to home care reveals several policies and practices which, intuitively, may seem logical and efficient, but in reality are counter-productive. These policy constraints artificially accumulate demand in the morning. As a consequence, a disproportionately high level of capacity is needed to satisfy demand, while also reinforcing caregiver stress during peak hours. A resource constraint during peak hours promotes the emergence of shortages, leading to a reliance on external leased labor. As a result of the investigation, the home care unit that was studied was able to significantly reduce its use of leased labor, the savings of which are estimated at €0.5M annually. Keywords Theory of Constraints, TOC, field service, productivity, home care, Service Operations Management, health service, core problem, process ISBN (printed) 978-952-60-4593-1 ISBN (pdf) 978-952-60-4594-8 ISSN-L 1799-4934 ISSN (printed) 1799-4934 ISSN (pdf) 1799-4942 Location of publisher Espoo Pages 213
Location of printing Helsinki Year 2012 The dissertation can be read at http://lib.tkk.fi/Diss/
Tiivistelmä Aalto-yliopisto, PL 11000, 00076 Aalto www.aalto.fi
Tekijä Johan Groop Väitöskirjan nimi Kapeikkoteoria kenttäpalveluissa: kotihoidon tuottavuutta rajoittavat tekijät Julkaisija Perustieteiden korkeakoulu Yksikkö Tuotantotalouden laitos Sarja Aalto University publication series DOCTORAL DISSERTATIONS 47/2012 Tutkimusala Palvelutuotannonohjaus Käsikirjoituksen pvm 24.02.2012 Väitöspäivä 04.05.2012 Monografia
Korjatun käsikirjoituksen pvm 07.04.2012 Kieli Englanti
Yhdistelmäväitöskirja (yhteenveto-osa + erillisartikkelit)
Tiivistelmä Kotihoidon palveluntuottajat pyrkivät parantamaan tuottavuuttaan kasvavan kysynnän, kustannuspaineiden ja henkilökunnan heikon saatavuuden takia. Kapasiteettia pidetään jo nykyisellään riittämättömänä ja henkilökunta kokee itsensä kiireiseksi. Silti tuottavuus on alhainen, mikä viittaa siihen, ettei nykykapasiteettia hyödynnetä täysimääräisesti. Väitöskirja tutkii mekanismeja ja toimintatapoja, jotka rajoittavat kotihoitoyksiköiden kykyä hyödyntää nykyresurssejaan ja ehdottaa näihin yleisiä ratkaisuja. Kotihoidon tuottavuutta analysoidaan kapeikkoteorian (Theory of Constraints TOC) avulla. Se on johtamisfilosofia, joka kohdistaa kehitystoimet niihin yksittäisiin rajoitteisiin, joilla on suurin vaikutus järjestelmän kokonaisvaltaiseen suorituskykyyn. TOC on alun perin kehitetty kappaletavaratuotannon ja jakelun prosessikeskeisiin ympäristöihin. Se tarjoaa valikoiman työkaluja TOC-teorian periaatteiden viemiseksi käytäntöön. Näitä työkaluja on tutkittu ja sovellettu vakuuttavin tuloksin eri palvelualoilla, myös terveyspalveluissa. Useimmissa tapauksissa palveluprosessien rakenne on riittävästi muistuttanut kappaletavaratuotantoa, jotta työkalut ovat olleet sovellettavissa lähes sellaisinaan. Kenttäpalveluissa, kuten kotihoidossa, palveluprosessien rakenne on kuitenkin monilla keskeisillä tavoilla hyvin erilainen. Nämä rakenteelliset eroavaisuudet on tunnistettava ja TOC:in työkalut muokattava eroavia tarpeita vastaaviksi, jotta TOC:ia voitaisiin soveltaa kenttäpalveluissa. Väitöskirja tarkastelee kenttäpalveluprosessien ominaispiirteitä ja käsittelee näiden vaikutuksia TOC:in sovellettavuuteen. Tutkimus toteaa, että prosessirakenteen ominaispiirteiden vuoksi tietyt tuotannonohjaustyökalut eivät sovellu kenttäpalveluihin. Sen sijaan alun perin jakelunhallintaan kehitetty työkalu voisi soveltua resurssien kohdentamiseen kenttäpalveluissa. Tutkimuksessa osoitetaan että TOC on kotihoitoon soveltuva, systemaattinen viitekehys, jonka avulla voidaan tunnistaa ja ratkaista tuottavuutta rajoittavia tekijöitä. TOC:in soveltaminen kotihoitoon paljastaa useita menettelytapoja, jotka vaistonvaraisesti vaikuttavat järkeviltä ja tehokkailta, mutta todellisuudessa rajoittavat tuottavuutta. Nämä menettelytavat luovat keinotekoisen ruuhkahuipun aamuihin, minkä seurauksena tarvitaan suhteettoman paljon kapasiteettia vastaamaan kysyntää. Samalla hoitajien kiireen tunne ruuhka-aikoina kasvaa. Ruuhka-ajan resurssirajoite johtaa usein työvoimavajeeseen, minkä vuoksi on turvauduttava vuokratyövoimaan. Tutkimuksen tuloksena kotihoitoyksikkö vähensi vuokratyövoimankäyttöään merkittävästi, mistä koituvat säästöt ovat arviolta €0.5M vuositasolla. Avainsanat Theory of Constraints, TOC, kapeikkoteoria, kotihoito, tuotantotalous, kenttäpalvelu, terveyspalvelu, ydinongelma, prosessi, tuottavuus ISBN (painettu) 978-952-60-4593-1 ISBN (pdf) 978-952-60-4594-8 ISSN-L 1799-4934 ISSN (painettu) 1799-4934 ISSN (pdf) 1799-4942 Julkaisupaikka Espoo Sivumäärä 213
Painopaikka Helsinki
Vuosi 2012 Luettavissa verkossa osoitteessa http://lib.tkk.fi/Diss/
ACKNOWLEDGEMENTS
The endeavor of completing a doctoral dissertation is a challenge on so many levels. Although intellectually rewarding and certainly a great learning experience, the process is a rollercoaster of feelings, ranging from epiphany and enthusiasm to frustration and even despair. I would argue that, at some point, anyone who has experienced the dissertation process has probably felt the urge to hurl the manuscript out the window, most likely on more than one occasion. Fortunately, I have had the pleasure and honor to be surrounded by brilliant people who have supported me along the way and who have helped me follow through. I wish to start by expressing my deepest gratitude to the two people who perhaps have had the greatest impact on my work: my supervisor, Professor Paul Lillrank, and my instructor, Dr. Anu Helkkula. Professor Lillrank was the inspiration that first sparked my interest in Healthcare Operations Management. Later, he was also the one to suggest I take a closer look at the Theory of Constraints (well, I guess I kind of did!). Professor l’s incredible ability to give structure to unstructured thinking and ideas in a meaningful way has been a tremendous asset. He has provided me with scientific freedom and encouraged me to find my own way; yet at the same time, he has offered the level of guidance and mentorship needed for all the pieces to come together. Dr. Helkkula deserves special recognition for her critical role throughout the writing process. Her untiring willingness to provide me with valuable feedback has greatly improved both the structure of the dissertation and the quality of the writing. Many times, she prioritized reading and commenting on my manuscript over her social responsibilities, occasionally even during weekends and late nights. Without her patience, relentless encouragement, and constructive comments, I am doubtful that this dissertation would ever have seen the light of day. I am honored to have had such great minds and distinguished scholars as Professor John H. Blackstone and Professor Mahesh C. Gupta serve as my i
pre-examiners. Their previous work has been an inspiration throughout my dissertation process. I am grateful for their worthy reviews and encouraging words, which meant a lot to me. I would also like to thank my fellow researchers, colleagues, and friends at the HEMA Institute at Aalto University, who have provided me with camaraderie and a stimulating research environment. They have made my dissertation an enjoyable experience and HEMA a fun place to work. In particular, I want to thank Karita Reijonsaari, Henri and Minni Hietala, Tomi Malmström, Iiris Riippa, Docent Miika Linna, Dr. Antti Peltokorpi, Paulus Torkki, Ari-Matti Auvinen, Olli-Pekka Kahilakoski, Lauri Saviranta, Antero Vanhala, Antti Autio, Kirsti Kuusterä, and Sara Viitala. I further thank Professor Erkki Vauramo for his mentorship during this journey. I would also like to express my gratitude to the director of BIT Research Centre, Dr. Jouni Partanen, and the director of StraX, Docent Mika Aaltonen. In addition, I am obliged to Professor Jan Holmström for his insight and guidance regarding the choice of research methodology. The empirical research would not have been possible had it not been for the collaboration and relentless support of a wonderful group of people at the City of Espoo and at Espoo Home Care, in particular. I especially want to express my deep appreciation to Raija Kasanen, Hannele Vepsäläinen, Nina WinqvistNiskanen, Tuula Kuismanen, Nina Tähkäpää, Terttu Klasila, Raija Välimäki, Dr. Jukka Louhija, Professor Jaakko Valvanne, and Dr. Juha Metso. Research requires funding. Thank you to the European Regional Development Fund (ERDF) for funding the research project (PARETO), through which the empirical research was conducted. I also want to cordially acknowledge the following funding bodies for their financial support: the Jenny and Antti Wihuri Foundation, the Marcus Wallenberg Foundation, the Finnish Foundation for Technology Promotion, and the Emil Aaltonen Foundation. Most importantly, I thank my love and partner in life, Karita, for always being there for me. Her undivided support and words of comfort made me pull through even the most frustrating of times. Helsinki, April 2, 2012 Johan Groop
ii
CONTENTS ACKNOWLEDGEMENTS .................................................................................................. i DEFINITION OF CONCEPTS ........................................................................................ viii PREFACE ....................................................................................................................xiv 1
INTRODUCTION ..................................................................................................... 1 1.1 1.2
EMPIRICAL BACKGROUND......................................................................................................1 OPERATIONAL CONTEXT .......................................................................................................5 1.2.1
Field Service .......................................................................................................................5
1.2.2
Facility-Based Service Versus Field Service: A Process Perspective ......................................9
1.3
THEORETICAL APPROACH ................................................................................................... 12
1.4
RESEARCH GAP...................................................................................................................... 17
1.5
PURPOSE ................................................................................................................................. 18
1.6
RESEARCH QUESTIONS ........................................................................................................ 19
1.7
SCOPE ...................................................................................................................................... 19
1.8
1.9
RESEARCH APPROACH AND METHODOLOGY .................................................................. 21 1.8.1
Research Approach ......................................................................................................... 21
1.8.2
Methodology .................................................................................................................... 22
STRUCTURE OF THE DISSERTATION ................................................................................... 23
2 THEORY OF CONSTRAINTS ............................................................................... 26 2.1
THE FOUNDATIONAL UNDERPINNINGS OF TOC ........................................................... 26 2.1.1
2.2 2.3
2.4
2.5
Focus .............................................................................................................................. 26
2.1.2
Systems Thinking............................................................................................................ 28
2.1.3
Different Types of Constraints ......................................................................................... 30
TOC’S THREE BRANCHES .................................................................................................... 33 LOGISTICS ............................................................................................................................... 35 2.3.1
Process of Ongoing Improvement ...................................................................................... 35
2.3.2
Drum-Buffer-Rope .......................................................................................................... 43
2.3.3
Buffer Management ......................................................................................................... 46
2.3.4
Replenishment ................................................................................................................. 47
PERFORMANCE MEASUREMENT ......................................................................................... 49 2.4.1
The TOC Performance Measurement System ................................................................... 50
2.4.2
Prioritization of Performance Measures ............................................................................ 53
2.4.3
Not-For-Profit Organizations ......................................................................................... 54
THINKING PROCESSES.......................................................................................................... 54 2.5.1
Overview of the TPs ........................................................................................................ 55
2.5.2
Concepts and Terminology ............................................................................................... 59
2.5.3
Categories of Legitimate Reservation ................................................................................ 60
2.5.4
Current Reality Tree ....................................................................................................... 61
2.5.5
Conflict Resolution Diagram ........................................................................................... 62
iii
3 TOC IN SERVICES ................................................................................................. 65 3.1
3.2
OVERVIEW OF TOC IN SERVICES........................................................................................65 3.1.1
Issues Encountered When Transferring TOC to Services ..................................................65
3.1.2
Performance Measurement in Services ............................................................................... 67
3.1.3
TOC Tools Modified for Services .....................................................................................70
3.1.4
Overview of Application Areas in Services ........................................................................71
3.1.5
TOC in Field Services .....................................................................................................71
TOC IN HEALTH SERVICES ..................................................................................................73 3.2.1
Overview of the Literature ................................................................................................73
3.2.2
Defining the Goal and Performance Measurements in a Health Service Context ...............79
4 RESEARCH SETTING ........................................................................................... 85 4.1
4.2
DESCRIPTION OF HOME CARE ............................................................................................85 4.1.1
Demand...........................................................................................................................88
4.1.2
Time-Criticality ...............................................................................................................88
4.1.3
Home visits ......................................................................................................................89
4.1.4
Organization and Staff ....................................................................................................90
4.1.5
Daily Operations .............................................................................................................91
4.1.6
Scheduling ........................................................................................................................ 92
4.1.7
Performance Measurement ................................................................................................93
APPLYING TOC CONCEPTS TO HOME CARE ....................................................................96 4.2.1
The Mission of Home Care ..............................................................................................96
4.2.2
The Goal and Necessary Conditions.................................................................................97
4.2.3
Defining the TOC Performance Measurements ................................................................. 99
5 RESEARCH DESIGN.............................................................................................100 5.1
RESEARCH QUESTIONS ...................................................................................................... 100
5.2
METHODOLOGY .................................................................................................................. 101
5.3
RESEARCH PROCESS............................................................................................................ 102
5.4
5.5
METHODS ............................................................................................................................. 103 5.4.1
Quantitative Data Collection and Analysis ................................................................... 106
5.4.2
Qualitative Data Collection and Analysis ..................................................................... 108
EVALUATION OF THE STUDY ............................................................................................ 113 5.5.1
Quantitative Data and Analysis ................................................................................... 113
5.5.2
Qualitative Data and Analysis ..................................................................................... 114
6 ANALYSIS & FINDINGS: PART 1 ........................................................................ 116 6.1
6.2
iv
IDENTIFYING THE CONSTRAINT ...................................................................................... 116 6.1.1
The Existence of a Peak Time Resource Constraint ...................................................... 116
6.1.2
Pre-Intervention Performance ......................................................................................... 118
6.1.3
Analyzing Peak Time Demand .................................................................................... 119
THE CORE PROBLEM .......................................................................................................... 120 6.2.1
Undesirable Effects (UDEs)......................................................................................... 121
6.2.2
Current Reality Tree (CRT) ......................................................................................... 123
6.2.3
The Conflict Underlying the Core Problem .................................................................... 129
7 INTERVENTION.................................................................................................. 132 7.1
DESIGN PROPOSITIONS ...................................................................................................... 132
7.2
IMPLEMENTATION .............................................................................................................. 134
8 ANALYSIS & FINDINGS: PART 2 ....................................................................... 136 8.1
8.2
8.3
OUTCOME OF THE INTERVENTION.................................................................................. 136 8.1.1
Peak Time Throughput ................................................................................................. 139
8.1.2
Analyzing the Intervention ............................................................................................ 141
8.1.3
Comparison of Local Units ........................................................................................... 143
IDENTIFYING ADDITIONAL CORE PROBLEMS ................................................................ 145 8.2.1
Undesirable Effect and Core Problems ........................................................................... 145
8.2.2
The CRT Revised ......................................................................................................... 146
8.2.3
Exposing Another Conflict ........................................................................................... 149
DEVELOPMENTS AFTER THE FOLLOW-UP PERIOD ...................................................... 152
9 CONTRIBUTION & IMPLICATIONS ................................................................ 155 9.1
THEORY OF CONSTRAINTS IN FIELD SERVICE ............................................................... 155 9.1.1
9.2
9.3
9.4
Structure and Flow of Conventional Versus Field Service Processes ................................ 156
9.1.2
Replenishment: Home Care as a Distribution Environment ........................................... 161
9.1.3
Applicability of TOC to a Field Service Environment ................................................... 167
FACTORS LIMITING PRODUCTIVITY IN HOME CARE .................................................... 168 9.2.1
What Constrains the Productive Use of Labor in Public Home Care? ........................... 169
9.2.2
The Effects of Uneven Demand and the Ensuing Peak Time Resource Constraint ......... 171
MANAGERIAL IMPLICATIONS ............................................................................................ 172 9.3.1
Design Propositions ....................................................................................................... 172
9.3.2
Overestimating Demand ................................................................................................ 174
9.3.3
The Effect of Increasing Demand on the Cost of Home Care .......................................... 174
9.3.4
Unit Cost Should not be Used for ‘Make-or-Buy’ Decisions .......................................... 175
LIMITATIONS & FUTURE RESEARCH ................................................................................ 176
REFERENCES ............................................................................................................ 179
v
LIST OF FIGURES Figure 1. The projected demographic dependency ratio. ................................................................... 2 Figure 2. The number of regular home care customers in Espoo. ................................................... 4 Figure 3. A categorization of services.................................................................................................... 6 Figure 4. An example of a facility-based service process. .................................................................. 9 Figure 5. An example of the production flow of a single operator in a field service process ....11 Figure 6. A simple system as a series of dependent events ..............................................................28 Figure 7. The TOC branches and their various tools .......................................................................35 Figure 8. The process of ongoing improvement (POOGI) .............................................................36 Figure 9. Cost/utilization diagram .......................................................................................................39 Figure 10. Exploiting a resource constraint. .......................................................................................40 Figure 11. Examples of Drum-Buffer-Rope configurations in two environments ......................44 Figure 12. Buffer management .............................................................................................................47 Figure 13. Disaggregation of stock inventory increases the mismatch between demand and supply. ............................................................................................................................................ 48 Figure 14. The link between the operational measurements and the bottom-line measurements ........................................................................................................................................................ 52 Figure 15. The relationships between the CRT, CRD, and FRT ....................................................57 Figure 16. Categories of Legitimate Reservation ...............................................................................61 Figure 17. Conflict Resolution Diagram (CRD). ...............................................................................63 Figure 18. Inventory as bench capacity. ..............................................................................................69 Figure 19. The distribution of home care services between public and private providers in Espoo.............................................................................................................................................86 Figure 20. The flow of customers through the home care service system .................................... 87 Figure 21. Organization and staff ........................................................................................................ 90 Figure 22. The caregiver process ..........................................................................................................91 Figure 23. Conceptual illustration of three caregivers' simultaneous routes. ................................92 Figure 24. Front office and back office activities. .............................................................................94 Figure 25. Research Process............................................................................................................... 103 Figure 26. Load Analysis (2009) ........................................................................................................ 117 Figure 27. The relative load contribution of different dependency categories throughout the day (2009) ................................................................................................................................... 120 Figure 28. Overview of the pre-intervention CRT. ........................................................................ 124 Figure 29. CRT, part 1. ....................................................................................................................... 125 Figure 30. CRT, part 2. ....................................................................................................................... 126 Figure 31. CRT, part 3. ....................................................................................................................... 127 Figure 32. CRT, part 4. ....................................................................................................................... 128 Figure 33. CRD: the conflict underlying the core problem. ......................................................... 130 Figure 34. Exploiting the peak time constraint by leveling demand............................................ 133 Figure 35. Load Analysis (2011) ........................................................................................................ 137 Figure 36. Comparison of the distribution of throughput before and after the intervention . 137 Figure 37. Distribution of throughput between customer categories 2009-2011. ..................... 139
vi
Figure 38. The relative load contribution of different dependency categories throughout the day (2011). .................................................................................................................................. 140 Figure 39. The planned vs. the realized load distribution (2011) ................................................. 141 Figure 40. Comparison on the local units ........................................................................................ 144 Figure 41. Overview of the post-intervention CRT. ...................................................................... 147 Figure 42. CRT, part 5 ........................................................................................................................ 148 Figure 43. CRD: the conflict underlying core problem 2. ............................................................. 150 Figure 44. The number of leased labor shifts per week: 2009 vs. 2011. ..................................... 153 Figure 45. Unit of analysis: The caregiver process ......................................................................... 158 Figure 46. Multiple parallel field service processes ......................................................................... 164 Figure 47. Replenishment in a Home Care Environment. ............................................................ 165
LIST OF TABLES Table 1. The three types of sufficiency............................................................................................... 59 Table 2. Overview of the empirical literature on TOC in health services. ................................... 75 Table 3. Scheduling conditions. ........................................................................................................... 93 Table 4. Overview of the Research Methods. ................................................................................. 104 Table 5. Pre-intervention performance ............................................................................................ 119 Table 6. Comparison of operational indicators 2009-2011. .......................................................... 138 Table 7. Replenishment principles applied to service. ................................................................... 163
vii
DEFINITION OF CONCEPTS
5FS
Five Focusing Steps. “A systematic 5-step approach used to continually improve a system’s ability to obtain goal units” (Sullivan et al. 2007, p.24).
Caregiver
A joint denotation for field staff providing home care. A more comprehensive explanation is provided in Section 4.1.1.
Conformance
“An affirmative indication or judgement that a product or service has met the requirements of a relevant specification, contract or regulation.” (Blackstone 2010b, p.26).
Constraint
“Any element or factor that prevents a system from reaching a higher level of performance with respect to its goal. Constraints can be physical, such as a machine center or lack of material, but they can also be managerial, such as policy or procedure.” (Blackstone 2010b, p.27).
CLR
Categories of Legitimate Reservation. “The rules for scrutinizing the validity and logical soundness of thinking process logic diagrams” (Sullivan et al. 2007, p.8).
CRD
Conflict Resolution Diagram. Syn: Evaporating Cloud (EC). “A necessity-based logic diagram that describes and helps resolve conflicts in a “win-win” manner.” (Sullivan et al. 2007, p.21).
CRT
Current Reality Tree. “A thinking process sufficiencybased logic diagram […] that illustrates the cause-effect relationships that exist between the core problem and
viii
Definition of Concepts
most, if not all, of the undesirable effects (UDEs)” (Sullivan et al. 2007, p.16) Cycle time
“The time between the completion of two discrete units of production. For example, the cycle time of motors assembled at a rate of 120 per hour would be 30 seconds.” (Blackstone 2010b, p.36).
EC
Evaporating Cloud. Syn: Conflict Resolution Diagram (CRD)
ECE
Effect-Cause-Effect. “A method used to validate the existence of a cause-effect relationship for which the existence of the proposed cause is not easily provable through direct observation. This is done by proving the existence of a second effect that could only be present if the proposed cause actually exists.” (Sullivan et al. 2007, p.19).
Efficiency
The “actual output over rated output” (Blackstone 2001, p.1055). Maximizing the efficiency of a production step means increasing actual output as close to the maximum level (rated level) as possible.
EHC
Espoo Home Care
FRT
Future
Reality
Tree.
“A
thinking
processes
sufficiency-based logic tool that facilitates answering the second question in the change sequence, namely, To what to change? The FRT presents a sequence of causeeffect relationships that links the injections(s) to the desired effects (DEs)” (Sullivan et al. 2007, p.25). Foreman
Leader of home care teams. The foremen are typically registered nurses or social workers, who mainly work out of the office. The exception is evaluation visits, during which the customers’ needs are assessed and care plans are defined.
Institutional Care
Largely provided in primary care hospitals; customers are typically bed-ridden and receive 24-hour care.
ix
Definition of Concepts
Inventory
1) In TOC: “all the money currently tied up in the system[…]it refers to the equipment, fixtures, buildings, and so forth that the system owns – as well as inventory in the form of raw materials, work-in-process, and finished goods”. 2) Conventional OM definition: “those stocks or items used to support production (raw materials and work-in-process), supporting activities (maintenance, repair, and operating supplies), and customer service (finished goods and spare parts).” (Blackstone 2010b, p.73). 3) In TOC for services the definition of throughput varies, depending on the context.
Lead time
“A span of time required to perform a process (or series of operations.” (Blackstone 2010b, p.78)
Lean
Lean production. “A philosophy of production that emphasizes the minimization of the amount of all the resources (including time) used in the various activities of the enterprise. It involves indentifying and eliminating
non-value-adding
activities
in
design,
production, supply chain management, and dealing with customers[…]It contains a set of principles and practices to reduce cost through the relentless removal of waste and through the simplification of all manufacturing and support processes.” (Blackstone 2010b, p.78). MS
Management Science
OE
Operating Expense. “All the money a system spends in order to turn inventory into throughput. This definition of operating expense includes not just direct labor [wages and salaries], but also management, computers…” (Goldratt & Fox 1986, p. 28), equipment, utilities, inventory carrying costs and rents. Note that in TOC, inventory is reported as the costs of raw materials; the costs of carrying inventory are considered an
operating
expense.
This
differs
from
the
conventional approach of “reporting inventory on the x
Definition of Concepts
balance sheet as an asset valued at cost of raw material plus value added – the labor and overhead used to produce the inventory” (Gupta & Boyd 2008, p.996). Output
“The product [or service] being completed by a process [person] or facility” (Blackstone 2010b, p.103).
OM
Operations Management
OR
Operations Research
POOGI
Process of Ongoing Improvement. TOC’s process for continuously improving a system’s performance relative to its goal. POOGI consists of two prerequisite steps (1. define the goal, and 2. define performance measures) and the 5FS (Watson et al. 2007).
Productivity
“An overall measure of the ability to produce a good or a service. It is the actual output of production compared to the actual input of resources. Productivity is a relative measure across time or against common entities (labor, capital etc.)” (Blackstone 2010b, p.118). In this dissertation productivity improvement is defined as the ability to either 1) provide the same level of qualityadjusted services with fewer resources, or, 2) to provide more quality-adjusted services with the current (or fewer) resources. The latter option presumes that demand for services increases, or alternatively, that services previously outsourced to private providers can be incorporated into the public service system, without incurring additional fixed costs or losses in the service quality.
Productive Capacity “Resource capacity that is required to produce output sufficient to satisfy the demand of the constraint” (Sullivan et al. 2007, p.39). Protective Capacity “Controlled excess capacity aimed at protecting the undisturbed flow of service transactions [or production] through the organization” (Ronen & Pass 2010, p.851).
xi
Definition of Concepts
Service
“The
application
of
specialized
competencies
(knowledge and skills), through deeds, processes, and performances for the benefit of another entity or the entity itself” (Lusch & Vargo 2006, p.ix). Service Home
Also known as sheltered housing. Service homes refer to a form of care where customers rent an apartment in a service home, which provides 24-hour access to service.
System
“A regularly interacting or independent group of items forming a unified whole toward the achievement of a goal.” (Blackstone 2010b, p.148). Following Blackstone (2001), in this dissertation ‘system’ means “a business” (p.1053) or an organization (e.g., home care).
Throughput
“The rate at which the system generates ‘goal units’. Because throughput is a rate, it is always expressed for a given time period – such as per month, week, day, or even minute. If the goal units are money, throughput will be an amount of money per time period. In that case, throughput is calculated as revenues received minus totally variable costs divided for the chosen period.” (Blackstone 2010b, p.151).
TOC
Theory of Constraints. “A holistic management philosophy[…]that is based on the principle of inherent simplicity. Even a very complex system comprising thousands of people and pieces of equipment can have, at any given time, only a very, very small number of variables – perhaps only one, known as a constraint – that actually limit the ability to generate more of the system’s goal” (Blackstone 2010b, p.151). Following Ricketts 2007), TOCG refers to its use in the manufacturing and distribution of goods, while TOCS refers to its use in services.
TP
Thinking Process. “A set of logic tools that can be used independently or in combination to address the three questions in the change sequence, namely, 1. What
xii
Definition of Concepts
to change? 2. To what to change? and, 3. How to cause the change?” (Sullivan et al. 2007, p.46) Utilization
“1) A measure (usually expressed as a percentage) of how intensively a resource is being used to produce a good or service. Utilization compares actual time used to available time. Traditionally, utilization is the ratio of direct time charged (run time plus setup time) to the clock time available. Utilization is a percentage between 0 percent and 100 percent that is equal to 100 percent minus the percentage lost due to the unavailability of machines, tools, workers, and so forth”.” 2) In the theory of constraints, activation of a resource that productively contributes to reaching the goal. Overactivation [i.e., unnecessarily high utilization of a nonconstraint] does not productively utilize a resource.” (Blackstone 2010b, p.158)
Value
Something that benefits a stakeholder participating in or affected by a service, such as the customer (e.g., improved health, reduced inconvenience) or the provider (e.g., improved information access, reduced inventory or operating expense, increased throughput etc.). In OM, the value-added by each production step in a process is its contribution to the final usefulness of a product (or service), from the perspective of the customer (Blackstone 2010b, p. 158).
xiii
PREFACE
Over the last few years, many people have asked me: “Why Theory of Constraints (TOC)? Why not some more conventional Operations Management (OM) approach, or some other management philosophy?”. To refrain from a lengthy answer, my response has often been: “Why not?”. Since this answer rarely seems to be satisfactory (and perhaps justifiably so), I would like to take a moment to briefly elaborate on my choice of TOC. By chance, I was lying by the pool while on vacation in southern Spain, reading one of the early works on TOC, when somehow something “clicked”. The clear-cut logic of TOC seemed to provide a perspective that other OM approaches appeared to lack. I had previously been engaged in Healthcare Operations Management research, primarily working in specialized healthcare, in a large hospital district in Finland. One thing I had noticed was that there seemed to be an almost endless list of issues that need to be improved, at least from an OM perspective. Customer-induced (or patient-induced) variability is significant, and the ‘processing times’ of individual patients may in many cases be highly stochastic. Originating in manufacturing, most OM approaches would prefer to standardize every part of the process in the pursuit of a swift, even flow of patients through the system. While this may be possible in a ‘closed system’, such as manufacturing, it is much more difficult, or even impossible, in an ‘open system’, such as a hospital. Conventional OM wisdom would also have us manage and control every part of a process, for instance, by promoting high efficiency in every production step or resource. The assumption is that local improvements can be ‘glued together’, ultimately resulting in better performance of the system as a whole. While the list of things to improve may be endless, the time and resources available for improvement efforts are typically limited. It does not take much practical experience to realize that, for fear of wasting scarce resources, the improvement initiatives are often directed towards ‘low hanging fruit’ (i.e., xiv
Preface
‘quick wins’), or ‘fire fighting’. As a result, few organizational improvement efforts have a marked impact on the system’s ability to treat patients, or serve customers. The advantage of TOC, as I see it, is that it focuses the improvement efforts on the few issues that can have a real impact. TOC tells us that we should focus on improving, and managing our systems around, the few things that matter the most: the constraints. To me, this seems like an approach that shows promise and could be well suited to the open-system nature of health services, where not everything can be standardized and controlled.
xv
1 INTRODUCTION
Most health service providers cry out for additional capacity to cope with increasing, even escalating, demand. Many times their cries are justified. Often, however, the perceived lack of capacity is merely a consequence of poor management practices, such as a mismatch between capacity and demand (e.g., Silvester et al. 2004). The Hippocratic Oath and healthcare professionals’ natural passion for providing each and every patient or customer with the best possible care have focused the research and development efforts of the health service community towards improving the medical quality of the services. Sometimes this has been at the expense of developing the service production system, its processes, and the managerial practices needed to make the most of available resources. After all, this is required in order to provide a growing number of customers with the best available care. Home care is no different. In recent years there has been a polemic in the mainstream media in Finland about the scarcity of resources devoted to the home care of the elderly. Quite often, articles citing caregivers, tell tales about how overworked the staff are, and the hastiness they are subject to. But the numbers tell a different story. Productivity in home care is typically low. This dissertation is founded on the belief that the perceived lack of capacity is due to poor management practice, and that, at least in part, it can be solved by adopting and developing Operations Management (OM) principles for this particular context in order to unleash the capacity trapped by inappropriate operational practices.
1.1
EMPIRICAL BACKGROUND
“Home Care is a growing sector in the healthcare domain” (Chahed et al. 2009). The trend is triggered by several factors, such as an aging population, chronic pathologies, and medical and technological advances, as well as unremitting pressure to contain healthcare costs. In addition, the current 1
Ch haptter 1 Intr I rodu uctiion
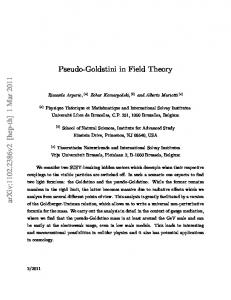
so ocietal in nclin natiion iss to o eenaablee peop p ple with w reeduucedd phy p ysicaal or ment m tal auuton nom my to rem maiin livin l ng in theeir ho omees. Accorrdin ng to thee quualiitattivee annd quuanttitaativee serv s vicee stru s uctuure tarrgets forr 2012 2 2, stip pulated by b th he N Naationnal Frram mewoork for f Hig igh-Q Quaalityy Seervicces ffor Oldder Peop P ple (M Ministryy off So ociaal Affa A fairss annd Heealtth 220008),, 911-922% % off th he F Finnish h pop p pulaation o oveer 75 7 year y rs of o age a e sh houuld “liive at ho omee in ndep pen ndentlyy o or usin u ng app a prop priaate health h an nd weelfare servvices graantted by asssesssingg th heirr ovveraall nee n eds””. The T e guuideelin ne ffurttherrmo ore staatess thhat 133-144% off th his age a e grrouup ssho ouldd reeceiive reggulaar hhom me care. Th his imp pliees aan inccreasee in thee coveeragge o of hhom me carre, fro om 11..5% % of th he spe s ecifiied age grou g up in 2005. n 20009, th he Finn F nish h popu p ulation n agged d 755 an nd oveer w wass prrojeecteed to t incr i reasse bby In 100.1% %b by 202 2 20, 14. 1 5% % byy 200300, an nd 16..5% % byy 220400,1 respecctivvelyy. At A th he sam s me tim me, th he dem d moggrap phicc depeenddenccy ratiio, thaat iss, tthe nuumb ber off ch hildrren n annd eld derlly perr 100 peerso ons off wor w kin ng age a e (i.e., agged 155-644), is prrojeecteed tto inccreasee co onsiiderrably (Fig ( g. 11), rreduucin ng thee reelatiive nuumbber of taxxpayyers in n ouur so ociety. Th he sim s multaneeouus ddecrrease in i the t e workkingg popuulattion n and inccreaasinng caare aandd seerviice exp pen nditturee po osee fu undiingg ch halleengges forr th he servvicee syystem m oof a weelfarre staate (R Rintaala ett all. 22010). As A a cconnseqquen ncee, “th “ e scar s rcitty oof d th he neeed to pro oduuce ‘m moree with w lesss’ is aan eveer-p pressen nt reealiity ressouurcees, and Eklund for healtthcaree orrgan nizaatio ons”” (E d 200088). 80 73
75
69.7
70
65.4
65 59.1
60 55
51.6
50 45 40 35 30 2010
2015
2020
2025
2030
Thee pro hic dep pend umb ber of o perso p ons belo Fig guree 1. T ojeccted dem mog graph denccy raatio2; th he nu ow tthe age a of d abo ove the agee of 64 per perssonss aged 15-64 15 and p 1100 p 1 4.
me ccaree is a stat whiich seeeks to ennablle p peo Ho om s tuto ory serrvicce w oplee to o livve ssafeely in wn ho heir heealtth and of aauto their ow omees, even as th a d leeveel o ono omyy dete d erio oratte. 1 2
2
onaal Instituute for Wellfaare: SottkaN Natio N f Heaalth andd W NET T (20099) Wellfaare: SottkaN n 26 N onaal Instituute for Natio f Heaalth andd W NET T (acccesssedd Jan 6th, 2011 2 1)
Empirical Background
Home care refers to the combination of home nursing and home services. In Finland, the content of home care is governed by the Law3 and Statute4 of Social Welfare (home services), as well as the Law of Public Health5 (home nursing) (Sinkkonen et al. 2001; Tepponen 2009). Home nursing refers to primary health care outpatient services, such as blood pressure and blood sugar measurement, the administration of medication into dispensers, and the removal of stitches (Rintala et al. 2010). Home services are divided into domestic aid and support services. Domestic aid means assisting an individual and her family in their home, as well as providing personal care and support. Support services, on the other hand, include meal, dressing, cleaning, safety, maintenance, bathing, and transportation services, as well as services that further social interaction (Rintala et al. 2010). In Finland, home nursing and home services are combined into home care in approximately half of the municipalities (Tepponen 2009). According to Rintala et al. (2010), the consolidation of home nursing and home services into home care is an example of a contentual and structural renewal of the service system, through which a solution to the growing need and costs of services for the elderly has been sought. They further note that home care is supposed to constitute an alternative to long-term care by offering round-the-clock services. The idea is that this would allow a reduction in residential home and institutional care. Instead of moving an individual from one form of care to the next as their level of autonomy and health deteriorates, the services are brought to the individual (Voutilainen et al. 2008). It stands to reason that this development will further increase the load on home care. The practical research problem addressed in this dissertation is how to improve the productivity of home care. It is based on the notion that, even in the absence of increasing demand, the economic sustainability of our welfare services requires the productivity of all services to be improved, especially those targeting the elderly (e.g., home care). In this dissertation productivity improvement is defined as the ability to either 1) provide the same level and quality of services with fewer resources, or, 2) to provide more services of the same quality with the current (or fewer) resources. The latter option presumes that demand for services increases, or alternatively, that services previously outsourced to private providers can be incorporated into the public service system, without
3
(710/1982) Law of Social Welfare (Sosiaalihuoltolaki) (607/1983) Statute of Social Welfare (Sosiaalihuoltoasetus) 5 (66/1972) Law of Public Health (Kansanterveyslaki) 4
3
Chapter 1 Introduction
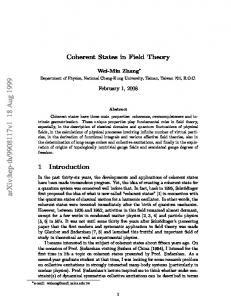
incurring additional fixed costs or losses in the service quality. One might argue that providing the same level of higher-quality (or more effective) services with the current resources is also a productivity improvement. However, the quality and effectiveness of the service are beyond the scope of this dissertation. This will be further discussed in Section 1.7. The productivity problem is analyzed through an in-depth, longitudinal study of a large Finnish public home care provider; Espoo Home Care (EHC). EHC is responsible for providing the statutory home care service in the municipality of Espoo. With a population of 244,330 inhabitants6, it is the second largest municipality in Finland. The home care operations consist of temporary and regular home care, both offered by the same organization and staff. Temporary home care is provided to customers with an interim need for a service, e.g., while recovering from an ailment (e.g., post-surgery rehabilitation). Regular home care, on the other hand, refers to continuous care. In general, the regular home care customers exit the system either by transferring to a more comprehensive form of care (e.g., sheltered housing or institutional care), or through death. Regular home care customers typically need more services than temporary ones, and therefore constitute the bulk of EHC’s services. Thus, the primary focus of this study was regular home care.
Number of Regular Home Care Customers
1700 1600 1500 1400 1300 1200 1100 1000 2001
2003
2005
2007
2008
2009
Figure 2. The number of regular home care customers in Espoo7.
Over recent years, the demand for regular home care in Espoo has increased (Fig. 2), while the resources of EHC have remained unchanged. As a 6 7
4
National Institute for Health and Wellfare: SotkaNET (2009) National Institute for Health and Wellfare: SotkaNET (2010)
Operational Context
consequence, EHC has experienced mounting pressure to make more efficient use of its principal resource, the caregivers. This development is a widespread societal challenge, as can be noticed from the publicity and attention devoted to this issue in daily newspapers. For instance, according to the director of home care in Helsinki, demand has grown by 10% in a single year, without any new caregiver vacancies being granted8. In Espoo, several attempts at solving this issue have been made during recent years (e.g., the ABC,9 CK,10 ASKO,11 KIMPPA,12 and Care Keys13 projects, as well as an organizational restructuring14). However, according to EHC’s management team and the former director of Espoo’s services for the elderly, only minor productivity improvements have been achieved.15 The study16 was initiated to identify and explain what constrains productivity in home care in order to prescribe a way of improving it. Finding a way of making more efficient use of labor in home care holds the promise of an important societal contribution.
1.2
OPERATIONAL CONTEXT
This section defines the contextual scope of this dissertation, and links it with the existing literature. First, home care is established as a field service. The definition of a field service is revised to incorporate people-centric services such as home care. Second, the operational characteristics of a field service are contrasted with those of a facility-based service and discussed from a process management perspective. 1.2.1
Field Service
According to Agnihothri et al. (2002, p.48), “service organizations can be divided into two major categories: facility and field-based”. They explain that “in a facility-based service, customers access the service facility, while in a fieldbased service, it is the responsibility of the service provider to provide a service 8
Saikkonen, M.U. ”Kotihoitajilla nyt raskas vuosi”. Helsingin Sanomat, Nov 11th, 2010. An activity-based costing analysis (2004). 10 A project focused on the allocative efficiency of resources and the quality of care (2005). 11 A project focusing on customer and resource management (2005). 12 A project seeking to improve processes through simulation (2005). 13 A project seeking to enhance the skills of the personnel. 14 The merging of home nursing and home services (2006). 15 It should be noted that the primary focus of these efforts was the quality and effectiveness of the service, with productivity improvement serving only as a secondary goal. 16 The study was a subproject of the PARETO research project (2008-2011) (Palvelujärjestelmän rakennemuutos ja uudet toiminta tavat) – Adapting Care Systems for an Aging Society – funded by the European Regional Development Fund (ERDF). 9
5
Chapter 1 Introduction
to people and/or their possessions, located at a customer’s site” (p.48). Fieldbased services can be provided either “on-site” (p.48) or remotely, for instance, using some communication platform (e.g., a phone service or web page) (Agnihothri et al. 2003; Simmons 2001). Following this definition, home care is a field-based service. The majority of the services are provided in the customer’s home by a visiting caregiver.17. Some services are provided remotely over the phone (e.g., consultations and order placements), or by handling customer errands either at the office (e.g., sorting medication and managing the provision of support services) or in proximity to the customers (e.g., picking up medication from the pharmacy). Agnihothri et al. (2002, p.48) further suggest dividing field-based services into three categories: 1) “pick-up/delivery services such as packages and mail services, and garbage collection”; 2) “emergency services such as police, fire, and ambulance, and 3) “after-sales service support of equipment such as installation, maintenance and repair”, which they refer to as a “field service” (Fig. 3).
Service
Facility-Based Service
Pick-Up/Delivery Service
Field-Based Service
Emergency Service
Field Service
Figure 3. "A categorization of services" (Agnihothri et al. 2002)
The service categorization proposed by Agnihothri et al. (2002) slightly revises the structure of the categories presented in an earlier version introduced by Simmons (2001, p.14), in which field-based services are divided into “pickup/delivery services” and “on-site customer support”. The latter is further divided into “emergency services” and “after-sales support”. According to Simmons (2001), “after-sales support of goods and services can be described as the practice of dispatching service personnel to customer locations to install equipment, perform routine or emergency maintenance, or provide on-site training” (pp.17-18); “these activities take place in three broad markets: capital 17
‘Caregiver’ is a joint denotation for staff providing home care. The caregivers’ comprise employees with different levels of qualifications, including registered nurses, practical nurses, and home aids.
6
Operational Context
equipment, such as computers, copy machines, and farm equipment; consumer goods, such as appliances and personal computers; and utilities, including telephone service, electric/gas service and cable TV” (p.18) . Simmons (2001) also refers to after-sales support as a field service. Agnihothri et al. (2002, p.49) explain that the three field-based service categories are “based on the complexity of decision making involved to manage these services” (p.49). They contend that “one of the most important performance measures for field-based services is down time, defined as the time between the request for service and the completion of service”. According to their definition, down time consists of “response time and on-site time”; “Response time is the time between the request for service and the arrival of a technician [operator] at the customer location” while “on-site time is the time spent on-site to provide the service”. The importance of response time and on-site time differs between the categories. Agnihothri et al. (2002) offer the following explanation: “For pick-up/delivery operations, response time is relatively unimportant since the service is typically scheduled in advance and on-site time is usually insignificant. For emergency service, the response time is critically important and must be carefully managed. For firms engaged in after-sales support activities[…]it is important that they manage both response time and on-site time.” (p.49)
The definition of a field service of Agnihothri et al. (2002) and Simmons (2001) appears to be in line with the literature on field service management, which seems to mainly address issues related to managing after-sales services (Agnihothri et al. 2003; Apte et al. 2007; Blumberg 1994; Fortuin & H. Martin 1999; Haugen & A. V. Hill 1999; Simmons 2001). Likewise, the APICS Dictionary (Blackstone 2010b, p. 55) defines a field service as: “The functions of installing and maintaining a product for a customer after the sale or during the lease. Field service may also include training and implementation assistance. Syn: after-sale service.”
The author holds that defining a field service as an after-sales service, with its corresponding emphasis on both response time and on-site time, arguably confines the term to covering only services that target an installed base,18 consumer goods and utilities. In such services a technician, engineer, or operator is either dispatched to a customer’s site or the service is provided remotely, e.g., over the phone. The services seek to maintain, repair, or provide 18
Ala-Risku (2009) defines “installed base” as “the set of individual pieces of equipment currently in use”. Here the term refers to equipment that is either difficult to transport or requires physical installation at the customer’s site. Examples of installed bases are manufacturing equipment, elevators, and copy machines. 7
Chapter 1 Introduction
user support for a ‘product’ bought earlier (i.e., in the customer’s possession). An after-sales and support service may be provided regularly following a predefined plan (e.g., maintenance), or as the need arises (e.g., emergency; machine breakdown). In the former case, the focus would then primarily be on minimizing on-site time, while in the latter case, responding quickly to a call and satisfying the need of the customer requires the minimization of both response time and on-site time. In neither case is the length of stay of the service provider at the customer’s site particularly important for the customer, as long as the the need is swiftly satisfied. Defining a field service as an aftersales support service therefore focuses on services that center around the customer’s possessions, and captures only poorly the essence of field services that concentrate on the customer’s person. This dissertation asserts that home care is also a field service, and that the definition of a field service should be expanded to incorporate this type of person-centric service. The focal point of home care is indeed the customer’s person. Elements of the service may target the customer’s possessions (e.g., installing aid equipment in the customer’s home), but they only serve to improve the autonomy and wellbeing of the customer’s person. As opposed to the possession-centric field services mentioned above, the time spent on-site may be essential for the customers. For instance, in home care significant efforts are put into social care for the purpose of reducing the loneliness among elderly customers. Thus, in addition to the task-centric services performed during home care visits, such as the administration of medication or bathing, the on-site time includes social support, which may be crucial to the customer’s ability to remain living at home. Minimizing on-site time under such circumstances would not be advisable. Furthermore, although some are emergency visits requiring a quick response, the bulk of the home care visits are performed on the basis of a predetermined schedule defined in each customer’s care plan (i.e., the service level agreement (SLA)). In this case, improving productivity is not about minimizing response or on-site time, but about efficiently managing the distribution of visits (i.e., matching supply with demand) and the workload of the field operators (the caregivers) (i.e., leveling service production). This is further discussed in Chapters 7 and 9. Moreover, the term ‘after-sales service’ implies that the service targets a product (or a customer’s possession) that has been sold prior to the provision of the service. This dissertation proposes defining a field service as:
8
Operational Context
A service provided for the the benefit of the customer at the customer’s site or in the field, either by a visiting field operator, or remotely, by means of telecommunication.
The author finds that this definition encompasses both possession-centric and person-centric field services. 1.2.2
Facility-Based Service Versus Field Service: A Process Perspective
This dissertation argues that, from an OM perspective, the distinction between facility and field service is particularly interesting because it changes the nature of the production flow of the service process, which may have implications for process management. To contrast the distinctive features of a field service process, an illustrative facility-based process is first analyzed.
Unit of Analysis: Production Process WIP
WIP Input
Step 1
Step 2
WIP Step 3
Step 4
Output
Flow of Customers and/or their Possessions Focus of process management: lead time, inventory, sequence, production flow (synchronized production), quality (before-after, variability) Figure 4. An example of a facility-based service process.
In many facility-based services (Fig. 4), the service process is embodied in a series of production steps (i.e., customer encounters or events) (e.g., hospitals and airports). Customers (or patients) and/or their possessions move from one production step to the next, in a manner that is akin to work-in-process (WIP) in manufacturing (Lillrank 2009). Consider, for instance, a typical process at an outpatient clinic, consisting of registration, an examination (e.g., X-ray, blood count, or vital signs) and a consultation with a physician, which, it is hoped, ends in a diagnosis and subsequent treatment scheme (output). As in manufacturing, the production steps are performed by more or less dedicated resources, each step being required to produce the final output. The flow of the customer and/or their possessions and the production process are aligned. In such an environment process management is concerned with reducing the
9
Chapter 1 Introduction
lead time and patient-in-process (PIP)19 inventory (Kujala et al. 2006) etc., in order to improve the throughput of the process and reduce costs. Conversely, in a field service, such as home care, the production flow of the service production process is represented by a caregiver’s movement between customer sites. “The literature on field service management is sparse” (Agnihothri et al. 2002, p.49). Because of the focus on after-sales services, a dominant part of the literature addresses the installation of equipment at the customer’s site, as well as emergency maintenance and repair (Agnihothri et al. 2002; Apte et al. 2007; Blumberg 1994; Simmons 2001; E. F. Watson et al. 1998). Much like facilitybased services, such field services are sequence-dependent. The process starts with a sale or an equipment failure reported by the customer, after which a field operator is dispatched to the customer’s site to install the equipment that has been purchased or to perform the repair. The process consists of several steps that have to be performed in a given order, each step playing a critical part in reaching the desired output. In this dissertation, however, the discussion is restricted to field services characterized by an ongoing relationship between the service provider and the customer, in which the same customer site is visited periodically, without the installation of equipment and not on the basis of an emergency call. In addition to home care, this is representative of a pre-emptive maintenance process of an installed base in after-sales service (i.e., post-installation maintenance). From the provider’s perspective, visits to different customers are independent,20 in that the output from a previous production step (visit) is not required as an input in the next. Instead, each visit is analogous to a discrete final output. Thus, two separate processes exist; the customer process and the service provider’s production process (or workflow), which are not aligned (Fig. 5). From an OM standpoint, the field operator’s process is the unit of analysis when productivity improvement is being sought. Here, process management is primarily concerned with improving throughput by maximizing the number of visits performed by a field operator. Since no waiting is involved (the operator arrives within a specified time window), no WIP inventory build-up occurs between production steps. Furthermore, since different production steps are
19
PIP corresponds to WIP in manufacturing. Likewise, field operators largely work independently of each other, so no synchronization between the rate at which they produce outputs is needed.
20
10
Operational Context
performed by the same resource (the caregiver), scheduling is concerned with matching the timing requirements of visits with the availability of the resource, rather than synchronizing the flow between different production steps performed by separate resources. This is discussed further in Chapter 9. The sequence of the visits is not determined by the dependence of production steps, but by the required timing of the visits combined with the feasibility of a particular operator routing.
Visit 1 Visit 1 Visit 1 Start
Output 1
Output 2
Visit 1
Visit 1 Customer 1
Visit 1 Visit 1 Visit 1
Customer 2
Visit 1 Visit 1 Visit 1 Output 3
Visit 1 Customer 3
Visit 1 Visit 1 Visit 1 Output 4
End
Visit 1 Customer 4
(visit)
Unit of Analysis: The Field Operator’s Processes Focus of process management: capacity utilization, timing of visits (time-criticality), quality (conformity to the service level agreement), routing, travel time, required skills (level of qualification), front office time of field operators (% of total time) Figure 5. An example of the production flow of a single operator in a field service process.
A Note on the Customer Process As illustrated in Figure 5, the customer process is composed of visits received by separate customers at different points in time (the past, present, and future). Since home care is repetitive, many visits to the same customer are typically involved. Following the classification scheme of different operating modes in health services by Lillrank et al. (2010), the predominant operating mode of home care is ‘care’ rather than ‘cure’. In brief, a cure mode means that a customer’s (or patient’s) ailment can be ‘cured’, in that there is a known preferable end result. The customer undergoes a sequence of steps (i.e., a process), each contributing towards reaching that intended end result (a ‘cured’ patient; full recovery). As in conventional production processes, the output of one step is the input of the next. For example, medical imaging may be needed to make the diagnosis that a bone is broken. From an OM perspective, the objective is typically to improve the flow of patients through the process, by reducing lead time and inventory, so that a preferred end result is achieved as quickly as possible, and more patients can be processed and faster (improved responsiveness).
11
Chapter 1 Introduction
According to Lillrank et al. (2010), in the care mode, patients or customers are commonly suffering from chronic ailments for which there is no ‘cure’ or predetermined end result, other than arresting the decline of the customer’s health condition and maximizing their quality of life. For this, customers need therapy or ‘care’ at regular intervals, following some form of rhythm. The rhythm may vary from several daily encounters to weekly or even monthly care sessions. Some encounters are time-critical (always in the morning), while others are not. The care sessions are often independent events; one event does not constitute an input into the next. Because of the rhythmical nature of the encounters (production steps), there is no imperative to reduce the waiting time between sessions, or the lead time of the customer process. Likewise, since the customer rarely leaves the system during his or her lifespan, and typically no waiting time is involved prior to the sessions, the reduction of ‘customer inventory’ is not relevant (Lillrank et al. 2011). In home care, the customer process is not a meaningful unit of analysis from an OM standpoint. There is very little synchronization needed between visits, and the lead time of the customer process and customer inventory are irrelevant. Each visit is largely independent and can, in principle, be performed by any caregiver with the appropriate level of qualification. That having been said, prevailing service quality guidelines insist that the number of different caregivers visiting the same customer should be minimized, to ensure continuity of care. According to the Head of EHC, the guidelines state that a customer should be visited by no more than five different individuals. (This creates a form of semi-dependency between customers and particular caregivers). It should be noted that every home care professional whom the author interviewed, or had informal discussions with, admitted that this guideline is not met in practice.
1.3
THEORETICAL APPROACH
This dissertation analyzes the home care productivity issue through the lens of the Theory of Constraints (TOC) (Goldratt 1988; Goldratt 1990b), also known as management by constraints (MBC) (Ronen & Starr 1990; Trietsch 2005) or constraints management (CM) (J. F. Cox & Spencer 1998; Ronen & Starr 1990). “TOC is a multi-faceted systems methodology that has been progressively developed to assist people and organizations to think about problems, develop breakthrough solutions and implement those solutions successfully” (Mabin & 12
Theoretical Approach
Balderstone 2003, p.569). It is “a holistic management philosophy developed by Dr. Eliyahu M. Goldratt that is based on the principle of inherent simplicity. Even a very complex system comprising thousands of people and pieces of equipment can have, at any given time, only a very, very small number of variables – perhaps only one, known as a constraint – that actually limit the ability to generate more of the system’s goal” (Blackstone 2010b, p.150) Rahman (1998, p.337) summarizes the foundational underpinnings of the Theory of Constraints (TOC) in two points. 1) Every system must have at least one (but no more than a few) constraint(s) that limit(s) its performance relative to its goal. A constraint is defined as “anything that limits a system from achieving higher performance versus its goal” (Goldratt 1990b, p.4). Without the existence of a constraint the performance of the system would be infinite. 2) The existence of constraints allows for focused system improvement. Since the constraint(s) determine(s) the performance of the system as a whole, improving the performance of the constraint(s) results directly in better performance of the entire system. Through effective management of these few key leverage points, throughput can be increased without the need to invest in additional resources. A commonly used analogy is that of a chain, whose weakest link determines its strength; only by improving the performance of its weakest link can the strength of the chain be improved. In addition to these two points, Womack & Flowers (1999, p.400) include three more “fundamental precepts of TOC”21 that are widely discussed in the literature: 3) “All systems and processes are a series of dependent events”. 4) “Constraints can be classified by their cause; most are the result of the organization’s rules, training or measures and are called policy constraints. Fewer are resource constraints and fewer still are market constraints.” 5) “Any improvement in a non-constraint resource or process step does not improve system performance.”
21
While precepts 3-5 constitute an essential part of TOC, it is debatable whether these are in fact precepts, or mere derivatives of the first two foundational underpinnings. Here they are presented for the purpose of clarification, to provide the reader with a brief insight into some central ideas and concepts of TOC. 13
Chapter 1 Introduction
Womack & Flowers (1999, p. 400) argue that “these very simple yet powerful precepts help target improvement efforts”. They continue to note that organizations often neglect these precepts by investing in improvement efforts that “only improve a subcomponent of the system and have no effect on the output of the whole system”. In this respect, TOC differs from other OM philosophies, such as Total Quality Management (TQM) (Deming 1988) and Just-in-Time (JIT) (Sugimori et al. 1977), which are both “solidly rooted in the concept that any improvement, anywhere in the process, improves the performance of the whole organization” (Motwani et al. 1996a). Jacob et al. (2009) suggests that this notion applies to Lean (Womack et al. 2007), Six Sigma (e.g., Raisinghani et al. 2005), and their combination Lean Six Sigma (LSS) as well. In spite of this, some argue that these OM philosophies and techniques are not conflicting, but rather, that they complement each other by having different strengths and by stressing different issues (Dettmer 1995; Dettmer 2001; Jacob et al. 2009; Gupta & Snyder 2009; Motwani et al. 1996a). Moss (2007) notes that “there is a mixed body of literature that suggests that TOC can be used in combination with other manufacturing techniques”. According to Schmenner & Swink (1998) and Schmenner (2001), a swift, even production flow is associated with increased productivity. LSS seeks a swift, even production flow by reducing variability and fluctuations (waste) in production, and by “balancing the line”, ensuring that each operation produces at the same rate according to tact time (e.g., Jacob et al. 2009). This approach might be effective in manufacturing or closed systems, where external variability can be minimized (Lillrank 2009; Spohrer & Kwan 2009). Healthcare, however, consists of open systems exposed to a considerable amount of customer-induced variability (Morton & Cornwell 2009). This makes it virtually impossible to eliminate all fluctuations, both in demand and within and between production steps. Therefore, the TOC approach of seeking a swift even flow (i.e., a balanced flow) by focusing only on the step that will have the greatest impact on throughput (i.e., the constraint) is an appealing tactic. Hence, the theoretical approach adopted in this dissertation is motivated by the fact that TOC “seems to be a natural fit for the resource-constrained publicly funded health systems” (Sadat 2009, p.2). TOC is composed of three branches (Lockamy & Spencer 1998; Mabin & Balderstone 2000; Spencer & Cox 1995), sometimes referred to as paradigms 14
Theoretical Approach
(Moss 2007; Rahman 1998), or elements (Inman et al. 2009). Following the categorization of (Spencer & Cox 1995), the first is the logistics branch, also known as the operations strategy tools (Mabin & Balderstone 2000)), which comprises a process of ongoing improvement (POOGI), a scheduling methodology known as drum-buffer-rope (DBR), buffer management, and VATI analysis, “used for production line design and analysis as well as distribution system design and analysis” (Spencer & Cox 1995, p.1500). The second is the performance measurement branch. It “prescribes new [global] performance measurements which are quite different from the traditional cost-accounting system” (Rahman 1998, p.337). The third branch “is a generic approach for investigating, analyzing, and solving complex problems called the thinking process (TP)” (Rahman 1998, p.337). The TP consists of “effect-cause-effect (ECE) diagramming and its components (current reality tree, future reality tree, prerequisite tree, and transition tree), the ECE audit process, the evaporating cloud methodology [also known as the conflict resolution diagram] and the five-step focusing process again” (Spencer & Cox 1995, p.1500). Over the last thirty years, the emphasis of TOC has evolved from logistics and performance measurement to the use of the thinking processes (Moss 2002). The TOC branches, and the sub-components relevant for this dissertation, are presented in Chapter 2. Mabin & Balderstone (2003, p.570) summarize the evolution and contribution of TOC: “Although conceived in the 1970s in a manufacturing context as a scheduling algorithm, TOC has now been developed into a powerful and versatile management theory, as a suite of theoretical frames, methodologies, techniques and tools. It is now a systemic problem-structuring and problemsolving methodology which can be used to develop solutions with both intuitive power and analytical rigour in any environment”.
They examine the performance of TOC through a meta-analysis of more than 80 TOC implementations, based on the quantitative data available. Their study report a reduction in cycle times by 65%, in lead times by 70%, and in inventory levels by 49%. As a consequence, the due date performance had improved by 44%, while the financial performance with respect to revenue, profit, or throughput, depending on the reported measure that was used, had increased by 76%. In a more recent study, Inman et al. (2009) investigated the relationship between the use of TOC elements, “a number of observable outcomes expected to be associated with the application of TOC, and organizational performance” (p.341). The sample in their study consists of data 15
Chapter 1 Introduction
gathered from 110 organizations “identified as TOC adopters” (p.341) using a survey. The data are analyzed using structural equation modeling. Their findings indicate that “TOC is effective in improving organizational performance” (p.341). They note, however, that “the majority of the respondents were manufacturers so the generalizability to non-manufacturers should be done with caution” (p.353). Over the last two decades “there has been a move to expand TOC to nonmanufacturing applications” (Moss 2007, p.3). Blackstone (2001, pp.1053–54) observes that “today it has been applied to a wide range of things including Operations, Finance and Measures, Projects, Distribution and Supply Chains, Marketing, Sales, Managing People, and Strategy and Tactics” (e.g., Cox et al. 1998; Boyd & Cox 1997; Boyd et al. 2001; Gupta et al. 2004; Cox & Schleier 2010). There exists a growing body of knowledge on the application of TOC in both for-profit and not-for-profit services, including the public sector. Moss (2002) names healthcare, banking, education, and military logistics as some services which have received more attention than others in the TOC literature. Several authors have called for more research on TOC in a service context (Mabin & Balderstone 2003; Moss 2007; Rahman 1998; Siha 1999). Moss (2007) studied the impact of TOC on several dimensions of service quality through a survey (N=264). She concludes: “Using responses solicited from a broad range of organizations, the use of the principles underlying the logistics and thinking process paradigms was found to lead to significantly increased customer service quality […] Service providers can increase their customer service quality by implementing TOC principles.” (Moss 2007, p.1)
“Since manufacturing and service organizations have significant differences, application of TOC principles to service organizations may require some modifications” (Siha 1999, p.257). Ronen & Pass (2010) acknowledge a lack in the body of knowledge on how to transfer TOC to services. They contend that since service operations display a much greater degree of variation in terms of structure, processes, and workflow than do manufacturing companies, there are no generic solutions to the problems that are faced. According to Ricketts (2007, p.10), “TOC has not yet[…]penetrated into all corners of the service sector because plenty of services do not sufficiently resemble industry”. In order to extend the applicability of TOC to a wide variety of services, their unique characteristics need to be indentified, and TOC adapted accordingly (Ricketts 2007). 16
Research Gap
Mabin & Balderstone (2003) underscore the need for longitudinal studies of TOC implementations, and suggest further research on TOC applications in the not-for-profit sector. They further encourage reports on the intangible effects of TOC applications. Ricketts (2010) calls for more field studies which would facilitate the investigation of TOC and “foster its adoption” (p. 875).
1.4
RESEARCH GAP
The literature on TOC in a field service context is very limited. Olson et al. (1998) report a successful application of TOC to the process of installing security equipment at a customer’s site. The field service process that they study is typical of the after-sales installation of equipment at a customer’s site (cf. installed base), and exemplifies the characteristics of a traditional process (i.e., dependent sequence of events; cf. facility-based process), even though it is performed in the field. To the best of the author’s knowledge, no application of TOC to field services featuring a process of sequentially independent production steps or repeated visits to the same customer location (e.g., industrial maintenance) has been reported in the literature. Filling this gap is an important step towards evaluating the suitability of TOC, and possibly developing it for the needs of this differing environment. Although health services are among the more prevalent fields within the literature on TOC in a service context (Ronen & Pass 2010; Moss 2002), the relative number of reported TOC applications in healthcare is low (Sadat 2009). The published literature largely concentrates on reports on improvements of facility-based service processes, particularly those inherent in a hospital environment. Except for a paper on early results from the present study (Groop et al. 2010),22 no previous literature on TOC applications in a home care context are known to the author. A plausible explanation might be the lack of reported TOC applications in a field service context. Applying TOC to this differing environment may prove vital for a more widespread adoption of TOC in field service.
22
The paper deals with the issue of health technology assessment. Although the paper is briefly reviewed in Table 2 (Section 3.2.1), the results are not incorporated into the empirical study presented in this dissertation. 17
Chapter 1 Introduction
1.5
PURPOSE
The purpose of this dissertation is twofold: 1. To examine the distinctive characteristics of field service processes, in order to review the applicability of TOC to this environement.
…and…
2. To apply TOC concepts to home care, in order to study what currently limits the productive use of resources.
The types of production processes common in manufacturing and many facility-based services arguably consitute the conventional and most familiar settings of OM. Therefore, it is only natural that TOC has focused predominantly on these environments. However, “the number of companies providing field service is increasing since companies are becoming more customer-centric” (Agnihothri et al. 2002, p.50) The effective implementation of TOC in this process-like yet very different operational context requires an understanding, of how the inherent operational differences affect the applicability of particular TOC methods and tools. For instance, as mentioned earlier, the unit of analysis in a field service is no longer a process consisting of operations performed by separate resources. Rather, the unit of analysis becomes the field operator’s process, as manifested by a set of production steps performed by the same resource. Transferring TOC into a field service context also calls for the redefinition of certain focal concepts, such as inventory. The work aspires to facilitate the adoption of TOC principles in the management of field service organizations, and home care operations in particular. Studying the mechanisms that keep home care organizations from making the most of their current resources is an important empirical contribution, with distinct managerial implications. The author hopes that this dissertation may provide practically relevant insights regarding the management of home care operations. It provides home care managers with tools to systematically increase the productivity of their organizations. In addition, the dissertation adds to the bodies of knowledge on TOC in health services and in public organizations. This dissertation uses TOC’s process of continuous improvement to identify what constrains productivity in home care through an empirical analysis of the case organization. Current challenges are recognized and effect-cause-effect 18
Research Questions
(ECE) logic is applied to distinguish the core problem(s) which cause the system constraint(s) from a myriad of conceived problems and challenges (undesirable effects; UDEs). Potential solutions (design propositions) to the core problem are then designed and implemented. The outcome of the implementation is analyzed to examine whether the design propositions have had the intended effect on system productivity, as well as to identify any unintended consequences.
1.6
RESEARCH QUESTIONS
On the basis of the purpose of this dissertation, the following two research questions were formulated: Research Question 1: How does the structure and flow of field service processes differ from facility-based service processes, and what are the implications for the applicability of TOC?
Applying TOC to home care allows an examination to be performed of how the operational characteristics of field service processes differ from facilitybased service processes, and how this might affect the applicability of certain TOC tools for managing operations. The first and perhaps most crucial step in applying TOC is to identify the system constraint. Therefore, this dissertation seeks to answer the following question: Research Question 2: What constrains the productive use of labor in public home care?
Once the constraint has been determined, one can move on to either design solutions that break or alleviate the constraint, or, alternatively, to manage the system around the constraint. This will be explained further in Chapter 2, which provides a review of TOC, its three paradigms, and some of their respective tools and methods.
1.7
SCOPE
The scope of this dissertation is restricted to field services characterized by an ongoing relationship between the service provider and the customer, in which the same customer site is visited periodically. Productivity is addressed from an OM perspective. The focus is on the ratio of output to input, i.e., the output produced by the field operators (caregivers).
19
Chapter 1 Introduction
Output is defined as the time the caregivers spend interacting with the home care customers (i.e., the caregivers’ front office time). The outcome of the home care services provided is beyond the scope of this dissertation. That is, the study does not account for the quality of the service (the internal quality of visits) or its effectiveness (health outcome). Thus, the focus here is on the system’s ability to produce more services of the same level or higher quality. Higher quality refers to the notion that increasing the time caregivers spend with their individual customers may increase the quality of the service, while reducing the duration of visits may reduce quality. The ultimate goal of any health service, in terms of quality, is to improve the health of its customers (or patients) (Kane 2006). Therefore, performance measurements in health services are commonly based on some form of health outcomes. According to Wennberg (2010), the correlation between the volume of procedures and the resulting health outcomes is not obvious, and in some cases more can be achieved with less. However, Groop et al. (2010) argue that: “the question of which volume and combination of treatments leads to the optimal [health] outcome is beyond the scope of OM. Therefore efficiency studies must be based on the assumption that a certain clinically justified level of service of a given quality is necessary, and the challenge is to produce those at the lowest (or optimal) cost”.
The choice to focus on output rather than outcome is further justified by the need to preserve practical and managerial relevance. The output that is produced can be controlled and managed by the service provider. While the output contributes to the outcome, the outcome is dependent on external factors, such as customer behavior (e.g., compliance), the natural stagnation of a customer’s health,23 placebo effects (is the service helping me?), and random events (e.g., injury) (Donabedian & Bashshur 2003). This dissertation only analyzes the services produced by the case organization’s own field service operations. Services outsourced to private providers (e.g., night time home care and home care of severly disabled individuals), or provided by the organization’s sheltered housing (e.g., rehabilitative day care), are beyond the scope of this dissertation. This will be further explained in Section 4.1.
23
Successful customer episodes of home care eventually end with the customers ‘dying in their own homes’, never requiring a transfer to a more comprehensive form of care.
20
Research Approach and Methodology
1.8
RESEARCH APPROACH AND METHODOLOGY
This section describes the philosophical research approach and the methodology used in this dissertation. 1.8.1
Research Approach
The philosophical research approach adopted in this dissertation is that of pragmatism: “Pragmatism argues that the most important determinant of the research philosophy adopted is the research question – one approach may be ‘better’ than the other for answering particular questions[…]mixed methods, both qualitative and quantitative, are possible, and possibly highly appropriate, within one study” (Saunders et al. 2007).
The pragmatic approach is motivated by the problem-solving orientation of this research. By applying TOC principles it seeks to explore what constrains productivity in home care in order to prescribe a way of improving it, and in doing so, to shed light on the operational difference encountered when transferring TOC to a field service context. In other words, this dissertation seeks to contribute instrumental knowledge for solving managerially relevant problems. With regard to management research, several authors have noted that the academic knowledge interests, such as conducting explanatory research aimed at theory-building, do not seem to coincide with the practical knowledge interests and needs of management practitioners (Denyer et al. 2008; Hill et al. 1999; Holmström et al. 2009; Meredith 1998; Van Aken 2004). According to Holmström et al. (2009), “this challenge is more fundamental than knowledge transfer, it is one of diverging interests and means of knowledge production”. Consequently, “academic management research has a serious utilization problem” (Van Aken 2004). Hill et al. (1999) argue that “the reason lies in a continuing concern over the lack of applicable results in what is a highly applied field”. Over the last 30 years there has been a call for “more practical, real world research in OM” (Hill et al. 1999). Meredith (2001) argues that OM is a pragmatic discipline and that OM research inherently addresses pragmatic challenges. Ergo, problem-oriented research is particularly important in OM to ensure practical relevance (Holmström et al. 2009). Swamidass (1991) contends that “OM research has a very distinctive focus; it is the application of
21
Chapter 1 Introduction
[OR/MS] to operations management problems in order to derive prescriptive solutions”. In reference to “a mistaken concern over research rigour” regarding practical field research, Hill et al. (1999) note: “the great majority of empirical OM work published is based on postal surveys and/or interviewing executives, where research method selection is made for reasons of practical convenience and academic expectation. Given the level of complexity involved in understanding the OM perspective of business issues then the emphasis should be placed on plant-based research.24 Conducting research on-site and investigation through the analysis of relevant data, issues, developments and events ensures relevance and validity essential to making an impact on business practice”.
This dissertation attempts to combine the academic knowledge interest with practical relevance by adopting a design science approach. Several authors (Denyer et al. 2008; Holmström et al. 2009; Van Aken 2004) have suggested that design science research (DSR) is a methodology that can help bridge theory and practice. 1.8.2
Methodology
“Design science research intends to add analysis and explanation, specifications for interventions to transform present practices and improve the effectiveness of organizations” (Denyer et al. 2008). According to Holmström et al. (2009), design science is “an approach aimed primarily at discovery and problem solving”. Design sciences, such as medicine and engineering, are “prescription-driven”, seeking to create instrumental knowledge (Holmström et al. 2009; Van Aken 2004). “Instrumental use [of knowledge] involves acting on research results in a specific and direct way” (Van Aken 2004). While the explanatory scientist typically takes on the role of an external observer, the design scientist actively engages in finding a solution to a problem. For instance, “explaining long lead times is different than taking action to reduce them” (Holmström et al. 2009). The participatory approach is further motivated by the notion that active participation in the problem-solving process (e.g., designing and testing a solution) enables unintended consequences to be identified. Design science seeks to develop “scientific knowledge to solve a class of managerial problems” (Van Aken 2004). The end product is typically a 24
By plant-based research, Hill et al. (1999) refer to empirical research methodologies, such as case studies and action research, where the researcher engages either passively or actively with the organization that is being studied.
22
Structure of the Dissertation
technological rule, defined as “a chunk of general knowledge, linking an intervention or artifact with a desired outcome or performance in a certain field of application” (Van Aken 2004). Denyer et al. (2008) favor using the term ‘design proposition’ rather than ‘technological rule’, because they find that ‘technological rule’ implies “a rather mechanistic, precise instruction”. They explain that the primal element of the design proposition is “the intervention type I, to be used in solving the kind of problem in question”. “A design proposition can be seen as offering a general template for the creation of solutions for a particular class of field problems. For validation, design propositions have to be field-tested using pragmatic validity” (Denyer et al. 2008). Denyer et al. (2008) suggest following what they refer to as ‘CIMO-logic’ (Context, Intervention, Mechanism, Outcome): “in this class of problematic Contexts, use this Intervention type to invoke these generative Mechanism(s), to deliver these Outcome(s)”. The context is the environment which the design proposition (intervention) is constructed for. The mechanism refers to the chain of events that are set in motion by the intervention. The outcome is the result of the intervention, as conveyed by the mechanism it brings about. Denyer et al. (2008) illustrate this using the following example: “If you have a project assignment for a geographically distributed team (class of contexts), use a face-to-face kick-off meeting (intervention type) to create an effective team (intended outcome) through the creation of collective task insight and commitment (generative mechanisms).”
In this research, a field service, and more specifically home care, represents the context. TOC is applied to identify the mechanism by which productivity can be improved (sought outcome) – TOC holds that identifying and improving the performance of the constraint directly translates into better system performance (Goldratt 1990b). Identifying the constraint thus enables an intervention to be designed that aspires to improve the performance of the constraint. This intervention (design proposition) then needs to be field-tested for validation.
1.9
STRUCTURE OF THE DISSERTATION
The remainder of this dissertation is structured as follows. Chapter 2 reviews the Theory of Constraints, its three branches, and their relevant tools. The focus here is on TOC’s main principles. The tools are largely described in their
23
Chapter 1 Introduction
original manufacturing and distribution contexts, for the purpose of simplification. Chapter 3 briefly examines the literature on TOC in services in order to justify the asserted research gap. The chapter points out the differences and particular issues encountered when transferring TOC to a service environment. Previously suggested modifications to the tools, performance measurements, and their inherent terminology are presented, along with the author’s interpretations. The first part of the chapter ends with an overview of reported TOC adoptions in different services, noting the modest amount of attention field services have received. The second part of Chapter 3 provides a more comprehensive review of the literature on TOC in a health service context. The review shows that home care has been given limited consideration. The chapter concludes with an analysis and discussion of the various definitions and revisions of the goal and the performance measurements that have previously been recommended for health services. Chapter 4 describes the research setting. The home care unit that was studied is presented in order to outline the characteristics of home care operations. Chapter 5 describes the research design. The focus of the chapter is on the research process and the methods used for data collection and analysis. The empirical study comprises three parts. Chapter 6 presents the findings of an ‘as-is’ analysis performed to identify constraints and core problems. Chapter 7 describes potential solutions to the core problems in the form of design propositions. These are subsequently field-tested through implementation in the home care unit that was studied. Chapter 8 describes the outcome of the ‘intervention’. Finally, Chapter 9 presents and discusses the contribution and implications of this dissertation. First, TOC is discussed in a field service context. The first research question is answered by reviewing the structural characteristics of field service processes and comparing them with ‘conventional’ production processes, which are common in both manufacturing and many facility-based services. It is argued that in a field service environment the assumption of dependent events is no longer a matter of course. The author further contends that these differences render certain production management tools of the logistics branch irrelevant for field services, while solutions originally devised 24
Structure of the Dissertation
for distribution become highly appropriate. The argument is based on the notion that field services and distribution share the challenge of matching supply with demand at various locations. Second, the findings of the empirical study are summarized in order to answer the second research question. Third, the managerial implications are reviewed. Finally, the limitations of the study are stated, and suggestions for promising topics for future research are provided.
25
2 THEORY OF CONSTRAINTS
This chapter presents TOC. The objective is to recapitulate key elements of TOC, focusing on the parts of the literature that are relevant for this dissertation. The chapter begins by examining the foundational underpinnings of TOC. These central ideas have given rise to a multitude of methodologies, techniques, or tools for translating the theory into practice. The chapter moves on to describe some of these tools, following the common categorization into three branches: logistics, performance measurement, and thinking processes.
2.1
THE FOUNDATIONAL UNDERPINNINGS OF TOC
“There is a famous story about a gentile who approached the two great Rabbis of the time and asked each, ‘Can you teach me all of Judaism in the time I can stand on one leg?’ The first Rabbi chased him out of the house, however, the second Rabbi answered: ‘Don’t do unto others what you don’t want done to you. This is all of Judaism, the rest is just derivatives. Go and learn.’ Can we do the same; can we condense all of TOC into one sentence? I think that it is possible to condense it into a single word – focus.” (Goldratt 2010, p.3) 2.1.1
Focus
Being able to focus on what matters the most has tremendous utility. As Goldratt points out, “focusing on everything is synonymous with not focusing on anything” (Goldratt 2010, p.3). This section elaborates the foundational underpinnings of TOC, explaining why focus is so important, and how the rest of TOC is merely derivatives of this notion. Although numerous authors have contributed to the the body of knowledge that today constitutes TOC (Watson et al. 2007), its originator, the Israeli physicist Dr. Eliyahu M. Goldratt, has arguably had the greatest impact on TOC’s evolution throughout its 30-year history. Therefore, it seems fitting to begin by discussing his perspective. In so doing, the author draws heavily on Goldratt’s introductory chapter (Goldratt 2010) to the Theory of Constraints 26
The Foundational Underpinnings of TOC
Handbook (Cox & Schleier 2010). It is perhaps the most comprehensive summary of the body of knowledge on TOC to date. In most systems there are several issues or problems that, if improved or corrected, can support the performance of the system. In practice, we do not have the resources, such as time and money, to address each one. The Pareto principle, or the 80/20 rule, helped distinguish the issues that had greater relevance than others, by showing that 20 percent of the constituents (e.g., efforts, sales, capital etc.) yield 80 percent of the effect. Hence, to make the most of our limited resources, we should focus on improving that which has the greatest impact on the system. However, Wilfred Pareto himself noted that the 80/20 rule is only true when no interdependencies exist between the system’s constituents. The effect (i.e., the Pareto distribution) becomes intensified with an increasing number of interdependent constituents, and the greater the variability each constituent expresses. Organizations include both a considerable number of interdependencies and variability. As a result, the system’s performance is determined by a very small number of elements. For this reason, Goldratt argues that approximately only 0.1 percent of the elements determine 99.99 percent of the system’s performance. In the vocabulary of TOC, these few key leverage points are known as constraints (Goldratt 2010). TOC holds that “every system must have at least one constraint” (Rahman 1998, p.337) that limits its performance relative to its goal. This assumption is based on the reasoning that, without the existence of a constraint, the performance of the system would be infinite (Rahman 1998). A constraint is defined as “anything that limits a system from achieving a higher performance versus its goal” (Goldratt 1988, p.453). Since the constraint(s) determine(s) the performance of the system as a whole, improving the performance of the constraint(s) directly results in better performance of the entire system (Rahman 1998). Focusing on what matters the most here means that “management of these few key points [the constraint(s)] allows for effective control of the entire system” (Watson et al. 2007, p.391). In reality, systems typically have very few constraints (Blackstone et al. 1997; Goldratt & Cox 1984; Goldratt 1990b). The conventional approach is to view constraints as being something detrimental, which should preferably be eliminated (Blackstone 2001). Contrary to this, TOC considers constraints as being neither positive nor negative; they simply are (Breen et al. 2002). What they do offer is an 27
Chapter 2 Theory of Constraints
opportunity to focus improvement efforts on what will have the greatest impact on a system’s performance (Breen et al. 2002). In other words, a constraint is a leverage point around which the rest of the system can be managed and improved (Blackstone 2001). 2.1.2
Systems Thinking
TOC views all systems as a series of dependent events or processes (Breen et al. 2002; Dettmer 1997; D. E. Womack & Flowers 1999). This means that “the performance of each event (or process) is dependent upon the previous event” (Breen et al. 2002, p.40). Consider, for instance, a manufacturing process (or a facility-based service process) where a certain production step cannot begin before the previous step is completed (Goldratt & Cox 1984; Ronen & Starr 1990), that is, the sequence is dependent. Like the weakest link of a chain, the constraint determines the throughput of the process. Breen et al. (2002) illustrate this using a generic example of a process at an outpatient clinic (Fig. 6). The series of production steps includes check-in, screening by a nurse, a meeting with a physician, a prescribed vaccination given by a nurse, and check-out. The average rate at which each step can process patients differs (the processing rate of each step is designated by its size; the processing rate is shown above). Since the constraint (the physician) determines the output, the system can only process eight patients within the given time frame. If, for some reason, the physician were only able to see six patients, the output of the entire system would fall to six, no matter how many patients the other steps could process. 17
16 14
13 8 Check-In
Screening
Physician
Vaccination
Check-Out
8
Constraint Figure 6. A simple system as a series of dependent events. The processing rate (i.e., capacity) of each step differs; the output of the system is dictated by the constraint (adapted from Breen et al. 2002).
From this follows one of the cornerstones of TOC: “an hour lost on the bottleneck is an hour lost on the entire system; an hour gained on a nonbottleneck is a mirage” (Goldratt 2010, p.4). In other words, increasing the efficiency of non-constraints does not directly translate into greater
28
The Foundational Underpinnings of TOC
throughput. It might, however, cause the bottleneck to starve,25 reducing the throughput of the system. Starvation occurs when the bottleneck runs out of items to process, i.e., it cannot be run at full capacity. This may happen when a series of dependent events is subject to another phenomenon: statistical fluctuation. In practice, fluctuations occur within almost every aspect of the process, such as the processing rate of each operation, the lead time of the process, quality etc, since “all processes have some degree of inherent variability” (Srikanth 2010, p.182). If a system were to be composed of a single operation, the statistical fluctuations would even out over time. However, in a system comprising a series of dependent events, the statistical fluctuations of each step accumulate downstream rather than leveling out (Goldratt & Cox 1984). Returning to the example above, consider a situation where the processing rate of the screening operation (prior to the bottleneck) suddenly falls from 17 to 5 patients because of several nurses simultaneously falling ill (i.e., variability). The bottleneck will now have only 5 patients to process, 3 patients less than its capacity of 8 patients. Even if the screening operation could make up for this loss by processing 11-17 patients the next day, the bottleneck could still only process 8 patients (full capacity), and thus could not make up for the previous lost throughput of 3 patients. Therefore, to ensure maximum utilization of the constraint, the non-constraints should have protective capacity that allows them to absorb disruptions occurring upstream from the constraint, before these affect the performance of the constraint. What is not a constraint is a non-constraint. Goldratt points out that it is erroneous to think of non-constraints as being non-important. Because of the interdependencies between the system’s elements, disregarding a nonconstraint can have a negative effect on the constraint, thereby reducing the system’s overall performance. “What is important to notice is that the prevailing notion that ‘more is better’ is correct only for the constraints, but is not correct for the vast majority of the system elements – the non-constraints. For the non-constraints, ‘more is better’ is correct only up to a threshold, but above this threshold, more is worse. This threshold is dictated by the interdependencies with the constraints and therefore cannot be determined by examining the non-constraints in isolation. For the non-constraints, local optimum is not equal to the global optima; more on the non-constraints does not necessarily translate to better performance of the system.” (Goldratt 2010, p.4) 25
Bottleneck starvation refers to a situation where the bottleneck operation suddenly runs out of things to process, and therefore cannot be utilized to its full capacity. 29
Chapter 2 Theory of Constraints
As such, TOC “epitomises systems thinking: a philosophy that recognizes that the whole is much greater than the sum of its parts, and that a complex web of interrelationships exist within the system” (Mabin & Balderstone 2003, p.570). 2.1.3
Different Types of Constraints
There are essentially three general types of constraints: 1) resource constraints (demand exceeds capacity), 2) policy constraints (productive capacity is limited by formal or informal rules), and 3) market constraints (capacity exceeds demand) (Watson et al. 2007). While the former two are sometimes referred to as internal constraints, the market constraint is also known as an external constraint. It is worth noting that resource constraints in particular may manifest themselves in different forms. Ronen et al. (2006) explicate the different constraints, and their sub-categories, in a health service context. They define a resource constraint (or bottleneck) as “the most heavily utilized resource such that it cannot perform all its assigned tasks” (p.51). Resource constraints may take the forms of (pp.54-56): 1. Shortage of a critical resource 2. Permanent bottlenecks 3. Peak time resource constraints 4. Seasonality [seasonal resource constraints] 5. Discrete events of resource constraints A shortage of a critical resource is a traditional bottleneck, where the demand for a particular resource, or group of resources, exceeds its capacity. Breaking the constraint by adding additional capacity may be hard, for instance because of the required training or capital investments, but it is generally feasible. A permanent bottleneck refers to a situation where adding capacity is not possible, e.g., because of short supply (e.g., the uniqueness of a particular expertise) or the high cost of a particular resource (e.g., a magnetic resonance imaging unit). A peak time resource constraint refers to a situation where the resource shortage is not constant; a resource is only a bottleneck during times of peak demand, while otherwise remaining a non-constraint (Ronen et al. 2001). A seasonal resource constraint is a form of lengthy peak time resource constraint where the increased demand varies with the season (e.g., the incidence of flu peaks during a cold winter). Discrete events of resource constraints occur as a result of unforeseen events, such as natural disasters that
30
The Foundational Underpinnings of TOC
cause emergency departments to suddenly become overcrowded (Ronen et al. 2006). In addition to bottlenecks, TOC recognizes another form of physical resource constraint known as a capacity constrained resource (CCR). It is a resource that is not yet a bottleneck, but may become one unless its capacity is managed carefully (Umble & Srikanth 1990). According to Walsh (2010), a CCR determines how much can be produced because it has less capacity than the other resources. In other words, the CCR has the least amount of protective capacity. For the sake of simplicity – and since bottlenecks and CCRs have very similar effects on the system – the remainder of this dissertation will refer to CCRs simply as bottlenecks or resource constraints. A policy constraint is a formal or informal rule, such as an operating policy, practice, or measurement, which reduces the system’s performance (Ronen et al. 2006; Mabin & Balderstone 2000) by limiting the system’s productive capacity (Watson et al. 2007). For instance, since people tend to behave according to the way in which they are measured (Goldratt 2010), a measurement that incentivizes people to seek local optima (suboptimization) rather than global optima is a policy constraint that inhibits the system from achieving its global goal. Additionally, a rule that historically may have been appropriate may turn into a constraint when the environment changes (Ronen et al. 2006). In The Goal, Goldratt & Cox (1984) provide two examples of policy constraints. The first is a decision to shut down a bottleneck operation during the daily one-hour lunch break, which translates into the whole system losing one hour’s worth of throughput. The second is the use of the measurement of efficiency to monitor performance, which promotes local rather than global optima. Ronen et al. (2006) illustrate a policy constraint in a healthcare context. When a service provider is reimbursed on the basis of patients’ length of stay, it reduces the incentive to discharge patients early. The ensuing prolonged hospital stays, in turn, may increase the incidence of hospital infections, the opposite of what the system seeks to achieve. Several authors have argued that policy constraints are the most common form of constraints, and that most resource constraints are in fact created by policy constraints (e.g., Motwani et al. 1996a; Rahman 1998).
31
Chapter 2 Theory of Constraints
There are two types of market constraints. Traditionally, a market constraint refers to a situation where the system’s capacity to provide goods or services exceeds demand. The other situation is when the output of the system is reduced as a result of the constrained availability of a needed input, such as a raw material in manufacturing. In other words, throughput is not constrained by the system’s capacity but by the external supply of required inputs. (Ronen et al. 2006) An interesting argument proposed by Schragenheim & Dettmer (2001) and Pass & Ronen (2003) is that all firms are subject to a market constraint, even those experiencing a shortage of capacity. They assert that potential demand for research and development, as well as marketing and sales, is infinite; the product or service could always be ‘better’ and more sales could always be achieved if more time was available (Pass & Ronen 2003). Ronen & Spector (1992) and Ronen et al. (2006) further argue the existence of a fourth type of constraint: a dummy constraint. It is an internal resource constraint where the cost of the throughput-impeding bottleneck resource is marginal. Thus, following the traditional TOC terminology a dummy constraint can also be viewed as a policy constraint (Ronen & Spector 1992). Ronen et al. (2006) provide an example from a hospital context, where the constraint is the operating room. Realizing that the utilization of the operating room’s cleaning staff was low, the management decided to cut costs by reducing the number of cleaning personnel per shift from two to one. This prolonged the time it took to clean the operating room between surgeries, reducing the utilization of the bottleneck, reducing throughput, the cost of which was much greater than the savings. The example above also demonstrates a case of the efficiencies syndrome (Ronen 1992): a state where the urge to increase the efficiency of all production steps, “emphasizing the utilization of inputs instead of focusing on outputs” (Ronen et al. 2006, p.144), lowers the efficiency of the whole system. Increasing the utilization of non-constrained production steps does not increase system output, but may cause suboptimization, increasing WIP and thus hampering the production flow, reducing output while increasing operating expenses (Goldratt & Fox 1986; Ronen & Starr 1990; Ronen 1992). In summarizing systems thinking and the effect of constraints, Breen et al. (2002, p.42) state:
32
TOC’s Three Branches
“If a system is doing well, not more than one of its components will be. If all links in the chain are performing well, the system will not be. To operate within this conceptual framework requires synchronization across the links of the chain, i.e., resources, departments, and so forth, as well as a new set of performance measures”.
2.2
TOC’S THREE BRANCHES
The TOC body of knowledge can be categorized into three branches (Lockamy & Spencer 1998; Mabin & Balderstone 2000; Spencer & Cox 1995): 1. Logistics 2. Performance measurement 3. Thinking processes The logistics branch, sometimes referred to as TOC’s operations strategy tools (Mabin & Balderstone 2000), consists of what is perhaps the foremost working principle of TOC, the process of ongoing improvement (POOGI), as well as a suite of tools and methodologies for transferring TOC’s underlying ideas into a variety of operational contexts, such as production (e.g., DBR and buffer management), distribution (replenishment), and projects (critical chain). As TOC was originally conceived in a manufacturing environment, the tools associated with production management constitute some of TOC’s earliest developments. The performance measurement branch arose from the realization that traditional cost accounting measurements encourage local rather than global optima, for instance by promoting high efficiency at every step of production (cf. the efficiencies syndrome) (Goldratt & Cox 1984; Goldratt & Fox 1986). TOC prescribes a set of global measurements that monitor the system’s ability to reach its global goal. “The motivation for this is that if a system as a whole is to achieve its goal, it is best for the system’s individual parts to work in ‘sync’ rather than at their own individual speeds” (Mabin & Balderstone 2000, p.2). The third is the thinking process (TP) branch, or TOC’s problem-solving methodology. Since the majority of the constraints are policy constraints, locating them, and consequently overcoming resistance to a required policy change, may not be easy (Goldratt 1990b; Motwani et al. 1996a). Acknowledging this, Goldratt (1990b; 1994) devised a generic set of logic tools, or problem-solving techniques, referred to as the thinking processes. Following Schragenheim & Dettmer (2000), Watson et al. (2007) argue that “the TP tools provide a rigorous and systematic means to address 33
Chapter 2 Theory of Constraints
identification and resolution of unstructured business problems related to management policies” (p.395). Similarly to POOGI, which seeks to identify and manage constraints, the TPs seek to determine the issues that hinder the system from reaching its goal. Problems that are currently experienced, referred to as undesirable effects (UDEs), are analyzed using effect-cause-effect logic in order to distinguish the underlying core problems (the disease) from their effects (symptoms) (Kim et al. 2008). The TPs help answer the three most fundamental questions any manager faces: 1) what to change? 2) what to change to? and 3) how to cause the change? (Goldratt 1990b). Over the last thirty years, the emphasis of TOC has evolved from logistics, and performance measurement, to the use of the thinking processes (Moss 2002). According to Rahman (1998), some believe that it is the TPs that will have the most enduring impact on business. Moss (2007, p.4) further holds that “it may be the TOC thinking processes and problem-solving techniques that provide the most benefit to services”. Figure 7 illustrates the three branches of TOC and their corresponding methodologies, techniques, and tools. While it is not the purpose of this dissertation to review all of them, the bolded items will briefly be described in the following three sections. For a thorough illustration of each item, as well as their application to a wide variety of functional areas and business environments, the reader is advised to refer to Cox & Schleier (2010). More references are provided in the following sections.
34
Logistics
Theory of Constraints Logistics
Performance Measurement
(Operations Strategy Tools) Process of Ongoing Improvement (POOGI)
Prerequisite Steps Five Focusing Steps (5FS) Applications Production Management
Distribution Management
Drum-Buffer-Rope (DBR) Buffer Management (BM) Batch Sizing Product Mix Algortihm VATI Analysis
Project Management
Critical Chain (CC) Replenishment (R)
Financial Measurements Net Profit (NP) Return on Investement (ROI) Cash Flow (CF)
ECE Diagrams
Thinking Processes (Problem Solving)
Audit
Current Reality Tree (CRT) Current Reality Branch (CRB) Future Reality Tree (FRT) Future Reality Branch (FRB) Negative Branch Reservation (NRB) Prerequisite Tree (PRT) Transition Tree (TT)
Throughput Accounting
Clouds Diagrams
Five Focusing Steps (5FS)(2)
Conflict Resolution Diagram (CRD) (Evaporating Cloud ) Single UDE Clouds Three Cloud Method Generic Evaporating Cloud (GEC) Core Conflict Cloud (CCC) Categories of Legitimate Reservation (CLR) Nine Layers of Resistance (NLR) Six Levels of Knowledge (SLK)
Operational Derivatives Measurements Throughput Dollar Days (TDD) Throughput (T) Inventory Dollar Days (IDD) / Inventory (I) Resource Dollars per Day (RDD) Operating Expense (OE)
Figure 7. The TOC branches and their various tools (revised and updated from Spencer & Cox (1995, p.1501) and Mabin & Balderstone (2000, p.4))
2.3
LOGISTICS
This section reviews some of the methodologies and tools of the logistics branch that are relevant for this dissertation. The section begins by describing TOC’s process of ongoing improvement. Since it constitutes the principal process for focusing improvement efforts, it is reviewed in greater detail. This is followed by a brief overview of the drum-buffer-rope (DBR) scheduling technique, buffer management (BM), and replenishment (R), the TOC solution for distribution and supply chains. 2.3.1
Process of Ongoing Improvement
Originally verbalized in Goldratt (1988; 1990b), the central working tenet of TOC is the five focusing steps (5FS), a process that focuses the continuous improvement efforts on what matters the most: the constraints (e.g., Rahman 1998). The 5FS evolved into what is now referred to as the process of ongoing improvement (POOGI) (Watson et al. 2007), in which two prerequisite steps26 are added to the 5FS (Coman & Ronen 1995; Ronen & Spector 1992; Ronen et al. 2001; Pass & Ronen 2003). The steps of POOGI are illustrated in Figure 8. 26
The prerequisite steps were first described by Goldratt & Fox (1986) and Goldratt (1990b), but Ronen & Spector (1992) and Coman & Ronen (1994; 1995) added them to the 5FS, referring to POOGI as the seven focusing steps. 35
Prerequisite steps
Chapter 2 Theory of Constraints
1. Define the system’s goal
2. Determine proper, global and simple performance measures
Five focusing steps
3. Identify the system’s constraint(s)
4. Decide how to exploit the system’s constraint(s)
5. Subordinate everything else to the above decision
6. Elevate the system constraint(s)
7. If, in the previous steps, the constraint was eliminated, go back to step three. Do not let inertia become the system’s constraint
Figure 8. The process of ongoing improvement (POOGI) (adapted from Coman & Ronen (1995, p.1406))
Below, each step is described. While numerous authors have outlined this process, which was originally developed by Goldratt (1990b), the author draws heavily on Ronen et al. (2006), who illustrate POOGI in a health service context. Step 1: Define the System’s Goal In order to determine what constrains the performance of a system relative to its goal, the goal itself must first be defined. Defining the goal is crucial “because it should guide every decision and action in the organization” (Ronen et al. 2006, p.48). The definition of the goal depends on the purpose of the system. According to Goldratt (1990a), the goal of any system should therefore be determined by its owners. The goal is something an organization strives for but can never achieve (Ronen et al. 2006). For example, in publicly traded for-profit businesses owned by shareholders, the goal is to increase shareholder value. Simply put, the goal is “to make more money now as well as in the future” (Goldratt 1990a, p.12). Conversely, in not-for-profit service organizations, Reid (2007, p.210) asserts that the goal “usually involves exceeding customer service expectations”. Still, irrespective of whether it is operating in a for-profit or not-for-profit environment, in order for an organization to achieve its goal, two necessary conditions must prevail: 36
Logistics
“organizational financial viability and a safe and secure employee work environment” (Reid 2007, p.210). Goldratt (1990a) distinguishes between the system’s goal and the necessary conditions for achieving it. The goal represents the reason for the system’s existence. The necessary conditions, on the other hand, must be met in order to improve and sustain performance versus the goal. For instance, offering quality products or services, as well as satisfying employee stakeholder groups, may be necessary or even a means for achieving the goal, but, at least in a publicly traded for-profit environment, they do not represent the purpose of a company. Goldratt (1990a, p.11) explains that “the organization should strive to meet its goal within the boundaries imposed by the power groups [e.g., owners, stakeholders], striving to fulfill its purpose without violating any of the externally imposed necessary conditions”. Schaefers et al. (2007, p.228) note that “a lot of confusion exists between the goal of a system and the necessary conditions to achieve the goal”. In a not-for-profit environment defining the goal can be less straightforward than in a for-profit business. According to Ronen et al. (2006), the goal of notfor-profit organizations should reflect their mission. “In such organizations the goal is usually determined as achieving the maximum of some measure under resource constraints (such as budget)” (Ronen et al. 2006, p.48). They also note that not-for-profit organizations may have several goals, and that the goals may be complex. For instance, Gupta & Kline (2008) describe the twofold goal of a not-for-profit healthcare provider. “The financial goal is to make the money required to run programs now and in the future while satisfying patients and providing satisfaction and security for the professional and clinical support staff now and in the future”, while “The clinical goal is to provide high-quality clinical care” (p.283). The goal of health service organizations will be further discussed in Section 3.2.2. TOC holds that the goal should be system-wide (or global) to prevent suboptimization; each constituent part of the system should promote the same goal. While it may be undesirable to define separate goals for different parts of the same organization, in practice this may be necessary in a not-for-profit environment, because of goal complexity. In such a case, it is important to ensure congruence between the local goals (e.g, those of a department) and the goal of the whole organization (Ronen et al. 2006).
37
Chapter 2 Theory of Constraints
Step 2: Determine Global Performance Measures Measuring an organization’s performance relative to its goal, and determining whether the individual actions and decisions help achieve it, requires compatible global performance measurements (Ronen et al. 2006). “The correct choice of measuring techniques, parameters, costing and control[…]is the difference between improving organizational performance, and not doing so” (Ronen & Pass 1994, p.10). Global performance measures serve to translate the goal into measurable units. “Relevant measures for a business organization are the value of the company and measures of economic value added” (Ronen et al. 2006, p.49). It is, however, often difficult to judge the impact of mid-level managerial (local) decisions on the organization’s profitability. In realizing the fallacies and shortcomings of traditional cost accounting, the TOC performance measurement system was developed to help organizations evaluate the impact of local decisions on the global goal (Gupta 2003). TOC defines a set of operational performance measurements that are relevant at the operational level, while still aligned with and promoting the global goal. The measurements are throughput (T), inventory (I), and operating expense (OE). The performance measures will be expanded in Section 2.4. Step 3: Identify the Constraint The first step of the 5FS is to identify the system’s constraint. This means determining what limits the system from achieving a higher level of performance relative to its goal. One approach to identifying the constraint is to perform a load analysis; examining the capacity utilization of the system’s resources in order to identify a possible bottleneck (Ronen et al. 2006). Scheinkopf (1999), in turn, proposes asking the question: “What, if only the system had more of, would enable it to increase its rate of goal attainment?” (p.17). Ronen & Spector (1992) suggest using a cost/utilization diagram (CUT). It expresses the load of the resources on the vertical axes and their respective costs on the vertical axes (Fig. 9), visualizing the load and the proportional cost of the resources. They note that managers many times “fail to locate the constraint because of the complex nature of the systems” (p. 2049) and assert that the CUT diagram can help solve this problem.
38
Logistics
% Utilization
100 Constraint
A
B
C
% Cost
D
E
100
Figure 9. Cost/utilization diagram (revised from Ronen & Spector (1992, p.2049))
Step 4: Exploit the Constraint Exploiting the constraint means making the most of current resources by maximizing the performance of the constraint. This entails eliminating policy and dummy constraints, and ensuring that the throughput governing resource constraint is utilized to its full potential. The constraint can be exploited in two dimensions: efficiency and effectiveness (Fig. 10). Efficiency refers to maximizing the utilization of the resource constraint by ensuring that the resource never runs out of items to process. This includes eliminating garbage time; the time the constraint is utilized working on items that do not contribute to the goal (e.g., working on defective products or administrative tasks). Effectiveness implies that, since a resource constraint cannot supply all demand, it should work on preferred items, the ones whose contribution to the goal are the greatest relative to the time consumed by the constraint. For instance, in a for-profit business, the bottleneck should work on the products or services that generate the most income per constraint minute. (Ronen et al. 2006)
39
Chapter 2 Theory of Constraints Eliminate policy and dummy constraints
Efficiency: The constraint should work 100% of the time
Effectiveness: The constraint should work on the preferred items
Constraint Exploitation
Figure 10. Exploiting a resource constraint (adapted from Pass & Ronen (2003, p.716) and Ronen et al. (2006, p.76)).
Step 5: Subordinate Everything Else to the Above Decision Once the constraint has been determined, a policy for managing the noncritical resources, the non-constraints, is needed. ‘Subordinating everything else to the above decision’ means managing the non-constraints around the constraint. The non-constraints should serve the constraint, ensuring that the constraint’s capacity is exploited to its maximum at all times. For instance, at an outpatient clinic where the physicians are the constraint, all other resources, such as nurses and clerks, should work to maximize the utilization of the physicians’ time. In other words, instead of maximizing the efficiency of each resource, the focus is on the efficiency of the constraints. This entails maintaining protective capacity in the non-constraints so that they are available to serve the constraint with additional work as needed. Additionally, to reduce inventory, the non-constraints should not supply more than the constraint can process. TOC’s technique for scheduling the non-constraints according to the processing rate of the constraint is known as drum-buffer-rope (DBR) (Goldratt & Cox 1984; Goldratt & Fox 1986) and it will be outlined in section 2.3.2. (Ronen et al. 2006) Step 6: Elevate the Constraint To elevate the constraint means increasing its capacity in order to improve the throughput of the entire system (Ronen et al. 2006). While the previous steps dealt with making the most of the current resources, which often does not require any additional infusion of capital, step 6 typically involves increasing capacity through investment (Reid 2007). In the case of an internal resource constraint, elevation implies acquiring additional equipment or manpower. Ronen et al. (2006) further suggests offloading the constraint by transferring 40
Logistics
work from the constraint to non-constraints when possible.27 Subject to an external market constraint, constraint elevation may involve marketing efforts that seek to reduce the factors that limit market demand (Reid 2007). Elevating a constraint may not be a matter of course. Ronen & Spector (1992) note that a constraint does not necessarily need to be where it currently is, and that deciding on its location is a matter of the utmost strategic importance. They suggest using a CUT diagram to resolve this issue, as it may facilitate identification of the most appropriate location for the constraint. First, an organization must decide whether the constraint should be internal or external. Ronen et al. (2006) assert that an internal bottleneck comes with the advantages of “savings in resources and control over demand and over the system” (p.115). They argue that it enables organizations to choose between orders, customers, products, and services, increasing the organization’s ability to control planning and implementation, and reducing operating costs. Then again, an internal constraint may cause an organization to forego potential business as a result of a shortfall in capacity, thus possibly losing markets to competitors. Having a market constraint (excess capacity), on the other hand, is more expensive because of the higher costs of investing in and maintaining resources. And so, this approach is more suitable for environments where the availability and costs of resources are low. According to Ronen et al. (2006), the choice to maintain an internal resource constraint may be apt if an organization has “a critical and expensive resource whose capacity is difficult to increase, that presents a strategic advantage to the organization, and is one of the core competencies” (p.115). They contend that if an organization chooses an internal constraint, the constraint should preferably be the most critical or expensive resource. Step 7: If, the constraint was eliminated, go back to step three. Do not let inertia become the system’s constraint. This final step makes the 5FS (steps 3-7) a process of ongoing improvement. Since a system is always subject to at least one constraint, if a constraint has been broken, a new constraint must have emerged somewhere else in the system. Therefore we should return to step 3 (step one of 5FS) and repeat the process, to avoid organizational inertia becoming the constraint (Goldratt 1990b). 27
The author, however, argues that it is debatable whether offloading is part of constraint exploitation (step 4) rather than constraint elevation (step 6). 41
Chapter 2 Theory of Constraints
When the capacity of a bottleneck is elevated to the point where it is no longer a constraint, it is likely that a new internal constraint will surface, or that the market becomes the constraint. This, in turn, requires new subordination practices; creating new policies or rules for managing the non-constraints according to the new constraint. “What usually happens is that within our organization, we derive from the existence of constraints, many rules […]. When a constraint is broken, it appears that we don’t bother to go back and review those rules. As a result our systems today are limited mainly by policy constraints. We very rarely find a company with a real market constraint, but rather, with devastating marketing policy constraints. We very rarely find a true bottleneck on the shop floor, we usually find production policy constraints […]. And in all the cases the policies were very logical at the time they were instituted.” (Goldratt 1990b, p.6)
POOGI will be used in concert with certain thinking processes (outlined in Section 2.5), in order to first identify what constrains the productive use of labor in home care, and consequently to propose a solution to the problem. 5FS vs. Other Continuous Improvement Approaches Reid (2007) discusses the differences and similarities between TOC and other continuous improvement philosophies and approaches. The 5FS bears some resemblance to the Plan-Do-Check/Study-Act Cycle of Deming (or Shewhart) (Deming 1986), in that both “represent an iterative approach to managing continuous improvement” (Reid 2007, pp.212–213). Nevertheless, TOC is more focused in its application than other mainstream approaches, such as total quality management (TQM), six sigma, lean, and the Toyota production system (TPS). According to Reid (2007), TQM and TPS pursue productivity and quality improvements “at any and every workstation in a process or subsystem in a system” (p.213). Dettmer (1995) notes that the underlying assumption here is that the individual results gained from improving separate system components add up to an improvement of the performance of the entire system. Likewise, lean and six sigma seek cost reductions by means of the elimination of waste and reduction of variability “at any and every point in a process or component of a system” (Reid 2007, p.213). Conversely, TOC focuses improvement endeavors on the weakest link, the constraint that is limiting the performance of the system as a whole. Again, the argument is that improving the performance of non-constraints will not bring an organization closer to its goal – “the sum of local optima is not the system optimum” (Dettmer 1995, 42
Logistics
p.81) – but can, in fact, have an adverse effect by causing the constraint to starve. As such, TOC does not replace the other continuous improvement philosophies. TOC does, however, offer a way to focus them for better end results (e.g., Jacob et al. 2009). 2.3.2
Drum-Buffer-Rope
Drum-Buffer-Rope (DBR) is the TOC technique for scheduling and managing production. In essence, it provides a way of translating the principles of the 5FS into practice; a way of scheduling and managing production according to the constraint. The literature on DBR is vast. The technique was first introduced in The Goal (Goldratt & Cox 1984), later expounded in The Race (Goldratt & Fox 1986), and thoroughly defined in several papers (e.g., Schragenheim & Ronen 1990; Gardiner et al. 1993; Umble & Srikanth 1990). More recent publications on DBR include (Belvedere & Grando 2005; Chakravorty 2001; Pass & Ronen 2003; Sadat 2009). In their extensive literature review, Mabin & Balderstone (2000) note that DBR is one of the most commonly applied components of TOC. “DBR reduces scheduling complexity by focusing attention only on critical resources, rather than all resources” (Gardiner et al. 1993, p.69). As noted earlier, TOC views every system as a chain of dependent events, a fundamental precept of DBR. Since the constraint limits the throughput of the entire system, it acts as a drum, setting the pace of production. A time buffer placed prior to the constraint protects it from running out of items to process, ensuring that the constraint remains fully utilized, even when problems (e.g., fluctuation resulting from unforeseen events) occur upstream (an hour lost at a bottleneck is an hour lost for the entire system). That is, “the buffer isolates the[…]constraint from negative effects of the rest of the system” (Siha 1999, p.256). The rope is a mechanism for the release of materials. Materials are released into production on the basis of the rate of consumption of the constraint. While the buffer works to ensure that the time on the constraint is exploited (step 4), the rope subordinates all non-constraints to the constraint (step 5). “The ‘rope’ is a mechanism to force all the parts of the system to work up to the pace dictated by the drum and no more” (Schragenheim & Ronen 1990, p.18). The ‘length’ of the rope represents the amount of inventory in the system prior to the constraint, and it is determined based on the current size of the buffer (Watson et al. 2007). “Since work-in-process inventory downstream 43
Ch haptter 2 The T eoryy off Co onsttrain nts
off the consstraaintt is neggliggiblle (H Ho opp & Sp pearrmaan 119996), the ro opee accts to keeep miinim mall an nd consttantt in nven ntoory levvelss in n th he sysstem m” (W Watsson n ett all. 200 2 07, p.33922). IIn oth her wo ordss, tthe rop pe asssurees that t t “iinveenttoryy is at thee lo oweest levvel that willl m maiintaain[[…]]con nsttrain nt perrforrmaancce aat its maxim muum”” (SSihaa 199 1 99, p.22566). “D DBR R iis in ntendeed to addreess maarkeet or o phyysiccal con nstrain nts”” (W Waatso on et e aal. 20007,, p..391). Figguree 11 illlusstraates DB BR R in n tw wo eenvviro onm men nts: 1) a pro p oducctioon prroceess witth an inttern nal resourrce co onsttrain nt (bo ottleeneeck)), and 2) a pro p oducctioon prroceess witth an a exte e ern nal ((maarkeet) con nstrrain nt.
ufferr-Ro ope con n tw wo en nvirronm Fig guree 11. Ex xam mples off Drrum m-Bu nfigu urationss in men nts (revi ( ised d froom on ett al. 20007, p.392 Waatso p 2)
ordiing to Waatso ntio onallly con Accco on et aal. ((2007)), bufffers aree co onvven c nsid dereed to t bbe hed go ood TOC C, on o thee othe eqquivvaleent to WIIP or fin nish ds in nveento ory. Inn T o er han h nd, pess off buuffe threee typ fers aree uusedd: 1) tiime bufffferss, 22) shhipppingg buf ufferrs, and a d 3)) cap apacicity rs. ““Tim he rreleeasee of raaw maaterriall byy th buf uffers me buuffeers offfsett th he pro p otecctio on oor ounnt of wo buuffeer ttime allo a owed. Th he aamo ork--in--prooceess in th he syst s tem m iss thhe he tiimee alllottted to a ccritiicall ressou ph hysiicall rep preesen ntattion n off th urcee ass meassureed bby Wattson tim me”” (W n ett all. 200077, p.3991). Tim me buuffeers ccann takke thee form off co onsttrainnt bly buffferrs. The buuffeers, spaacee buuffeers, and aasseemb T e coonsstraaint buuffer prottectts thhe s ace bufferr pllaceed after tthe co co onsttraiint fro om staarvaation. A spa onsttraiint enssures c straaintt can that thee con c keeep prroccesssingg ittem ms eveen as diisruuptionss occu o ur nstrream prottectt co ointts, wh do own m. Assem mblly b bufffers p onvverggennce po wheree on ne item ottleeneeck.. So ds inv i enttoryy is keept in co omees ffrom m a lin ne with w h a bo omee fiinishedd good ppiing buuffeer to pro man nce, an a ship p tect thhe duee date d e peerfo orm nd to t allo ow quiickker 44
Logistics
market response by delivering items in less than the lead time (Umble & Srikanth 1990). Capacity buffers come in the form of non-constraints with extra capacity, which help maintain time and shipping buffers when the process experiences fluctuations in output, e.g., as a result of machine breakdown or prolonged setups; extra capacity ensures that the nonconstraints can make up the lost time before it negatively affects the schedule (Watson et al. 2007). As mentioned earlier, according to Schmenner & Swink (1998) and Schmenner (2001) a swift, even (or balanced) production flow is associated with increased productivity. Blackstone (2010a) explains that the conventional approach to seeking a balanced flow is to balance the capacity; making sure that every operation or worker has an even load, works at the same speed, and is preferably fully utilized.28 TOC contradicts this thinking, seeking a balanced flow but unbalanced capacity; only the constraint should be fully utilized. As illustrated by Goldratt & Fox (1986), balancing capacity can be counterproductive when one is striving for a balanced production flow. The reasoning is based on the existence of two phenomena: 1) statistical fluctuation, i.e., the inevitable fluctuations inherent in each operation, and 2) dependent events, i.e., a sequence-dependent process. If capacity is balanced, the combination of these two phenomena causes fluctuations to accumulate downstream rather than level out.29 For instance, if operation A fails to process the designated amount of items, the shortage is transferred to the following operation (B). Operation B can now only process as many items at it has received, one less than its capacity, the number it is scheduled to process. In the following round, operation A manages to make up for the previous shortage by working extra hard, processing the scheduled number of items plus the additional shortage from the previous round. Operation B will only have the capacity to process its scheduled items, not the additional ones. In other words, shortages are transferred downstream while gains are not. This causes WIP to build up, prolonging lead time and disturbing the evenness of the production flow (Goldratt & Cox 1984; Goldratt & Fox 1986). If, conversely, only the
28
This is in line with the common approach of keeping every resource busy at all times (i.e., high efficiency) – “if a worker doesn’t have anything to do, let’s find him something to do” – which will lead resources to process more items than the constraint can consume, consequently increasing WIP and lead time (cf. the efficiencies syndrome). 29 Note that for a single operation the statistical fluctuations would level out over time. The dependent sequence of several consecutive operations, however, causes the fluctuations to accumulate rather than level out. 45
Chapter 2 Theory of Constraints
constraint is fully utilized and scheduled (Goldratt 1988), all other operations “have excess capacity and can keep pace” (Blackstone 2010a, p.148). As Blackstone (2010a) explains, the constraint buffer protects the throughputgoverning constraint from outages upstream. As outages occur the buffer is consumed. “If the upstream workstations have the same capacity as the constraint, the buffer can never be rebuilt and the constraint utilization becomes a function of the vagaries of outages of upstream stations” (p. 148). According to Watson et al. (2007, p.393), “rigorous testing of DBR indicates that TOC systems produce greater numbers of products while reducing inventory, manufacturing lead time, and the standard deviation of cycle time”. 2.3.3
Buffer Management
Buffer Management (BM) (Goldratt & Fox 1986) is an associated TOC technique for managing the trade-off between lead time and protection of the constraint (Watson et al. 2007). Too much protection or early release of materials increases WIP and lead time, while too little protection may cause the constraint to starve, jeopardizing throughput. “Basically, the idea behind buffer management is to monitor the inventory in front of the protected resources and compare the actual versus the planned performance” (Schragenheim & Ronen 1991, p.74). This allows potential problems to be recognized before the disturbances become critical, reducing avoidable expediting. In addition, it allows managers to identify and focus improvement efforts on the issues that cause the most disturbances in the schedule. As explained by Umble & Umble (2006), buffers are commonly divided into three time zones of equal length, a safety zone, a tracking zone, and an expedite zone (Fig. 12). The buffer is monitored by observing whether or not an item has reached its destination. Items that have not yet been received are known as ‘holes’ in the buffer. Holes in the safety zone normally do not call for action. Once the holes reach the tracking zone their progress is monitored. Some holes in the tracking zone are common and action is typically not required. If a hole reaches the expedite zone it is in danger of missing its deadline. The question is then whether expediting is required. Expediting, however, will not come as a surprise since the issue would have been noted in the tracking zone.
46
Logistics
Release Date
Safety Zone Processing Creates Inventory Penalty
Halfway Through Buffer Tracking Zone
Ideal Processing Zone
Due Date
Expedite Zone
Failure to Process Creates Throughput Penalty
Figure 12. Buffer management (modified from Blackstone et al. (1997, p.606))
While BM was initially developed in a manufacturing environment, Umble & Umble (2006) and Stratton & Knight (2010) have shown that it is applicable to health services and can bring significant performance improvements. Ricketts (2007) further develops BM for professional, scientific, and technical services (e.g., accounting and consulting). 2.3.4
Replenishment
The literature regarding the TOC solution to distribution and supply chain environments, known as replenishment (R), is scarce (Blackstone 2010a). As described by Goldratt (1994; 2008 ;2009) and Schragenheim et al. (2009), the basic idea is to let demand pull inventory through the supply chain from its source based on actual demand, instead of pushing inventory through the supply chain forecast demand. The rest of this section draws heavily on Blackstone (2010a), who summarizes the logic of replenishment in a retailing context. Retailers usually have to order an entire season’s supply of items in advance based on forecast demand. Since forecasts are constantly wrong,30 the retailer will run out of certain items (‘high-runners’) long before the season ends, while being left with excess stock of slow-moving items. Shortages are associated with the cost of lost sales, whereas excess stock must be sold at a heavily discounted price (before it becomes obsolete), reducing the margin. Moreover, storing large amounts of inventory is expensive, both in terms of storage space and the investment required. In a retail chain comprising several stores, this phenomenon manifests itself as one store experiencing shortages of a certain item and having a surplus of another, while the situation at another store may be the complete opposite (Fig. 13). In other words, the right number of items is not in the right place at
30
Schragenheim (2010, pp.266–269) provides a thorough explanation of the issues and fallacies associated with forecasting. 47
Chapter 2 Theory of Constraints
the right time, reducing sales, increasing overall inventory, ultimately impeding performance. Geographical distances may make it both slow and expensive to cross-ship items between stores in different locations afterwards when demand has materialized. = Surplus
= Shortage
Stock
+
B C
Manufacturer/ Supplier
+
+
A
B C Retailer 1
Stock
Stock
-
Warehouse 1
+
-
B C
-
A
A
C B Retailer 2
-
B C
Warehouse 2
+
Stock
-
A
Stock
Stock
+
+
B A
C Retailer 3
Stock
Increase in variation
-
A
-
B C A Retailer 4
Figure 13. Disaggregation of stock inventory increases the mismatch between demand and supply.
In brief, the TOC solution is to replenish each store frequently based on the actual demand for items during the previous delivery period. At the outset, each store only holds the maximum number of items likely to be sold during the replenishment period (buffer). Furthermore, instead of large amounts of stock being held in the individual stores, inventory is shifted from the point of sale closer to its origin. Some inventory is kept in central warehouses, while most is kept at the manufacturer. The reason lies in the mathematical fact that aggregation reduces variation (e.g., Schragenheim 2010; Ricketts 2007). The variation in demand is much lower at at a central warehouse than at individual retailers, and lower still at the manufacturer or supplier. “This phenomenon stems from the fact that fluctuations average out on the aggregated events (assuming they are independent events)” (Schragenheim 2010, p.267). Here, independent events refer to the fact that demand at one location is typically independent of the demand at another location. Ricketts (2010, p.869) notes that replenishment “is a radical departure from conventional wisdom, which says inventory levels ought to be dictated by 48
Performance Measurement
demand forecasts and infrequent shipments of large, economic order quantities”. Replenishment was born out of the realization that the core problem of distribution is reliance on far-reaching forecasts, which are always wrong. “TOC establishes flexibility instead of pushing for predictability. That is, rather than striving for more accurate forecasts over longer horizons, TOC manages buffers that anticipate predictable changes in demand or supply”. (Ricketts 2010, p.862)
In essence, replenishment is DBR applied to supply chains (Blackstone 2010a). Replenishment has the advantage of reducing inventory throughout the supply chain while increasing the availability of items at the retailer, a precondition for increasing sales. According to Blackstone (2010a), practice has shown that the increase in throughput far exceeds the additional transportation costs of more frequent shipments. In fact, “shipping large batches to save shipping costs is false economy” (Ricketts 2007, p.45). Replenishment was originally intended for distribution and supply chain management, and not as a solution for production management. The author will, however, argue later (Chapter 9) that the problem which replenishment is designed to solve is inherent in a field service context, and that replenishment may therefore be an appropriate extension to the management of field service operations. In a service context, replenishment has previously been modified and applied to so-called “professional, scientific, and technical services” (PSTS) (e.g., doctors, lawyers, and accountants) (Ricketts 2007; Ricketts 2010).
2.4
PERFORMANCE MEASUREMENT
“The productivity measures commonly used today attempt to measure local productivity without considering systemic implications. These measures encourage decisions that are counterproductive when examined systemically. As a result, western management spends huge amounts of time and energy chasing goals determined by local definitions of factor productivity, virtually guaranteeing a large number of decisions that are wrong for the organization as a whole.” (Blackstone et al. 1997, p.597)
As noted earlier, the second step of POOGI is to define simple and appropriate performance measurements. “It is widely recognized that measurement schemes and incentives drive behavior” (Umble & E. J. Umble 2006, p.1063). Since people tend to behave according to the way in which they are measured, the measurements should be designed in such a way that performing well according to the measurements actually promotes the goal 49
Chapter 2 Theory of Constraints
(Goldratt 2010). For the sake of simplification, the following section briefly explains the logic of the TOC performance measurement system from a forprofit perspective. 2.4.1
The TOC Performance Measurement System
As stated by Goldratt & Fox (1986), if the goal is to make money now and in the future, the ultimate measures of goal attainment are net profit (NP), return on investment (ROI), and cash flow (CF). Each measurement determines a different dimension of goal achievement. They explain that NP is an absolute measure of the ability to make money; ROI relates the NP gained to the size of the investment; and CF is a measure of survival (i.e., bankruptcy). When enough cash is available, CF is not important. However, if an organization does not have enough cash, nothing else matters. “While bottom-line measurements are sufficient to determine when the business is making money, they are woefully inadequate to judge the impact of specific actions on our goal” (Goldratt & Fox 1986, p.20). It may be hard for mid-level managers to assess the effect of their local decisions on NP, ROI, and CF. The bottom-line measurements therefore need to be translated into operational measurements that are relevant at the local level. These measurements, however, need to be linked to the bottom-line measurements, so that actions and decisions taken by an individual unit promote the global organizational goal (Goldratt & Fox 1986; Lockamy & Spencer 1998). Goldratt & Fox (1986) explain that the typical bridge used to guide local decision making and to measure its impact on the goal is the cost concept (e.g., assigning costs to individual products or services) and cost procedures. TOC reasons that the use of traditional cost accounting procedures “leads to misalignment and a failure to achieve the goal” (Lockamy & Spencer 1998, p.2049). Traditional cost accounting fails to create performance measurements for local use that promote the bottom-line measurements (i.e., the level of goal achievement) (Goldratt & Fox 1986). According to Spoede Budd (2010, p.346), instead, “the accounting methodologies[…]serve to confuse and obfuscate rather than enlighten”. For instance, traditional cost accounting promotes high efficiencies at each production step, since maximizing the number of units produced by each resource spreads fixed and overhead costs over more units, resulting in a lower unit cost (J. F. Cox et al. 1998; Goldratt 2010). In other words, traditional cost accounting does not acknowledge the limiting impact of a constraint. Non-constraints that constantly supply more 50
Performance Measurement
than the constraint can process will create excess WIP, prolonging lead times and increasing operating expense, and ultimately reducing performance (Goldratt & Fox 1986). In lieu of traditional cost accounting procedures, TOC introduces a set of global operational performance measurements, which translate the goal into operational language. The three basic measurements are throughput (T), inventory (I), and operating expense (OE) (Goldratt & Cox 1984). In a forprofit environment these are defined as (Goldratt & Fox 1986, p.29): Throughput – “the rate at which the system generates money through sales”31 Inventory – “all the money the system invests in purchasing things the system intends to sell” Operating Expense – “all the money the system spends in turning inventory into throughput”
Lockamy & Spencer (1998) point out how TOC’s definitions of T, I, and OE differ from their conventional definitions. Unlike the more common notion of throughput as units produced or shipments, in TOC throughput is the same as net sales; “revenues received minus totally variable costs” (Sullivan et al. 2007, p.47). TOC values inventory (raw materials, WIP, and finished goods) as the cost of (investment in) raw materials only, rather than as the cost of raw materials plus the cost accumulated from each operation (i.e., value added). Except for the investment in raw material, in TOC all costs are treated as operating expense. In other words, operating expense includes all the costs, such as direct labor and overheads, which conventionally would be allocated to inventory as it progresses through the production process. Ronen et al. (2006, p.210) explain: The reason for measuring all inventories in terms of raw materials is that all conversion costs are considered fixed operating expenses. This creates convenience and transparency in calculating and analyzing inventories. For example, an increase in the WIP inventory is obviously not from a change in the way various costs have been loaded, but, rather, from a real increase in quantities. This allows for quick corrective actions.“
“According to cost accounting, when operations produce they absorb cost into the inventory and this cost absorption is interpreted as increasing profit” (Goldratt 2010, p.4). One motivation here is that increasing the value of WIP inventory as it flows downstream (the conventional way), increases its asset value on the balance sheet. This in turn encourages each operation to produce 31
Sullivan et al. (2007, p.47) offer a more general definition of throughput: “the rate at which the system generates ‘goal units’”. 51
Ch haptter 2 The T eoryy off Co onsttrain nts
to itss fuull pot p tentiall (m morre tthan n th he bo ottleeneck can np proccesss), inccreaasin ng WIP W P, wh hilee caamo oufl flagiing its deetrim men ntall efffeccts322 on n th he ccom mpaanyy’s abil a lity to ach hievve itss go oal. TO OC C arrguues thaat n no item m, WIIP or fin nishhed go ood, helps achi a ievee thhe go oal uunttil itt is solld. Figgurre 114 illu i straatess th he rrelaationsh hip betweeen n th he o operatiion nal and a d th he b botttom mlin ne p perfformaancee meas m surrem mentts. A As deemo onsttratted byy Gold G drattt & Fox F (19866), inccreasin ng T (m mon ney co ominng in)) in ncrreasses NP NP, RO OI, an nd CF F. Red R duciing I (m mon ney invvestted in thiingss to o bee so old)) in ncreeasees R ROII an nd CF F an nd redu r ucees OE. O .I alsso h hass an n in ndirrectt im mpaact on n NP N tho t ough h itts eeffeect on T and d OE. O . Reduucinng OE E ((mo oney goin g ng out) o ) in ncreeasees N NP,, RO OI,, an nd C CF.
Ne N t Prroffit
R Retturnn on n Innveestm men nt
C Cash Flow F w
Thro T oug ghp put
IInv venttory y
Opperaatin ng Exp E pennse
Reducced leadd tim me
Red duced ccarrryin ng cossts ((e.g.., sppacee an nd pro oducct obbsolesccencce)
onal meeasu nd the t botttom nts Fig guree 14. Th he liink betw weeen th he oper o ratio urem mentts an m-line meas m urem men &33)). (reeviseed frrom m Go oldraatt & Fo ox 19986,, pp.31&
peraatio men nts can Th he op onall mea m asurrem n be b traansslateed intto staand dard d ffinaanciial ple ccalcculaatio meeasureemeentss th hrouugh h sim mp ons (e.gg., Guuptaa 200033, p.650):
32The T
neggativve efffeccts of o WIP W includee prrolonged leead time t e, reeducced resp pon nsiveenesss to o ch hangges d and, hiigheer inveentory carrryingg costs ng opeeratiing exp in maarkeet dema c s (in ncreeasin pense, whhile men red duciing cash h flo ow and a retuurn on invvestm nt), redu r uced d duue-ddate perrform man nce etc. (G Goldrratt & Fo ox 19986)). 52
Performance Measurement
According to Goldratt (1990b) and Gupta (2003), the operational measurements are applicable to any organizational level and ensure that local decisions are aligned with the global goal. 2.4.2
Prioritization of Performance Measures
TOC holds that all actions and decisions should be made on the basis of their ability to increase throughput, reduce inventory, or reduce operating expense (Lockamy & Spencer 1998). Contrary to the conventional approach of giving operating expense the highest priority (‘cost world thinking’ (CWT) (Gupta 2003, p.650)), TOC considers throughput to be the most important, inventory second, and operating expense third (Gupta 2003; Motwani 1996a). In other words, the focus is on increasing throughput rather than on cost reduction. In short, the logic is based on the notion that reducing operating expense will ultimately reduce throughput, while throughput can, in theory, be increased infinitely (Goldratt & Fox 1986). This is also known as “throughput world thinking” (TWT) (Gupta 2003, p.649). Founded on the concept of TWT, Boyd & Gupta (2004) and Gupta & Boyd (2008) establish TOC as a theory. Acknowledging the absence of a unifying theory in OM, Boyd & Gupta (2004, p.350) hold that TOC could serve as such a theory, integrating “existing theory-like principles” and “a great deal of existing OM research”. They discuss the relationships between TOC and other OM concepts (Gupta & Boyd 2008). Boyd & Gupta (2004) propose a construct, “throughput orientation”, consisting of three dimensions – organizational mindset, performance measures, and decision making/methods employed – and suggest several hypotheses for empirical testing. The main proposition is that a higher degree of throughput orientation would yield better organizational performance. Inman et al. (2009) extend and test this model in a sample of 110 organizations. While their findings do not support the “proposal that a throughput orientation leads directly to organizational performance” (p. 352), they conclude that “TOC implementation leads to improved TOC outcomes33 which, in turn, positively impacts performance at the organizational level” (p. 352).
33
TOC outcome is measured by the following variables: throughput, inventory level, operating expense, lead time, product cycle time, and due date performance (Inman et al. 2009, p.348). 53
Chapter 2 Theory of Constraints
2.4.3
Not-For-Profit Organizations
According to Dettmer (1995), not-for profit organizations may typically have reservations about TOC because of the original financial definition of throughput. He argues that throughput need not be defined in terms of money, but that it is more difficult to deal with non-financial measures. He further suggests that throughput can be defined as a measure of the product or service provided instead. The performance measures are generally discussed in the context of services in Section 3.1.2, and more specifically in the context of not-for-profit and public health systems in Section 3.2.2. The performance measures for home care are defined later in Section 4.2.3.
2.5
THINKING PROCESSES
“Any intelligent fool can make things bigger, more complex, and more violent. It takes a touch of genius – and a lot of courage – to move in the opposite direction.” – Albert Einstein
Most constraints are not physical by nature, but are, rather, managerial policies and outdated organizational practices (i.e., policy constraints) (Goldratt 1990b; Motwani 1996a; Rahman 1998). Locating them may not be a trivial task. In order to identify policy constraints and successfully implement POOGI, Goldratt (1990b;1994) and Scheinkopf (1999) developed a suite of generic problem-solving tools, known as the thinking processes (TP). They have since been developed and enhanced by numerous authors (e.g., Boyd et al. 2001; Button 1999; Button 2000; Cox et al. 2005; Davies et al. 2005; Houle & Burton-Houle 1998; Mabin et al. 2006; Mabin et al. 2001; Schragenheim & Passal 2005). The TPs “present a roadmap for discovering solutions to complex unstructured problems” (Watson et al. 2007, p.394). Because of the generic nature of the TPs, several authors have noted that the use of the TPs can be just as effective in services as in manufacturing (Coman & Ronen 1994; Dettmer 1997; Moss 2007). This section first provides an overview of the TPs; their foundations, assumptions, and rationale. This is followed by a description of the central concepts and the terminology, after which the process of constructing TP diagrams is discussed, and specific TP tools are outlined.
54
Thinking Processes
2.5.1
Overview of the TPs
The TPs are founded on the premise of systems thinking (Walker & Cox 2006). According to Dettmer (1995), systems thinking is based on four principles (p. 79): 1) “The performance of an entire system is affected by each of its components.” 2) “The parts of the system are interdependent. How one part affects the whole system depends, to some extent, on what at least one other part is doing.” 3) “If parts of a system are grouped together in any way, they form subgroups that are subject to the first two principles.” 4) “If a system is performing as well as it can, not more than one of its parts will be.”
Furthermore, based on the concept of inherent simplicity34 (Goldratt 2008), the foundational assumption is that most of the numerous problems experienced by organizations are created by one, or at most a few, underlying core problem(s). The TPs surface the core problem(s), the common root cause(s) to a myriad of seemingly disparate symptoms, referred to as undesirable effects (UDEs), which show that the system is not working as well as it could. According to Dettmer (1995, p.6), the core problems are “rarely superficially apparent”, and “they manifest themselves through a number of undesirable effects linked by a cause-and-effect network.” TOC holds that the conventional approach of engaging in improvement efforts that alleviate the symptoms (‘fire-fighting’) does not eliminate the reason for their existence, but may cause new UDEs to surface. Finding a resolution to the core problem, on the other hand, will simultaneously remove or lessen all the UDEs. A commonly used analogy comes from healthcare (Burton-Houle 2001). The process of making a diagnosis begins by observing a number of symptoms. Acknowledging the ineffectiveness of treating symptoms, clinicians use cause and effect in search of the underlying disease, the common cause of the symptoms. A treatment plan is then created (e.g., surgery), which takes into 34
According to Scheinkopf (2010), the concept of inherent simplicity can be traced as far back as to Sir Isaac Newton (1729) (Newton’s Rules of Reasoning in Philosophy), and his statement that “nature is simple and consonant with itself”. In discussing inherent simplicity Goldratt (2008, p.9) states: “The key for thinking like a true scientist is the acceptance that any real life situation, no matter how complex it initially looks, is actually, once understood, embarrassingly simple”. Scheinkopf (2010, p.730) further explains the concept of inherent simplicity as accepting “the premise that every element of a system is connected to the system via causeand-effect relationships with other elements of the system”. 55
Chapter 2 Theory of Constraints
account the uniqueness of the patient and the diagnosis, as well as other things needed (e.g., pain relief, reducing or alleviating possible side effects) to ensure that the treatment will work. Finally, the treatment plan is executed, with consideration given to the uniqueness of the circumstances (the patient’s situation). Both POOGI and TP arose from the realization that, while early works, such as the Goal (Goldratt & Cox 1984), provided solutions, what in fact was really needed was a process that would enable managers to create breakthrough solutions on their own (Goldratt 1990b). Solutions may not always be directly transferable per se. Wright & King (2006) and Wright (2010) discuss the problems associated with the sharing of best practices in a health service context. A major problem is that best practices from one provider are transferred to another, in which the core problems or constraints are different. Consequently, the transferred solution may not address the core problem, and therefore not generate the desired benefits. According to Walker & Cox (2006), the TPs provide users with the ability to (p. 139): 1) Identify the core problem of a system 2) Indentify and test a win-win solution (before implementation) 3) Create an implementation plan (that is almost foolproof) 4) Communicate the above without creating resistance
The TPs help the user answer three basic questions (Goldratt 1990b, p.20): 1) “what to change?”, 2) “what to change to?”, and 3) “how to cause the change?”. The scope of this dissertation is limited to the first two questions. The current reality tree (CRT) is used to identify the core problem, i.e., what to change (Rahman 1998). The CRT “depicts prevailing logical relationships responsible for the current, and relatively poorly performing, state of the system under study” (Reid & Cormier 2003). The core problem is typically generated by a conflict between opposing conditions, or actions, causing some form of problematic compromise to emerge. A conflict resolution diagram (CRD) is used to visualize the conflict and to surface hidden assumptions underlying the dilemma. This allows invalid assumptions to be recognized and challenged, and valid ones addressed “in a
56
Thinking Processes
manner that invalidates them, reduces their importance or impact, and allows for a resolution of the conflict” (Mabin & Davies 2010, pp.634–5). Future actions or solutions, known as injections, which resolve the conflict, are designed. These are then integrated into a future reality tree (FRT), “which demonstrates logically that the proposed changes will produce a more desirable future system state” (Reid & Cormier 2003, p.351), i.e., that the changes will eliminate the core conflict (or problem) and the resulting UDEs. In other words, the CRD and the FRT answer the second question: ‘what to change to?’. The TPs are interconnected, as the output of one tool is the input of another (Watson et al. 2007)(Fig. 15). Undesirable Outcome
Desirable Outcome
CRT
FRT
UDE
UDE
UDE
UDE
Injection
Core Problem
Injection
CRD
Core Problem
Common Goal
Underlying Assumptions
Conflict
Injection REQUIREMENTS
PREREQUISITES
Figure 15. The relationships between the CRT, CRD, and FRT (revised from Watson et al. 2007, p.395)
The remaining TPs, such as the prerequisite tree (PRT) and the transition tree (TT), help answer the third question: ‘how to cause the change?’. The focus is on change management issues, such as defining intermediate objectives, identifying potential obstacles to the realization of the objectives, producing a 57
Chapter 2 Theory of Constraints
detailed sequential implementation plan, and communicating the rationale and overcoming resistance to change (e.g., Dettmer 1998). These issues, however, are outside the scope of this dissertation. Several authors have discussed the value of the TPs. For instance, according to Mabin et al. (2006), whenever we seek a description of and solution to a problem, we implicitly engage in cause-and-effect thinking. However, they contend that this “[…] usually remains subconscious, intuitive, and thus heuristic in nature, and we may fall into traps in that thinking […]” (p. 37). They argue that the TPs can raise our level of consciousness, structuring our reasoning, and allowing for scrutiny and critiquing of our thinking. On the same note, Hunink (2001) asserts that the human brain can only grasp seven facts (plus/minus two) at any given time and that, therefore, laying out our assumptions explicitly on paper allows us to broaden our views and to consider all the pieces (the system as a whole), instead of homing in on a particular piece of the problem. The following first explains the central concepts and terminology of the TPs. Second, the process of checking the validity and logic of the cause-effect diagrams, known as the Categories of Legitimate Reservation (CLR), is outlined. This is followed by a description of the CRT, CRD, and FRT. Since the literature is well established – (Kim et al. 2008) note 114 peerreviewed papers – only the tools used in this study will be presented (i.e., CRT, CRD, and FRT). According to a recent review of the literature (1994-2009) by Mabin & Davies (2010, p.638), this constitutes one of the most frequently used combinations of TP tools. They further note that, although the TPs were designed as a complementary suite of tools, the literature suggests that the use of single tools, or a combination of two or three tools, can be very effective. A comprehensive literature review of the TPs and their methodological evolution is provided by Kim et al. (2008). A thorough, yet concise, account of the different TP tools and their cause-and-effect logic can be found in (Scheinkopf 2010). Mabin & Davies (2010) cover the TPs’ “conceptual, philosophical, and methodological foundations” (p. 660), comparing them to other problem-solving methods (e.g., OR/MS). They also discuss different variants of TPs and sequences of constructing them.
58
Thinking Processes
2.5.2
Concepts and Terminology
The TPs are composed of a logical structure of entities connected by cause and effect arrows. Scheinkopf (2010) explains that an entity describes an element of a particular situation, such as a UDE or any other prevailing condition. To preserve clarity, entities should preferably be expressed as complete yet concise sentences. Graphically represented by a rectangle, entities can be both a cause and an effect. For example, A causes B, and B in turn causes C. According to Scheinkopf (1999) and Mabin & Davies (2010), the TPs are constructed by connecting the entities using three types of “building blocks”. The first building block is sufficiency-based logic: “Could the proposed cause(s) by itself (themselves) cause the observed effect?” (Schragenheim & Passal 2005, p.100). This type of logic is used in both the CRT and the FRT. Sufficiency comes in three forms (Mabin et al. 2001), as illustrated in Table 1. Table 1. The three types of sufficiency.
Type of Sufficiency (Mabin et al. 2001, p. 172)
Graphical Representation It Reads… (Scheinkopf 2010) "Because" or 1 "A is sufficient to cause B". An arrow illustrating the "If A then B" cause-and-effect relationship between the two entities. 2 "If both A and C occur together, An elipse, or straight line, "If A and B then they will be sufficient to cause across two cause-and-effect then C" arrows. B." Two separate cause-and3 "A and B (separately) both Both arrows contribute to C, and between them effect arrows pointing to the read "because" are sufficient to cause C." same entity.
In a sense, the third form of sufficiency is a specific case of the first form; both entities are sufficient to cause the effect, but in concert they serve to magnify the effect. The second building block is necessity-based logic, used in the CRD. Necessity refers to the fact that one condition is required to achieve a particular objective: in order to have C we must have B. The third building block is represented by “a set of rules governing the logicin-use and provides a protocol for establishing and challenging the existing cause-effect thinking and logic” (Mabin & Davies 2010, p.634). Originally described by Goldratt (1994), these are referred to as the seven Categories of Legitimate Reservation (CLR). According to Mabin & Davies (2010, p.634): 59
Chapter 2 Theory of Constraints
The CLR ”[…]legitimize, depersonalize, and depoliticize any challenges to current thinking. Such rules are used to add rigor to the modeling process and to check the validity of the constructed logic relations[…]The result is a logical, structured, and rigorous process to guide managerial decisionmaking, utilizing the intuition and knowledge of those involved and invoking challenges to existing thinking using the protocols of the CLR.” 2.5.3
Categories of Legitimate Reservation
The CLR represent a set of rules for constructing and testing logical arguments (Walker & Cox 2006). They can be used to check both one’s own and others’ logic in constructing TP diagrams (Scheinkopf 2010). A so-called legitimate reservation exists if the logic that is presented does not make sense (Rahman 2002). Following Rahman (2002, p.828) and Scheinkopf (2010) the CLR are presented in Figure 16. The seven categories are divided into three levels, each one probing more deeply into the scrutiny of the logic (Scheinkopf 2010).
60
LEVEL 1
Thinking Processes
1) “Clarity: Not fully understanding the cause-and-effect relationship or the entity. Requesting an additional explanation of the causeeffect relationship or the entity.”
LEVEL 3
LEVEL 2
2) “Entity existence: Questioning the existence of the entity (cause or effect) by explaining that the cause or the effect does not actually exist.”
B A B A
3) “Causality existence: Questioning the existence of the causal link between the cause and the effect by use of IF…THEN statement; by explaining that although we agree that both A and B exist, there is no stated [apparent ]link between the stated cause and the observed effect.” 4) “Additional Cause: Explaining that an additional cause that adds to the size of the observed effect must exist. The causes magnify the size of the observed effect and neither cause by itself can totally explain the size or extent of the effect. The IF…THEN…statement is worded as follows: IF A AND C, THEN B.” 5) “Cause insufficiency: Explaining that an additional nontrivial cause must exist to explain the existence of the observed effect. If either of the hypothesized causes does not exist, then the observed effect will also not exist. IF A AND IF C, THEN B.” 6) “Tautology: Being redundant in stating the cause-effect relationship; cause is actually a recording of the effect, thus being redundant. If a tautology exists, you can state the cause as being the effect and the effect as being the cause (e.g. the arrow could point in either direction). Therefore, the cause does not lead to the effect.” 7) “Predicted effect (entity) existence: Using another effect D to show that the hypothesized cause A does not result in the initially observed effect B. On the other hand, if the original cause does not result in the additional effect, then this supports the original cause-effect relationship.” and
= Original hypothesis
and
= Legitimate reservations
B A B A
C
B A
C
B A B
D
A
Figure 16. Categories of Legitimate Reservation (slightly modified from Rahman (2002, p.828) based on Scheinkopf (2010))
2.5.4
Current Reality Tree
The CRT seeks to identify and illustrate the prevailing cause-and-effect relationships between a system’s entities (Rahman 2002). The CRT “is constructed from the top down by identifying undesirable effects (UDEs),35 35
Walker & Cox (2006) suggest interviewing involved parties to establish UDEs. 61
Chapter 2 Theory of Constraints
and depicting probable causes for those effects (effect-cause)”(p. 813). Noreen et al. (1995) provide a set of steps for constructing a CRT: 1) Indentify a list of UDEs that describe the area being analyzed. It is recommended to begin with a list of five to ten UDEs. 2) Connect one or more UDEs to other UDEs if they are causally related. Depict causeand-effect relationships with an arrow as shown in the categories of legitimate reservations (CLR). 3) Connect all other UDEs to the result of step 2. Scrutinize each [entity] and arrow along the way via the CLR. Stop when all the UDEs have been connected. 4) Read the tree from the bottom up, again scrutinizing each arrow and [entity] along the way via the CLR. Make any necessary corrections. 5) Ask yourself if the tree as a whole reflects your intuition about the area being analyzed. If not, check each arrow for additional cause reservations (CLR #4). 6) Do not hesitate to expand the tree to connect other UDEs that exist but were not included in the original UDE list. 7) Present the tree to someone or some group who will help you surface and challenge the assumptions captured within. 8) Decide that the CRT is complete. Identify the core problem or problems.
By logically deriving the cause-and-effect relationships between the elements of a situation, the CRT can be used to make sense of ill-structured problems (Walker & Cox 2006). Goldratt (1990b, p.28) argues that “common sense is the highest praise for a logical derivation, for a very clear explanation”. Identifying the core problem(s) helps avoid actions that only ‘treat’ symptoms. According to Mabin & Davies (2010), the CRT is particularly useful if the symptoms are created by policy constraints, in contrast to resource constraints. The CRT is later used in the empirical study to derive the core problems of EHC. 2.5.5
Conflict Resolution Diagram
The CRD is a tool for creating simple and practical solutions to problems. In contrast to the CRT and FRT, the CRD structure is founded on necessitybased logic.
62
Thinking Processes
According to Goldratt (1990b), the core problem is commonly related to a solution that compromises between two conflicting priorities. He states that the mere existence of a problem means that there is something that prevents or limits the achievement of an objective. In the case of a compromise, this implies that at least two requirements (necessary conditions) exist that must be met in order to achieve a common objective. He further argues that “whenever a compromise exists, there must be at least one thing that is shared by the requirements and it is in this sharing that the problem, between the requirements, exists” (p. 38). In other words, some prerequisites (actions) for satisfying the requirements exist, and the conflict arises between these prerequisites (Fig. 17). Thus, “policy constraints identified in the CRT can often be viewed as a conflict or dilemma between two opposing actions” (Mabin & Davies 2010, p.634). Objective
A. Common objective
Requirements
Prerequisites
B. A requirement for achieving the objective
D. What action is needed to fulfill requirement B?
Underlying assumptions C. A requirement for achieving the objective
Conflict D’. What (opposing) action is needed to fulfill requirement C?
Figure 17. Conflict Resolution Diagram (CRD).
Goldratt (1990b) suggests starting the process of creating a CRD by determining the objective (A) and the requirements for accomplishing it (B and C). Once these are known the prerequisite (conflicting) actions (D and D’) can be derived. Walker & Cox (2006) provide a more detailed description of this process. A solution to the problem is then sought by articulating and examining the assumptions underlying the arrows (AB, AC, BD, and CD’). According to Mabin & Davies (2010), when the assumptions are verbalized, some are often found to be weak or invalid, eliminating the conflict. They further assert that if the assumptions are found to be valid, measures can be taken to either invalidate them or diminish their significance. These solutions, actions, or 63
Chapter 2 Theory of Constraints
conditions, jointly referred to as injections, can be used to deal with the assumptions in order to resolve the conflict. The CRD is later used to derive the core problem of the organization that was studied.
64
3 TOC IN SERVICES
“TOC is best known in the manufacturing and distribution sectors where it originated, but services are the dominant sectors in mature economies and the fastest growing sectors in emerging economies. Although TOC has been applied in service enterprises, most applications thus far have been limited to services that resemble manufacturing or distribution closely enough that the same applications can be applied. Those applications tend to focus on physical constraints, which are less relevant in most service enterprises, and largely irrelevant in some.” (Ricketts 2010, p.859)
This chapter begins by summarizing the general challenges faced when applying TOC to services. Second, the TOC performance measures are discussed, focusing on inventory in different service contexts. Third, the service environments to which TOC has reportedly been applied are listed. Finally, the literature on TOC in field services is reviewed, in order to establish the research gap.
3.1
OVERVIEW OF TOC IN SERVICES
3.1.1
Issues Encountered When Transferring TOC to Services
Ronen & Pass (2010, pp.849–850) provide a list of issues encountered when transferring TOC to services, which they argue to be the reasons behind the lesser popularity of TOC in service organizations than in manufacturing. The issues include (pp. 849-50): 1) “The ‘production/manufacturing’ language”: Many TOC topics and terms seem less relevant in, or even inapplicable to, a service environment (e.g., batch size, setup, cost per unit, buffer etc.). However, Ronen & Pass (2010) assert that these issues are “highly relevant” in services as well. 2) “Lack of immediate quick wins in operations”: TOC became popular in manufacturing because it enabled significant improvements to be achieved in a fairly short period of time. “Many of the improvement areas that brought quick wins[…] have a lesser effect or are difficult to achieve in the service environment”. 65
Chapter 3 TOC in Services
3) “WIP-related problems are more difficult to resolve”: Implementing TOC in manufacturing markedly reduces WIP inventory, bringing substantial performance improvements. Reducing WIP in services may be less straightforward, particularly if the WIP is non-physical (e.g., medical claims waiting to be processed). Inventory in a home care setting will be discussed in Chapter 4. 4) “No raw materials or finished goods success stories”: Raw materials (RM) and finished goods (FG) are not prevalent in the core processes of service organizations. Therefore, the TOC methods to reduce RM and FG are inapplicable to service organizations. 5) “Bottlenecks are usually not easy to identify”: Bottlenecks are not visible in service settings, especially if WIP is “virtual”. For instance, in physical WIP there is typically a build-up in front of bottlenecks. 6) “Lack of body of knowledge (BOK) and experience on how to deal with service organizations”: While manufacturing organizations are very similar to each other, service organizations express a much higher degree of “variation in processes, structure, and workflow”. Therefore practices to improve service organizations are not generic. This dissertation seeks to further the understanding of the issues encountered when transferring TOC to a particular class of service operations: field services. 7) “Difficulties in defining the goals of not-for-profit service organizations”: In notfor-profit service organizations the successful implementation of improvement efforts is compromised by “the lack of a clear definition of the goal”. Ronen & Pass (2010, p.845) argue that “in non-profit organizations, the goal is to increase the relevant performance measures versus the organizations goal” The goal of a not-for-profit home care organization is defined in Chapter 4. 8) “For not-for-profit organizations, there are difficulties in measuring performance and TOC is perceived as a business-oriented philosophy”: Translating the goal into simple and practically relevant, yet appropriate, performance measures may be difficult. The TOC performance measurements for home care are defined in Chapter 4. In addition, whereas capacity in industry is fairly rigid as a result of the limited capacity of machinery (Motwani 1996a), Ricketts argues that in services “the capacity of every resource, including the constraint, is usually adjustable within limits”. 66
Overview of TOC in Services
Despite these difficulties, Ronen & Pass (2010) argue that there are many TOC tools, techniques, and methodologies that can be applied to services in order to achieve considerable improvements. 3.1.2
Performance Measurement in Services
Perhaps the most widely noted characteristic differentiating services from manufacturing and the distribution of goods in the TOC literature relates to the manifestation of inventory, and in some cases, the lack thereof. Siha (1999) notes that the original definition of inventory, as investment in things the company aims to sell, may not be appropriate for services. She proposes that “the identification of raw material, inventory, and throughput will facilitate the transfer of TOC to service organizations” (p. 257). Operating expense is generally considered to have the same definition, regardless of the type of service organization (Ricketts 2007, p.16). While throughput assumes the traditional definition in for-profit businesses (money generated from selling the service), in-not-for profit organizations, the definition of throughput varies depending on the goal of the organization. This is discussed in the context of health services in Section 3.2. It is widely accepted that a “service cannot be made in advance or stored as inventory” (Ronen et al. 2006, p.210). However, this does not automatically mean that no inventory-like entity exists in service organizations, but, rather, that defining it in a meaningful way may be more difficult. The greater question is: do services have something that clogs the system in a manner akin to inventory in industry, and thereby reduces the performance of the service organization? In other words, what, if reduced, will improve the performance of a service organization or the service itself? Several definitions of inventory36 have been proposed for different service settings, strengthening the argument that services display a high degree of diversity, and that TOC concepts may require modification, depending on the specific service environment that is targeted. As noted earlier, in facility-based service environments, such as hospitals, patients are akin to inventory in industry: raw material is represented by patients waiting to enter the system, while the patients undergoing treatment or
36
Some authors prefer ‘investment’ to ‘inventory’, arguing that ‘investment’ is a more apposite term in a service context, and that ‘inventory’ implies something physical, while inventory in services can be virtual. However, the author will continue to use the term ‘inventory’ to avoid misunderstandings. 67
Chapter 3 TOC in Services
waiting in line between treatments constitute WIP (e.g., Ronen et al. 2006). Correspondingly, in the insurance industry, WIP could be defined as the filed claims waiting to be or currently being processed. Ronen & Pass (2010, p.854) argue that “in service organizations, inventory is mainly a metric for the amount of WIP in the service process or in a certain department”. Ronen & Spiegler (1991) define inventory as information: raw materials are the data to be processed, WIP is data being transformed into information, and finished goods are the information being stored. Other definitions of inventory include “the unused service” (Siha 1999, p.263), such as empty seats on a plane or available rooms in a hotel, as well as the “initialized human resource capacity” in labor-intensive services (Siha 1999, p.263). The latter definition is in line with the original definition of inventory as “the money invested in things the organization aims to sell”. Service organizations “invest” in labor, which they use to deliver services that they “sell”. This inventory can be transformed into throughput, or if ‘unused’ for service delivery, perish (cf. inventory obsolescence). It is noteworthy that this definition renders inventory virtually synonymous with operating expense. This is because these types of services are typically labor-intensive – i.e, ‘resources’ are practically equivalent to ‘people’ (Ricketts 2010) – and labor consequently constitutes the bulk of the operating expense. Ricketts (2007) discusses inventory in the context of ‘professional, scientific, and technical services’ (PSTS) (e.g., consulting, accounting, law). He explains that in industry raw materials represent a buffer protecting production from variability in supply, while finished goods are a buffer protecting against variability in demand. In other words, supply and demand are disconnected through inventories. In PSTS services, on the other hand, the raw materials and finished goods inventories are combined into what Ricketts refers to as the “bench” (p. 70), comprising people “without current assignments” (p. 70). The bench is the buffer against both the supply of labor (the labor market) and demand for labor (i.e., demand for service assignments). That is, inventory is the available labor, a buffer protecting the organization from a shortage of supply. Interestingly, this means that operating expense and inventory (bench capacity) largely measure different dimensions of the same entity; labor. Defining inventory as the bench capacity implies that inventory designates the part of the labor capacity (i.e., operating expense) that is not converted into services 68
Overview of TOC in Services
(i.e., output/throughput) (Fig. 18). While operating expense is the cost of the total labor force, inventory can be measured in financial terms as the cost of the bench capacity,37 or in non-financial terms as a percentage of total capacity. Since unused labor time is perishable and cannot be stored, inventory instantly depreciates as operating expense. Operating expense (Input: total labor capacity)
Inventory (buffer time)
Output (service time)
Bench capacity
Labor on assignment
Example of ‘I’ measurements: • % of total capacity (h) • % of operating expense (€)
Throughput: the goal units achieved (e.g. money generated from selling the service, the number of customers served, or the effectiveness of the service)
Figure 18. Inventory as bench capacity.
Ricketts (2007, p.72) points out another factor distinguishing industrial inventory from that of services: “In industry, inventory literally just sits somewhere. In services, resources do not sit idly on the bench. Indeed, they are often extremely busy doing things they cannot do while on assignment, such as getting trained, mentoring other resources, developing intellectual property, and working on internal projects. Thus, while physical inventories create operating expense, a carefully managed service bench is an investment.”
In summary, inventory in services (e.g., WIP) does not translate clearly into financial measures (Gupta & Kline 2008), but in some service environments may still be an operationally relevant metric (e.g., PIP). There may, of course, be investments involved, but these are directed towards “skills, intellectual capital, assets, and service production systems” (Ricketts 2010, p.872). For accounting purposes, these investments are akin to inventory in the manufacturing of goods, in that they constitute the money invested in skills etc. that the organization needs for service delivery.
37
Note that as inventory is part of operating expense, measuring it in financial terms bears no relevance for accounting. However, it allows inventory to be measured in the same (monetary) unit as operating expense (and throughput in a for-profit environment), for the sake of comparison. 69
Chapter 3 TOC in Services
3.1.3
TOC Tools Modified for Services
The TOC tools of the logistics branch have been modified for particular service settings. Although based on the same underlying principles, contextual dissimilarities necessitate some changes to the way the tools are used. Following Ricketts (2007; 2010), this section briefly summarizes the central alterations pertaining to environments where inventory is defined as bench capacity. The tools for services are denominated by an ‘s’, whereas the original tools for the manufacturing and distribution of goods are denominated by a ‘g’. Inventory Buffers and Replenishment for Services (RS) “In the services context, inventory is not consumed in the same sense as inventory is consumed by distribution” (Ricketts 2010, p.869). Apart from the occasional exception, once inventory is shipped it rarely returns. In services, on the other hand, resources typically come back from their assignments. “Therefore RG is based on total consumption, while RS is based on net consumption, which is the difference between resources going out on assignments minus those coming back. Net consumption for a given period can therefore be positive, negative, or zero”. (p. 869)
In services, inventory buffers, or the bench, are designed to cover net consumption (Ricketts 2010). Resupply of resources is based on “incremental demand and attrition” (Ricketts 2007, p.71). For example, if five employees return from their assignments, one employee quits, and six employees are needed for new assignments, incremental demand plus attrition requires that two additional employees be hired. Much as different products are kept in separate inventories in industry, different buffers allocated to skill groups protect service organizations from shortages of various types of resources. Skill groups refer to groups of largely substitutable resources, which share specific attributes, such as education, geographical location, specialization, or language (Ricketts 2007). The buffers serve the whole organization instead of separate projects or subunits, since the aggregation of demand reduces variability (Ricketts 2010). Drum-Buffer-Rope for Services (DBRS) In DBRG, the rope signals materials release on the basis of the pace set by the constraint (the drum). This ensures that the right jobs are started at the right time (minimizing WIP), so that the constraint remains fully utilized, working on appropriate jobs as dictated by present due dates. (Ricketts 2010)
70
Overview of TOC in Services
In many services, however, the provider cannot control the release of new jobs into the process. New jobs come in the form of arrivals of service requests, which often cannot be postponed. If the service provider is bound by an SLA, yet cannot control the release of jobs into the service process, then the capacity of the service process cannot be fixed. Therefore the rope and the buffer operate differently. If the buffer protecting the constraint grows above a certain threshold level, then the rope initiates an increase in capacity that in time reduces the buffer to its ordinary range. Likewise, if the buffer decreases below a certain threshold, the rope signals a decrease in capacity until the buffer normalizes. In other words, DBRG manages buffers in operations where capacity is fixed, while DBRS manages capacity in operations where capacity is variable. (Ricketts 2010) 3.1.4
Overview of Application Areas in Services
The literature includes several accounts of TOC implementations in a broad range of services. Excluding health services and field services, which are covered separately in Sections 3.2.1 and 3.1.5 respectively, the service environments to which TOC has reportedly been applied include: banks (Bramorski et al. 1997; Reid 2007), engineering/product design (Motwani & Vogelsang 1996; Yang et al. 2002), court systems (Niv et al. 2010), food services (Adelman 1995; Reid & Cormier 2003), education (Goldratt R. & Weiss 2005), government sector services, such as utilities (Shoemaker & Reid 2005) and the publishing of statistics (Pastore et al. 2004), military organizations (Ronen et al. 1994; Guide & Ghiselli 1995; Srinivasan et al. 2005), PSTS (Ricketts 2007; Ricketts 2010), administrative processes (Feather & Cross 1988), preventive maintenance (Chakravorty & Atwater 1994), information systems (Coman & Ronen 1994; Coman & Ronen 1995; Goldratt et al. 2000), insurance (Eden & Ronen 1993; Taylor & Sheffield 2002), personal (white-collar) productivity (Cox et al. 2005), and employee retention in police and fire departments (Taylor et al. 2006). 3.1.5
TOC in Field Services
Only one paper was found on TOC in a field service environment. Olson et al. (1998) report a case study of a security system company. TOC principles are used to improve the productivity of the installation process38 of security 38
As Klarman & Klapholtz (2010, p.894) note, “If there is an area in which TOC applications can drastically improve the performance of the CS [customer service] staff, it is at the first stage of its involvement in the service of the equipment, namely at installation of the equipment or (in the so-called ‘turn-key’ deals) implementations”. [Continues on the next page] 71
Chapter 3 TOC in Services
equipment at customer sites by redesigning the process. The problem faced was that the technicians had become a bottleneck; they could only perform 26 installations per month, while there was a demand for 32 installations. While exemplifying a field service, the process has very different operational characteristics compared to home care. The installation constitutes a one-off occurrence and the duration of one job is long (avg. 2.3 days per installation), compared to home care, which consists of several short daily visits. Although taking place at a customer’s site, the installation process resembles a project, and perhaps also the operations of a job shop in manufacturing. The process consists of many steps or sub-processes, several of which have to be performed in a particular dependent sequence. As such, a specific step or subprocess can become a bottleneck that prolongs the time it takes to finish a job. In the study, the solution was to have three technicians work as a team on the same order, instead of working on three separate orders. This shifted the constraint from the technicians to the installation subprocesses. Because several technicians worked in sync, it allowed non-constraint processes to be subordinated to the constraint process. This reduced the completion time of an installation by approximately 74%, allowing the team to complete more jobs than they could otherwise have done if they had worked individually. From an operational standpoint, the redesigned installation process is akin to a manufacturing or facility-based service process, where several steps performed by different resources need to be synchronized to improve the flow and reduce the lead time. That is, one resource or production step is a constraint, while the others are non-constraints. On the other hand, if the process design suggested by Olson et al. is not possible, and a technician works alone on several sites during the same day (as in home care or as is common in the maintenance of domestic appliances), distinguishing between constraint and non-constraint steps in the process is more ambiguous. A typical field service organization consists of several field operators working alone on different jobs at different customer sites. These can be one-off jobs (installations) or repetitive jobs (maintenance), where operators visit the same location multiple times. Since each operator for the most part works independently of the other operators – their work does not need to be They explore TOC in customer support service environments characterized by after-sales services, comparable to the setting studied by Olson et al. (1998) and described above. Because of contextual differences, Klarman and Klapholz’s contribution is not relevant for the argument presented in this dissertation, and therefore will not be described further. 72
TOC in Health Services
synchronized – a single operator is either a constraint (demand for him exceeds his capacity) or a non-constraint (he has additional time available). However, from the employer’s point of view, the organization’s capacity is the aggregated capacity of all its field operators in concert. If all operators are fully utilized39 simultaneously during a particular period of time, then the organization as a whole faces a temporary resource constraint, although at the individual level, the field operators are non-constraints. The temporary resource constraint implies that no additional throughput can be gained for that specific period, since capacity is fully utilized. In other words, if demand exceeds supply for, say, three hours, but not for the rest of the day, then performance is still limited by a peak time resource constraint during these three hours, even though the total daily capacity exceeds demand. That is, the temporary resource constraint limits performance; if the organization had more capacity during peak times it could generate more throughput. Naturally, this requires demand to be time-critical and incapable of being postponed till later periods of excess capacity (e.g., fire departments). Moreover, if time-critical customer demand is for a particular operator (or skill group), then a resource constraint may occur even though other operators (or skill groups) are available. The type of setting explained above will be illustrated in the empirical study of home care presented in Chapters 6 through 8.
3.2
TOC IN HEALTH SERVICES
This section provides an overview of the literature pertaining to the other contextual aspect examined in this dissertation: health services. Different definitions of the goal in health services and suggested performance measurements are presented, concluding in a discussion of the general goal definition adopted in this dissertation. 3.2.1
Overview of the Literature
Even though the health service has been one of the more prevalent fields of TOC research within the service context, the literature on TOC in health services still remains comparatively sparse. Ronen & Pass (2010) argue that the relative popularity of TOC in health services is due to the fact that many 39
Here utilization means that the field operator is not free for dispatch to another job. In other words, he is working on-site or in transit from one site to the next, or his next job is scheduled to begin shortly and the operator cannot be assigned a new task. 73
Chapter 3 TOC in Services
healthcare organizations, such as clinics and hospitals, resemble “production lines” (p. 849). Their operations are either comparable to different types of plants present in manufacturing, or to projects. Ronen & Pass (2010, p.849) argue that bottlenecks exist, “WIP can be easily seen”, and that performance measures are “operations-like”. They further assert that “all the issues in which TOC has proved its ability to improve are in the nature of healthcare organizations” (p. 849). Empirical Literature Table 2 provides an overview of the empirical literature on TOC adoption in health services (1999-2010). While the bulk of the papers presented illustrate real-life TOC implementations, Table 2 also includes a few conceptual papers that are based on empirical observations. Presented in chronological order, the table indicates a) the type of health system within which the research was conducted, b) the specific area or clinical specialization targeted (e.g., primary care, emergency, oncology etc.), c) the specific TOC tools employed, d) the constraints or core problems that were identified, and e) the findings, and/or the results that were achieved. Out of a total of 19 studies, 9 (47%) were carried out in public health systems, 5 (26%) in not-for-profit ones, and 3 (16%) in for-profit health systems, whereas only one (5%) involved a capitated health system. The distribution is not surprising since public and not-for-profit health systems are the most common types today (Schaefers et al. 2007). Five studies were performed within the National Health Service (NHS) (UK). The TOC tools associated with the logistics branch have clearly been the most popular. This seems only natural since a majority of the studies (14/19; 74%) dealt with capacity management issues. POOGI or 5FS were used in one form or another in 11 (58%) of the studies, buffer management in 2 (11%), and DBR in one (5%), whereas thinking processes were employed in 6 studies (32%). While all the studies reported beneficial results, only 7 studies (37%) provided numerical evidence of performance improvements attained in practice.
74
1999 For-profit
Roybal et al. 1999
Taylor & Sheffield 2002
2002 For-profit
Kershaw 2002 For-profit 2002 Rotstein et al. 2002 Public 2002
Hunink 2001 2001 Public
1999 Public
Health System 1999 Capitated
Year
Phipps 1999
Womack & Flowers 1999
Author(s)
Medical claims (insurance)
Emergency
Oncology
CRT, CRD, and FRT
Medical costs increase faster than reimbursement levels (core problem)
Treatment chairs (resource constraint) Statistical modeling based Physicians (resource constraint) on 5FS concepts
5FS
The current practice of performing a particular procedure was not warranted in certain patients on the basis of currently available evidence. Estimated cost reduction of 5% and estimated 5% increase in quality-adjusted life years. Increase in treatment capacity of 20-25%. Future estimated increase of 40-67% in total. Adding a physician for a certain time interval significantly reduced length of stay (avg. 6.61 min) for 80-119 admissions. However, if the number of admissions was less than 80 or more than 120, adding a physician did not have a significant effect. Process improvements were identified, increasing the accuracy of claims processing and reducing the inventory of unpaid claims. The margin between reimbursements and costs was improved.
Reduced number of cancelations. 16% increase in throughput. Increase in monthly net income of approximately 6%.
Reduced waiting time. Estimated $16 million in additional revenue for a cost of less than $200,000.
Constraint(s)/Core Problem(s) Results/Findings
Availability of routine appointments (resource constraint) Surgery 5FS (exact methods not Number of beds in hospital ward provided) (resource constraint) Mental health and 5FS and computer model Crisis therapy, non-crisis therapy, substance abuse combining TOC with and physicians (resource activity-based costing constraints) concepts Medical decision CRD, CRT, as well as list Suboptimal communication (core making of pros and cons of problem) providing certain patients with a particular treatment
TOC Tools Used
Primary care (U.S. 5FS Air Force)
Area(s)
Table 2. Overview of the empirical literature on TOC in health services.
TOC in Health Services
75
76
2004 Public
Buffer management 2005 Not-for-profit Accident & emergency (A&E), hospital admissions (three hospitals)
Silvester et al. 2004
Umble & Umble 2006
Conceptual paper 5FS principles (exact based on method not specified) common practices in the NHS (UK)
CRT, CRD, and FRT
2004 Not-for-profit Psychiatric hospital
Results/Findings
Instead of looking at the frequencies and trends of adverse events, the cause-and-effect relationships between practices and adverse events are analyzed on the basis of individual cases. Fixing the core problems; reduction of adverse events (that increase patient inventory) through planned interventions. Reduced length of stay. Reduced legislative funding (core Five changes were identified which, in combination, problem) would lead to improved quality of care, while also both reducing staff overloading and improving morale. Several policy constraints, The primary cause of long queues is not a lack of capacity, but the variation and mismatch between including capacity planning and promoting efficiency of every capacity and demand, as well as the way in which resource capacity is supplied. If demand exceeds capacity, excess demand is carried forward as a queue. When capacity exceeds demand, the spare capacity is lost (unused capacity cannot be passed forward). Significant system-wide variability Significantly reduced waiting time in A&E coupled with a silo mentality, departments, as well as in subsequent acute hospital causing suboptimization and admissions. Additional capacity was generated underutilization of capacity without investment. Patient satisfaction and throughout the system (core provider morale improved. problem)
Taylor & Churchwell 2004
McNutt & Odwazny 2004
Health Area(s) TOC Tools Used Constraint(s)/Core Problem(s) System 2004 Not-for-profit Medical errors CRT and medical evidence Decisions and care processes that (multiple settings) literature increase the probability of adverse events (core problem)
Year
Author(s)
Chapter 3 TOC in Services
2008 Not-for-profit Mental health
Gupta & Kline 2008
Evidence-based practice center
2006 N/A
Patwardhan et al. 2006
Mental health service
1)Neurosurgery, 2)eyes, and 3)ENT
Area(s)
2005 Public
Health System 2005 Public
Year
Ritson & Waterfield
Lubitsh et al. 2005
Author(s)
POOGI
CRT and FRT
CRT, CRD, FRT, PRT, and TT.
In Eyes and ENT 16 out of 18 indicators went in the hypothesized direction (increased throughput, reduced waiting time), although many results were not statistically significant. No significant results were achieved in neurosurgery. The setting matters; the more the system resembles the relative predictability of a production process, the more straightforward the application of TOC is. Fragmented service with confusing The introduction of new teams with the expertise and resources to assess customer needs and provide care pathways (core problems) h understood and solutions found. Reports are not used because they Process failures do not meet partners’ needs. The results served as a guide for improvement. Partners do not know how to articulate their requirements properly (core problem). Cost containment had created a balanced plant. The Psychiatrists, therapists, and clinical support function (resource analysis shows that the associated policies reduced both efficiency and revenues, while increasing costs. constraints), as well as a policy A pilot study showed that the cancelation and noconstraint show rate was reduced by over 50%, increasing capacity. Intervention: two-day workshop on TOC concepts including 5FS provided to representatives from all groups in a department.
In the ENT department the nurses in the ward (resource constraint). The other departments’ constraints are not mentioned.
Constraint(s)/Core Problem(s) Results/Findings
TOC Tools Used
TOC in Health Services
77
78
2010 Public
2010 Public
2010 Public
Stratton & Knight 2010
Groop et al. 2010
Health System 2009 Public
Year
Tsitsakis 2010
Sadat 2009
Author(s) Constraint(s)/Core Problem(s) Results/Findings
Oncology
5FS (in practice) and DBR Treatment chairs (resource constraint) using discrete event simulation, and comparison with two other scheduling strategies.
TOC Tools Used
DBR slightly compromised one performance measure (instances of delayed treatment) in favor of another (average patient waiting time) compared to the other strategies. When simultaneously accounting for both, DBR can be interpreted as the scheduling strategy leading to the best overall performance (depending on the weight assigned to different measurements; a strategic question). The constraint caused delays in discharge, increasing Hospital 5FS as a precursor for later Diagnostic imaging laboratory the length of stay and reducing throughput. It is adoption of throughput (resource constraint) suggested that the problem can be solved by accounting. following the 5FS. Length of stay reduced by over 20%. Improved Multiple settings: Buffer management Not provided. The author's Acute & interpretation is that it is a market Accident & Emergency performance as measured by percentage of patients. emergency, constraint. discharge POOGI Peak time resource constraint The analysis shows that a planned investment in a Health (temporary resource constraint) technology that sought to improve productivity Technology would only improve the efficiency of nonAssessment constraints. Implementing the technology into the current practice was reasoned to have the opposite effect. The planned investment was deferred and focused process improvements started.
Area(s)
Chapter 3 TOC in Services
TOC in Health Services
The single study of DBR (Sadat 2009) was based on discrete event simulation, mostly using empirical data as input. The findings suggest that DBR might be suitable for the setting that was studied (oncology), which treated elective patients. No implementations of DBR in practice were found, even though the scheduling methodology constitutes one of the earliest TOC developments. Umble & Umble (2006) note that DBR is not applicable to settings where the provider has no control over the arrival of patients (e.g., acute & emergency services), meaning that no tactical gating mechanism is available (cf. materials release). However, they suggest that DBR might be suitable for scheduling elective health services. No studies on replenishment in a health service context were found. Except for a paper by the author and colleagues (Groop et al. 2010) on early findings of the study presented in this dissertation, no papers targeted field service operations or home care. The remaining studies targeted settings where the service was provided through facility-based processes, i.e., through a set of steps performed by separate resources, requiring some degree of synchronization to balance the flow of patients/customers or items moving through the system. Conceptual Literature The literature also includes several conceptual papers and books adapting TOC concepts for health services (Breen et al. 2002; Burton-Houle 2001; Leshno & Ronen 2001; Motwani 1996b; Ronen et al. 2006; Schaefers et al. 2007). Ronen et al. (2006) provide a large number of case examples of practical TOC adoptions in different health service settings. Wright (2010) describes TOC in the context of large-scale healthcare systems in general, and Wadhwa (2010) discusses TOC in for-profit healthcare systems. Wright & King (2006) commercialized TOC for healthcare in a business novel, explaining the application of some TOC in a very realistic public healthcare environment (NHS). The book largely focuses on the thinking processes. Overall, the literature seems unanimous about the applicability of the thinking processes to health services. 3.2.2
Defining the Goal and Performance Measurements in a Health Service Context
While the literature agrees that TOC is suitable for a health service context, there has been some debate regarding the definition of the goal, and consequently, the definition of the performance measurements as well (the 79
Chapter 3 TOC in Services
prerequisite steps of POOGI). By and large, there is a consensus that the goal of for-profit health organizations is consistent with the generic goal of any forprofit business (e.g., Breen et al. 2002) – “to make money now as well as in the future” (Goldratt 1990b, p.12). Accordingly, the definitions of the operational performance measurements remain the same, the only main difference being that the WIP consists of patients (Breen et al. 2002; Ronen et al. 2006). In an attempt to increase the applicability of the generic goal so as to incorporate any kind of organization, Schaefers et al. (2007) rephrase the goal as “to continuously make more ‘goal units’ today as well as in the future” (p. 231). Similar definitions are provided in the TOCICO (Sullivan et al. 2007, p.47) and APICS (Blackstone 2010b) dictionaries. While this is arguably a very generalizable goal, the issue of verbalizing the ‘goal units’ still remains. In the context of not-for-profit and public health services, several definitions of the goal and the operational performance measurements have been offered. The author and colleagues (Groop et al. 2010) note that a number of authors have proposed that the goal be defined in terms of the health outcome sought (i.e., the effectiveness of the service) (Breen et al. 2002; Hunink 2001; McNutt & Odwazny 2004; Schaefers et al. 2007; Sadat 2009), whereas others have defined the goal in terms of tangibles, such as money (Schaefers et al. 2007), patients treated, or the volume of services produced (Gupta & Kline 2008; Ronen et al. 2006; Wright & King 2006). The following first discusses the intangible or health outcome-based approach, after which the tangible or output-based approach is outlined. Outcome-Based Definitions Health outcome-focused definitions of the goal include “to maximize life expectancy and quality of life at an acceptable cost to society” (Hunink 2001, pp.268– 269), “to provide quality healthcare to a particular population now and in the future” (Breen et al. 2002, p.42), “providing safe care while thinking of money only as an operating expense – something to be reduced” (McNutt & Odwazny 2004, p.187), “to make more health, today as well as in the future” (Schaefers et al. 2007, p.231), “to increase the quality and quantity of lives both now and in the future” (Sadat 2009, p.74), and “to increase the percentage stock of the healthy population” (Wadhwa 2010, p.904). In the main, the argument is based on the notion that public and not-for-profit health organizations exist to cure patients/customers, improve their health, or increase their quality of life, not to produce outputs (e.g., medical procedures). The volume of procedures does not always correlate with actual health outcomes, and frequently more can be achieved with less (Wennberg 2010). 80
TOC in Health Services
As noted earlier, TOC holds that the goal should be defined by the system’s owners (Goldratt 1990a), who, in a public health service context, are the taxpayers (Schaefers et al. 2007; Sadat 2009). Schaefers et al. (2007) argue that the taxpayer, as both the owner and customer of the system, wishes to “maximize his life expectation with an acceptable to good life quality” (p. 232), and that achieving this should therefore be the goal of the health system. Since throughput should be defined as the rate at which the goal is achieved, outcome-based definitions would entail throughput being defined as the “units of health generated”, which may not be easy to measure (Breen et al. 2002, p.42). Arguing that this still can and should be done, Schaefers (et al. 2007) formulate a goal unit (LETLIQ) that accounts for both life expectancy (LE) and life quality (LIQ). In short, on the basis of the goal unit, they develop a formula for calculating the throughput (the difference in goal units before and after an intervention) and inventory (the goal units absorbed by the system). They assert that the definition of operating expense remains the same as in the for-profit world. Sadat (2009, p.75) argues that the model of Shaefers et al. (2007) “falls short in showing a comprehensive relationship between all the performance measures and the goal, especially when it comes to operating expenses”. She first develops a system dynamics (e.g., Sterman 2000) model of TOC for publicly traded for-profit companies. The model, which depicts the relationships between the goal and various performance measures, is subsequently adapted for public health systems. The goal and performance measures are modeled from the perspective of an individual customer interacting with the health system. The goal unit used is a quality-adjusted life year (QALY) (e.g., Drummond et al. 2005). The basic idea is that the individual seeks to maximize his QALY. QALYs can be gained or wasted by investing quality-adjusted time in health (e.g., visiting a hospital). Sadat (2009, p.82) defines T as total QALYs gained, OE as total QALYs wasted, and I as total quality-adjusted time invested in health. Correspondingly, the bottom-line measurements (cf. NP and ROI) are: ������� �� � ������ � � ������ � ������ � � ������ � ������ � � ��������� �������� ��� �� =
������� �� � ������ ������������� ����� ���� �� ������ ����
Finally, Sadat (2009, p.94) uses the model to connect the goal and the systemwide performance measures to two “low-level performance measures”: 1)“average patient waiting time” and 2) “instances of delayed treatment”. The 81
Chapter 3 TOC in Services
purpose is to evaluate the level of compromise between these measures that would maximize the goal. The model is used to evaluate different simulationbased scheduling scenarios including DBR in an oncology department (see Table 2). Although an early work, the model is perhaps the most extensive in terms of its ability to translate an outcome-based goal into practical measurements. The weak points are that the model assumes that certain values are known (an individual’s total remaining QALYs) and that others can be measured (qualityadjusted time savings). Unfortunately, these assumptions reduce the robustness of the model, and thereby its applicability to everyday operations. While it might be suitable for macro-scale policy and decision making, it is questionable whether it can preserve the simplicity and managerial relevance needed for actual implementation in daily operations. Output-Based Definitions Those in favor of output-based definitions acknowledge that the goal should preferably be defined as something easily measurable and unambiguous, so that clear and simple performance measurements can be derived (e.g., Ronen et al. 2006). While not disputing that improved health outcomes are the ultimate purpose of not-for-profit and public health services, they note that health outcomes may be both difficult to measure and dependent on external variables (e.g., a customer’s lifestyle and random events). In order for an organization to be managed effectively, decisions should be based on their ability to move the organization toward its goal. If something is hard to measure, the chances are that it will not be measured and monitored – “what will not be simple, simply will not be” (Ronen et al. 2006, p.207). If something is not measured, it is hard to manage. Following this logic, outputbased definitions of goal and performance measures can be argued to promote the things required (e.g., treated patients) to reach the goal of improved health outcomes (at least the part of the health outcome that the provider can affect). For instance, it may be difficult to measure how the performance of the checkin function at an outpatient clinic will affect the patients’ health outcomes. It can, however, be synchronized to improve the flow of patients through the clinic, a precondition for maximizing health outcomes. Gupta & Kline (2008) hold that the goal of making money now and in the future remains the same, irrespective of a system’s for-profit or not-for-profit status, the only difference being that the former must make a profit. They point out 82
TOC in Health Services
that it is just as important to satisfy the two necessary conditions that allow for the achievement of the goal: 1) “to provide a secure and satisfying environment for staff now and in the future”, and 2) “satisfy its customers (patients) now and in the future” (p. 283). Gupta & Kline (2008, p.283) expound their reasoning through the twofold goal of a not-for-profit health service provider: “The financial goal is to make the money required to run programs now and in the future while satisfying patients and providing satisfaction and security for professional and clinical support staff now and in the future. The clinical goal is to provide high-quality clinical care. Attainment of the financial goal provides for the realization of the clinical goal. Both are possible without incessant cost cutting and optimizing efficiencies across the system – two actions that seriously jeopardize the financial and clinical goals as well as employee morale and job satisfaction”. (Gupta & Kline
2008, p.283) Building on this, Gupta & Kline (2008, p.283) define throughput as “the rate at which the system generates money through sales (or patient care)”, i.e., the money coming in from “patient co-payments” and “third party payers”.40 Inventory is defined as “all the money that the system has invested in purchasing things the system intends to sell (or provide to patients)”, i.e., the money the system currently ties up. They note that while patients are WIP, this type of inventory does not translate clearly into financial measures. Again, following the original definition, operating expense is the “money going out of the system”, i.e., “wages, salaries, rent, and utilities”. The obvious benefit of keeping to the original for-profit definition of the goal and the performance measures is that the TOC concepts translate more easily into a health service context. However, while the logic may hold in a not-forprofit context, where providers need to make enough money to run their health programs, the for-profit goal and performance measures are arguably illsuited to public health services, where the funding is typically based on a given tax-funded budget. Output-based definitions of the goal of public health services include “to treat more patients, better, sooner, both now and in the future” (Wright 2010, p.958), and “to maximize quality medical services provided to its customers, subject to budgetary constraints” (Ronen et al. 2006, p.48). The author finds that both definitions in essence promote the same goal, although their wordings differ slightly. Both definitions 40
A closely related alternative definition of throughput in a for-profit environment is “the reimbursement rate less the cost of drugs and medical supplies for the number of patients seen and treated” (Kershaw 2002, p.2). 83
Chapter 3 TOC in Services
seek to “improve the quality and quantity of patient flow through health systems” (Wadhwa 2010, p.906). Both definitions can also be interpreted to implicitly incorporate the pursuit of health outcomes, while assuming that all necessary conditions are satisfied. An output-based definition of throughput could here be defined as the number of patients treated, or the hours of service provided. Note that here throughput assumes the conventional meaning of output. Inventory is typically defined as the PIP and the definition of operating expense remains the same; money flowing out of the system. In accordance with the pragmatic OM approach adopted in this dissertation, the author chooses to follow the definition of the goal provided by Ronen et al. (2006, p.48): “to maximize quality medical services provided to its customers, subject to budgetary constraints”
The author’s interpretation is that ‘maximizing quality services’ means making the most of current resources, both in terms of the level of quality and the volume of services provided, given the current funding (budget) available. This may include providing services to more customers (if the need exists or if the population could benefit from increased service coverage), reducing waiting time (quality), or improving the medical quality of the service currently provided. In other words, health service providers should also maximize the effectiveness of the service (health outcome). The definition of the goal also presumes that the right volume of services with the right level of quality is provided to customers who actually need it, i.e., that no unnecessary service (‘overcare’) is provided. Idealistic as this assumption may be, determining the right volume and quality of service that customers actually need is best left to health professionals. Working from an OM perspective, the presumption is that individual customers’ actual needs are specified in their care plans (i.e., SLA). Thus the task of OM is to ensure that the care plan is met, while making the most of the resources currently available.
84
4 RESEARCH SETTING
This chapter describes the home care organization that was studied, and applies the TOC terminology and concepts to home care. The chapter begins by presenting Espoo Home Care and its operations. The goal of home care, as well as existing necessary conditions, are then discussed. The chapter concludes with a definition of the TOC performance measurements used in this study.
4.1
DESCRIPTION OF HOME CARE
Espoo Home Care (EHC) is a publicly funded primary care organization. It is responsible for providing the statutory home care services for the municipality of Espoo. With a population of approximately 245,000 inhabitants, it is the second largest municipality in Finland. With an annual budget of €27.2 million (2009), and a staff of 380, EHC provides a wide range of services, from medical to supportive and social services. In addition to field-based home care services, EHC runs a number of publicly owned service homes, the services of which are essentially facility-based. This dissertation, however, only addresses the field services, provided by a subunit of EHC known as Regional Home Care, which serves clients living in their own homes, as opposed to service homes. Regional Home Care has an annual budget of €18 million (2009) and a staff of 326, comprising 86% of EHC’s total workforce. For the sake of simplification, home care will henceforth simply refer to the services provided by Regional Home Care.41 Likewise, EHC will refer only to the Regional Home Care unit.
41
The services provided by Espoo’s Regional Home Care unit correspond to services that in a broader international context are known by several names, such as home care (Chahed et al. 2009; Eveborn et al. 2009), domiciliary care, home and community care services (Lee-Fay et al. 2011) and home care, welfare, and domestic services (Broekhuis et al. 2009). Home care should not be confused with remote monitoring of patients or customers living at home through some technology platform. Although home care may sometimes include such a component, home care operations center around caregivers visiting their customers’ homes, where the bulk of the services are provided. 85
Chapter 4 Research Setting
Home care is a statutory service, which seeks to enable people to live safely and independently in their own home, even as their health and level of autonomy deteriorate. EHC provides a wide range of services, such as the administration of medication and monitoring of vital signs, personal care, and support in homemaking. In addition, EHC coordinates a range of support services outsourced to private providers, such as the delivery of groceries and meals, safety services, and customer transportation. EHC provides home care in two shifts during its office hours (7 a.m. to 10 p.m.). Night-time (approx. 10 p.m.-7 a.m.) home care services are outsourced to a private service provider. Figure 19 illustrates the home care service system and the division of services between public (EHC) and private service providers, as well as the different services’ approximate distribution throughout the day. The scope of this dissertation is limited to EHC, shown in the gray area.
Publicly Provided Services Therapeutic Day Care in Service Homes
Espoo Home Care (EHC) 7 a.m.
4 p.m.
10 p.m.
• Transportation • Meal Service • Grocery Service • Outsourced Home Care (e.g. severely dissabled customers)
6 a.m.
Night-Time Home Care
Customer Safety Service
Outsourced, Privately Provided Services Figure 19. The distribution of home care services between public and private providers in Espoo.
Although age is not a discriminating factor when determining an individual’s eligibility for receiving public home care, the vast majority of EHC’s customers are elderly individuals. Some, such as highly dependent, severely disabled customers, receive additional home care services provided by a private 86
Description of Home Care
organization. Support services, such as transportation and the delivery of meals and groceries, as well as a round-the-clock customer safety service, are outsourced to separate private providers.
Contact (Need)
Evaluation (Care plan)
Temporary Home Care
Exit
Continuous Home Care
Service Home Institutional Care Decease
Figure 20. The flow of customers through the home care service system.
Figure 20 illustrates the flow of customers through the home care service system. The process starts with an expressed need for home care. Usually EHC is contacted by a relative, hospital, or a neighbor, who believe a certain elderly individual to be in need of home care. After the first contact, EHC is lawfully required to evaluate whether the individual is eligible for home care within 7 days. Should an individual be deemed eligible and accepted as a home care customer, a care plan (cf. service level agreement (SLA)) is designed, with the customer’s individual needs being taken into account.42 The care plan is revised biannually or when changes in a customer’s condition so require. During the evaluation customers are first divided into two main categories, temporary and continuous home care customers. Temporary home care customers (0.4%) receive services for a limited period of time (e.g., post-surgery rehabilitation), and exit the system once their health improves. The bulk of the customers receive continuous home care, meaning that they remain customers of EHC until their death, or until their condition reaches a point where home care is no longer a feasible option. The customers are then transferred to a more comprehensive form of care, such as a service home or institutional care (i.e., primary care hospitals). Continuous home care customers are further divided into seven dependency categories on the basis of the estimated amount of services they need monthly, as measured by the cumulative estimated time it will take EHC to provide the services. Customers in the lowest dependency category receive up to 4 hours of
42
Unlike many other European countries (e.g., Sweden, Denmark, and the Netherlands), in which the evaluation is performed by an independent authority, in most Finnish municipalities the evaluation is performed by the home care organization itself. 87
Chapter 4 Research Setting
home care on a monthly basis, while those in the highest dependency category receive over 80 hours of home care each month. 4.1.1
Demand
This categorization is done primarily for reimbursement purposes. Although EHC is publicly funded through taxes, a portion of the operating expense is covered through customer co-payments (~9%). The size of the co-payment varies according to the dependency category to which a customer belongs, as well as the customer’s level of income. The evaluation process determines actual customer needs and translates them into demand through the supply of purchasing power (i.e., customer acceptance). Thus, henceforth demand refers to the services that EHC is obliged to provide, as determined by the care plan, while need refers to a customer’s actual needs. As will be discussed later, the care plan (demand) includes the timing of different home visits, which may not always be based on actual customer needs, but rather on organizational practices. In other words, while the services defined in the care plan must be provided, the timing of their provision may be changed, as long as the particular service or visit is non-timecritical. 4.1.2
Time-Criticality
Time-criticality refers to the time window within which certain visits need to begin. A time-critical visit is one whose timing is important; certain tasks need to be performed within a limited time window (e.g., 8-9 a.m.). Non-timecritical visits comprise tasks that can be scheduled freely as their timing does not affect the customers’ abilities to go about their lives. Furthermore, some visits are semi-time-critical in that they can be scheduled within a slightly wider time window (e.g., 9 a.m.-12 a.m). There are two main factors that determine time-criticality: 1) medical, and 2) practical/operational reasons. Medical reasons are, for example, medication that needs to be taken at certain times. While many customers can take their medication themselves, with others, such as those suffering from memory disorders, the administration and consumption of medication need to be monitored by a caregiver. According to the director of Espoo’s services for the elderly, Professor of Geriatrics, Jukka Louhija (D.Sc.(Med.)), time-critical consumption of medication is relatively rare. Rather, the time-criticality is due to practical reasons. He explains that “if a certain drug needs to be consumed 88
Description of Home Care
three times a day at six-hour intervals, postponing the first dose will postpone the second and third as well and ultimately require a customer to get up in the middle of the night to take the final dose”. Similarly, some clinical tests (e.g., blood sampling) and injections (e.g., insulin) need to be performed prior to breakfast, dictating that a visit be scheduled around the time the customer prefers to wake up. An example of time-criticality for operational reasons is when customers participate in therapeutic day care services at one of EHC’s service homes, which are organized from 9 a.m. to 3 p.m. (approx. 40 customers per day). In many cases a caregiver is required to assist a customer with getting ready for the transportation, which arrives around 8:30 a.m. Likewise, caregiver assistance may be needed upon the customer’s return. 4.1.3
Home visits
Home care is composed of many tasks that may or may not be interdependent. Tasks are grouped and carried out as home visits. For instance, some customers need assistance with their morning routines, such as getting out of bed, getting dressed, and taking prescribed medication after breakfast. These tasks need to take place in a certain dependent sequence, and it is necessary for the tasks to be performed within a certain visit. Other tasks, such as bathing, may be needed, but they are sequentially independent of other tasks and their timing is non-critical, i.e., they can be performed at any time. Therefore, such tasks can be decoupled from a certain time-critical visit and performed at other times, during other visits. The number of periodic home visits varies according to the customers’ needs. The frequency of visits to individual customers ranges from the occasional biweekly visit up to 4 daily visits, averaging 1.56 (SD 0.12)43 visits per customer served per day. On average, the caregivers serve 801 (SD 40) different customers per day on weekdays, and 389 (SD 12) customers per day on weekends, corresponding to a daily average of 1,189 (SD 55) client encounters on weekdays and 671 (SD 44) on weekends. Even though the majority of the service encounters are home visits, once in a while clients may visit EHC’s local unit offices, e.g., for medication pick-ups, or matters are handled over the phone, e.g., ordering groceries or meals. EHC has around 2,100 different
43
The numbers presented in this paragraph are based on an analysis of a 6-week period (Feb 9th to March 22nd, 2009). The data are explained in Chapter 5. 89
Chapter 4 Research Setting
customers simultaneously, so EHC typically serves roughly 40% of its customers on weekdays and less than 20% on weekends. 4.1.4
Organization and Staff
EHC is divided into two major districts, Northern and Southern Espoo, led by two service managers (Fig. 21). The two districts are further divided into 18 local units (9 per district) that serve separate geographical areas. Each local unit is led by a foreman, and employs 12-26 caregivers. Espoo Home Care (EHC)
Northern EHC
N1
N5
N2
N6
N3
N7
N4
N8
Service Manager
Head of EHC
Service Manager
LOCAL UNITS
Staff: Foremen: Caregivers: Skill Group 1: Skill Group 2:
344 18 326 75(23%) 197 (76%)
N9
Southern EHC
S1
S5
S2
S6
S3
S7
S4
S8 S9
Figure 21. Organization and staff (as of February 27th, 2009)
The caregivers comprise two skill groups: 1) registered nurses (23%), and 2) basic employees (76%), the latter consisting primarily of practical nurses.44 While most of the visits are carried out by caregivers from skill group 2, certain tasks legally require a higher level of competence and are therefore performed by registered nurses (skill group 1). Focusing more on medical tasks than all-round assistance and support, the activities of skill group 1 differ from those of skill group 2. To some extent members of skill group 1 have more coordinating duties (e.g., consultations with physicians), and offer supervision and support of skill group 2, tasks largely performed at the office (i.e., back-office tasks).
44
“Practical nurse” is a nursing degree that requires approximately 3 years of training, as opposed to the registered nurse degree, which requires approximately 4 years of training.
90
Description of Home Care
The majority of the caregivers work full-time (approx. 8-hour shifts), with only 16% being part-time employees. Many of the part-time employees are parttime retirees who work roughly every second week, meaning that when on duty they do in fact work full shifts. 4.1.5
Daily Operations
In home care, the basic unit of analysis is a caregiver process (or workflow), consisting of all the steps carried out by an individual caregiver during a shift. Figure 22 illustrates a typical caregiver process. The shift starts at the office, where the caregiver picks up things needed during the shift, such as a car,45 a worklist containing the order and timing of different customer visits, customers’ home keys,46 medication, and measurement devices. Often a brief meeting is held, during which the worklists are refined on the basis of variations in supply (e.g., sick leave) and demand (e.g., customers returning from hospital), which occur frequently. The caregiver then proceeds with carrying out the home visits. Back-Office Time
7am
8
9
10
Home Visists (Front-Office Time)
11
12
1pm
2
3
Breaks
4
5
6
Transportation
7
8
9
10pm
Morning Shift Evening Shift Figure 22. The caregiver process.
At some point, depending on the length of the shift, the caregivers are entitled to a break. Sometimes caregivers return to the local unit office for their breaks. In the above example, the caregiver then continues their route in the afternoon. At the end of the route the caregiver returns to the office to return the car, the customers’ home keys, and other appliances. At the office
45
The distribution of local units’ cars between caregivers depends on several factors, such as the distance to customers. Some caregivers choose to use their own cars and receive compensation for the kilometers driven. Many customers live close by, enabling caregivers to walk or ride a bicycle to and between locations. In some instances caregivers pool cars when their customers live in the same area. 46 Some customers may not be able to answer the door themselves. 91
Chapter 4 Research Setting
caregivers perform back-office activities, such as charting47 and submitting customers’ grocery and meal orders to private providers handling the delivery. The series of home visits to different locations is referred to as a caregiver route, and it is the main focus of scheduling and coordination. In other words the caregiver route is the caregiver process, minus back-office time. As each caregiver is assigned a route, there are as many routes taking place simultaneously as there are caregivers on shift (Fig. 23). C#
10:50am
= Route of Caregiver #
11:30am
C1
C1 8:40am
10:20am
C1
C2
C2
9am
C2
8:15am
8am C1 12am
Local Office
C2
7:50am
C2
C2 12:50pm
C3 8:10am C1 C2 1:30pm
2pm
C3
11:50am
C3
8:50am
C1 2:30pm 10:25am C3
C3 9:40am
Figure 23. Conceptual illustration of three caregivers' simultaneous routes.
4.1.6
Scheduling
The caregiver routes are scheduled and carried out at the local unit level, following the customers’ care plans. Scheduling is subject to a multitude of restricting parameters, conventionally known as scheduling constraints. Following the TOC terminology, however, the term “scheduling constraint” is somewhat misleading. Since the scheduling constraints constitute immutable boundaries within which a caregiver needs to operate, they represent necessary conditions that need to be satisfied, rather than constraints that limit performance. Therefore, to avoid confusion regarding the use of the word “constraint”, the so-called scheduling constraints will here be referred to as scheduling conditions. 47
Charting involves entering visit information (customer visited, duration of the visit, comments etc.) into the electronic medical record (EMR), as well as an occasional update of customers’ care plans.
92
Description of Home Care
Home care scheduling has been reasonably well covered in the OR literature, where it has been studied using mathematical modeling, simulation, or optimization software (Akjiratikarl et al. 2007; Begur et al. 1997; Bertels & Fahle 2006; Bredström & Rönnqvist 2008; Cheng & Rich 1998; Eveborn et al. 2004; Eveborn et al. 2006; Eveborn et al. 2009; Martin & Wright 2009). Table 3 provides a description of different scheduling conditions. The list follows Eveborn et. al (Eveborn et al. 2004; Eveborn et al. 2006; Eveborn et al. 2009), who study caregiver route scheduling in a Swedish home care setting that is very similar to EHC. They distinguish between hard scheduling conditions, such as qualification requirements and regulations, and soft scheduling conditions, such as client or caregiver preferences. The hard conditions are definite and must be followed, while the soft conditions are preferred, and should be accounted for whenever feasible. Table 3. Scheduling conditions (summarized from Eveborn et al. (2004; 2006; 2009)).
Scheduling Conditions Time window
Type
Description
Hard/ Soft Hard Hard
Hard: the time-criticality of visits. Soft: customers' preferred time-window. Staff qualification requirements. Some (albeit few) visits require more than one caregiver. Hard Caregivers may be required to bring materials (e.g. medication) or equipment. Hard Car, carpooling, public transport, bicycle or walking.
Skill group Multiple caregivers Materials & equipment Mode of transportation Travel time Hard Sufficient time to travel between locations. Interdependency Hard Some tasks may require other tasks to have been of tasks performed (e.g. filling customers' medical dispensers at the office). Continuity Soft A service quality objective is to minimize the of care number of different caregivers visiting the same customer. A customer's personal (responsible) caregiver should perform the visit if feasible. Workload Soft The workload of individual staff members should be distribution as even as possible. Geographical Soft Staff should preferably serve clients within their area local unit’s designated area. 4.1.7
Performance Measurement
The total available caregiver time (i.e., capacity) is divided into two major components (Fig. 24): 1) front office (FO) time, defined as the time spent 93
Chapter 4 Research Setting
interacting with customers, and 2) back office (BO) time, referring to everything else. Front Office Time
Back Office Time
Customer Encounters (Home Visits)
Transp. (~12%)
Back Office Service
Support Activities
Figure 24. Front office and back office activities.
BO time in turn can be divided into three main categories: 1) travel between locations, 2) BO services, comprising activities that directly or indirectly affect other services or the ability to provide them (e.g., charting, updating the care plan, and placing customer orders), and 3) support activities, such as training, management, and internal meetings. According to a 2004-2005 time survey, travel accounts for 12 percent of total time. As will be explained in Chapter 7, a commercial optimization software package (Ecomond Opti) was used to verify this figure. One of the most central operational indicators used in home care is the ratio of FO time to total time (capacity) (henceforth utilization), which measures a home care organization’s ability to utilize its capacity for home visits. Naturally, since the utilization does not include the load of the BO services, it is an approximation. The use of the utilization measurement is based on the notion that the most important component of home care is the home visits. While customers could perhaps do for a while without the so-called BO services, they cannot do without the assistance they receive during the home visits. Additionally, the load of BO activities is currently hard to monitor; as opposed to the home visits (FO time), whose start and end times are recorded, BO time leaves no time stamps.48 In collaboration with management it was estimated that the maximum achievable theoretical ratio of FO would be approximately 70-75% of capacity. In other words, this is the point at which capacity is fully utilized, since backoffice activities would consume a minimum of 13-18% of capacity, while travel accounts for 12%. This would be a considerable increase from the current FO
48
As explained in Groop et al. (2010) and Groop (2011), there are currently mobile platformbased solutions on the market that allow BO services to be shifted to FO ones. This reduces the measurement problem by integrating the load of BO services into FO time, improving the accuracy of the utilization measurement. On the basis of my own experience, as well as on discussions with several home care providers in Finland and Sweden, this has already been achieved in a few municipalities in Finland, and in several in Sweden.
94
Description of Home Care
ratio of less than 40%.49 Reaching the estimate would, however, require shifting certain back office activities (e.g., charting) to front office ones through the use of available mobile technology solutions (e.g., Groop et al. 2010; Groop 2011), something EHC plans to do in the near future. Without this development, the maximum theoretical ratio of FO achievable would be approximately 60-65% (23-28% back office activities). The estimates were based on benchmarking best practices and an approximation of the duration and frequency of different back-office activities. For instance, a private provider who had recently taken over two local home care units in a similarly sized municipality reported a sustained FO ratio of 62% (up from 52%),50 saying they believed there was considerable room for further improvement. A public home care provider from southern Sweden reported an FO ratio of 75% (only 4% travel), which, if converted into a figure comparable with EHC, would be 67% (12% travel). Note that both of the benchmark organizations performed charting activities during home visits through the use of mobile technology solutions. Since EHC is publicly funded, the financial measurements of NP, ROI, and CF are largely irrelevant. However, adherence to budget can be argued to be somewhat comparable to NP, the difference being that home care seeks to keep the operational expenses equal to or less than the budget. CF is not an issue as temporary cash can be supplied from other cost units. Thus, poor CF cannot cause bankruptcy unless the entire municipality defaults. Besides, the funding is provided by the municipality, and receivables such as customer co-payments only make up a marginal portion of the budget. EHC does not gain any direct monetary return for the money (i.e., operating expense) invested in home care. On the municipal level, however, the later savings gained (e.g., reduced need for more costly forms of care) from an investment in home care could, in theory, be compared to ROI. In practice, the “return” comes in the form of FO time (output). Consequently, the closest equivalent to ROI is the productivity ratio – the ratio of output (FO time) to input (operating expense/budget).
49
According to discussions with the heads of numerous public home care organizations, this seems to be a fairly common figure in Finland. 50 Presentation given by Mark Roth, CEO of Mediverkko Oy, at the “Kotihoito & Teknologia” (Home Care & Technology) seminar in Helsinki, February 2nd, 2011. 95
Chapter 4 Research Setting
The main bottom-line financial indicator used by EHC is unit cost, measured as the ratio of FO time to operating expense (i.e., the cost of one hour of FO time). In other words, the key bottom-line indicator used is the productivity ratio. Note that in a home care context, the unit cost is not akin to product cost in manufacturing, where overhead is allocated to distinct products. In home care the unit cost does not relate to individual outputs, such as the cost of actual home visits, whose durations (and, consequently, relative load) vary greatly. Rather, the unit cost relates the largely fixed operating expense to the total amount of FO time produced by providing an estimated cost of one hour of FO time. As will be discussed later in the managerial implications (Section 9.3.4) the unit cost does not represent the true cost of producing an hour of FO time, and should not be used as a basis for make-or-buy decisions. Unit cost can, however, be used as an indicator of financial performance for internal purposes.
4.2
APPLYING TOC CONCEPTS TO HOME CARE
This section applies certain focal TOC concepts to home care. The mission of home care is discussed to provide a background for the definition of the goal. This is followed by a brief presentation of central necessary conditions that define the operational landscape. Finally, performance measurements are defined on the basis of the definition of the goal. 4.2.1
The Mission of Home Care
By providing customers with the right amount of customized assistance at the right time, home care seeks to enable customers to live independently in their own homes for as long as possible. In other words, the mission is to maintain or improve a customer’s state of health and to arrest its decline. The underlying idea is that helping elderly citizens to live at home benefits both the individual, by maximizing their quality of life, and society, by reducing the cost of care. From the societal perspective, the objective is to reduce the portion of their lives that individuals spend in more comprehensive, costly forms of care, such as service homes and institutional care, by prolonging the time they can live at home assisted by home care. Thus, the early-stage investment in home care seeks to reap larger savings at later stages in the care delivery spectrum.
96
Applying TOC Concepts to Home Care
With this background, the question is how to define the goal of home care in a manner that would allow operationally relevant performance measures to be derived. 4.2.2
The Goal and Necessary Conditions
Essentially, the goal of public home care can be divided into two components. First, from a quality perspective, the goal is to maximize the quality of the services provided. This involves ensuring that the services display high degrees of conformance to given basic standards of care, and that the services are customized to the varying needs of each individual by providing the right amount of services at the right time. The presumption is that quality services affect customers’ quality of life, and, to some extent, can arrest the decay in customers’ overall state of health, prolonging the time customers can live independently in their own homes (i.e., effectiveness: the ultimate goal). Second, from an operational perspective, the goal is to maximize what can be done with the given resources,51 i.e. to maximize the ratio of output to input (productivity). Since home care is highly labor-intensive, this means making the most of the available caregiver resources by ensuring that the caregivers’ time is used for the activities that benefit the customers the most: FO time (home visits). Since the quality of the service is beyond its scope, this dissertation focuses on the operational component of the goal. The assumption is that maximizing what can be done with current resources leads to the maximizing of the quality of the service and its effectiveness. The author believes this assumption to be well founded, since according to my experience health professionals wish to provide the best possible care for their customers. Thus, the pursuit of continuously improving the quality is something that is naturally embedded in care services. The ability to make the most of current resources, unfortunately, is not. In addition, since the care plan determines the contents of the service and sets boundaries regarding its provision, the assumption is that improving productivity will not reduce the quality of the service as long as the services are performed according to the care plan.
51
In a publicly funded health system, the available resources depend on the budget provided, the size of which is determined by policymakers through a political process. 97
Chapter 4 Research Setting
The Goal To capsulize this twofold goal, the author chooses to use a slightly revised version of the generic definition of the goal of health services: The goal of home care is: “to maximize quality[-adjusted care] services provided to its customers, subject to budgetary constraints” (Ronen et al. 2006, p.48).
Necessary conditions EHC is subject to a set of necessary conditions, which must be satisfied in order to achieve the goal. While those related to scheduling have been noted, the following provides an overview of some other fundamental necessary conditions that define the operational boundaries of EHC. Care plan. The services determined in the care plan must be provided. The exception is during interruptions that occur, for instance, when a customer is temporarily hospitalized. In other words, all demand must be satisfied. Capacity. Laws52 and collective agreements53 impose restrictions regarding the working hours of the staff, such as the minimum and maximum lengths of shifts, as well as the maximum working hours for a given period. The caregivers are subject to a periodic working hour scheme. While the length of shifts can be adjusted within specified limits, the contract states that full-time caregivers should work 229.5h during a six-week ‘leveling’ period (the majority of caregivers work full-time54). The working hours can be freely55 scheduled for the morning or evening shift, as long as the total number of working hours is met. The morning (day) shift is prioritized, since an evening work bonus must be paid to caregivers working the evening shift. In practice, these restrictions translate into the majority of the caregivers working 8-hour shifts. In sum, the duration of shifts is largely fixed, so the total capacity during an entire shift (morning and evening) is essentially based on the number of caregivers at work. Thus, the capacity is fairly rigid throughout the shift, and cannot be adjusted according to the actual level of demand. From this it follows that EHC cannot adapt a chase capacity strategy; i.e., capacity cannot be added and reduced on the basis of fluctuations in demand.
52
The Working Hours Act The municipal collective agreement (KVTES) 54 According to EHC, the availability of part-time labor is poor, in part, because of low overall wages. 55 In reality, a sustainable human resource policy dictates that EHC has to account for caregiver preferences. 53
98
Applying TOC Concepts to Home Care
Leased labor. EHC uses leased labor to cope with high levels of absenteeism resulting from sick leave. In 2009, agreements stipulated that labor could only be leased for 6+-hour shifts. While this was changed in 2010 – caregivers can now be leased for shorter shifts – in practice, labor is leased for full (6+-hour) shifts. 4.2.3
Defining the TOC Performance Measurements
To avoid confusion, the home care performance measurements are converted into the TOC measurements. Throughput (T) = service time; the time spent interacting with customers (i.e. FO time).
Granted, this definition renders T synonymous with output. However, while the health outcome (i.e., effectiveness) may be the ultimate goal of home care, it cannot be used as an operational indicator, since the health outcome is significantly affected by factors beyond the control of EHC, such as the natural stagnation of customers’ health, individuals’ health behavior, and random events. T can therefore be seen as the contribution to the creation of health outcomes. Inventory (I) = All the time not spent producing throughput (BO time). Inventory consists of travel between locations and bench capacity, i.e., time spent at the office. Thus, inventory is the difference between capacity and throughput (Inventory=Capacity-Throughput).
Since inventory includes travel between locations, it is appropriate to distinguish the time not spent traveling. Bench Capacity (BC) = Inventory-Travel
To maintain practical relevance, T, I, and BC will often be presented as a percentage of capacity, denoted as T% and I%. Operating expense (OE) = The total cost of the system (i.e. capacity, leased labor, cars, materials & equipment, outsourced services, office leases etc.).
The bottom-line measurement of productivity (unit cost) is therefore: Productivity=
T OE
99
5 RESEARCH DESIGN
This chapter begins with a brief recap of the purpose of this dissertation, as well as the research questions and the methodology used to address them. This is followed by a review of the research process, after which the methods used to collect and analyze the data are presented and evaluated.
5.1
RESEARCH QUESTIONS
The first purpose of this dissertation is to examine the distinctive characteristics of field service processes, in order to review the applicability of TOC to this environement. As discussed earlier, the application of TOC principles to service organizations may require some modifications (e.g., Ricketts 2007; Ronen & Pass 2010; Siha 1999). Ronen & Pass (2010) explain that while “production companies are very similar to each other” (p. 849), service organizations display a higher degree of variation, for example, in terms of structure, processes, and workflow. Therefore, there are no generic solutions to the problems faced (Ronen & Pass 2010), and the different contextual characteristics play an important role. In order to extend the applicability of TOC to a wide variety of services, their unique characteristics need to be identified and TOC adapted accordingly (Ricketts 2007). With this is mind, the first research question was defined: Research Question 1: How does the structure and flow of field service processes differ from facilitybased service processes, and what are the implications for the applicability of TOC?
Research question 1 deals with contextual characteristics that serve as enablers or barriers to the application of certain TOC tools in field service operations. The second purpose of this dissertation is to apply TOC concepts to home care, in order to study what currently limits the productive use of resources. Since home care is highly labor-intensive, the primary resource is the caregiver staff. On this basis, the second research question was defined: Research Question 2: What constrains the productive use of labor in public home care?
100
Methodology
Research question 2 focuses on constraints and core problems that limit the productivity of public home care organizations. The empirical investigation of EHC seeks to answer research question 2. The contextual insight gained from this inquiry is then used in answering research question 1.
5.2
METHODOLOGY
The study is driven by a pragmatic problem in need of a solution. EHC is simultaneously experiencing both low productivity (i.e., high unit cost) and a perceived lack of caregiver capacity. In addition, future demand is expected to grow rapidly while the capacity will remain largely unchanged, because of a combination of budget constraints and poor availability of labor. As described earlier in greater depth (Section 1.8.2), this dissertation adopts a design science approach (Holmström et al. 2009; Van Aken 2004) following CIMO-logic (context, intervention, mechanism, outcome) (Denyer et al. 2008). TOC is applied to identify the constraints that limit the productive use of resources. Since, according to TOC, constraints govern the performance of the system, improving the performance of the constraints will translate into better performance of the system as a whole. As such, this represents the generative mechanism. Once the constraints have been identified, interventions that exploit or break the constraint can be designed, which, when implemented in a particular context (home care), seek to realize an outcome that is sought (improved productivity). In sum, the central research products sought are the constraints and their underlying
core
problems.
Their
identification
allows
appropriate
interventions, or general templates, to be designed for dealing with these types of constraints and core problems in the specified setting, home care. The tools used to identify and manage constraints are the 5FS (identify, exploit, subordinate, elevate, repeat) and the TP (CRT and CRD). The interventions or design propositions, on the other hand, refer to the real-life actions that enable an organization to follow these steps.
101
Chapter 5 Research Design
5.3
RESEARCH PROCESS
The study was performed as part of the PARETO56 project (2008-11), whose purpose was to find and implement new and innovative solutions and working methods that would adapt the service systems to better serve the needs of the ageing population in Finland. The project was carried out by researchers at the Institute of Healthcare, Engineering, Management, and Architecture (HEMA), in collaboration with four Finnish health service organizations, one of which was EHC. The following provides a brief overview of the research process. The research was conducted by the author, aided by the staff of EHC. Part 1: Jan 2009-Apr 2010. The research started in January 2009 with a thorough exploration of EHC. The objective was to gain a rich understanding of home care operations and their dynamics. During this initial stage, data were collected primarily using qualitative methods. In the fall of 2009, a quantitative operational analysis of EHC was conducted, which allowed quantification and measurement of the current state of affairs. This was followed by another round of qualitative research aimed at interpreting the quantitative findings. The insights gained from the research were analyzed using two thinking processes (CRT and CRD), in order to identify the core problem that was causing several UDEs and limiting productivity. These findings are presented in Chapter 6 (Findings: Part 1). Part 2: Apr 2010-Feb 2011. Based on the findings, an intervention was planned and implemented. The intervention consisted of some basic operational changes designed to improve productivity by targeting the core problem. From May 2010 to February 2011, the changes were implemented in each local unit. The author did not participate in the actual implementation, as change management was outside the scope of the study. The intervention is outlined in Chapter 7 (Intervention). Part 3: March 2011-Sept 2011. After the intervention another quantitative operational analysis was conducted (April-May 2011) to evaluate whether the intervention had had the desired effect. The qualitative research was continued in parallel to facilitate the interpretation of the new findings. Again, the new insights, including previously overlooked core problems, were used to refine the CRT. These findings are presented in Chapter 8.
56
PARETO is an abbreviation of the project’s Finnish title, and does not imply a Pareto analysis. The PARETO project was funded by the European Regional Development Fund (ERDF), one of the European Union’s funding bodies, and participating municipalities.
102
Methods
Pre-Intervention 01/2009
Intervention
Quantitative Data Samples 1 05/2010
Post-Intervention Quantitative Data Samples 2-4
09/2011
TP Analysis 04/2011
TP Analysis
Project Team Meetings (48 meetings; 140h) Observations (3 subjects; 24h) Interviews (11 informants; 33h) Group Interviews / Workshops ( 10 sessions; 24h) Figure 25. Research Process
Figure 25, shows the timeline of the research process.
5.4
METHODS
This section presents the methods used in different parts of the study to collect and analyze data. An overview of the methods is presented in Table 4. The use of multiple methods is driven by the pragmatic approach adopted in this dissertation. To acquire the in-depth systemic understanding required to perform rigorous TP analyses, the author needed to consider the perspectives of several stakeholder groups, including caregivers, foremen, management, and external home care experts. Gaining access to these perspectives involved using different approaches. Additionally, different methods enabled the researcher to test the validity of the data and findings.
103
104
Purpose
1) To identify the constraint, and 2) to analyze demand.
To evaluate the outcome of the intervention.
To compare planned vs. realized load.
To compare the performance of the local home care units, with a focus on resource allocation between local units.
Method
Load Analysis (realized load 2009)
Load Analysis (realized load 2011)
Load Analysis (planned load 2011)
Performance Analysis (realized 2011)
Table 4. Overview of the Research Methods.
4
3
2
Quantitative: operational data
Quantitative: operational data
Quantitative: operational data
Data Sample Type of Data No. 1 Quantitative: operational data
Descriptive analysis of longitudinal operational data
6-week period: February 9 th to March
Descriptive analysis of longitudinal operational data
6-week period: March 7 th to April 17th, Descriptive analysis of longitudinal 2009. The effective capacity of the local units (i.e., the number of caregiver operational data shifts per skill group, including leased labor). The data enabled productivity and the use of leased labor in local units to be compared.
6-week period: March 7 th to April 17th, 2009.
6 week period: March 7 th to April 17th, Descriptive analysis 2009. Over 20,000 hours of throughput of longitudinal operational data and 40,000 customer encounters.
22 , 2009. Over 20,000 hours of theoughput and 40,000 customer encounters.
nd
Analysis
Sample Size and Specifications
Chapter 5 Research Design
1) To gain a rich understanding of home care operations (source of qualitative data), 2) to interpret qualitative and To deepen the researchers practical understanding of home care operations by observing the service process and its intricacies first hand. 1) To develop the researchers understanding of specific topics (e.g. UDEs, certain practices, and their reasoning.), and 2) to include both internal and external perspectives. 1) To explore certain topics with larger stakeholder groups, and 2) to validate the researchers understanding of different practices and their underlying logic.
Project Team (PT) Meetings
Group interviews/ Workshops
Interviews (unstructured, open-ended)
Observation (including informal interviews)
Purpose
Method
Qualitative: memos and diagrams
Qualitative: memos and diagrams
Qualitative: memos and diagrams
n/a
n/a
n/a
Data Sample Type of Data No. n/a Qualitative: memos and diagrams
10 meetings; 24 hours
Thinking processes
Thinking processes
Thinking processes
3 subjects; 24 hours (8 hours per subject)
11 informants: 33 hours
Thinking processes
Analysis
140 hours; 48 meetings; average duration 3 hours (in addition steering committee meetings: 19 hours; 10 meetings; average duration 2 hours)
Sample Size and Specifications
Methods
105
Chapter 5 Research Design
5.4.1
Quantitative Data Collection and Analysis
The quantitative research was conducted as a descriptive analysis of longitudinal operational data. The principal component was a load analysis (capacity utilization), showing the distribution of the workload throughout the day. The main purpose of the load analysis was to examine the potential existence of resource constraints by studying whether the capacity was fully utilized at any given time. The operational data were aggregated to create a graspable visualization of the system’s load, ensuing from the workload of each caregiver’s individual service process. Load analyses representing the actual realized situation were performed both prior to and after the intervention. After the intervention, however, the planned load and the realized load were analyzed separately. The purpose was to evaluate the effect of the intervention on 1) the planned load, and 2) the realized load, in order to examine whether the caregivers had, in fact, operated according to plan. Also, following the intervention, and the realization of new core problems, the need to compare operational aspects not covered by the load analysis emerged. The focus was a comparison of the performance of local units, as well as the allocation of resources between them. Data Collection Data were collected and combined from two separate information systems. Data about the services (throughput; both planned and realized) were extracted from the electronic medical record (EMR), while data regarding the capacity were extracted from the workforce planning and accounting system (WPA). The EMR data consist of visit information, which the caregivers are lawfully required to enter into the EMR within a few days of the encounter. Three separate data samples were extracted from these two sources, each sample comprising a six-week period. Before the longitudinal coverage of the final samples was decided on, a larger 24-week (Feb 9th to July 26th, 2009) test sample of the visit data (EMR) was examined. The test sample showed a low degree of weekly variation in throughput (SD 7%). In collaboration with EHC’s management, it was therefore concluded that a shorter time period was adequate to illustrate the home care operations with sufficient accuracy. The decision to narrow down the data sample was motivated by the need to process the data to eliminate human errors and inconsistencies. For instance, 106
Methods
since data points such as the start and end times of a visit are entered manually by the caregivers, some errors are inevitable. The data were processed by three members of the EHC staff, assisted by the author. Because of the limited time, as well as the fact that it was not considered that extending the time period would markedly improve the reliability of the analysis, the data sample was narrowed down to comprise six consecutive weeks. The samples used for the load analyses, both before and after the intervention, consisted of more than 40,000 visits and 20,000 hours of throughput. Thus, the sample size was large enough to render the effect of possible remaining errors minimal. The choice of a six-week period was motivated by the fact that the caregivers’ shifts (i.e., capacity) are planned in three-week periods. In order to combine the capacity data with the visit data for the same period, a multiple of the three-week planning period had to be selected. Hence, data samples of six consecutive weeks were chosen. Data Samples The following describes the data samples used in different parts of the study. Data Sample 1&2. The first two data samples, used to analyze the actual realized load, were collected both before and after the intervention. The preintervention sample ranged from Feb 9th to March 22nd, 2009, and the postintervention sample ranged from March 7th to Apr 17th, 2011. Below is a list of key attributes included in the samples: x
The timing and duration of customer visits (and other customer encounters).
x
The local home care unit and specific caregiver who performed the service.
x
Service type; e.g., regular home visit, evaluation visit, delivery of meal/groceries, support service (e.g., sauna) etc.
x
Service/dependency category. The amount of service received monthly depends on the customer’s dependency category, and services are performed within the frame of the specified dependency category. This attribute makes it possible to distinguish whether the service is provided to a temporary or a continuous home care customer, and to which dependency category a continuous customer belongs (e.g., 04h/month, 5-10h/month etc.).
107
Chapter 5 Research Design
x
Total capacity; the timing and duration of caregiver shifts, including breaks. This data sample did not specify the skill group of particular caregiver shifts.
Data Sample 3. The third data sample, used to analyze the planned load and compare it with the realized load (data sample 1), was only collected and analyzed after the intervention (March 7th to Apr 17th, 2011). Except for the exclusion of capacity data, the sample contained the same attributes as data samples 1 & 2. Data Sample 4. The fourth sample, used to compare the performance and resource allocation of the local units, was only collected and analyzed after the intervention (March 7th to Apr 17th, 2011). Unlike the previous data samples 13, which could be automatically extracted from the previously mentioned data repositories, parts of sample 4 had to be extracted manually. This was carried out by two members of EHC’s staff, following specifications provided by the author. The key attributes included in the sample were: x
Local unit
x
Own capacity (from data sample 2)
x
The leased labor capacity per local unit
x
Total daily throughput (from data sample 2)
5.4.2
Qualitative Data Collection and Analysis
The qualitative research was conducted to attain a rich understanding of home care operations. The objective was to build a thorough comprehension of EHC’s social dynamics, its challenges, problems (i.e., UDEs), and their relationships. The insights gained were used as inputs in the TP analyses, the focus of which was to identify the core problems that hampered the organization’s performance. Several methods were employed to collect the data; each one is described below. The mixed methods and data sources, both quantitative and qualitative, allowed triangulation to check the validity of the findings. For instance, the quantitative analysis permitted certain qualitative findings to be discarded as common misperceptions, rather than facts (e.g., although thus considered by many caregivers, the average duration of visits is not longer in the afternoon than in the morning). Vice versa, the qualitative findings helped in the interpretation of the quantitative results. 108
Methods
The qualitative data were documented in the form of memos and diagrams (Corbin & Strauss 2008), focusing on different themes, such as prevailing UDEs, different practices, and the reasoning behind them. Because of the longitudinal length of the study and the richness of the inquiry, data were recorded in much greater detail in the early phases of the study, to ensure that no crucial aspects were overlooked. However, as the study progressed and the author’s understanding of home care operations deepened, the data recording was modified so as to focus only on relevant new insights, such as different aspects of practices and policies and the reasoning behind them. This was motivated by the desire to separate the abundant noise from the important issues in order to focus on the critical factors (e.g., UDEs). Additionally, a saturation point was reached, after which few new insights were acquired relative to the time spent collecting data. Project Meetings The core component of the qualitative methods was regular meetings with the members of the project team (PT), held monthly, weekly, and, in some instances, even on a daily basis, depending on the current phase of the study. The PT acted both as a primary source of qualitative data and an interpreter of other qualitative data gathered by the author. Between January 9th 2009 and September 23rd 2011, a total of 140 hours of PT meetings were held (48 meetings; average duration 3h). The PT originally (Jan 2009-Apr 2010) consisted of seven members, including the Head of EHC, a service manager, the main user of the EMR, a financial planner, an IT system specialist, and the researcher. Five of the team members had prior experience of working as caregivers in EHC, and thereby a comprehensive understanding of the system from a health professional’s perspective. In May 2010, just before the intervention, the team was expanded to incorporate two caregivers. Their inclusion extended the vertical coverage of the team, ensuring the representation of all relevant perspectives, top-tobottom. For the researcher, being able to discuss different topics with a core group of people who were both “up to speed” regarding the developments and represented different views was a great advantage. It enabled the researcher to discuss different topics with a limited number of individuals without neglecting any focal stakeholder group’s point of view. The PT was instituted by management to act as the main agent of change. The PT and the author engaged in interactive collaboration to solve the problem of 109
Chapter 5 Research Design
low productivity. As such, the team helped interpret data and check and verify the logic of the TP (i.e., the existence of entities and their causal relationships), and participated actively in designing the intervention. Furthermore, wihtout the author being involved, the PT was in charge of implementing the intervention throughout the organization. The work of the PT was supervised by a steering committee. It consisted of senior officials (i.e., top management) from Espoo, including the director of health and welfare, the director of services for the elderly, the director of finance and administration, and a union steward, as well as the original members of the PT. The steering committee meetings enabled the researcher to discuss and gather insights regarding higher-level policy issues, such as the position of home care in the wider spectrum of Espoo’s health and welfare service and staffing policy. A total of 19 hours of steering committee meetings were held (10 meetings, average duration 2h). Observation Ethnographically inspired observations (e.g., Sørensen & Pica 2005) of daily routines were performed to deepen the researcher’s practical understanding of EHC’s operations by observing the service process and its intricacies at first hand. According to Pope et al. (2002, p.149), observation “allows researchers to uncover everyday behaviour rather than relying only on interview accounts[…]and can be especially useful in uncovering what really happens in particular healthcare settings”. The researcher observed the work of three staff members, two caregivers and one foreman, by following each one around for an entire shift. The observations were non-participatory, i.e., the researcher did not actively engage in the activities being performed during home visits, but acted as a passive observer, recording the sequence and nature of the events (e.g., the timing, type and duration of visits, travel time, exceptions to the plan, office activities etc.). In between the home visits, the staff members were informally interviewed to get an overview of daily operations, the reasoning behind certain practices, and challenges and problems that were currently being experienced. According to Wolcott (1997, p.161), “informal interviewing – that is, interviewing that does not make use of a fixed sequence of predetermined questions – is possible because the [researcher] is the research instrument”. Bailey (1996, p.72) defines the informal interview as “a conscious attempt by the researcher to find out 110
Methods
more information about the setting of the person”. Groenewald (2004, p.47) notes that “the [informal] interview is reciprocal: both researcher and research subject are engaged in the dialogue”. The opinion of (Wolcott 1997, p.161) is that informal interviews “facilitate getting information from people reluctant to provide a structured interview but willing to talk casually to a neutral but interested listener”. The small sample size of the observations (3 subjects for a total of 24 hours) was motivated by the fact that it was a complementary rather than a principal method of data collection, aimed at familiarizing the researcher with daily operations. The observations were carried out during the earliest phase of the study and helped point the researcher towards particular areas of interest, such as the UDEs experienced by the caregivers. Interviews Interviews were used to develop the researcher’s understanding of specific topics that had surfaced throughout the investigation. A total of 33 hours of interviews were conducted with 11 informants, 5 of whom were interviewed multiple times. The informant included both internal experts and external experts. The majority of the informants (9/11) were internal experts representing different stakeholders of EHC, such as caregivers, management, and administrative staff. The external informants (3/11) included the head of a similarly sized Finnish home care organization, a development expert from yet another slightly smaller Finnish home care organization, and the Health and Wellness Director of a publicly owned municipal development agency, who had played a key role in several earlier development projects in different home care organizations. The interviews with the internal experts sought to enhance the researcher’s comprehension of different aspects of EHC. The external experts contributed with insights regarding current problems faced by Finnish home care organizations in general. Held at later stages of the inquiry, these interviews provided an opportunity to reflect and compare the findings gathered from EHC (e.g., UDE’s, operational practices, staffing, etc.) with home care in general. Driven by the problem-solving nature of the inquiry, unstructured, open-ended interviews were used. Robson (2011, p.280) characterizes an unstructured interview as one where “the interviewer has a general area of interest and concern but lets the conversation develop within this area”. According to 111
Chapter 5 Research Design
Sommer & Sommer (1992, p.108), this method is appropriate when exploring “all the alternatives in order to pick up information, to define areas of importance that might not have been thought of ahead of time, and to allow the respondent to take the lead to a greater extent”. They explain that the unstructured interview “leaves room for improvisation” (p. 108). While the interviewer may have a general topic in mind, the sequence and specific wording of questions are not predetermined. Group Interviews and Workshops Unstructured, open-ended group interviews, as well as workshops, were used to explore certain topics with larger stakeholder groups, as well as to validate the researcher’s understanding of different practices and their underlying logic. The group interviews involved 10-15 informants, evenly divided between foremen and caregivers in both skill groups 1 and 2. The group interviews covered lower-level topics, such as the particular types of visits and their timecriticality, scheduling, and office activities. In addition, the caregivers were asked to provide an exposition of their typical day, including the sequence of events. Two three-hour group interviews were conducted during the first part of the study (Spring 2009). Workshops were predominantly held with foremen and management, and involved 20-25 participants. During the early stages of the study the workshops focused on discussing current problems and practices. The workshops were further used to communicate findings and the progress of the research project to the foremen. After the intervention, the focus of the workshops shifted from a descriptive mode (problem definition) to a prescriptive mode (solution). On the basis of the post-intervention findings, the participants were divided into smaller groups of 4-5 individuals and assigned the task of developing potential solutions to current problems, such as scheduling and poor resource allocation. A total of 10 workshops were held with a combined duration of 24 hours. The findings were presented by the researcher and discussed for validation purposes on four separate occasions, once before and three times after the interventions. The pre-intervention findings were presented at the National Home Care Congress in the City of Tampere (April 14th, 2010), to an audience of approximately 300 home care professionals and related stakeholders from around Finland. The post-intervention findings, including a simplified version
112
Evaluation of the Study
of the CRT, were presented to the entire staff of EHC, divided between three events, each with approximately 100 participants. Thinking Process Analysis The insights and contextual understanding gained from the qualitative data collection (227 hours in total) were used as an input in the TP analysis. The data collection provided “adequate intuitive knowledge about the system”, enabling the researcher to “recognize and understand patterns in [the] system” (Dettmer 1997, p.88). In accordance with research question number 2, the scope of the TP was restricted to factors limiting the productive use of labor. The TP tools used were the CRT and CRD, presented in Sections 2.5.4 and 2.5.5, respectively. Each TP was constructed by the researcher and tested for validity using the CLR. The validation was performed in collaboration with the PT and the director of Espoo’s services for the elderly on separate occasions.
5.5
EVALUATION OF THE STUDY
This section discusses the validity and reliability of the research methods and data. 5.5.1
Quantitative Data and Analysis
Regarding the analysis of quantitative operational data, validity refers to how well the variables (throughput and capacity) measure what they are supposed to. Reliability relates to the replicability of the results. (e.g. Yin 1994) A load analysis (e.g., Ronen et al. 2006) is used to identify whether a resource constraint exists at some point during the day. The load consists of throughput plus travel, which is compared with the available capacity at different points in time. Throughput consists of the actual timing and duration of customer encounters, as entered by the caregivers into the electronic medical record. Because data entry is done by hand, the possibility of error exists. As explained earlier, major errors were identified and corrected by EHC under the supervision of the author before the data were analyzed. Because of the large sample size, the effect of any remaining errors remains negligible. Since the exact timing of travel was not available, the distribution of travel is based on an estimate. It stands to reason that the distribution of travel time is roughly proportional to the number of home visits performed. Since the 113
Chapter 5 Research Design
correlation between the number of visits and throughput is significant (correlation coefficient 0.9932), one can infer that the distribution of travel time is also roughly proportional to throughput. The greater the throughput, the more travel is required. Thus, the distribution of travel time (12% of capacity) was estimated to be directly proportional to throughput. At an aggregate level, this assumption is argued to be accurate enough for the purpose of identifying possible resource constraints. Data on capacity were extracted from the workforce planning and accounting system. Since these data are entered semi-manually by the foremen, they too may be exposed to human error. Since this information is used for calculating salaries, it had to be assumed that the data were correct. Since the data on throughput and capacity were extracted directly from the electronic databases, in general, it is argued that the reliability of the data is good. The only issue limiting the reproducability stems from the review and correction of obvious data entry errors (all encounters with a duration longer than 150 minutes were reviewed, and, where necessary, revised). 5.5.2
Qualitative Data and Analysis
In qualitative research, the quality of the research methods is often evaluated along the dimensions of construct validity, internal validity, external validity, and reliability (e.g., Yin 1994; Voss et al. 2002). Construct validity concerns the ability of the operational measures to reflect the concepts that are studied. Using multiple sources to establish a chain of evidence and letting key informants review and verify early drafts and findings are recommended ways of improving construct validity (e.g., Yin 1994; Voss et al. 2002). As illustrated earlier, several sources of information were used, including both internal (EHC) and external informants. Multiple sources and means of data collection enabled triangulation to be performed (Voss et al. 2002). The process helped to define and refine the entities used in the thinking processes, ensuring that the entities correctly describe the reality. Special care was given to portraying the entities as accurately as possible while maintaining conciseness. Both the preliminary and final findings were presented, discussed, and reviewed with several internal (e.g., PT) and external home care professionals on numerous occasions, providing a loop of feedback. Internal validity expresses the extent to which the claimed causal relationships exist in reality (e.g., Yin 1994; Voss et al. 2002) . The cause-and-effect 114
Evaluation of the Study
relationships were originally derived by the author using the intuition gained from longitudinal, in-depth field research (e.g., Scheinkopf 1999). Their credibility was examined using the categories of legitimate reservation (CLR) (Section 2.5.3), first by the author and later with key informants on separate occasions. It is argued that this validation process reduced the risk of erroneously considering indications of relationships to be factual causalities (Yin 1994). External validity refers to the generalizability of the findings beyond the specific case that was studied (e.g., Yin 1994; Voss et al. 2002). Because of both the problem-solving and the longitudinal, in-depth nature of this explorative study, only one organization was studied. As such, this research does not purport to be readily generalizable to other contexts. However, on the basis of presentations for external experts and discussion with them, the phenomena and the underlying counterproductive policies and practices identified here appear to be quite common in home care in Finland. These limitations will be discussed further in Section 9.4. Again, reliability relates to the extent to which the study is reproducable with similar findings, given the same research material and tools (Yin 1994; Voss et al. 2002). The use of a research protocol and the gathering of research material in a database are viewed as appropriate means of ensuring the reproducability of the research (e.g., Yin 1994). While the research material was not kept in a database, the memos and diagrams were stored for possible later use. Given the nature of the thinking processes, “[…] which blend basic scientific method with powerful intuition […]” (Scheinkopf 1999, p.45), a certain degree of interpretation is always involved. The CLR, however, “[…] enable us to evaluate the logic of others” (Dettmer 1998, p.57), and should therefore also help in the reconstruction of their logic and findings.
115
6 ANALYSIS & FINDINGS: PART 1
This chapter discusses the findings of the research conducted prior to the intervention. The chapter begins by presenting the identification of a peak time resource constraint. This is followed by a review of peak time demand, focusing on the relative load induced by different dependency categories. On the basis of the findings, it is argued that a great deal of service is provided unnecessarily during peak time. A TP analysis is used to determine a policy constraint, or core problem, giving rise to the peak time resource constraint. A CRT is used to show how a current practice leads to reduced productivity by creating a situation which inhibits the organization’s ability to make better use of its own labor. A CRD analysis is then performed to surface a false assumption behind the practice.
6.1
IDENTIFYING THE CONSTRAINT
Following the 5FS, the first step is to identify the constraint. A load analysis was conducted to examine whether EHC was subject to a resource constraint. The load analysis compares the service time provided, or throughput, with the available capacity (including leased labor), during the course of a day. A peak time resource constraint exists if capacity is fully utilized during peak time, while excess capacity exists at other times (e.g., Ronen et al. 2006). 6.1.1
The Existence of a Peak Time Resource Constraint
Figure 26 shows the load distribution throughout the day. The upper limit of the figure displays the capacity. Load, or utilization, here refers to the combined workload attributed to throughput and travel between locations. While throughput represents the time spent interacting with customers (i.e., valueadding time), travel is akin to the inevitable setups needed to provide throughput. Thus, travel is an integral part of the workload associated with the field activities.
116
I ntify Iden fying g th he Con C straaint
Throughput
Estimated Travel
Bench Capacity
7000 6000
Time (h)
5000 4000 3000 2000 1000 0 7:00 8:00 9:00 10:00 11:00 12:00 1:00 2:00 3:00 4:00 5:00 6:00 7:00 8:00 9:00 AM AM AM AM AM PM PM PM PM PM PM PM PM PM PM n ).577 Figurre 266. L Load d An nalyssis (6-w ( week k perriod d: Feeb 9tth to Maarch h 22nd
Both B h tthe disstributtion n of o thro t ougghp put and cap c pacity aree baaseed on o cuumuulati tive oper o rationaal datta fro om a siix-w weeek period. Th he diffferren nce beetw ween n tthe th hro ough hpuut aandd avvailaablee caapaacityy seeem ms to t be b welll eexpllainned byy th he estim e matted distr d ribuutio on oof ttravvel. ut tem t lo A siigniificcantt bu mpo orarry p peaak iin the oad can n b be notted in n th he mo m rnin ng, ng aro ound 9 a..m. Ro hpu cuulm minaatin ougghlyy half of thee daily d y th hroough ut is i prod p ducced ort 2-33-hourr timee w winddow w. In I oth Figuuree 266 sh durin d ng a sho o her wo ordss, F how ws thee me no ad ex xisttencee of a ppeak k time ti e reesouurce constrrainnt; durringg p peaak tim ddiition nal n be gene withoutt in t afftern th hro ough hpuut ccan g eratedd w ncreeasiing caapaccityy. IIn the noo on, HC C iss subjjectt to marrkett consstraaintt, sinc how h weveer, EH o a m s ce cap paciity exxceeeds dem d mandd. peakk has mpliicattion The T deemaandd p h tw wo m majjor im ns. Firrst, a peaak tim me ressourrce mits thee orgganiizattion’s aabiliity tto seerve more custo wheen futu f ure deemaand consstraaintt lim c omeers w ojeccted me ho in ncreeases as pro d. Bec B causse of thee timee-criiticcalitty, som omee caare vissits orm me an ostp mus m st b be peerfo med duurin ng peeak tim nd can nno ot be po pon ned d to o tthe Acco ord g erall ruule of thuum mb, thee hiigheer tthe afterrno oon. A dingg to o th he sstafff, as a gene o cus m e tim depe d enddency ratiio of c stom merrs, thee more me-criitical thei t ir vvisitts will w bee. T The mberr of in cuurrentt trendd iss to o reeduuce thee nuum ndivviduuals in n innstiituttion nal carre aand omees, a sh t iincrrease the seervvice ho hiftt th hat is llikeely to t e am mouunt off moree deependeent
577 Th ncreease in cap overrlap he sslighht in pacitty eearlyy in thee afftern noon n iss duue to t thhe o p beetweeen the s fts. morn m ningg andd evveniing shift
117
Chapter 6 Analysis & Findings: Part 1
customers in home care. Thus, future demand can be expected to increase the load more in the morning than at other times. Second, since all demand must be satisfied, and the capacity is rigid and cannot be reduced during a shift as demand falls, the peak time load determines the minimum level of capacity required for an entire shift. A concentration of demand in the morning consequently increases the level of capacity (temporarily) needed, while increasing excess (bench) capacity in the afternoon, reducing productivity. In other words, since the peak time load determines capacity requirements, and capacity is the largest operating expense, the peak time load largely defines operating expense. An increase in the peak time load will directly increase operating expense. Then again, a reduction in the current peak time load presents the opportunity to either reduce capacity (and operating expense), or, alternatively, to serve a greater number of customers (increased demand). Either way, the peak time load is a lever that governs productivity. On the other hand, outside peak hours, EHC can cope with a significant increase in demand without increasing capacity. There remains significant excess bench capacity in the afternoon, even though (in the current operational model), some time must be left for back office activities, such as charting, meal and grocery orders, and occasional meetings. 6.1.2
Pre-Intervention Performance
Table 5 presents the values of the operational indicators for the six-week period that was studied prior to the intervention. Based on the estimated theoretical maximum T% of 60-65%, and a prevailing T% of 39%, the excess capacity was roughly 21-24%.
118
Identifying the Constraint Table 5. Pre-intervention performance (6-week period: Feb 9th to March 22nd).
6.1.3
Indicator Throughput (T%) Inventory Total Capacity Throughput (T)
Value 39.6% 60.4% 54855h 21726h
Esimated Bench Capacity 1,2 Leased labor1 Number of Encounters Number of Customers
48.4% 4.2% 43354 2438
1
percent of capacity
2
bench capacity=inventory-estimated travel
Analyzing Peak Time Demand
In the light of the demand peak, it was meaningful to analyze whether the concentration of throughput in the morning was based on time-critical customer needs, or merely operational practice (i.e., a policy constraint). Since non-time-critical visits can be flexibly scheduled for times of lower demand, the researcher sought to investigate whether the demand peak included nontime-critical visits that could be postponed to elevate the peak time load. As no quantitative data on time-criticality were available, an approximate indicator had to be devised. According to the staff, the more service customers need, the more time-critical visits their care plans will include. Put differently, in general, the number of time-critical visits increases with the level of dependency; higher dependency categories include more time-critical visits. For instance, highly dependent customers typically need assistance with morning activities (e.g., getting out of bed, morning routines, breakfast, and medication), requiring the presence of a caregiver. Conversely, visits to customers receiving less than 10 hours of service per month (i.e., dependency categories 1 and 2), are generally less timecritical. These customers typically do not receive care every day. It can be argued that if a customer does not need assistance on a daily basis, then it is unlikely that the assistance, once received, is time-critical.58
58
The exceptions to the rule are occasional blood samplings, which either for medical or operational reasons need to be performed in the morning. Medical reasons are, for example, blood sampling that must be done prior to breakfast. Operational reasons are, for instance, induced by laboratory office hours; the caregiver needs to get a sample to the laboratory before noon. 119
Chapter 6 Analysis & Findings: Part 1
On the basis of this assumption, the lower dependency categories’ share of the total peak time throughput was used as an approximate indicator of non-timecritical services performed during peak time. These categories include temporary customers and regular customers receiving only 0-4 and 5-10 hours of service on a monthly basis. 5000 4500
Throughput (h)
4000 3500 3000 2500
Other
2000 1500
43% of peak time throughput (8-10 a.m.) 5-10h
1000 500
0-4h
0 7:00 8:00 9:00 10:00 11:00 12:00 1:00 2:00 3:00 4:00 5:00 6:00 7:00 8:00 9:00 AM AM AM AM AM PM PM PM PM PM PM PM PM PM PM Temporary Customers
Figure 27. The relative load contribution of different dependency categories throughout the day (2009).
Figure 27 shows that the throughput attributed to the two lower dependency categories constitutes 43% of total peak time throughput. In other words, services assumed to be largely non-time-critical contribute heavily to the peak time load. This indicator is approximative, and provides an order of magnitude regarding the share of non-time-critical visits of the peak time load. As displayed in Figure 27, non-time-critical demand makes up more than a third of the total peak time load. From this it can be inferred that the peak time load, and consequent peak time resource constraint, is induced by poor operational practice (policy constraint) rather than actual timecritical demand. The researcher therefore proceeded to investigate what policy or operating procedure caused the load to accumulate in the morning.
6.2
THE CORE PROBLEM
On the basis of both the quantitative and qualitative insights, a CRT was constructed in order to identify the core problem that was causing several UDEs (e.g., artificially high peak time load), ultimately leading to low 120
The Core Problem
productivity. The understanding gained from the qualitative data collection enabled the researcher to construct the entities59 and derive their cause-andeffect logic. 6.2.1
Undesirable Effects (UDEs)
The process of constructing a CRT begins with the identification of UDEs, symptoms reflecting the fact that the system is not performing as well as it could (e.g., Dettmer 1997). The pre-intervention research enabled seven UDEs, listed in an arbitrary order, to be identified. UDE#1. The ratio of throughput to labor capacity (T%) is poor. This was the starting point of the investigation. T% expresses the organization’s ability to make the most of its current resources. It is directly linked to the bottom-line productivity measurement of unit cost, determining how much throughput is provided with the current resources, as measured by operating expense (i.e. T/OE). At 35%, T% is low by both domestic and international standards. Since the pragmatic purpose of this study was to design a way of increasing productivity, it is worth noting that T% can be increased in three ways: 1) by providing more T with the current capacity. This can be done by serving more customers, i.e., providing the current level of care to a larger customer base (demand is projected to increase). Alternatively, more services can be provided to the current customers, entailing a higher level of care. This would need to be justifiable by health professionals, and it is an unlikely development in the light of a projected increase in demand and future economic viability. Finally, some currently outsourced services (e.g., home care for disabled citizens) could be handled by EHC. This, however, is also an unlikely change, since outsourcing is done for strategic purposes; 2) by providing the current level of T with less capacity, which means either reducing EHC’s own staff, eliminating the use of leased labor to cope with peak time shortages (UDE#4 below), or both. Reducing the reliance on leased labor is a development pursued by top
59
Entities are elements of a particular situation, such as a UDE or any other prevailing condition (Scheinkopf 2010). 121
Chapter 6 Analysis & Findings: Part 1
management.60 Laying off staff, however, is sought to be avoided for long-term strategic purposes. These are, for example, poor overall workforce availability and the recognition that demand will increase as projected. It is noteworthy that the decision not to reduce the number of EHC’s own staff markedly reduces the short-term ability to increase T%, since leased labor only represents a relatively small share of capacity; 3) both of the above. The development sought by EHC is to let rising demand account for an increase in T, while simultaneously reducing leased labor capacity. UDE#2. Many visits are needlessly scheduled in the morning. On the basis of the quantitative findings (Section 6.1.2), many non-time-critical visits are performed during peak time. This finding was further corroborated by the caregivers, who admitted that non-time-critical visits are predominantly scheduled on the basis of geographical proximity, so as to minimize travel. For example, following a time-critical visit at a certain location, the caregiver typically seeks to visit other customers living nearby to “improve efficiency” by reducing travel time. UDE#3. The caregivers are subject to stress during peak time Stress is conceived by the caregivers as perhaps the greatest problem. During peak time the caregivers rush to perform a large number of visits within a short period of time. A commonly surfaced concern among the caregivers was that stress forced them to spend less time with their customers than they should, compelling the caregivers to rush through their tasks. According to the staff, this reduces the quality of the service. One frequently encountered motivation and claim was that customer loneliness is a common concern, and that “treating” it through social interaction enables customers to remain living in their homes longer. According to the head of EHC, one of the most common sources of customer complaints is that they receive less service time than their care plan stipulates. On the basis of both interviews and informal discussions with external experts, stress during rush hours is a widespread problem in home care. Caregiver stress has previously also been recognized as a problem in the literature (e.g., Eveborn et al. 2009).
60
Top management refers to the consensus of high-ranking officials (above home care in the organizational hierarchy). These insights were gathered through steering committee meetings and interviews with individual steering committee members.
122
The Core Problem
UDE#4. A high level of absenteeism causes many shortages. At roughly 8% of capacity (2009), the level of absenteeism as a result of sick leave is high, and causes many shortages. Therefore, achieving design capacity requires the use of leased labor. According to the foremen, absenteeism is partially caused by stress which makes the caregivers feel overworked. Eveborn et al. (2009) report a considerable decline in short-term sick leave in a home care setting following a reduction of caregiver stress. Although this suggests that the foremen’s conjecture of causality between stress and absenteeism may be likely, this assumption is not incorporated in the CRT, as the causes of absenteeism were outside the scope of this study. UDE#5. External labor is leased to cope with capacity shortages. As illustrated earlier in Figure 26, roughly 50% of the entire daily throughput is produced within a three-hour time window. The considerable peak in demand means that a great deal of capacity is needed for a relatively short period of time, during which capacity is fully utilized and becomes a constraint (even with the addition of leased labor). Thus, absent caregivers are often replaced by leased labor to cope with temporary shortages during peak time. UDE#6. Significant bench capacity exists in the afternoon Since the peak time load determines the minimum level of capacity required for an entire shift (Section 6.1.1), and demand is concentrated in the morning, capacity remains largely unchanged as demand drops in the afternoon. UDE#7. Leasing labor increases bench capacity in the afternoon Although leased labor is only needed temporarily during peak time, labor can (currently) only be leased for longer shifts (minimum 6 hours), adding to the bench capacity in the afternoon. 6.2.2
Current Reality Tree (CRT)
This section presents the pre-intervention CRT. Figure 28 provides an overview of the CRT, which is broken down into different parts. For the purpose of simplification, each part is shown and described separately (Fig. 2932). Certain entities are included in several parts, as illustrated by the overlapping frames. Reading from the bottom up, part 1 describes the core problem, while parts 2 & 3 illustrate subsequent branches of cause-effect relationships. Part 4 then connects these branches, showing how the core problem ultimately leads to the undesirable outcome of low productivity. 123
Chapter 6 Analysis & Findings: Part 1
Part 4 (Fig. 32)
4-3. Productivity is low
4-2. Unit cost (T/OE) is high
4-1. Labor capacity is the largest operating expense
3-2. Leasing labor increases operating expense
UDE#7. Leasing labor increases bench capacity in the afternoon
UDE#6. Significant bench capacity exists in the afternoon
3-4. Extra (leased) capacity is only needed for a few hours in the morning
3-3. Leasing labor increases the capacity of an entire shift UDE#5. External labor is leased to cope with capacity shortages
UDE#1. The ratio of throughput to labor capacity is poor
2-3. The capacity for an entire shift is fixed on the basis of peak time demand requirements
NC#3. Labor can only be leased for full (6+hour) shifts
2-2. The level of capacity currently required to meet morning demand is artificially high
3-1 Any level short of design capacity is perceived as a shortage that must be filled to cope with peak time demand
UDE#4. A high level of absenteeism causes many shortages
Part 2 (Fig. 30)
2-1. The demand peak in the morning is artificially magnified
NC#2. Capacity can not be reduced during a shift as demand falls
NC#1. All demand must be satisfied
UDE#3 . The caregivers are subject to stress during peak time even with full (design)capacity 1-6. Demand drops significantly in the afternoon 1-5. Few visits are left for the afternoon
Part 3 (Fig. 31)
UDE#2. Many visits are needlessly scheduled in the morning
1-3. Many non-timecritical visits are scheduled in the morning
1-2. Visits to nearby customers are scheduled consecutively irrespective of time-criticality to save travel
1-4. Non-time-critical visits need not be scheduled in the morning
1-1. Many are many time-critical visits in the morning
Part 1 (Fig. 29)
Figure 28. Overview of the pre-intervention CRT.
Part 1 The first part of the CRT (Fig. 29) demonstrates how the core problem (1-2) of minimizing travel to improve efficiency causes many non-time-critical visits to be scheduled during peak time (UDE#2). As previously illustrated (Section 6.1.1), this creates an artificially high load in the morning, which in turn increases the peak time capacity requirement. Since demand drops in the afternoon, while capacity remains unchanged, overall efficiency is reduced. Thus, the practice of minimizing travel is an “efficiencies syndrome” (Ronen et al. 2006, p.144).
124
The Core Problem
1-6. Demand drops significantly in the afternoon
1-5. Few visits are left for the afternoon
UDE#1. Many visits are needlessly scheduled in the morning
1-3. Many non-time critical visits are also scheduled in the morning
1-2. All visits to nearby customers are scheduled consecutively irrespective of time-criticality to save travel
1-4. Non-time critical visits need not be scheduled in the morning
1-1. There are many time-critical visits in the morning
Figure 29. CRT, part 1.
Figure 29 reads: if there are many time-critical visits in the morning (1-1), and all visits to nearby customers are scheduled consecutively irrespective of time-criticality to save travel (12), then many non-time-critical visits are also scheduled in the morning (1-3). If many nontime-critical visits are also scheduled in the morning (1-3), and non-time-critical visits need not be scheduled in the morning (1-4), then many visits are needlessly scheduled in the morning (UDE#1). Because many visits are needlessly scheduled in the morning (UDE#1), few visits are left for the afternoon (1-5). Because few visits are left for the afternoon (1-5), demand drops significantly in the afternoon (1-6). Part 2 Part 2 of the CRT (Fig. 30) illustrates how the UDE (#2) of non-time-critical visits being scheduled during peak time leads to significant bench capacity in the afternoon (UDE#6). Starting from UDE#2, part 2 of the CRT reads:
125
Chapter 6 Analysis & Findings: Part 1 UDE#6. Significant bench capacity exists in the afternoon
1-6. Demand drops significantly in the afternoon (Part 1)
2-3. The capacity for an entire shift is fixed on the basis of peak time demand requirements
2-2. The level of capacity currently required to meet morning demand is artificially high
2-1. The demand peak in the morning is artificially magnified
NC#2. Capacity cannot be reduced during a shift as demand falls
NC#1. All demand must be satisfied
UDE#2. Many visits are needlessly scheduled in the morning (Part 1) Figure 30. CRT, part 2.
Because many visits are needlessly scheduled in the morning (UDE#1), the demand peak in the morning is artificially magnified (2-1). If the demand peak in the morning is artificially magnified (2-1), and all demand must be satisfied (NC#2),61 then the level of capacity currently required to meet morning demand is artificially high (2-2). If the level of capacity currently required to meet morning demand is artificially high (2-2), and capacity cannot be reduced during a shift as demand falls (2-6), then the capacity for an entire shift is fixed on the basis of peak time demand requirements (2-7). If the capacity for an entire shift is fixed on the basis of peak time demand requirements (2-7), and demand drops significantly in the afternoon (1-6), then significant bench capacity exists in the afternoon (UDE#6). Part 3 Part 3 of the CRT (Fig. 31) demonstrates how the UDE (#2) of non-timecritical visits being scheduled during peak time leads to the use of leased labor, which translates into both increased operating expense and bench capacity in the afternoon. Part 3 reads:
61
NC denotes a necessary condition.
126
The Core Problem 3-2. Leasing labor increases operating expense
UDE#7. Leasing labor increases bench capacity in the afternoon
3-3. Leasing labor increases the capacity of an entire shift
UDE#5. External labor is leased to cope with capacity shortages
3-4. Extra (leased) capacity is only needed for a few hours in the morning
NC#3. Labor can only be leased for full shifts
1-6. Demand drops significantly in the afternoon (Part 1)
3-1 Any level short of design capacity is perceived as a shortage that must be filled to cope with peak time demand
UDE#4. A high level of absenteeism causes many shortages
UDE#3 . The caregivers are subject to stress during peak time even with full (design) capacity
UDE#2. Many visits are needlessly scheduled in the morning (Part 1) Figure 31. CRT, part 3.
Because many visits are needlessly scheduled in the morning (UDE#2), the caregivers are subject to stress during peak time even with full (design) capacity (UDE#3). If the caregivers are subject to stress during peak time even with full (design) capacity (UDE#3), and a high level of absenteeism causes many shortages (UDE#4), then any level short of design capacity is perceived as a shortage that must be filled to cope with peak time demand (3-1). Because of this, external labor is leased to cope with capacity shortages (UDE#5), and leasing labor increases operating expense (3-2). If external labor is leased to cope with capacity shortages (UDE#5), and labor can only be leased for full (6+-hour) shifts (NC#3), then leasing labor increases the capacity of an entire shift (3-3).
127
Chapter 6 Analysis & Findings: Part 1
If any level short of design capacity is perceived as a shortage that must be filled to cope with peak time demand (3-1), and demand drops significantly in the afternoon (1-6), then extra (leased) capacity is only needed for a few hours in the morning (3-4). If leasing labor increases the capacity of an entire shift (3-3), and extra (leased) capacity is only needed for a few hours in the morning (3-4), then leasing labor increases bench capacity in the afternoon (UDE#7). Part 4 Part 4 of the CRT (Fig. 32) connects the previous parts, demonstrating how the core problem ultimately impairs productivity (an undesirable outcome). Part 4 reads: 4-3. Productivity (T/OE) is low
Undesirable Outcome
4-2. Unit cost is high
3-2. Leasing labor increases operating expense
4-1. Labor capacity is the largest operating expense (Z%)
UDE#1. The ratio of throughput to labor capacity is poor
UDE#7. Leasing labor increases bench capacity in the afternoon
UDE#6. Significant bench capacity exists in the afternoon
Figure 32. CRT, part 4.
Because significant bench capacity exists in the afternoon (UDE#6), the ratio of throughput to labor capacity is poor (UDE#1). This effect is magnified as leasing labor increases bench capacity in the afternoon (UDE#7). If the ratio of throughput to labor capacity is poor (UDE#1), and labor capacity is the largest operating expense, then unit cost is high (4-2). Again, this effect is magnified as leasing labor increases operating expense (3-2). Finally, if unit cost is high (4-2), then productivity (T/OE) is low (4-3). Summary of the CRT In sum, the CRT illustrates how the core problem – visiting nearby customers consecutively to minimize travel time – artificially concentrates demand in the morning, creating a significant peak in the load. Since the capacity of an entire shift must be set according to peak time requirements, the demand peak increases the capacity requirements for the entire shift. As demand drops in the 128
The Core Problem
afternoon, considerable bench capacity exists in the afternoon, reducing T% and overall productivity. The CRT further shows how the core problem creates all but one of the UDEs (UDE#4: a high level of absenteeism). 6.2.3
The Conflict Underlying the Core Problem
When travel logistics were being discussed with the staff, a frequently encountered assertion was that efficient use of caregiver time is sought by scheduling caregiver rounds in such a way that travel is minimized. In practice, this translates into scheduling consecutive visits to customers living near to one another. Caregivers visiting customers with time-critical needs will visit all other customers located nearby while operating in a particular area, regardless of the non-time-criticality of such visits. Travel is a so-called necessary evil. In a field service, such as home care, travel time is inevitable. However, travel per se does not add value to either customers or the provider. Thus, it is intuitive to try to minimize travel time. However, as the CRT illustrates, making the reduction of travel a scheduling priority has far-reaching adverse ramifications. As noted earlier (Section 2.5.5), the core problem often emerges as a conflict between two or more conditions required for achieving an objective (e.g., Goldratt 1990b). The conflict pulls people in opposite directions, often resulting in a compromise, which keeps the core problem from being eliminated (Taylor & Sheffield 2002). The following describes the conflict resolution diagram (CRD) used to illustrate the conflict underlying the identified core problem (Fig. 33). The bolded entity (D) shows the core problem, while the dotted boxes (AB, BD, AC, CD’) state the assumptions underlying the requirements and their prerequisites.
129
Chapter 6 Analysis & Findings: Part 1
Objective
Requirements
AB. Minimizing travel saves caregiver time that can be used to produce more throughput with the given capacity.
Prerequisites
BD. Visiting nearby customers consecutively reduces travel time, as it reduces the distances traveled.
B. Minimize travel time
D. Visit all nearby customers consecutively
A. Make efficient use of the available labor capacity
Conflict C. Utilize capacity evenly throughout the day by leveling demand
AC1. Since capacity is determined by peak time demand requirements, leveling demand makes possible better utilization of the organization’s own labor: it lowers peak time load, reducing overall capacity requirements (and shortages), as well as bench capacity in the afternoon. AC2. Eliminating demand peaks will reduce caregiver stress as the workload is distributed over a longer period of time.
D’ Perform only time-critical visits during peak demand
CD’. Non-time-critical visits can be performed outside peak hours, leveling demand throughout a shift.
Figure 33. CRD: the conflict underlying the core problem.
In order to make efficient use of the available labor capacity (A), EHC must minimize travel time (B) to avoid wasting precious caregiver time. The assumption is that the time saved can be transformed into throughput (AC). The prerequisite for minimizing travel is to visit all nearby customers consecutively (irrespective of timecriticality) (D), as this minimizes the distances traveled (BD). In addition, EHC must utilize capacity evenly throughout the day by leveling demand (C). Since the capacity required is determined by peak time demand, leveling demand enables available labor capacity to be utilized evenly throughout the day. It reduces the capacity required to satisfy peak time demand (AC1), mitigating the influence of shortages, while reducing superfluous bench capacity in the afternoon. It also reduces peak time-induced caregiver stress (AC2), as the workload is distributed over a longer period of time. The prerequisite for leveling demand is to perform only time-critical visits during peak time (D’), since non-time-critical visits can be scheduled relatively freely outside peak hours (CD’).
130
The Core Problem
In the light of the demand peak, the assumption that the time saved by reduced travel allows more throughput to be produced with the given capacity (AC) is false. Granted, minimizing travel enables the caregivers to produce more throughput within a short period of time (peak hours). However, some (nontime-critical) throughput need not be produced during that period in the first place, and it needlessly magnifies the demand peak. As shown earlier, the ensuing temporary demand peak drives up capacity requirements for an entire shift, capacity which cannot subsequently be transformed into throughput as demand drops in the afternoon. In addition, the demand peak renders the operations sensitive to shortages as a result of variations in demand (e.g., customers returning home after being discharged from hospital) and supply (i.e., caregiver absenteeism), increasing the need to resort to leased labor. In sum, while visiting nearby customer locations consecutively enables more throughput to be produced for a short period of time, it hoards non-timecritical demand in the morning, increasing the overall capacity requirements, reducing T%. Conversely, leveling demand by performing only time-critical visits in the morning would enable less capacity to produce the same amount of throughput, increasing T%.
131
7 INTERVENTION
This chapter describes the intervention designed to break the temporary resource constraint through the elimination of the policy causing the core problem. The intervention is broken down into two design propositions, constructed by the researcher in collaboration with the project team (PT). Supervised by the PT, the design propositions were implemented during the course of an 11-month period, from May 2010 to March 2011.
7.1
DESIGN PROPOSITIONS
Following the identification of the constraint, the next step is to exploit the constraint and to eliminate policy constraints. As noted in Section 2.3.1, exploitation can be done in two dimensions: efficiency and effectiveness (Ronen et al. 2006). Efficiency refers to maximizing the utilization of the resource constraint, while effectiveness means working on preferred items. In EHC, however, the resource constraint occurs because non-time-critical visits are needlessly performed during peak time, during which capacity is already
fully
utilized.
Consequently,
no
protective
capacity
exists.
Concentrating demand in the morning artificially drives up capacity requirements, and ultimately leads to the reliance on leased labor to cope with peak demand. Therefore, rather than maximizing the utilization during peak time, demand should be leveled to reduce the current capacity requirements, improving the organization’s ability to cope with variations in demand and supply, as well as future increases in demand. Thus, subject to rigid capacity, exploitation should be sought in the effectiveness dimension: working on ‘preferred items’ by performing only time-critical visits during peak time. In other words, it involves eliminating the policy of minimizing travel time by visiting nearby customers consecutively, irrespective of time-criticality.
132
Design Propositions
Pre-intervention Load
Sought Load
Bench Capacity 100%
Leased Labor
Capacity
Excess Capacity
Load
Protective Capacity
Peak Time: Only timecritical visits 8am
10am
12am
14pm
16pm
18pm
20pm
22pm
Figure 34. Exploiting the peak time constraint by leveling demand.
The exploitation is conceptually illustrated in Figure 34. The primary focus of the intervention is on the morning shifts, during which the bulk of the home care visits are performed. Leveling demand seeks to utilize capacity evenly throughout each shift (the dip around noon is due to lunch breaks). Since leveling demand would leave protective capacity to deal with back office activities, as well as variations in supply and demand, the use of leased labor could be eliminated or significantly reduced. Excess bench capacity shows that the current capacity could handle an increase in demand. The intervention was broken down into the following two design propositions: Design proposition 1: Level demand by offloading non-time-critical visits to off-peak hours.
Shifting non-time-critical visits to off-peak hours breaks the peak time resource constraint, extending the market constraint to cover the entire day. This seeks to improve the organization’s ability to make the most of its available labor capacity, while making excess capacity transparent. Offloading non-time-critical visits requires that the core problem be eliminated, hence design proposition 2: Design proposition 2: Prioritize level demand over minimized travel.
In other words, during periods (e.g., the morning) when time-critical demand is prevalent, perform only time-critical visits. Break the policy constraint: do not try to minimize travel by performing non-time-critical visits to customers living nearby.
133
Chapter 7 Intervention
Following CIMO-logic, the two design propositions can be combined into the following joint proposition: in the context of public home care operations (where capacity is rigid), level demand throughout each shift (intervention), to improve utilization and to reduce the capacity required to satisfy demand (mechanism), in order to improve the productive use of labor (sought outcome).
7.2
IMPLEMENTATION
While the researcher was in charge of designing the intervention, the implementation was handled solely by EHC’s own staff, under the supervision of the PT. The following provides a brief description of the implementation process. The intervention was implemented throughout EHC’s local units over a period of 11 months, from May 2010 to March 2011. Because of the large size of the organization, the implementation was broken down into three phases. During each phase, the intervention was implemented in roughly one third of the local units, assisted by three representatives of the PT. As noted earlier, the customers’ care plans comprise a list of tasks to be performed, which, when grouped into visits, constitute demand. Therefore, to level demand, the customers’ care plans had to be revised in order to separate time-critical tasks from non-time-critical ones.62 Since the scheduling system did not distinguish between the two,63 all care plans had to be manually reviewed to codify time-criticality. In some instances, such as customers receiving multiple daily visits, tasks were re-arranged so that only time-critical tasks would be performed during morning visits. In some other cases, a longer peak time visit was split into two visits, one time-critical and another non-time-critical, to reduce the peak time load. Once the care plans had been revised to account for time-criticality, EHC employed an external contractor (Ecomond Oy) to do a one-off optimization of the routes of caregiver skill group 2. The motivation for limiting the optimization to skill group 2 was that it constitutes the bulk of the capacity
62
A visit is time-critical if at least one task to be performed during that visit is time-critical. While time-criticality is not noted in the scheduling system, the caregivers know from experience which tasks are time-critical.
63
134
Implementation
(76%), and produces over 85% of T. Furthermore, the activities of skill group 1 include considerably more back office work. The purpose of the optimization was twofold. First, EHC wanted to schedule the visits so that each caregiver route had a T% of at least 56-63% (i.e., 4.5-5 hours of throughput per 8-hour shift). At this stage, EHC wanted to ensure that more than enough bench capacity remained to be able to deal with back office activities. Second, EHC wanted to check how many routes, and thus caregiver shifts, were, in fact, needed to cope with demand. As demand is leveled, the number of caregiver shifts needed should be reduced. Thus, the design propositions were implemented to level demand, while the one-time optimization was performed to create a model schedule that translated the revised care plans into practice. The model schedule sought to help the caregivers make the transition from scheduling routes to minimize travel to scheduling routes to level demand.
135
8 ANALYSIS & FINDINGS: PART 2
“[…]the hardest constraints to change aren’t physical at all. They’re the policies we set.” (Ricketts 2007, p.16)
This chapter discusses the findings of the research conducted after the intervention. The chapter begins by presenting and analyzing the outcome of the intervention. The performance indicators before and after the intervention are compared. On the basis of the findings, two previously overlooked core problems are identified. As illustrated through an updated version of the CRT, these core problems help explain why the intervention had a minor effect. A CRD is used to analyze and propose a solution to the conflict behind one of the core problems. The chapter concludes with a review of the developments after the post-intervention follow-up period.
8.1
OUTCOME OF THE INTERVENTION
This section presents the outcome of the intervention, comparing the situations before and after. Figure 35 shows the load distribution after the intervention. Notably, not much has changed and the temporary resource constraint remains. Figure 36 compares the distribution of throughput before and after the intervention. It shows that the curves are almost identical, especially during peak demand in the morning. The reduction in throughput during the highest peak (9 a.m.) is only 1%. From this it can be concluded that the intervention failed to level demand throughout the day.
136
Outcom me of the t Intterventiion
Throughput
Estimated Transportation
Bench Capacity
7000 6000
Time (h)
5000 4000 3000 2000 1000 0 7:00 8:00 9:00 10:00 11:00 12:00 1:00 2:00 3:00 4:00 5:00 6:00 7:00 8:00 9:00 AM AM AM AM AM PM PM PM PM PM PM PM PM PM PM
Figurre 355. L Load d An nalyssis (6-w ( week k perriod d: Maarch h 7th h to Aprril 177th)) 2009
2011
5000 4500
Throughput (h)
4000 3500 3000 2500 2000 1500 1000 500 0 7:00 8:00 9:00 10:00 11:00 12:00 1:00 2:00 3:00 4:00 5:00 6:00 7:00 8:00 9:00 AM AM AM AM AM PM PM PM PM PM PM PM PM PM PM
Com mpaariso ution n off throug on of o th he distr d ribu ghp put befo b ore (20009) and d affter (2011) the Figurre 336. C n. ntervventtion in
137
Chapter 8 Analysis & Findings: Part 2 Table 6. Comparison of operational indicators 2009-2011.
Indicator Throughput (T%) Inventory Esimated Bench Capacity2 Total Capacity Throughput (T) Leased labor Number of Encounters Number of Customers
2009 39 % 61 % 49 % 53281h 20798h 4% 44616 2092
1
pp=percentage point
2
Esimated Bench Capacity=Inventory - Estamated Travel
2011 37 % 63 % 51 % 54907h 20215h 6% 43354 2402
Change -2 pp1 2 pp1 4% 3% -3% 31 % 3% 13 %
Table 6 compares the operational indicators before and after the intervention, outlining their change from 2009. T% decreased by 2 percentage points (pp), or 5%, with an equivalent increase in estimated bench capacity. This is due to a minor reduction in throughput (T) and a slight increase in capacity. According to historical measurements, T% tends to vary somewhat throughout the year (approx. 3-4 pp). While the change is in the wrong direction, the 2 pp reduction is within the limits of the natural variability of T% (both capacity and throughput show some degree of variation). The increase in capacity is largely driven by a considerable surge (50%) in the use of leased labor. From discussions with the foremen, it is apparent that many absences resulting from sick leave come at short notice, perhaps only an hour or two before the beginning of the shift. Therefore, for fear of labor shortages, some foremen order leased labor in advance, ‘just in case’. This will be further discussed shortly. The minor reduction in throughput is interesting, considering that demand increased in terms of the number of customers served. The reduction in throughput is, however, most probably due to a strategic decision (made in 2010) to tighten the acceptance criteria for regular customers, in an effort to slow the increase in demand. EHC had noticed that many customers with only temporary needs for care had been accepted as ongoing, or regular, home care customers. Consequently, customers with negligible needs were served on a regular basis. In tightening the acceptance criteria, temporary home care was emphasized. New customers are preferably accepted as temporary customers, rather than as regulars in one of the lower dependency categories. Since temporary customers typically leave 138
Outcom me of the t Intterventiion
th he sysstem m aafteer a while w e (uunliike regullar cusstom merrs),, th he nnum mbeer of o diff ffereentt cuustom merss seerveed may m y in ncreeasee w withooutt an n in ncreeasee in thrrouughputt. The T resultt of th his po olicyy iss diispllayeed iin Figguree 377. IIt illlusstraates a shiift in i tthe distr d ribuutio on of thrroughp putt beetw ween n ddiffeeren nt cusstom merr caateggorries. Figu F ure 37 sh how ws a siggnifficaant in ncreeasee in n tthe teemp porraryy ccateegorry, wiith a ro ough hlyy eqquiivallentt reeduuctiion in n th he tw wo low west dep d pend den ncy caateggoriies off reeguular cuustom merss. IIt also sho owss aan inccreaase in n the t th hreee hhigh hest dep d penden ncyy caateggorries. A plaaussiblee exxplaanaatioon is th hat som me cusstomeers p pro ogreesseed to t high h herr depe d enddency caateggoriies, whil w e tthee tiighten ned acccep ptaancee ccriteriaa kep k pt tthe 6 prev p viouus ccateegoriess frrom m filllingg uup with w h neew cusstom merrs.64
2009
2011
% of Total Throughput
25 % 20 % 15 % 10 % 5% 0%
Customer Category
Distrributtion Figurre 377. D n of thro t ough hputt beetweeen ccusttomeer categ goriees 20092 -20111.
8.1.11
k Timee Th Peeak hrough hpu ut
nt to t anaalyzze tthe Sincce tthe inttervven ntio on fail f ed to levvel deemaand, itt is peertinnen ough hpu ntion com mpositiion off th he peak p k tiimee thhro ut afte a er the t inttervven n (Fig ( g. 38), 3 to whettherr cu wer dep an nalyyzee w usto om merss in n thhe llow pen nden ncyy caateggorries (laargeely no onman tiimee-crriticcal ddem nd) aree stiill sservvedd duurin ng peak p k tiimee.
644
omerrs woul w ld en m in n thee tem m e fro Ideeallyy, cuusto nterr thee sysstem mpo oraryy caatego ory,, andd move om a low werr h th and a leveel of my ddeterrioraate. In reallity, to o a high h her deppenddenccy categ c goryy as theeir heal o auuton nom ne may m nott alw g uallyy, an c nges can howeeverr, thhe deeclin wayss haappeen gradu nd sudd s den stepp-likke chan n mo ove hortt perriod a custom mer uup sseveeral cateegorries with hin a sh d of tim me. 139
Chapter 8 Analysis & Findings: Part 2 5000 4500
Throughput (h)
4000 3500 3000 2500 Other 2000 1500
40% of peak time throughput (8-10 a.m.) 5-10h
1000 0-4h 500 0
Temporary 7:00 8:00 9:00 10:00 11:00 12:00 1:00 2:00 3:00 4:00 5:00 6:00 7:00 8:00 9:00 AM AM AM AM AM PM PM PM PM PM PM PM PM PM PM
Figure 38. The relative load contribution of different dependency categories throughout the day (2011).
Figure 38 shows a slight improvement in this respect. The lower dependency categories account for 40% of demand during the highest peak (9 a.m.). This signifies a 3 percentage point reduction (or 7%) from the pre-intervention situation.65 On the other hand, the curve (the gray area in Figure 38) remains essentially unchanged. This suggests that the reduction was not due to nontime-critical visits being shifted to non-peak hours, but more probably due to the tightened acceptance criteria. From 2009 to 2011, some of the customers can be expected to have advanced from lower to higher dependency categories, while the lower categories ‘fill up’ at a slower pace under the new policy. In spite of the 3 percentage point reduction in the lower dependency categories during the highest peak, the total peak time throughput only declined by a negligible 1%. A plausible explanation is that the throughput of the three highest dependency categories, which include more time-critical demand, increased by 13%. This suggests that the share of time-critical demand should also have increased.
65
A major difference is the composition of the less dependent categories. As previously discussed, there is is a clear increase in the temporary category, with a roughly proportional decrease in the two lowest dependency categories of regular customers. The total throughput ascribed to the three least dependent customer categories remains largely unchanged.
140
Outcome of the Intervention
8.1.2
Analyzing the Intervention
The intervention can be broken down into two components: 1) planning, and 2) implementation. Planning refers to the steps taken to level demand, or revising the customer care plans; identifying non-time-critical visits and moving them to non-peak hours. Implementation, on the other hand, concerns the execution of the new plan. This required breaking the policy constraint of minimizing travel by visiting nearby customers consecutively. In other words, the visits had to be assigned to different routes in a way that prioritized level demand over minimized travel. Since the intervention failed to level demand, it is appropriate to analyze whether the failure occurred during the planning or the implementation stage, or both. This is done by comparing the distribution of the planned load with the realized load (Fig. 39) Unfortunately, data on the temporary customers’ planned services were not available, since they are not registered in the electronic medical record. Therefore, Figure 39 only compares the planned and realized load attributed to the regular home care customers, representing 91% of the throughput. Planned Load
Realized Load
Figure 39. The planned vs. the realized load distribution (2011).
The comparison exposes two major differences: 1) the total amount of throughput (T), and 2) its distribution throughout the day (i.e., the profile of the load). Difference in Throughput The realized throughput drops by 37% compared to the plan. In investigating the reasons behind this drop, the project team (PT) concluded that a part can be ascribed to temporarily suspended care episodes. Suspensions occur when customers are temporarily hospitalized because of illness or rehabilitation. In general, the frequency of the suspensions should increase with a higher dependency category. This notion is supported by the fact that the difference between the planned and realized load is greater in the higher dependency 141
Chapter 8 Analysis & Findings: Part 2
categories (Fig 39: black area). According to the PT, as many as 20% of the customer episodes may be suspended at any one time. According to the caregivers, temporary suspensions are not always recorded, even though they should be, creating some ambiguity regarding the accuracy of the plan. Although not shown in the data, the suspensions were said to be implicitly known by the caregivers, and the absence of certain customers acknowledged in scheduling. Furthermore, on the basis of discussions with the foremen and caregivers, it was found that the customer needs tend to be overestimated in the care plan. The motivation is that the customer co-payment is based on the projected maximum need (i.e., the upper limit of the dependency category). While the copayment may be discounted if the customer received less service, the copayment remains the same even if the maximum limit is exceeded. To avoid situations where actual customer needs are greater than expected, the need is overestimated in the care plan. Difference in the Load Profile As illustrated in Figure 39, the planned and realized load curves have different profiles, especially after the morning demand peak. While according to the plan throughput drops by 50% from 9 a.m. to 12 p.m., in reality it fell by 67%. During the planning stage of the intervention, the PT members in charge expressed their concerns that the revision of the care plans (postponing nontime-critical visits) was leading to the emergence of another peak around noon. The plan shows another smaller peak culminating at 12 p.m.. This suggests that the planning stage of the intervention succeeded in postponing some of the demand to off-peak hours. The total realized throughput of the two lowest dependency categories (Fig. 39: gray area) is 25% lower than planned. However, after the morning peak, between 11 a.m. and 2 p.m., the realized throughput is 64% lower than planned. While part of the 25% difference in total throughput can be explained by overestimated care and suspended care episodes, the significant difference after the peak is unlikely to be explained by these factors. The reason is that there is only a 15% drop in the total throughput during peak time (8-11 a.m.). The researcher’s interpretation is that non-time-critical demand planned for the afternoon was actually performed during peak hours.
142
Outcome of the Intervention
Summary In sum, the analysis suggests that the intervention failed in both the planning and implementation stages. First, the revision of the care plan was unsuccessful in leveling the demand (as illustrated in Fig 39: planned load). On the basis of discussions with the PT, the most likely explanation is that the criteria for timecriticality had not been tight enough. In other words, visits were given a timecritical status on the basis of fairly light justification. Therefore, the revision process failed to identify many visits that were, in fact, transferable to off-peak hours. The other alternative is that very few visits were non-time-critical. This, however, is an unlikely alternative since demand has been leveled in other home care organizations.66 This is emphasized by the fact that, according to the Head of EHC, the relative share of customers in lower dependency categories is very high in Espoo, compared to an average of large benchmark municipalities. Thus, it stands to reason that many of EHC’s services should be non-time-critical. Second, while some visits had been postponed until off-peak hours, in reality, they were still performed during peak hours. According to the foremen, the policy of minimizing travel is deeply rooted in the organization and hard to break. 8.1.3
Comparison of Local Units
In the light of the fact that the use of leased labor had increased, even though throughput had decreased, it is useful to compare the performance of the local units in order to analyze whether the use of leased labor was warranted. This is done by comparing each local unit’s T% with the level of leased labor capacity employed (Fig. 40). Because of the varying sizes of the local units, leased labor is here measured in terms of its share (%) of total capacity. The use of leased labor is argued to be justified if the T% still remains high. Then again, if T% is low, the local unit’s own capacity should have been sufficient. Furthermore, a large difference in T% suggests an uneven allocation of resources between local units.
66
One example is a home care unit in Malmö (Sweden), which the researcher visited in June 2011. According to an ‘in-house’ study performed by the unit, only one quarter of the home care visits are time-critical. Additionally, data showing leveled demand in two recently privatized Finnish home care units were presented by Mark Roth, CEO of Mediverkko Oy, at the “Kotihoito & Teknologia” (Home Care & Technology) seminar in Helsinki, on February 2nd, 2011. 143
Ch haptter 8 Ana A alyssis & Find ding gs: P Partt 2 T%
Leased Labor (% of capacity)
50 %
25 %
45 % 40 %
30 %
15 %
T% 25 % 20 %
10 %
15 %
Leased Labor
20 %
35 %
5%
10 % 5%
0%
0%
Local Unit
Fig guree 40.. Co omparisson on o the t llocaal un nits.
Figgurre 440 sho s owss th he lo ocaal uunitts’ p perfform maancee in n teerm ms oof T% T in a des d cen ndinng orrderr (leeft verrticaal axis a ) an nd thee reespeectiive levvel o of lleassed lab bor em mplo oyeed (righ ( ht veerticcal axiis). Firrst, a sign s nifican nt ddiffe ferencee in n peerfoorm man nce can n be b not n ed. Thhe peerfo orm mancce of o the t beest llocaal uunitt is 17 perceentaage po oints, or o 61% 6 %, high h her thaan that o of thee po oorrestt-peerfo orm mingg lo ocaal unit u . Siince T T% essen ntiallly meeasuuress thhe levvel cap paccity avaailaablee to o prrod ducee a givven n am mouunt off thhrou ugh hputt, th his im mplies poo or; the t rattio of that tthe allo ocaation of o reso ourcces betweeen n loccal uniits iis p o ddem mannd paccity is une to cap u even. nd, thee use of bor varriess grreattly betw Seecon o leas l sed lab b weeen thee loccal units. Esspecciallly worrthyy iss th mplloym d laaborr (220% no otew he high h h leevell off em meent of leaased % of o capaacitty) orm mingg unit u ts (N N9). T This in in somee off th he poo p orlyy peerfo N6 an nd N ndiccatees tthaat thhe of leeased lab a leeast in A not use o bor waas uunjuustiifiedd, at n th hesee unitss. As n ted earrlier, oon basiis of o disc d cussions witth thee fo orem men n, thee hiigh levvel off leaseed llabo or in the b nitss is plaausiiblyy duue to so omee un t tthe practiice of ordderringg leased laabo or in n aadvaancce, n casee, to jusst in o prroteect agaainsst shorrtagges.. he facct th of the t un Th hirdd, th hat sevverral o nits deemo onsttratted a llow w levvel off T% %, eveen ow levvel of leaasedd caapacityy, sugggestts that nitss arre over wiith a lo t t thhesee un o rstaaffeed bby deesiggn. hat wiith an avveraage off less thaan 40% Ovverrall,, it can n be b arg a guedd th 4 % of o ccap paciity nteeracctin omeers (i.e. T% o leased sp pentt in ng witth cuusto %), alll uusee of d laabo or is 6 perfform b ow thee esstim un nwaarraanteed.67 E n th Even he besst-p min ng loca l al uunitt is waay belo mateed
67
a thee concluusio hed by the exttern mizaatio on co T s was also Thi on reeach nal o optim ontrractor, acco ordiing to m all sch wh hom heduulingg co ondittion ns coouldd bee meet witho w out lease l ed ccapaacityy. 1444
Identifying Additional core problems
theoretical maximum T% of 60-65% (previously discussed in Section 4.1.6). Rather, the issue is one of resource allocation, distributing the capacity between local units on the basis of variations in demand and supply.
8.2
IDENTIFYING ADDITIONAL CORE PROBLEMS
The post-intervention research and analysis led to the discovery of an additional UDE, and two previously overlooked core problems, or policy constraints, which serve to reinforce both the demand peak and the reliance on leased labor. This section first presents the UDE and the core problems. The pre-intervention CRT is then expanded to incorporate the newly identified UDE and the core problems. A CRD is then used to expose the conflict, as well as the assumptions, underlying one of the core problems. 8.2.1
Undesirable Effect and Core Problems
The realization that the difference in performance between the local units is significant, and that leased labor is employed even though many units have significant excess capacity, brought the researcher’s attention to a resource allocation problem. Instead of capacity being considered as a shared pool of caregiver resources, capacity is highly localized. Contractually, caregivers are employed directly by the local units. The granted number of caregiver positions per local unit is fixed on the basis of historical developments rather than actual demand (Core Problem 2). These developments are, for instance, the perceived need for resources at different points in time, the integration of the previously detached home services and home nursing functions into home care (1993), and the merger of five separate home care units into one (2006)68. Subject to a demand peak, the perceived need for resources is bound to be high. According to the researcher’s experience, and also on the basis of discussion with the EHC’s management, localized capacity is a remnant of a personnel administration practice that is very common within the public sector in Finland. Therefore, this is argued to be a core problem, although in the current environment, it could perhaps be interpreted as a necessary condition, as it 68
EHC was established in 2006, as a result of the merger of 5 separate units. According to all stakeholder groups, the aftermath of this organizational restructuring is still notable in the form of somewhat varying “floor-level” practices in different local units. These include, for instance, the distribution of tasks between the two skill groups. Although perhaps minor, these differences are considered to be a barrier to the transfer of caregivers between units. EHC is therefore working towards standardizing the procedures and practices. 145
Chapter 8 Analysis & Findings: Part 2
relates to prevailing contracts. Contractually, the caregiver positions could be assigned to EHC, or a larger geographical area, as opposed to a specific local unit. In other words, the change is within EHC’s sphere of influence. Since capacity is not based on actual demand, local capacity usually exceeds local demand. This was shown by the substantial difference between the realized T% and the theoretical maximum. ‘Usually’ here refers to the fact that sudden variations in demand and supply may cause local capacity shortages during peak time, since demand currently remains concentrated in the morning. With level demand, however, it stands to reason that fewer caregivers could handle the current amount of demand, since it enables the workload of individual caregivers to be spread more evenly throughout the day. UDE#8: No caregivers are free for transfer to units experiencing shortages The necessary condition of striving for good employee satisfaction dictates that all staff be treated equally. Therefore, every attempt is made to assign each caregiver an even workload. In other words, the workload is distributed evenly so that each caregiver is assigned a route (core problem 3). In the light of excess capacity, this means that the workload of each route becomes low, and that caregivers are unnecessarily activated. Since all caregivers are activated locally, the excess capacity is not transparent. Consequently, no caregivers appear to be free for transfer to other units experiencing shortages. Thus, instead of caregivers being borrowed from other units with excess capacity, leased labor is typically employed. According to the foremen, some temporary borrowing does occur between individual units, but there is no systematic resource allocation scheme in place for doing so. Rather, the occasional borrowing of labor is based on personal relationships between particular foremen. In addition, leasing labor is considered an easier option, since possible excess capacity in other local units is not transparent. As a result, the temporary re-allocation of caregivers is more of an exception than a rule, and remains a small-scale enterprise. 8.2.2
The CRT Revised
This subsection expands the CRT to incorporate the post-intervention findings. Again, Figure 41 provides an overview of the CRT, while the extension ‘part 5’ is shown and described separately (Fig. 42). It illustrates how the two newly identified core problems reinforce both the artificial concentration of demand in the morning and the reliance on leased labor. 146
Identifying Additional core problems
Part 4 (Fig. 32)
4-3. Productivity (T/OE) is low 4-2. Unit cost is high
4-1. Labor capacity is the largest operating expense
3-2. Leasing labor increases operating expense
UDE#7. Leasing labor increases bench capacity in the afternoon
2-3. The capacity for an entire shift is fixed on the basis of peak time demand requirements
NC#3. Labor can only be leased for full shifts
2-2. The level of capacity currently required to meet morning demand is artificially high
3-1 Any level short of design capacity is perceived as a shortage that must be filled to cope with peak time demand
UDE#4. A high level of absenteeism causes many shortages
Part 2 (Fig. 30)
UDE#6. Significant bench capacity exists in the afternoon
3-4. Extra (leased) capacity is only needed for a few hours in the morning
3-3. Leasing labor increases the capacity of an entire shift UDE#5. External labor is leased to cope with capacity shortages
UDE#1. The ratio of throughput to labor capacity is poor
2-1. The demand peak in the morning is artificially magnified
NC#2. Capacity can not be reduced during a shift as demand falls
NC#1. All demand must be statisfied
UDE#3 . The caregivers are subject to stress during peak time even with full (design)capacity
1-6. Demand drops significantly in the afternoon 1-5. Few visits are left for the afternoon
Part 3 (Fig. 32)
UDE#2. Many visits are needlessly scheduled in the morning
UDE#8. No caregivers are free for transfer to units experiencing shortages
1-3. Many non-timecritical visits are also scheduled in the morning
5-8. Many visits are non-timecritical
5-10. Buffer capacity is consumed locally
5-9. Each caregiver is activated locally
5-5. The workload of each route is low
5-4. The workload is divided evenly so that each caregiver is assigned a route
5-7. Most visits are scheduled in the morning
5-6. Most routes start in the morning (at the beginning of the shift)
1-4. Non-time-critical visits need not be scheduled in the morning
1-1. There are many time-critical visits in the morning
1-2. Visits to nearby customers are scheduled consecutively irrespective of time-criticality to save travel
Part 1 (Fig. 29)
5-3. Local units typically have an excess number of caregivers (local buffer capacity exist)
5-1. Local design capacity is fixed on the basis of historical developments rather than demand
5-2. Design capacity exceeds local demand
Part 5 (Fig. 42)
Figure 41. Overview of the post-intervention CRT.
147
Chapter 8 Analysis & Findings: Part 2
Part 5 UDE#5. External labor is leased to cope with capacity shortages (Part 3)
3-1 Any level short of design capacity is perceived as a shortage that must be filled to cope with peak time demand (Part 3) UDE#8. No caregivers are free for transfer to units experiencing shortages
1-3. Many non-time-critical visits are also scheduled in the morning (Part 1)
5-7. Most visits are scheduled in the morning
5-8. Many visits are non-time critical
5-10. Buffer capacity is consumed locally 5-9. Each caregiver is activated locally
5-5. The workload of each route is low
5-6. Most routes start in the morning (at the beginning of the shift)
1-2. Visits to nearby customers are scheduled consecutively irrespective of timecriticality to save travel (Part 1)
Core problem 1 5-4. The workload is divided evenly so that each caregiver is assigned a route
5-3. Local units typically have an excess number of caregivers (local buffer capacity exist)
Core problem 3 5-1. Local design capacity is fixed on the basis of historical developments rather than demand
5-2. Design capacity exceeds local demand
Core problem 2 Figure 42. CRT, part 5.
Figure 42 reads: If local design capacity is fixed on the basis of historical developments rather than demand (5-1), and design capacity exceeds local demand (5-2), then local units typically have an excess number of caregivers (local buffer capacity exists) (5-3). If local units typically have an excess number of caregivers (local buffer capacity exists) (5-3), and the workload is divided evenly so that each caregiver is assigned a route (5-4), then the workload of each route is low (5-5). If the workload of each route is low (5-5), and most routes start 148
Identifying Additional core problems
in the morning (at the beginning of the shift) (5-6), and visits to nearby customers are scheduled consecutively irrespective of time-criticality to save travel (Part 1) (1-2), then most visits are scheduled in the morning (5-7). If most visits are scheduled in the morning (5-7), and many visits are non-time-critical (5-8), then many non-time-critical visits are also scheduled in the morning (1-3) (see Part 1: Section 6.2.2). Because the workload is divided evenly so that each caregiver is assigned a route (5-4), each caregiver is activated locally (5-9). If each caregiver is activated locally (5-9), then buffer capacity is consumed locally (5-10). If buffer capacity is consumed locally (5-10), then no caregivers are free for transfer to units experiencing shortages (UDE#8). If any level short of design capacity is perceived as a shortage that must be filled to cope with peak time demand (see Part 3: Section 6.2.2) (1-3), and no caregivers are free for transfer to units experiencing shortages (UDE#8), then external labor is leased to cope with capacity shortages (see Part 3) (UDE#5). 8.2.3
Exposing Another Conflict
As noted earlier, core problem number 2 (Fig. 42: CRT, part 5) is created by a contractual practice related to personnel administration, rather than a conflict. To eliminate problem 2, current collective agreements require that the post (i.e., local unit) associated with each caregiver contract be re-negotiated. Therefore, this subsection only presents the conflict and the underlying assumptions associated with core problem 3 (cf. Fig. 42). Figure 43 presents the CRD used to illustrate a conflict underlying core problem number two (cf. Fig. 42). Again, the bolded entity (D) shows the core problem, while the dotted boxes (AB, BD, AC, CD’) state the assumptions underlying the requirements and their prerequisites.
149
Chapter 8 Analysis & Findings: Part 2
Objective
AB. All local caregiver positions are needed.
Requirements
BD. Assigning each caregiver a route with an equal workload reduces the stress of individual employees, and ensures fair treatment of all staff.
Local level B. Distribute the workload evenly between caregivers at the local level A. Assign an equal workload to all caregivers
D. Activate all locally available caregivers
Conflict Global level C. Re-allocate capacity between all local units based on actual demand
AC1. Both supply (capacity) and demand are subject to variation. AC2. While capacity can be reallocated, demand is based on customer needs, which are not within EHC’s sphere of influence. AC3. Because of contractual agreements, re-allocating capacity between units is arduous.
Prerequisites
D’. Only activate as many local caregivers as needed to ensure that each route has a reasonable workload
CD’1. Caregivers are unnecessarily activated if the workload of each ensuing route is low; i.e., the visits could be distributed between fewer routes. (A “reasonable” workload is estimated by EHC to correspond to a T% of 60% per shift.) CD’2. Demand can be leveled, so as to enable a T% of 60% per shift to happen. CD’3. Excess capacity should be kept transparent, so that it can be transferred to units with shortages. CD’3. Locally activated caregivers are not free for transfer to other units.
Figure 43. CRD: the conflict underlying core problem 2.
According to both the foremen and the caregivers, an important component of employee satisfaction is ensuring that all caregivers are assigned an even workload. This has also been noted by Eveborn et al. (2009). In order to assign an equal workload to all caregivers (A), the workload should be evenly distributed between caregivers at the local level (B), as well as between local units on the global level (C). The latter means ensuring that each unit has the same ratio of capacity to demand, or an equal amount of resources relative to demand, by re-allocating capacity between local units on the basis of actual demand (C). To achieve B, all locally available caregivers should be activated (i.e., assigned a route). On the other hand, to achieve C, the local units should activate only as many caregivers as are needed
150
Identifying Additional core problems
to ensure that each route has a reasonable workload.69 This would allow nonactivated (excess) caregivers to be re-assigned to other units experiencing shortages. The underlying assumption (AB) is that all locally available caregivers are needed. In other words, all the caregiver positions allocated to a specific unit are justified. On the basis of the findings, however, this assumption is argued to be false, assuming that demand can be leveled. The number of caregiver positions allocated to the local units is based on historical developments rather than the current level of demand. As shown earlier, the T% of the local units ranges from 27-45% (Fig. 40, Section 8.1.3), while EHC holds that a T% of 60% is feasible. Thus, in cumulative terms, the capacity for the entire day exceeds demand. On the other hand, a peak time resource constraint exists, meaning that the caregivers are temporarily needed during peak time. Therefore, achieving a T% of 60% necessitates that demand be leveled by shifting nontime-critical visits to off-peak hours. The underlying assumption (BD) that activating all caregivers reduces stress comes with an interesting twist. As previously illustrated in the CRT (Part 5), activating all caregivers actually reinforces the artificial concentration of demand in the morning, the main reason for the perceived level of stress.70 The argument is that a low workload per route allows the caregivers to prioritize the geographical proximity of customer visits (i.e., minimizing travel) over their time-criticality. Thus, non-time-critical visits are performed in between timecritical ones. On the other hand, if capacity matched demand (T%�60%), then distributing the workload evenly between the caregivers would be reasonable, and the assumption would hold. In sum, subject to local excess capacity, activating all caregivers reduces the transparency of possible excess capacity, eventually forcing other units to rely on leased labor (activated caregivers are not free for transfer). Unnecessary activation of caregivers also contributes to the peak time load. Since, according to the staff, this practice has become deeply rooted over time, it has eventually
69
EHC estimates a “reasonable” workload to be around 4.5-5 hours of throughput per 8-hour shift, corresponding to a T% of roughly 60%. This would leave approximately 3-3.5 hours for back office activities, breaks, and transportation (~1-1.5h). In the current environment, reaching a T% of 60% per activated caregiver shift means that 38% of the capacity would remain idle. On the same note, for EHC to reach a total T% of roughly 60% would entail either a 38% reduction in total capacity, given the current level of demand, or a 62% increase in demand, given the current level of capacity. 70 It can be argued that the peak time stress is induced by the practice of trying to fit non-timecritical visits in between time-critical ones on the basis of geographical proximity. 151
Chapter 8 Analysis & Findings: Part 2
rendered the “excess” capacity “needed”. In other words, the practice has given rise to a self-reinforcing loop.
8.3
DEVELOPMENTS AFTER THE FOLLOW-UP PERIOD
Workshops were held with the foremen in June 2011, after the 6-week postintervention follow-up period had concluded, to analyze the findings and discuss why the intervention had failed. The foremen expressed their belief that they had not succeeded in communicating to the caregivers why the changes imposed during the intervention should be made. While generally agreeing with the results and the cause-effect logic presented in the CRT, the foremen were concerned that they would not be able to convey the full message to the caregivers. It was therefore decided that the findings should be communicated to the caregivers directly by the researcher. The findings were presented to, and discussed with, EHC’s entire staff, on three occasions, with approximately one third of the staff attending each time. Since, in the short term, the only way to improve T% is to reduce the reliance on leased labor, the unnecessary use of leased capacity was one of the focal topics. An analysis of the weekly number of leased labor shifts (Fig. 44) shows a decrease in the number of leased labor shifts throughout the year71 (2011). A comparison with 2009 shows that the decrease is not due to seasonal fluctuations. The gray area illustrates the timing of the presentations (weeks 3637). Although a gradual reduction in the use of leased labor can be discerned throughout the year, a particularly notable drop occurs in the weeks after the presentations.
71
The data are based on reports provided by the labor leasing agency.
152
Developments After the Follow-Up Period
Number of Leased Lbor Shifts
2009
2011
140 130 120 110 100 90 80 70 60 50 40 30 20 10 0 1
3
5
7
9 11 13 15 17 19 21 23 25 27 29 31 33 35 37 39 41 43 45 47 49 51 Week
Figure 44. The number of leased labor shifts per week: 2009 vs. 2011.
In 2011, the median number of leased labor shifts before the presentations (weeks 1-37) was 84 shifts, (avg. 82.4, range 125-41), and the median after (weeks 38-45) was 27.5 shifts (avg. 27.3, range 42-13). The difference is statistically significant (Mann-Whitney U = 295, n1 = 37 n2 = 8, P < 0.001 onetailed), suggesting a substantial reduction in the use of leased labor after the presentation. It should, however, be noted that only 8 weeks’ worth of post-presentation data were available at the time of writing. Nevertheless, if weeks 1-37 are compared with 38-45, the average number of leased labor shifts fell by 67% (82.4 to 27.3). If the average of weeks 38-45 in 2011 is compared with the average for the year 2009 (avg. 73.9; range 109-42), the average number of leased labor shifts declined by 63%. Assuming that this new level can be sustained, the economic benefit is considerable. In 2010, the total operating expense of leased labor was €800,000. The estimated savings from a 63% reduction in leased labor capacity would thus be over €0.5M per year. The analysis (Fig. 44) further shows that the number of leased labor shifts was exceptionally high during the 6-week post-intervention follow-up period (2011; weeks 10-15).72 This may perhaps explain the 50% increase in labor capacity since 2011, as well as the 2 percentage point reduction in T%. As noted earlier (Section 6.2.1), in the short term, the only means available to improve T% was to reduce the use of leased labor capacity. In this respect, the intervention seems to have been effective. Therefore, it can be argued that the minor 72
During the 6-week pre-intervention period (2009; weeks 7-12), the number of leased labor shifts per week was normal, i.e., close to the year’s average of 73.9 shifts per week. 153
Chapter 8 Analysis & Findings: Part 2
decline in performance between 2009 and 2011 was due to the fact that the 6week follow-up period was close to the end of the intervention. After all, implementing a change affecting deeply rooted practices (e.g., minimizing travel) may take some time. In hindsight, the post-intervention follow-up period could perhaps have been postponed. However, the researcher did not have access to operational data for later periods. Thus the actual impact on of the reduction in leased labor capacity on T% could not be evaluated, and must be left for future research.
154
9 CONTRIBUTION & IMPLICATIONS
This chapter presents the contribution and the managerial implications. The chapter begins by discussing the theoretical contribution related to TOC in the context of field service, in order to answer research question number 1. This is followed by a summary of the empirical contribution, which in turn answers research question number 2. The managerial implications of the contributions are then discussed. The chapter concludes with suggestions for future research.
9.1
THEORY OF CONSTRAINTS IN FIELD SERVICE
This section presents and discusses the theoretical contribution of this dissertation. It opens up a discourse on the particular characteristics of field service operations, and how these may affect the applicability of certain TOC tools. At the heart of the argument lies a review of central TOC tenets, such as the assumption of a dependent sequence of events, and how these tenets pertain to a field service context. The discussion applies new reasoning to the insights gained from the empirical investigation. In doing so, the following subsections answer different aspects of the first research question: How does the structure and flow of field service processes differ from facility-based service processes, and what are the implications for TOC? First, the characteristics of field services are outlined and contrasted with those of ‘conventional processes’ which are inherent in manufacturing and many facility-based services. It is argued that these distinctive characteristics have several implications. For example, the structure and flow of field services make Drum-Buffer-Rope (DBR) scheduling inapplicable to this environment. Second, the author contends that Replenishment can be used to improve resource allocation in field services. The challenge is very similar to that of matching supply with demand in a distribution context. Third, the applicability of different TOC tools to a field service environment is discussed. The focus here is on the thinking processes (TP), the process of ongoing improvement (POOGI), and the TOC performance measurement system.
155
Chapter 9 Contribution & Implications
9.1.1
Structure and Flow of Conventional Versus Field Service Processes
The main contribution presented in this section is a description of the distinctive characteristics of field service processes, and their implications for the applicability of TOC. TOC was originally developed for a manufacturing environment, in which the process (the units of analysis) consists of a series of production steps needed to produce a final output. Each step is typically performed by separate resources, and the workflow consists of the stream of items moving between production steps. In field services, on the other hand, the entire process is performed by a single resource, and the workflow consists of that resource’s movement between different sites. The service provided at each site constitutes a discrete output, and the sequence of the site visits is not dependent. Instead of managing the flow of interdependent processes, field service providers manage the flow of multiple parallel, independent field service processes. Before examining the implications this has for TOC, it is prudent to first briefly discuss the assumptions related to conventional processes which are inherent in manufacturing and many facility-based services. These assumptions constitute prerequisites for the applicability of DBR. Conventional Processes “TOC views every organization as a chain of interdependent events” (Breen et al. 2002, p.40). One of the central tenets, or assumptions, of TOC is that the events (production steps, operations, or processes) are sequentially dependent (e.g., D. E. Womack & Flowers 1999). The output of one step is the input of the next; one step must be finished before the next can begin. In other words, “the performance of each event (or process) is dependent upon the previous event” (Breen et al. 2002, p.40). In a manufacturing environment, a dependent sequence of events may be a matter of course. Production lines are designed in such a way that items are processed by different operations (e.g., assembled) in a particular order. (The occasional work-arounds are typically exceptions rather than the rule.) Thus, the operations are obviously dependent in that a bottleneck resource can constrain the throughput of the process. In a facility-based service environment, such as a hospital, the sequential dependence of events may no longer be self-evident. The order in which a patient is processed by different steps may not always be a primary concern, as long as each step takes place. For instance, as Lillrank et al. (2011) 156
Theory of Constraints in Field Service
demonstrate, the diagnostic process of head and neck cancer has several alternative sequences. Production steps, such as visiting a physician, medical imaging, and tissue sampling, are all necessary, but the order in which they are performed is, to some extent, arbitrary. Thus, the sequence of events in such an environment may be independent, or perhaps semi-dependent. In other words, there may remain some in-process sequences that are still dependent, and the number of alternative sequences is limited. Nevertheless, on an aggregate level, the demand for a particular step (e.g., a department) may be greater than its capacity, creating a bottleneck, which governs the throughput of the system.73 Using the chain analogy, even though the order of the links is changed, one link still remains the weakest. In both of these environments, the unit of analysis is a process, as manifested by a series of operations, often performed by different resources (e.g., labor), each operation contributing towards achieving an end result74 (e.g., a product or treated patient). The process consists of “two or more steps that are complementary but distinct in that they use different resources, skills or equipment; happen in different places, or at different times” (Lillrank et al. 2011, p.195). This type of process is here referred to as a conventional process. The task of OM is to synchronize the work of separate operations and/or resources, in order to improve the flow of items (e.g., patients) through the process. The process flow is represented by the items moving through the process. Among the main objectives are the reduction of both lead time and inventory (raw materials and WIP/PIP). TOC suggests that this is best done by scheduling all operations on the basis of the constraint (i.e., DBR), and that seeking efficiency on non-constraints will not reduce lead time and inventory, but can in fact be counter-productive. Field Service Processes In a field service, such as home care, the unit of analysis is a process, manifested by the field operator’s movement between sites. This is conceptually illustrated in Figure 45, using the home care example.75 Visits to different sites resemble production steps in a conventional production process. In a field service process, however, 73
The sequential independence may to some extent allow ‘work-around’, which can prevent a true bottleneck from appearing. For example, if the physician is busy, then visit the imaging department first, and return to the physician later etc. 74 For example, in a hospital environment, an ‘operation’ could be a surgical unit, while the ‘resources’ are its staff. It is not uncommon for these resources to work temporarily in other units or departments as well. 75 Examples of other field services with similar characteristics include the repair of home appliances and maintenance of elevators. 157
Chapter 9 Contribution & Implications
each production step (site visit) is performed by the same resource. The sequence of the steps is not inherently dependent, since the output (service) of one step is not the input of the next. In other words, the performance of each event (or process) is not dependent upon the previous event. Visit #N
Visit 1 Visit 1 Visit 1
Visit 1 Visit 1 Start
Customer 1
Visit 1
Visit 1 Visit 1 Visit 1
Customer 2
Visit 1
Customer 3
Visit 1
Visit 1 Visit 1 Visit 1 Customer 4
End
Visit 1
Visit #1
Caregiver Route Different customers (and locations) visited by the same caregiver over the course of one shift i
Home visits received by customers at different points in time
Figure 45. Unit of analysis: The caregiver process (route)
The subjects (machines or customers) of the service at different sites are not interconnected in any way. The only thing they have in common is that the service is provided by the same field operator (input). However, since field operator resources are often substitutable, the steps can potentially be performed by any number of field operators. Hence, on a fundamental level, no inherent dependence exists between site visits, nor between the sites and a particular resource (field operator). As a result, site visits can be scheduled in an arbitrary order and assigned to any field operator.76 Still, in practice, assigning site visits to field operators does create a form of sequential dependence (or semi-dependence) of events (the route), because the visits share the same input. A field operator cannot move on to the next site before the work at the previous site is completed. Should a delay occur (i.e., variation), it may affect the operator’s ability to proceed with the remaining site visits. If the delay is minor, the field operator may be able to sprint to make up for the lost time. If the delay is significant, then some remaining visits may need to be reassigned to other field operators, if possible, to avoid loss of throughput. 76
The exceptions are when a customer demands the service of a specified field operator, or when a particular skill (scarce resource) requires that a certain field operator be dispatched.
158
Theory of Constraints in Field Service
Constraints vs. Non-constraints in Field Service This subsection discusses the manifestation of constraints and non-constraints in field services, arguing that time-critical demand can create temporary resource constraints in systems otherwise subject to a market constraint. In a field service, such as home care, the process only consists of a single resource, the field operator. If demand for the resource exceeds supply, it is a constraint, meaning that the route is ‘full’, and no more throughput can be produced. That is, each field operator is either a constraint or a non-constraint. From a system perspective, however, there are as many parallel field service processes as there are field operators. Therefore, the system is not subject to a resource constraint unless every field operator is utilized concurrently. This is because site visits can be assigned to other non-constrained operators. This is comparable to a single operation (i.e., one production step) part of a conventional production process. The operation consists of several machines working in parallel, and it is therefore not a resource constraint until the demand exceeds the combined capacity of all the parallel machines. As illustrated in the empirical study, the home care unit is subject to a peak time resource constraint, during which all caregivers are utilized. This means that during peak hours no additional throughput can be provided.77 In the afternoon, however, the system is subject to a market constraint, as excess capacity exists. Thus, while the individual field operators are generally nonconstraints (most have excess capacity), time-critical demand causes the system as a whole to be subject to a temporary peak time constraint, during which all caregivers are occupied concurrently. As a result, a temporary resource constraint may exist, even though the system is subject to a market constraint; the total capacity available throughout the day exceeds demand. The author argues that this stems from the time-criticality of certain services. For instance, a machine breakdown may require an immediate response, and the dispatch of a field operator to the customer’s site. The field service is inseparable (e.g., Moeller 2010) in that it is provided and consumed simultaneously. Services such as home care or maintenance and repair cannot be pre-produced and stored (i.e., unused labor inventory perishes). Timecriticality stipulates that the service cannot be postponed and that the demand
77
Note that T is measured in terms of time rather than visits. More visits could perhaps be performed during peak time, but this would require each visit to be shortened. 159
Chapter 9 Contribution & Implications
must be satisfied within a certain time window. If a service provider cannot comply, then customers may take their business elsewhere. In public home care, service providers are required to satisfy time-critical needs as they occur, creating an imperative to maintain excess capacity. To reduce the required level of capacity, it is therefore crucial that time-critical need be clearly distinguished from non-time-critical need when determining the care plan (i.e., demand). Implications This subsection discusses the inapplicability of DBR to field services, and how to subordinate individual resources to improve the efficiency of the system as a whole. If one resource performs all the production steps (site visits) in a process then it works independently of other resources. The resource’s ability to process is not dependent on output produced by previous operations. Since the field service process does not involve synchronizing the production rate of different resources or production steps to improve flow, DBR scheduling is not applicable, at least in its traditional form. Because of the dependent sequence of events of conventional production processes, TOC holds that maximum utilization (‘efficiency’) should be sought only at the resource constraint, since it governs throughput. High efficiencies on non-constraints will not improve the throughput of the process. So to reduce inventory and lead time, the processing rate of the non-constraints is subordinated to the constraint. As a field service process incorporates a multitude of largely independent resources working in parallel, maximizing the efficiency of each resource will increase throughput (provided that enough demand exists). There is no other bottleneck resource ‘blocking the flow’. However, sub-optimization may occur if the efficiency of the resources is sought in the wrong way. Such an example was illustrated in the empirical study. If, in a situation where there is excess capacity, high efficiency is pursued by minimizing travel, it may have systemic ramifications. It can drive up the total capacity needed to produce a given amount of throughput, while reducing the efficiency of the system as a whole. Thus, the efficiency of the individual resources should be subordinated to the efficiency of the system as a whole. In the case of home care, this means that level service 160
Theory of Constraints in Field Service
provision (load; the prerequisite being level demand) should be prioritized above the efficiency of individual resources. The motivation is that level service provision would reduce the minimum level of capacity required to satisfy demand. Level demand would mean that demand could be satisfied with less capacity, improving the efficiency of the individual resources. Alternatively, if capacity remains at the current level, even if service provision were leveled, it would improve the ability of the system to cope with increasing time-critical demand. Travel in between locations in home care is akin to setup in a manufacturing environment. While unnecessary setups should be avoided, minimizing setups carries the risk of increasing WIP and reducing flexibility. In home care, minimizing travel shifts non-time-critical demand to times when time-critical visits are most prevalent. Since capacity is more or less fixed, this increases inventory (bench capacity) in the afternoon. Likewise, an artificially high peak time load reduces the flexibility, or responsiveness, to fluctuations in demand and supply. In other words, reducing travel in field services can be argued to be the (inverse) equivalent of increasing batch sizes in manufacturing, to reduce setup time. Small batch sizes may improve an organization’s responsiveness, but requires more setup (cf. more travel). 9.1.2
Replenishment: Home Care as a Distribution Environment
Replenishment (R) was originally designed as a solution for the distribution of goods in supply chain environments (e.g., Blackstone 2010a), rather than as a tool for resource management in operations. The basic idea of R is to let actual demand pull inventory through the system from its source, instead of pushing inventory through the supply chain on the basis of forecast demand. In brief, the motivation is that pushing inventory downstream to the final point of supply (e.g., retailers) will probably result in a mismatch between demand and supply. The undesired outcome is surpluses of slow-moving items and shortages of ‘high-runner’ items at individual locations. One retailer may experience shortages of an item of which another one has a surplus; i.e., the wrong number or type of products are held at the wrong location, at the wrong time. TOC suggests that replenishing retailers on the basis of the actual demand (e.g., sales) during the replenishment period will alleviate the problem, and eliminate the need to rely on forecasts. (e.g., Blackstone 2010a)
161
Chapter 9 Contribution & Implications
Based on the empirical findings, the author argues that home care (and perhaps other comparable field services as well) experiences a problem (or phenomenon) that is fundamentally very similar to the one present in distribution. The wrong amount and type of inventory is held at the wrong location, at the wrong time. The amount of inventory held at different locations is not based on actual demand, but rather on a form of forecast. The difference is that in home care, inventory is made up of caregivers instead of products, and inventory is distributed between local units. The fixed number of caregiver positions (capacity) assigned to the local units is akin to a forecast. If the forecast need for capacity is wrong, then a mismatch between supply and demand arises. As a result of the similarity of the phenomenon, it stands to reason that Replenishment may be applicable to this environment, as a solution to the resource allocation problem. The argument builds on the work of (Ricketts 2007), who develops Replenishment and Buffer Management (BM) for professional, scientific, and technical services (PSTS). PSTS can be argued to share some relevant characteristics with field services. In both cases, inventory is composed of labor resources that are deployed on assignments, which may often require an employee to visit the customer’s location (e.g., consulting, accounting). Since Replenishment and BM target inventory, which in both field services and PSTS is manifested as labor resources, it stands to reason that the same Replenishment and BM mechanisms should be applicable in a field service environment as well. According to Ricketts (2007, p.74), “even though supply and distribution in services differ from industry, the basic principles behind Replenishment are still valid”. The original principles and their application in a service environment are briefly outlined in Table 7.78
78
For a more thorough explanation, the reader is advised to refer to Ricketts (2007)
162
Theory of Constraints in Field Service Table 7. Replenishment principles applied to service (based on Ricketts (2007, pp. 74-75)).
No. Principle 1 "aggregation reduces variation"
1
Application to Service "skill groups aggregate demand for resources"
2
"buffers sized according to average time "buffers are sized according to net to resupply protect against shortage" resource consumption1"
3
"buffer zones provide a convenient "buffer zones guard against both reference that tells managers when action resource shortages and excess" is required"
4
"buffer management driven by actual demand protects against shortage while avoiding excess"
"buffer management utilizes a wide variety of techniques for adjusting resource capacity"
the difference between resources going out on assignments minus those returning.
The Resource Allocation Problem Before expounding on how Replenishment could be applied to home care, it is sensible to first review the underlying core problem and UDEs, which it is suggested that Replenishment solves. On a general level, the author argues that Replenishment could be used to solve the problem of matching demand and supply in different local units throughout the system, reducing the need to rely on external (leased) labor. As noted in the post-intervention findings, capacity is dedicated to local units based on historical developments rather than actual demand. Since the total available capacity typically exceeds total demand, local units have excess capacity. As the workload is distributed evenly between all available caregivers, all caregivers are activated, and consequently, unavailable for transfer to units experiencing shortages. This creates a mismatch between demand and supply at different locations. Excess capacity is consumed locally, while shortages need to be filled with external labor. The practice and consequence of activating all caregivers locally is presented conceptually in Figure 46. The example illustrates a day shift in one local unit. In the current state, all eight available caregivers are activated locally. This results in the accumulation of visits in the morning, a low workload per route, excess capacity in the afternoon, and a T% of only 40%. In the future state, demand is leveled so that it can be satisfied by five caregivers. This represents the level of capacity needed to ensure that the T% per route is roughly 60%.79 This constitutes the base capacity. By activating only the minimum number of 79
As earlier noted, this is the level of performance currently sought by EHC. A T% of 60% would still leave sufficient time for back office activities. 163
Chapter 9 Contribution & Implications
caregivers needed to achieve this, three caregivers are left free for transfer to any other unit experiencing shortages. In the example, however, one caregiver remains unactivated at the local level. The unactivated caregiver constitutes a local buffer, ensuring that the local unit can handle any sudden variation (e.g., emergencies), without the need to reschedule the other caregivers’ routes. Office
Visits
Break
Free for Transfer
Current State Caregiver 1 Caregiver 2 Caregiver 3 Caregiver 4 Caregiver 5 Caregiver 6 Caregiver 7 Caregiver 8
T%=40%
8 a.m.
Caregiver 1 Caregiver 2 Caregiver 3 Caregiver 4 Caregiver 5 Caregiver 6 Caregiver 7 Caregiver 8
9
10
11
12
1 p.m. 2
3
4
T%=60%
Local Buffer Transfer to resource pool
Future State Figure 46. Multiple parallel field service processes. Dividing the workload evenly between all locally available caregivers reinforces the artificial accumulation of demand in the morning.
Applying Replenishment to Home Care Like pushing goods downstream and holding large inventories at retailers, dedicating caregiver positions to local units means that caregiver inventory is held at numerous locations. According to the principle of aggregation, the variation in demand and supply is much greater at the local unit level than at the global level. Therefore, the author suggests that excess bench capacity (i.e., inventory) be held at the global level in a common (‘global’) resource pool, from which caregivers be distributed on the basis of local variations in demand and supply. Following Replenishment, each local unit should be resupplied or desupplied (Ricketts 2007), on the basis of the actual demand. That is, if local demand exceeds local
164
Th heorry off Co onsttraiints in Fiel F ld Serv S vice
caapaacityy,800 adddittion nal carregivverrs aare sup ppliied fro om thee reeso urcce poo p ol. Like L ewiise, iff local deemaand deecreeasees (e.g ( g., aas a ressultt off ho osp pitallizaatioons)) orr local cap paccityy in ncreeases (e.gg., carregiiverrs retu r urniingg frrom m siick leaave)), so s tthaat exce e ess cap paccityy em meergees, ccareegivverss arre retu r urneed tto the t ressouurcee po ool (i.ee., ddesu upp plied).
Local Unit Local Unit
+ _
Local Unit _
Buffer 2
+
Buffer 1 Skill Group 1
_
+ Local Unit
+
Global Resource Pool
+
Local Unit
_
+ _
Local Unit
Skill Group 2 _
_ +
_
+ Local Unit
Local Unit Local Buffer Base Capacity
Repleenisshm Enviiron Figurre 477. R ment in a Ho omee Caare E nmen nt.
onceeptually illus This T s is co i straatedd inn Fiiguure 47. Accco ordiing to Ricckeetts (200077), tthe onsiist of o sep f difffereent typ com mmo on rresourrce po ool neeeds to co s araate b buffferrs for pes ps, wh As Ric R kettts not of o skkill group hosee reeso ourcces aree geeneerallly sub s bstittutaablee. A n tes, osees o of Rep R plen g oupss in “forr puurpo nish hmeent,, skkill gro n seerviicess arre rougghlyy an nalo ogo ous m ans sep o prodduccts iin iinduustrry” (p. 766). In thee caase of homee caare, thiis mea parrate to basic em buff b ferss foor b mp ployyeess an nd rreggisteered d nurs n ses. Naaturallly, aadd ditio onaal bufffers e perttise in demeentia), or ressouurcees can caan be useed forr sp peciial skillls (e.gg., exp c be 800
hold T% %w wouldd bee hiigheer th han a sp pecifiedd thrresh d levvel (e.g. ( , 600%),, orr acttual con ncurrren nt tim meourcces. crriticcal ddemaand reqquirees a largge num n ber of rreso 165
Chapter 9 Contribution & Implications
present simultaneously in several buffers. For example, registered nurses can be present in both buffers, since they meet the requirements for performing all types of home care activities. It may useful further be to maintain a small local buffer, possibly divided between skill groups. The motivation is that sudden variation, such as emergencies, may require a quick response. If excess capacity is held at a separate location, the resupply may inevitably take some time. To keep the local buffer as small as possible, it may be reasonable to ‘fill it’ with resources from skill group 1. Since registered nurses have a higher level of qualification, they are allowed to perform all activities and are therefore more substitutable. Discussion Aggregating excess capacity in a common resource pool is argued to have several benefits. First, and perhaps most importantly, it increases the ability to cope with variation by matching demand with supply throughout the system. After all, variation in supply and demand is much lower at the global level than in the local units. Thus, it will probably eliminate shortages and thereby the need to rely on external labor. In practice, however, achieving the necessary free transferability of caregivers between local units will require a renegotiation of the caregivers’ contracts. Second, it should serve to counteract the artificial accumulation of non-timecritical services during peak time. Activating only as many local caregivers as needed to achieve a certain T% threshold level means that there is not enough local (base) capacity left at the local level to maintain uneven service production. Without excess capacity, the natural tendency to divide the workload evenly between caregivers is no longer a problem, but a sensible human resource policy. Third, it enhances operational transparency. Holding excess capacity in common skill group buffers means that excess capacity is transparent and actually free for reallocation, rather than ‘hidden’ and consumed locally through unnecessary activation. Since the level of excess capacity is apparent, it is possible to monitor how much the demand can actually increase before additional resources need to be employed. Monitoring the need for resupply may help determine whether the size of the base capacity and local buffer is appropriate. If the same local unit requires frequent resupply, then its base capacity or local buffer may need to be increased.
166
Theory of Constraints in Field Service
Finally, since local units serve a mutual pool of customers, the author would argue that reducing base capacity is likely to reduce the number of different caregivers serving the same customer. Thus, it stands to reason that dividing the workload between fewer staff (base capacity) would reduce the number of ‘familiar’ caregivers visiting the same customer. In other words, it may help local units meet the quality guidelines. This consideration also reinforces the justification of a local buffer, as caregivers supplied from the common resource pool are bound to be ‘new faces’ unfamiliar with the customer. 9.1.3
Applicability of TOC to a Field Service Environment
The study suggests that the thinking processes (TP) are perhaps the most directly applicable TOC tools for a field service environment. As illustrated in the empirical study, they provide an effective way of determining the factors underlying poor productivity. This corroborates Moss’s claim (Moss 2007, p.4), that “it may be the TOC thinking processes and problem-solving techniques that provide the most benefit to services”. Because of the differing structure and workflow of the field service processes, Drum-Buffer-Rope (DBR) scheduling is not appropriate, at least in its traditional form. The process of ongoing improvement (POOGI), however, still remains applicable, even though the subordination step takes a different form (the other steps remain unchanged). Rather than subordinating different operations in the same process to the constraint using DBR, operations or resources working as ‘parallel’ independent processes need to be subordinated to the system’s constraint; this takes the form of demand or the aggregated capacity of multiple independent resources at different points in time. For instance, in the home care unit that was studied, this means subordinating the efficiency of individual field operators (caregivers) to the levelness of service provision. The motivation is that level provision will increase the efficiency of the system as a whole, since less capacity is needed to satisfy demand, and capacity can be utilized evenly throughout the day. Level service provision also increases the system’s ability to cope with increasing time-critical demand. The author further argued for the applicability of replenishment to home care. However, in the current environment, adopting replenishment would require the renegotiation of caregiver contracts, which is a politically sensitive issue. While it is accepted conceptually, according to discussions with home care 167
Chapter 9 Contribution & Implications
professionals in both Espoo and other municipalities, replenishment could not be implemented in the available time frame. And so its applicability needs to be empirically verified through future research. The TOC performance measurements are to some extent transferable to a public home care environment. Some challenges are nevertheless present. First, defining the goal in a comprehensive and unambiguous and yet easily measurable way is difficult. As first suggested by Ronen et al. (2006), the goal may be to “increase the relevant performance measures versus the organization’s goal” (Ronen & Pass 2010, p.845). Second, as explained in Section 4.1.7, the traditional bottom-line measurements, such as net profit (or loss), return on investment, and cash flow are largely irrelevant in a public health service environment. While the operational performance measurements can be translated into productivity through simple calculations, they do not incorporate any information regarding the effectiveness of the service. Since this was beyond the scope of this dissertation, it is left for future research. It stands to reason that TOC performance measurement of the system in its traditional form would be applicable to the wider area of for-profit field services. The only difference is that inventory consists largely of labor. However, in field services such as maintenance (i.e., after-sales service), in which spare parts inventories are present, inventory may perhaps be defined as consisting of both labor and physical products. Essentially, both constitute investments in things the company aims to sell. For a more comprehensive review of other relevant performance measurements of this type of field service, the reader is advised to refer to Klarman & Klapholtz (2010).
9.2
FACTORS LIMITING PRODUCTIVITY IN HOME CARE
This section presents the empirical contribution of this dissertation. It begins by summarizing the central empirical findings in order to answer research question number 2: What constrains the productive use of labor in public home care? This is followed by a brief discussion of the effects of a peak time resource constraint.
168
Factors Limiting Productivity in Home Care
9.2.1
What Constrains the Productive Use of Labor in Public Home Care?
Productivity is approached from an output perspective, i.e., the ratio of output (or throughput81) to input. Thus, productivity can be improved by providing 1) more throughput (T) with the current resources, 2) the current level of throughput with fewer resources, or 3) a combination of both alternatives. On the basis of the empirical findings, it is argued that the following factors constrain the productivity of home care organizations, exemplifying the characteristics outlined earlier in Chapter 4. Since the dominant input is labor (i.e., caregivers), productivity here refers to labor productivity. The first factor describes the general phenomenon (or effect) that inhibits the productive use of labor, while factors 2-4 explain the underlying core problems, or reasons for the phenomenon’s existence. 1) Artificially high peak time load (uneven distribution of demand) Since all demand must be satisfied, peak time load (i.e., demand+travel) determines the minimum level of capacity needed.82 Therefore, if the peak time load is artificially high, the minimum level of capacity needed is artificially high as well. The peak time load is artificially high because non-time-critical visits are performed during peak hours. This needlessly shifts demand to the morning, increasing the capacity requirements. As few visits remain in the afternoon, while capacity remains largely unchanged, the result is a high level of excess bench capacity during off-peak hours. The bench capacity cannot be used to produce more throughput, because most demand has been satisfied in the morning. In other words, subject to an artificially high peak time load, more capacity is required to produce the given amount of throughput. Conversely, if demand were level throughout the day, less capacity would be needed to satisfy the given demand, and the capacity could be put to productive use throughout the entire day. 2) Minimizing travel Visiting nearby customers consecutively irrespective of time-criticality in order to minimize travel means that non-time-critical visits are performed during peak hours.
81
Note that the definition of throughput used in this dissertation renders it synonymous with output. 82 Because capacity is rigid – i.e., capacity cannot be reduced as demand falls – peak time requirements set the capacity level for an entire shift. 169
Chapter 9 Contribution & Implications
3) Capacity is dedicated to local units Since local design capacity is based on historical developments rather than demand, excess capacity tends to exist. The fact that the capacity is dedicated to local units limits the organization’s ability to reallocate caregivers between local units on the basis of actual demand. Thus, if excess capacity exists it is consumed locally, but if shortages occur, they are filled with external leased labor.83 In other words, while the organization as a whole has more than sufficient capacity to cope with all shortages, dedicating caregiver positions to local units encourages the reliance on external labor84 to cope with shortages. 4) Activating all locally available caregivers even though excess capacity exists If, in a situation where excess capacity exists, each caregiver is assigned a route (i.e., activated), the workload per route becomes low, meaning that some locally available caregivers are activated unnecessarily. This has the following implications. First, activated caregivers cannot be reassigned, forcing units experiencing shortages to rely on external leased labor (or substitutes). Second, assigning caregivers routes with a low workload promotes the accumulation of non-time-critical demand in the morning. If all available caregivers are activated, and the workload per route is low, and each route starts at the beginning of the shift, then most visits are performed in the morning. (Each caregiver is fully utilized as long as uncompleted visits remain on their route. Consequently, capacity is fully utilized during peak time, although it need not be.) This fosters a culture where customer visits are largely concentrated into peak hours. As demonstrated in this study, changing such a culture and the practices it involves may prove difficult. When peak time shortages occur (e.g., as a result of absenteeism), these are often filled with leased labor instead of leveling demand so that it can be satisfied with fewer caregivers.85
83
Incidentally, this corresponds to the argument of TOC that in a production process delays accumulate downstream, while saved time is lost. 84 The findings were presented to and discussed with the heads of several Finnish home care units (November 29th, 2011), according to whom the reliance on external labor is a common problem. The only difference is that instead of labor being leased (which is rare), substitutes are employed directly by the local units. The effect is, however, the same and the cost of this practice is roughly equivalent to that of leasing labor. 85 In the current environment, scheduling is essentially done manually using a primitive scheduling interface, connected to the electronic medical record. As a result of the many scheduling conditions, manual last-minute re-scheduling of the routes is time-consuming. As illustrated by Eveborn et al. (2006; 2009), this constraint can be eliminated using scheduling technology (optimization software), which largely automates the process, enabling quick rescheduling to take place. 170
Factors Limiting Productivity in Home Care
9.2.2
The Effects of Uneven Demand and the Ensuing Peak Time Resource Constraint
First, as demand for home care is projected to increase, time-critical demand targeting the morning can be expected to increase as well. Since capacity is fully utilized during morning peak hours, it limits the organization’s ability to cope with increasing morning demand. Second, the fact that the capacity is temporarily fully utilized renders the organization as a whole vulnerable to fluctuations in demand (e.g., customers returning home after hospital stays) and supply (e.g., sick leaves). For instance, if 10 visits are scheduled at exactly the same time, then 10 caregivers will be needed. Consequently, a small fluctuation, such as one caregiver falling ill, creates a shortage. Third, the larger the number of simultaneous routes, the more vehicles and other appliances that are needed. For example, if demand could be satisfied with seven caregivers, but all 10 available caregivers are activated, then 10 cars will be needed instead of seven.86 Furthermore, if only seven cars are available but 10 are needed, then some caregivers will most probably need to carpool to different locations (unless other forms of transportation are feasible). This serves to emphasize the natural tendency to visit all the customers in one area before moving on to the next, since carpooling caregivers become somewhat dependent upon one another’s schedules. In other words, artificially high peak time load and the consequent poor productivity pose a risk of becoming self-fulfilling. More caregivers are (temporarily) needed, while eliminating the core problems behind the artificially high load (e.g., minimizing travel) becomes more difficult, for instance, because of the need to carpool. It should be noted that here the lack of cars is a dummy constraint. Leasing additional cars is relatively inexpensive, but may help eliminate the urge to minimize travel as a result of carpooling. However, if demand were leveled, and only the required number of caregivers were activated, then an oversupply of cars would exist. Therefore, while this dummy constraint may exist in the current environment, it would vanish if demand were leveled and only as many caregivers activated as were needed to maintain a reasonable workload per route.
86
The inadequacy of cars was noted by numerous caregivers and foremen as a problem. 171
Chapter 9 Contribution & Implications
9.3
MANAGERIAL IMPLICATIONS
This section presents and discusses the managerial implications. First, four design propositions are briefly stated. These are combined and compressed into two overarching design propositions following CIMO-logic. Second, the practice and consequences of overestimating demand are deliberated. Third, the costs associated with increasing demand are debated. The section concludes with a discussion of the fallacy of basing make-or-buy decisions on unit cost. 9.3.1
Design Propositions
This section summarizes the design propositions. The list of design propositions presented earlier (Chapter 7: Intervention) is expanded to incorporate replenishment principles. These are based on the post-intervention identification of two additional core problems, which serve to reinforce the artificial accumulation of non-time-critical demand in the morning. Design proposition 1: Level demand by offloading non-time-critical visits to off-peak hours.
Shifting non-time-critical visits to off-peak hours breaks the peak time resource constraint, extending the market constraint to cover the entire day. This seeks to improve the organization’s ability to make the most of its available labor capacity, while making excess capacity transparent. Offloading non-time-critical visits requires the core problem to be eliminated, hence design proposition 2: Design proposition 2: Prioritize level demand over minimized travel.
In other words, during periods (e.g., the morning) when time-critical demand is prevalent, perform only time-critical visits. Break the policy constraint: do not try to minimize travel by performing non-time-critical visits to customers living nearby. The capacity required to satisfy time-critical demand determines the capacity level of the entire shift. Following CIMO-logic, the two design propositions can be combined into the following joint proposition: In the context of public home care operations (where capacity is rigid), level demand throughout each shift (intervention) to reduce the capacity required to satisfy demand (mechanism), in order to improve the productive use of labor (sought outcome).
172
Managerial Implications
Based on the argument that implementing replenishment principles may resolve the problems related to poor resource allocation, the following two design propositions are suggested. Design proposition 3: Only activate as many caregivers locally as needed to ensure that the average T% per route remains within appropriate threshold limits.
In other words, do not automatically divide the workload evenly between all the caregivers at hand. If excess capacity exists, it will be consumed locally, leading to reduced operational performance (T%) of the local unit. This practice will further reinforce the accumulation of non-time-critical visits in the morning, creating a false impression of the level of capacity actually required. Although this design proposition was not systematically tested, some evidence in its favor does exist. In the weeks after it was presented to the staff and its underlying logic clarified, the use of leased labor decreased significantly (Section 8.3.). Design proposition 4: Maintain excess capacity in a common resource pool consisting of skill group buffers, and resupply or desupply local units according to the actual demand.
Transfer excess capacity to a resource pool, from which capacity is reallocated to local units according to the actual demand. Again, following CIMO-logic these two design propositions can be combined into the following overarching design proposition: In the context of home care operations, implement replenishment principles (intervention), to reallocate resources according to actual demand (mechanism), in order to reduce the effects of inevitable variation (sought outcome).
Transferability of the Design Propositions The design propositions act as general templates for resolving classes of managerial problems. This implies that the details of their implementation need to be worked out separately in every organization. Note that since only one home care organization was studied in depth, limitations to the transferability of the design propositions may exist. For instance, assumptions such as inflexible capacity may not hold in all home care environments. That having been said, on the basis of discussions with home care professionals from a large number of different municipalities in Finland, the problems experienced appear to be the same, although their order of prominence may differ somewhat. This suggests that the operations, policies, 173
Chapter 9 Contribution & Implications
and practices in different home care units are fairly similar, which speaks in favor of the transferability of the design propositions. 9.3.2
Overestimating Demand
As noted in Section 8.1.2, demand tends to be overestimated in the care plan; customers generally need a lower level of service than planned. This obviously impairs the transparency of actual demand, and thus may distort capacity management
by
inhibiting
the
appropriate
allocation
of
resources.
Overestimated demand can create an exaggerated impression of the capacity level required, both on the local and global level. The implication is that the number of caregiver positions becomes inflated, ultimately leading to excess capacity. As argued earlier (Section 8.2.2), excess capacity, combined with the the natural tendency to activate all caregivers locally, serves to reinforce the accumulation of non-time-critical demand in the morning. 9.3.3
The Effect of Increasing Demand on the Cost of Home Care
There are two main drivers behind the projected increase in demand for home care. The first and foremost is a growing elderly population. The number of individuals eligible to receive publicly provided home care (according to the current acceptance criteria) is expected to increase. The second driver is the desire to reduce the number of individuals in long-term institutional care (Ministry of Social Affairs and Health 2008). While the locus of this structural renewal will be a transfer of customers from institutional care to sheltered housing and residential units, a likely development is that home care will have to serve more dependent customers in the future (i.e., the upper threshold for home care eligibility may be raised). In considering whether or not to transfer certain customers to home care (i.e., elevating the market constraint), policy and decision makers should consider the following. In the presence of a peak time resource constraint (i.e., capacity is fully utilized), any additional peak time demand will require a higher level of capacity. Since home care is labor-intensive, and labor capacity constitutes a largely fixed and dominant operating expense (~85%), higher peak time demand translates directly into higher operating expense.87 On the other hand, in the presence
87
The assumption is that the duration of customer visits cannot be shortened in order to serve more customers with the current capacity
174
Managerial Implications
of excess capacity in the afternoon, satisfying increasing demand in the afternoon is virtually free, since this does not require an increase in capacity.88 In other words, a peak time resource constraint is a lever that governs the operating expense of the organization. Increasing time-critical demand targeting peak hours is bound to increase the cost of the system as a whole, while more non-time-critical demand can be satisfied without any additional expense. Abandoning the Practice of Outsourcing Certain Home Care Services In the case of EHC, this consideration also relates to outsourced home care. To markedly improve T%, EHC needs more demand. Demand can be expected to grow in the long term. In the short to medium term, however, one way of increasing demand to improve T% is to provide services that are currently outsourced in-house. Following the logic presented here, the author argues that the effect this may have on peak time load should be one of the primary considerations. If the currently outsourced services target peak hours, then taking over these services is likely to require additional capacity (and operating expense), unless current demand is first leveled. Outsourced services targeting the afternoon, however, could be taken over by EHC without any notable extra expense. 9.3.4
Unit Cost Should not be Used for ‘Make-or-Buy’ Decisions
Unit cost, or the cost of one hour of throughput (the ratio of throughput to operating expense), is the most commonly used bottom-line measurement of productivity. Its use as a general financial indicator may be justified, as it provides a relative measurement of how much throughput the operating expense bought. However, it should not be taken as representing the actual cost of producing one hour of throughput. The peak time load determines the required level of capacity of an entire shift, and capacity is the main driver of operating expense. As previously explained, this means that the bulk of the largely fixed operating expense is determined by the throughput produced during peak time. In other words, the actual cost of producing an hour of throughput is considerably higher than the unit cost during peak time, and is virtually free in off-peak hours.
88
The increased variable cost of serving more customers, such as additional fuel consumption as a result of more travel, is negligible relative to the fixed cost of capacity. 175
Chapter 9 Contribution & Implications
From this it follows that unit cost should not be used when making decisions as to whether to provide a service in-house or outsource it to private providers. Rather, from a financial standpoint, the ‘make-or-buy’ decision should be made on the basis of its effect on the actual cost of providing the service, which in turn is dependent on the timing of the service. Outsourcing some peak-time services may be justified, since it reduces the need for capacity, and thereby operating expense. Naturally, the operating expense thus saved would need to outweigh the cost of outsourcing. Outsourcing services in the afternoon, on the other hand, should be avoided. It does not reduce the need for capacity, which is already fixed based on peak time requirements, but increases operating expense. Unit cost can only be used for the make-or-buy decision when deciding whether or not to outsource an entire home care unit. Even then, it is hardly a perfect indicator. Unit cost incorporates the operating expense attributed to administrative staff, commonly shared by other health service units. The administrative costs would typically remain when the home care unit was outsourced. Consequently, some fixed operating expense is still left with the parent organization. Although perhaps minor in relative terms, the remaining operating expense needs to be recognized and gauged against the money possibly saved from outsourcing.
9.4
LIMITATIONS & FUTURE RESEARCH
TOC has been researched, adopted for, and implemented in a variety of service industries, including health services, with very persuasive results. Nevertheless, TOC has mostly been applied to facility-based services, which resemble traditional manufacturing and distribution processes enough to allow for the direct application of many TOC tools (Ricketts 2010). As this dissertation highlights, TOC is suitable for a field service context, and home care in particular, whose processes express a very different structure. The study has shown that TOC can provide home care units with a systematic framework for focusing improvement efforts on the things that matter most. More research, however, is needed on TOC in field services and home care to find more empirical support. Because of the in-depth problem-solving nature of the research, only one home care unit was studied. To validate the findings and the transferability of the design propositions, these need to be tested in other home care units as 176
Limitations & Future Research
well. The core problems identified using the thinking process may, of course, be unit-specific. However, discussions with representatives of several other home care units suggest that the policies and practices identified here as core problems are common. That having been said, their generalizability as core problems need to be verified. While the core problems may be unit-specific, the design propositions are inherently of a more generic nature, in that they provide general templates for dealing with certain phenomena: 1) unevenly distributed demand, and 2) poor resource allocation. To judge from the literature (e.g., Eveborn et al. 2009), as well as discussions with Finnish home care providers, these phenomena are quite common in home care. Both phenomena are, however, very much driven by necessary conditions, such as the somewhat restricted flexibility of labor capacity, stemming from certain countries’ legislation and labor agreements. Therefore the existence of the phenomena and their underlying logics may not hold in a wider international context. The author suggests that future research be performed in the form of longitudinal studies that incorporate a change management component. This could, for instance, be done using the full range of thinking processes. After all, it can be argued that the failure to reap the full benefits of the intervention was due to a failure to communicate the underlying reasoning to the caregivers. Replenishment (design propositions 3 & 4) could not yet be implemented in the organization that was studied. Thus, the applicability of Replenishment for a home care environment needs to be tested in future research. The author also suggests testing the applicability of Replenishment in a wider range of field services. As argued earlier (Section 9.1.2), field services share some distinctive characteristics with professional, scientific, and technical services (PSTS), to which Replenishment has been applied (Ricketts 2007; Ricketts 2010). This suggests that Replenishment may be applicable as a resource management tool, even in contexts where labor is not assigned to various local offices. As explained earlier, artificially high peak time load stems from the practice of performing non-time-critical services during peak hours. To avoid this, nontime-critical tasks need to be clearly distinguished from time-critical ones. The author therefore encourages health professionals to study and define what truly constitutes time-critical need.
177
Chapter 9 Contribution & Implications
The different structure of field service processes may have additional implications for TOC, which have not been identified in this dissertation. Adapting TOC tools from the logistics and performance measurement branches to a field service environment requires the characteristics of field service processes to be fully understood and clearly defined. This calls for other types of field services to be studied as well. If traditional drum-bufferrope scheduling is not applicable to this environment, then how should organizations go about subordinating the processing rate of individual resources to the needs of the system? The author encourages further research on the applicability of buffer management and throughput accounting to a field service context. The author believes that buffer management may be a useful tool for managing skill group buffers in a field service context as well (cf. Ricketts 2007). Also, as briefly explained, peak time demand governs the operating expense attributed to capacity. The question for future research is whether the throughput accounting concept of a constraint-minute is applicable to this environment, even in the absence of tightly coupled sequentially dependent events.
178
REFERENCES
Adelman, P.J., 1995. Applying theory of constraints in a service environment: Hannah’s Donut Shop (a case study of performance, measurement and manufacturing design). In APICS Constraints Management Symposium and Technical Exhibit: Proceedings, Phoenix, Arizona, USA. pp. 1-12. Agnihothri, S.R., Mishra, A.K. & Simmons, D.E., 2003. Workforce crosstraining decisions in field service systems with two job types. The Journal of the Operational Research Society, 54(4), pp. 410-418. Agnihothri, S.R., Sivasubramaniam, N. & Simmons, D.E., 2002. Leveraging technology to improve field service. International Journal of Service Industry Management, 13(1), pp. 47-68. Van Aken, J.E., 2004. Management research based on the paradigm of the design sciences: The quest for field-tested and grounded technological rules. Journal of Management Studies, 41(2), pp. 219-246. Akjiratikarl, C., Yenradee, P. & Drake, P.R., 2007. PSO-based algorithm for home care worker scheduling in the UK. Computers & Industrial Engineering, 53(4), pp. 559-583. Ala-Risku, T., 2009. Installed base information: Ensuring customer value and profitability after the sale. Dissertation. Helsinki University of Technology. Available at: http://lib.tkk.fi/Diss/2009/ isbn9789522480064/ [Accessed November 22, 2010]. Apte, A., Apte, U.M. & Venugopal, N., 2007. Focusing on customer time in field service: A normative approach. Production and Operations Management, 16(2), pp. 189-202. Bailey, C.A., 1996. A guide to field research, Pine Forge Pr. Begur, S.V., Miller, D.M. & Weaver, J.R., 1997. An integrated spatial DSS for scheduling and routing home-health-care nurses. Interfaces, 27(4), pp. 35-48. Belvedere, V. & Grando, A., 2005. Implementing a pull system in batch/mix process industry through Theory of Constraints: A case-study. Human Systems Management, 24(1), pp. 3-12. Bertels, S. & Fahle, T., 2006. A hybrid setup for a hybrid scenario: combining heuristics for the home health care problem. Computers and Operations Research, 33(10), pp. 2866-2890.
179
References
Blackstone, J.H., 2010a. A review of literature on drum-buffer-rope, buffer management and distribution. In J. F. Cox III & J. G. Schleier, eds. Theory of Constraints Handbook. McGraw-Hill, pp. 145-173. Blackstone, J.H., 2001. Theory of Constraints - A status report. International Journal of Production Research, 39(6), pp. 1053-1080. Blackstone, J.H. ed., 2010b. APICS dictionary 13th ed., Chicago, Illinois: APICS The Association for Operations Management. Blackstone, J.H., Gardiner, L.R. & Gardiner, S.C., 1997. A framework for the systemic control of organizations. International Journal of Production Research, 35(3), pp. 597-609. Blumberg, D.F., 1994. Strategies for improving field service operations productivity and quality. Service Industries Journal, 14(2), pp. 262-277. Boyd, L.H. & Cox, J.F., 1997. A cause-and-effect approach to analyzing performance measures. Production and Inventory Management Journal, 38, pp. 25-32. Boyd, L.H. & Gupta, M.C., 2004. Constraints management: What is the theory? International Journal of Operations & Production Management, 24(4), pp. 350-371. Boyd, L.H., Gupta, M.C. & Sussman, L., 2001. A new approach to strategy formulation: opening the black box. The Journal of Education for Business, 76(6), pp. 338-344. Bramorski, T., Madan, M.S. & Motwani, J., 1997. Application of the Theory of Constraints in banks. The Bankers Magazine, pp. 53-59. Bredström, D. & Rönnqvist, M., 2008. Combined vehicle routing and scheduling with temporal precedence and synchronization constraints. European Journal of Operational Research, 191(1), pp. 19-31. Breen, A.M., Burton-Houle, T. & Aron, D.C., 2002. Applying the Theory of Constraints in health care: Part 1 - The philosophy. Quality Management in Health Care, 10(3), pp. 40-46. Broekhuis, M., de Blok, C. & Meijboom, B., 2009. Improving client-centred care and services: the role of front/back-office configurations. Journal of Advanced Nursing, 65(5), p. 971. Burton-Houle, T., 2001. The theory of constraints and its thinking processes. The Goldratt Institute, New Haven, Connecticut (US). Available at: http://www.public.navy.mil/airfor/nae/AIRSpeed%20Documents/T OC%20and%20its%20Thinking%20Processes.pdf [Accessed July 8, 2011]. Button, S.D., 1999. Genesis of a communication current reality tree – the three-cloud process. In Constraints Management Symposium Proceedings. Phoenix, pp. 31-34.
180
References
Button, S.D., 2000. The three-cloud process and communication trees. In APICS Constraints Management Technical Conference Proceedings. Tampa (FL), pp. 119-122. Chahed, S. et al., 2009. Exploring new operational research opportunities within the home care context: the chemotherapy at home. Health Care Management Science, 12(2), pp. 179-191. Chakravorty, S.S., 2001. An evaluation of the DBR control mechanism in a job shop environment. Omega, 29(4), pp. 335-342. Chakravorty, S.S. & Atwater, J.B., 1994. How Theory of Constraints can be used to direct preventive maintenance. Industrial Management, 36(6), pp. 10-13. Cheng, E. & Rich, J.L., 1998. A home health care routing and scheduling problem. , Technical Report CAAM TR98-04, Rice University. Coman, A. & Ronen, B., 1994. IS management by constraints: coupling IS effort to changes in business bottlenecks. Human Systems Management, 13, pp. 65-72. Coman, A. & Ronen, B., 1995. Information technology in operations management: a theory-of-constraints approach. International Journal of Production Research, 33(5), pp. 1403-1415. Corbin, J.M. & Strauss, A.L., 2008. Basics of qualitative research: Techniques and procedures for developing grounded theory 3rd ed., CA: Sage Publications, Inc. Cox, J.F. & Schleier, J.G. eds., 2010. Theory of Constraints Handbook, McGrawHill. Cox, J.F., Mabin, V.J. & Davies, J., 2005. A case of personal productivity: Illustrating methodological developments in TOC. Human Systems Management, 24(1), pp. 39-65. Cox, J.F. & Spencer, M.S., 1998. The constraints management handbook, CRC Press. Cox, J.F. et al., 1998. A cause and effect approach to analyzing performance measures: Part 2 - Internal plant operations. Production and Inventory Management Journal, 39, pp. 25-33. Davies, J., Mabin, V.J. & Balderstone, S.J., 2005. The theory of constraints: a methodology apart? – a comparison with selected OR/MS methodologies. Omega, 33(6), pp. 506-524. Deming, W.E., 1986. Out of the crisis, MIT Center for Advanced Engineering Study. Cambridge, Massachusetts. Deming, W.E., 1988. Out of the crisis: quality, productivity and competitive position, Cambridge University Press. Denyer, D., Tranfield, D. & van Aken, J.E., 2008. Developing design propositions through research synthesis. Organization Studies, 29(3), p. 393. 181
References
Dettmer, H.W., 2001. Beyond Lean manufacturing: Combining Lean and the Theory of Constraints for higher performance. Port Angeles, US. Dettmer, H.W., 1998. Breaking the constraints to world-class performance, American Society for Quality. Dettmer, H.W., 1997. Goldratt’s theory of constraints: a systems approach to continuous improvement, Asq Pr. Dettmer, H.W., 1995. Quality and the theory of constraints. Quality Progress, 28(4), pp. 77-82. Donabedian, A. & Bashshur, R., 2003. An introduction to quality assurance in health care, New York: Oxford University Press. Drummond, M.F., Sculpher, M.J. & Torrance, G.W., 2005. Methods for the economic evaluation of health care programmes, Oxford University Press, USA. Eden, Y. & Ronen, B., 1993. Improving workflow in the insurance industry: A focused management approach. Journal of Insurance Issues, 16(1), pp. 4962. Eklund, F.J., 2008. Resource constraints in health care - Case studies on technical, allocative and economic efficiency. Dissertation. Helsinki University of Technology. Eveborn, P., Flisberg, P. & Rönnqvist, M., 2004. Home care operations. OR/MS Today, 31(2), pp. 38-43. Eveborn, P., Flisberg, P. & Rönnqvist, M., 2006. Laps Care--an operational system for staff planning of home care. European Journal of Operational Research, 171(3), pp. 962-976. Eveborn, P. et al., 2009. Operations research improves quality and efficiency in home care. Interfaces, 39(1), p. 18. Feather, J.J. & Cross, K., 1988. Workflow analysis, just-in-time techniques simplify administrative process in paper work operation. Industrial Engineering, 20(1), pp. 32-40. Fortuin, L. & Martin, H., 1999. Control of service parts. International Journal of Operations & Production Management, 19(9), pp. 950-971. Gardiner, S.C., Blackstone Jr, J.H. & Gardiner, L.R., 1993. Drum-buffer-rope and buffer management: impact on production management study and practices. International Journal of Operations & Production Management, 13(6), pp. 68-78. Goldratt R. & Weiss, N., 2005. Significant enhancement of academic achievement through application of the Theory of Constraints (TOC). Human Systems Management, 24(1), pp. 13-19. Goldratt, E.M., 1988. Computerized shop floor scheduling. International Journal of Production Research, 26(3), p. 443. 182
References
Goldratt, E.M., 2010. Introduction to TOC - My perspective. In J. F. Cox III & J. G. Schleier, eds. Theory of Constraints Handbook. McGraw-Hill, pp. 3-9. Goldratt, E.M., 1994. It’s not luck, Great Barrington, MA: Gower. Goldratt, E.M., 2008. The choice, Great Barrington, MA: North River Press. Goldratt, E.M., 1990a. The haystack syndrome: Sifting information out of the data ocean, Great Barrington, MA: North River Press. Goldratt, E.M., 1990b. What is this thing called Theory of Constraints and how should it be implemented?, Great Barrington, MA: North River Press. Goldratt, E.M. & Cox, J., 1984. The goal, Croton-on-Hudson, NY: North River Press. Goldratt, E.M. & Fox, R.E., 1986. The race 1st ed., Croton-on-Hudson, NY: North River Press. Goldratt, E.M., Eshkoli, I. & Brownleer, J., 2009. Isn’t it obvious?, North River Press. Goldratt, E.M., Schragenheim, E. & Ptak, C.A., 2000. Necessary but not sufficient, Croton-on-Hudson, NY: North River Press. Groenewald, T., 2004. A phenomenological research design illustrated. International Journal of Qualitative Methods, 3(1), pp. 1-26. Groop, P.J., 2011. Coupling front and back office activities can improve performance measurement, service quality, and provider efficiency – case: home care. In The 12th International Research Symposium on Service Excellence in Management (QUIS12). Ithaca, NY. Groop, P.J., Reijonsaari, K.H. & Lillrank, P., 2010. Applying the Theory of Constraints to health technology assessment. International Journal on Advances in Life Sciences, 2(3 & 4), pp.1 15-124. Guide, V.D. & Ghiselli, G.A., 1995. Implementation of drum-buffer-rope at a military rework depot engine works. Production and Inventory Management Journal, 36, pp. 79–83. Gupta, M.C., 2003. Constraints management--recent advances and practices. International Journal of Production Research, 41(4), pp. 647-659. Gupta, M.C. & Boyd, L.H., 2008. Theory of constraints: A theory for operations management. International Journal of Operations and Production Management, 28(10), pp. 991-1012. Gupta, M.C. & Kline, J., 2008. Managing a community mental health agency: a theory of constraints based framework. Total Quality Management & Business Excellence, 19(3), pp. 281-294.
183
References
Gupta, M.C. & Snyder, D., 2009. Comparing TOC with MRP and JIT: a literature review. International Journal of Production Research, 47(13), pp. 3705-3739. Gupta, M.C., Boyd, L.H. & Sussman, Lyle, 2004. To better maps: a TOC primer for strategic planning. Business Horizons, 47(2), p. 15. Haugen, D.L. & Hill, A.V., 1999. Scheduling to improve field service quality. Decision Sciences, 30(3), pp. 783-804. Hill, T., Nicholson, A. & Westbrook, R., 1999. Closing the gap: a polemic on plant-based research in operations management. International Journal of Operations & Production Management, 19(2), pp. 139-156. Holmström, J., Ketokivi, M. & Hameri, A.-P., 2009. Bridging practice and theory: A design science approach. Decision Sciences, 40(1), pp. 65-87. Hopp, W.J. & Spearman, M.L., 1996. Factory physics: foundations of manufacturing management, Boston (MA): Irwin/McGraw-Hill. Houle, D. & Burton-Houle, T., 1998. Overcoming resistance to change the TOC way. In APICS–Constraints Management Symposium Proceedings. pp. 15-17. Hunink, M.G., 2001. In search of tools to aid logical thinking and communicating about medical decision making. Medical Decision Making, 21(4), p. 267. Inman, R.A., Sale, M.L. & Green Jr, K.W., 2009. Analysis of the relationships among TOC use, TOC outcomes, and organizational performance. International Journal of Operations & Production Management, 29. Jacob, D., Bergland, S. & Cox, J., 2009. Velocity: Combining Lean, Six Sigma and the Theory of Constraints to achieve breakthrough performance - A business novel, New York: Free Press. Kane, R.L., 2006. Understanding health care outcomes research, Ontario: Jones & Bartlett Learning. Kershaw, R., 2002. Using TOC to “cure” healthcare problems. Accounting Management Quarterly. Kim, S., Mabin, V.J. & Davies, J., 2008. The theory of constraints thinking processes: retrospect and prospect. International Journal of Operations & Production Management, 28(2), pp. 155-184. Klarman, A. & Klapholtz, R., 2010. Customer support services according to TOC. In J. F. Cox III & J. G. Schleier, eds. Theory of Constraints Handbook. McGraw-Hill, pp. 879-897. Kujala, J. et al., 2006. Time-based management of patient processes. Journal of Health Organization and Management, 20(6), pp. 512-524.
184
References
Lee-Fay, L., Melvyn, Y. & Henry, B., 2011. A systematic review of different models of home and community care services for older persons. BMC Health Services Research, 11. Leshno, M. & Ronen, B., 2001. The complete kit concept – Implementation in the health care system. Human Systems Management, 20(4), pp. 313-318. Lillrank, P., 2009. Service processes. In G. Salvendy & W. Karwowski, eds. Introduction to Service Engineering. pp. 338–364. Lillrank, P., Groop, P.J. & Malmström, T.J., 2010. Demand and supply-based operating modes—A framework for analyzing health care service production. Milbank Quarterly, 88(4), pp. 595-615. Lillrank, P., Groop, P.J. & Venesmaa, J., 2011. Processes, episodes and events in health service supply chains. Supply Chain Management: An International Journal, 16(3), pp. 194-201. Lockamy, A. & Spencer, M.S., 1998. Performance measurement in a theory of constraints environment. International Journal of Production Research, 36(8), pp. 2045-2060. Lubitsh, G., Doyle, C. & Valentine, J., 2005. The impact of theory of constraints (TOC) in an NHS trust. Journal of Management Development, 24(2), pp. 116-131. Lusch, R.F. & Vargo, S.L., 2006. The service-dominant logic of marketing: Dialog, debate, and directions, NY:ME Sharpe Inc. Mabin, V.J. & Balderstone, S.J., 2003. The performance of the theory of constraints methodology. International Journal of Operations and Production Management, 23(6), pp. 568-595. Mabin, V.J. & Balderstone, S.J., 2000. The world of the theory of constraints: a review of the international literature, CRC Press. Mabin, V.J. & Davies, J., 2010. The TOC thinking processes. In J. F. Cox III & J. G. Schleier, eds. Theory of Constraints Handbook. McGraw-Hill, pp. 631-669. Mabin, V.J., Davies, J. & Cox, J.F., 2006. Using the theory of constraints thinking processes to complement system dynamics’ causal loop diagrams in developing fundamental solutions. International Transactions in Operational Research, 13(1), pp. 33-57. Mabin, V.J., Forgeson, S. & Green, L., 2001. Harnessing resistance: using the theory of constraints to assist change management. Journal of European Industrial Training, 25(2/3/4), pp. 168-191. Martin, K. & Wright, M., 2009. Using particle swarm optimization to determine the visit times in community nurse timetabling. In Proceedings of the 7th International Conference on the Practice and Theory of Automated Timetabling (PATAT’08), Montreal, Canada.
185
References
McNutt, R.A. & Odwazny, M.C., 2004. The theory of constraints and medical error: a conversation with Robert A. McNutt. Quality Management in Healthcare, 13(3), p. 183. Meredith, J., 1998. Building operations management theory through case and field research. Journal of Operations Management, 16(4), pp. 441-454. Meredith, J.R., 2001. Hopes for the future of operations management. Journal of Operations Management, 19(4), pp. 397-402. Ministry of Social Affairs and Health, 2008. National framework for highquality services for older people. Available at: http://www.stm.fi/ en/publications/publication/_julkaisu/1063089#en [Accessed January 25, 2011]. Moeller, S., 2010. Characteristics of services – a new approach uncovers their value. Journal of Services Marketing, 24(5), pp. 359-368. Morton, A. & Cornwell, J., 2009. What’s the difference between a hospital and a bottling factory? British Medical Journal, 339(jul20 1), p.b 2727. Moss, H.K., 2007. Improving service quality with the theory of constraints. Journal of Academy of Business and Economics, 7(3), pp. 1-15. Moss, H.K., 2002. The application of the theory of constraints in service firms. Dissertation. Clemson University (South Carolina). Motwani, J. & Vogelsang, K., 1996. The theory of constraints in practice at Quality Engineering, Inc. Managing Service Quality, 6(6), pp. 43-47. Motwani, J., Klein, D. & Harowitz, R., 1996a. The theory of constraints in services: part 1 - the basics. Managing Service Quality, 6(2), pp. 53-56. Motwani, J., Klein, D. & Harowitz, R., 1996b. The theory of constraints in services: part 2 - examples from health care. Managing Service Quality, 6(2), pp. 30-34. Niv, M.B., Lieber, Z. & Ronen, B., 2010. Focused management in a court system: Doing more with the existing resources. Human Systems Management, 29(4), pp. 265-277. Noreen, E.W. et al., 1995. The theory of constraints and its implications for management accounting, North River Press. Olson, C.T., Region, A. & Book, W., 1998. The theory of constraints: application to a service firm. Production and Inventory Management Journal, 39 (Second Quarter), pp. 55-59. Pass, S. & Ronen, B., 2003. Management by the market constraint in the hitech industry. International Journal of Production Research, 41(4), pp. 713724. Pastore, J., Sundararajan, S. & Zimmers, E.W., 2004. Innovative application: How TOC can manage human resources and eliminate workforce burdens. APICS - The Performance Advantage, (March), pp. 32-35. 186
References
Patwardhan, M.B., Sarría-Santamera, A. & Matchar, D.B., 2006. Improving the process of developing technical reports for health care decisionmakers: Using the theory of constraints in the evidence-based practice centers. International Journal of Technology Assessment in Health Care, 22(01), pp. 26-32. Phipps, B., 1999. Hitting the bottleneck. Health Management Magazine, pp. 1-3. Pope, C., Van Royen, P. & Baker, R., 2002. Qualitative methods in research on healthcare quality. Quality and Safety in Health Care, 11(2), pp. 148-152. Rahman, S.U., 2002. The theory of constraints’ thinking process approach to developing strategies in supply chains. International Journal of Physical Distribution and Logistics Management, 32(9/10), pp. 809-828. Rahman, S.U., 1998. Theory of constraints: a review of the philosophy and its applications. International Journal of Operations and Production Management, 18, pp. 336-355. Raisinghani, M.S. et al., 2005. Six Sigma: concepts, tools, and applications. Industrial Management & Data Systems, 105(4), pp.491-505. Reid, R.A., 2007. Applying the TOC five-step focusing process in the service sector. Managing Service Quality, 17(2), pp. 209-234. Reid, R.A. & Cormier, J.R., 2003. Applying the TOC TP: a case study in the service sector. Managing Service Quality, 13(5), pp. 349-369. Ricketts, J.A., 2007. Reaching the goal: How managers improve a services business using Goldratt’s Theory of Constraints, IBM Press. Ricketts, J.A., 2010. Theory of constraints in professional, scientific, and technical services. In J. F. Cox III & J. G. Schleier, eds. Theory of Constraints Handbook. McGraw-Hill, pp. 859-878. Rintala, T., Jämsä, A. & Soukainen, J., 2010. Vanhuspalvelut - Säännöllinen kotihoito (Elderly services - regular home care), Valtiontalouden tarkastusvirasto (in Finnish). Ritson, N. & Waterfield, N., 2005. Managing change: the theory of constraints in the mental health service. Strategic Change, 14(8), pp. 449-458. Robson, C., 2011. Real world research: A resource for users of social research methods in applied settings 3rd ed., Cornwall: Wiley. Ronen, B., 1992. The complete kit concept. International Journal of Production Research, 30(10), pp. 2457-2466. Ronen, B. & Pass, S., 1994. Focused management: A business-oriented approach to total quality management. Industrial Management, 36(3), pp. 9-12. Ronen, B. & Pass, S., 2010. Services management. In J. F. Cox III & J. G. Schleier, eds. Theory of Constraints Handbook. McGraw-Hill, pp. 845-858. 187
References
Ronen, B. & Spector, Y., 1992. Managing system constraints: a cost/utilization approach. International Journal of Production Research, 30(9), pp. 2045-2061. Ronen, B. & Spiegler, I., 1991. Information as inventory: A new conceptual view. Information & Management, 21(4), pp. 239-247. Ronen, B. & Starr, M.K., 1990. Synchronized manufacturing as in OPT: from practice to theory. Computers & Industrial Engineering, 18(4), pp. 585-600. Ronen, B., Coman, A. & Schragenheim, E., 2001. Peak management. International Journal of Production Research, 39(14), pp. 3183-3193. Ronen, B., Gur, R. & Pass, S., 1994. Focused management in military organizations: An avenue for future industrial engineering. Computers & Industrial Engineering, 27(1-4), pp. 543-544. Ronen, B., Pliskin, J.S. & Pass, S., 2006. Focused operations management for health services organizations, San Francisco: Jossey-Bass. Rotstein, Z. et al., 2002. Management by constraints: considering patient volume when adding medical staff to the emergency department. The Israel Medical Association Journal, (4), pp. 170-173. Roybal, H., Baxendale, S.J. & Gupta, M.C., 1999. Using activity-based costing and theory of constraints to guide continuous improvement in managed care. Managed Care Quarterly, 7(1), pp. 1-10. Sadat, S., 2009. Theory of constraints for publicly funded health systems. Dissertation. University of Toronto. Saunders, M., Lewis, P. & Thornhill, A., 2007. Research methods for business students 4th ed., Pearson Education. Schaefers, J. et al., 2007. A contribution to performance measurement in the healthcare industry: the industrial point of view. International Journal of Business Performance Management, 9(2), pp. 226-239. Scheinkopf, L.J., 2010. Thinking processes including S&T trees. In J. F. Cox III & J. G. Schleier, eds. Theory of Constraints Handbook. McGraw-Hill, pp. 729-786. Scheinkopf, L.J., 1999. Thinking for a change: Putting the TOC thinking processes to use 1st ed., CRC Press. Schmenner, R.W., 2001. Looking ahead by looking back: swift, even flow in the history of manufacturing. Production and Operations Management, 10(1), pp. 87-96. Schmenner, R.W. & Swink, M.L., 1998. On theory in operations management. Journal of Operations Management, 17(1), pp. 97-113. Schragenheim, A., 2010. Supply chain management. In J. F. Cox III & J. G. Schleier, eds. Theory of Constraints Handbook. McGraw-Hill, pp. 265-301.
188
References
Schragenheim, E. & Dettmer, H.W., 2001. Manufacturing at warp speed, Boca Raton (FL): St. Lucie Press. Schragenheim, E. & Dettmer, H.W., 2000. Manufacturing at warp speed: Optimizing supply chain financial performance, CRC Press. Schragenheim, E. & Passal, A., 2005. Learning from experience: A structured methodology based on TOC. Human Systems Management, 24(1), pp. 95104. Schragenheim, E. & Ronen, B., 1991. Buffer-management: A diagnostic tool for production control. Production and Inventory Management Journal, 2(31), pp. 18-22. Schragenheim, E. & Ronen, B., 1990. Drum-buffer-rope shop floor control. Production and Inventory Management Journal, 31(3), pp. 18-22. Schragenheim, E., Dettmer, H.W. & Patterson, J.W., 2009. Supply chain management at warp speed: Integrating the system from end to end 1st ed., Auerbach Publications. Shoemaker, T.E. & Reid, R.A., 2005. Applying the TOC thinking process: A case study in the government sector. Human Systems Management, 24(1), pp. 21-37. Siha, S., 1999. A classified model for applying the theory of constraints to service organizations. Managing Service Quality, 9(4), pp. 255-264. Silvester, K. et al., 2004. Reducing waiting times in the NHS: is lack of capacity the problem. Clinician in Management, 12(3), pp. 105-11. Simmons, D.E., 2001. Field service management: a classification scheme and study of server flexibility. Dissertation. State University of New York at Binghamton. Sinkkonen, S. et al., 2001. Kotihoidon sisältö ja tapaustutkimukset kotihoidon organisoinnista yhdistetyssä sosiaali-ja terveystoimessa (Content of home care and case studies on the organisation of home care). Kunnallistieteellinen aikakauslehti, 29(3), pp. 177-195 (in Finnish). Sommer, R. & Sommer, B.B., 1992. A practical guide to behavioral research, Oxford University Press New York. Spencer, M.S. & Cox, J.F., 1995. Optimum production technology (OPT) and the theory of constraints (TOC): analysis and genealogy. International Journal of Production Research, 33(6), pp. 1495-1504. Spoede Budd, C., 2010. Traditional measures in finance and accounting, problems, literature review, and TOC measures. In J. F. Cox III & J. G. Schleier, eds. Theory of Constraints Handbook. McGraw-Hill, pp. 335-371. Srikanth, M.L., 2010. DBR, buffer management, and VATI flow classification. In J. F. Cox III & J. G. Schleier, eds. Theory of Constraints Handbook. McGraw-Hill, pp. 175-210. 189
References
Srinivasan, M., Jones, D. & Miller, A., 2005. Corps capabilities: TOC and critical chain methodologies aren’t just for manufacturing anymore. APICS Magazine, (March). Sterman, J.D., 2000. Business dynamics: systems thinking and modeling for a complex world, Irwin McGraw-Hill. Stratton, R. & Knight, A., 2010. Managing patient flow using time buffers. Journal of Manufacturing Technology Management, 21(4), pp. 484-498. Sugimori, Y. et al., 1977. Toyota production system and kanban system materialization of just-in-time and respect-for-human system. International Journal of Production Research, 15(6), pp. 553-564. Sullivan, T.T., Reid, R.A. & Cartier, B. eds., 2007. The TOCICO Dictionary 1st ed, Washington D.C.: Theory of Constraints International Certification Organization. Available at: http://www.tocico.org/files/members/ TOC-ICODictionary1stEDv1.pdf. Swamidass, P.M., 1991. Empirical science: new frontier in operations management research. Academy of Management Review, 16(4), pp. 793-814. Sørensen, C. & Pica, D., 2005. Tales from the police: Rhythms of interaction with mobile technologies. Information and Organization, 15(2), pp. 125149. Taylor III, L.J. & Churchwell, L., 2004. Goldratt’s thinking process applied to the budget constraints of a Texas MHMR facility. Journal of Health and Human Services Administration, 26(4), p.416. Taylor III, L.J. & Sheffield, D., 2002. Goldratt’s thinking process applied to medical claims processing. Hospital topics, 80(4), p. 13. Taylor III, L.J., Murphy, B. & Price, W., 2006. Goldratt’s thinking process applied to employee retention. Business Process Management Journal, 12(5), pp. 646-670. Tepponen, M., 2009. Kotihoidon integrointi ja laatu (The Integration and quality of home care). Dissertation. University of Kuopio (in Finnish). Trietsch, D., 2005. From management by constraints (MBC) to management by criticalities (MBC II). Human Systems Management, 24(1), pp. 105-115. Tsitsakis, C.A., 2010. The problem of capacity management in Greek public hospitals. In MIBES 2010, Management of International Business and Economic Systems. pp. 541-545. Umble, M. & Srikanth, M.L., 1990. Synchronous manufacturing: Principles for world class excellence, South-Western Pub. Co. Umble, M. & Umble, E.J., 2006. Utilizing buffer management to improve performance in a healthcare environment. European Journal of Operational Research, 174(2), pp. 1060-1075.
190
References
Voss, C., Tsikriktsis, N. & Frohlich, M., 2002. Case research in operations management. International Journal of Operations & Production Management, 22(2), pp.195 - 219. Voutilainen, P., Raassina, A.-M. & Nyfors, H., 2008. Ikääntyneiden palveluiden uudet konseptit (New Concepts for Services for the Elderly), National Institute for Health and Welfare (in Finnish). Available at: http://www.stm.fi/ julkaisut/nayta/_julkaisu/1374605 [Accessed January 28, 2011]. Wadhwa, G., 2010. Viable vision for health care systems. In J. F. Cox III & J. G. Schleier, eds. Theory of Constraints Handbook. McGraw-Hill, pp. 899953. Walker II, E.D. & Cox III, J.F., 2006. Addressing ill-structured problems using Goldratt’s thinking processes. Management Decision, 44(1), pp. 137-154. Walsh, D.P., 2010. Complex environments. In J. F. Cox III & J. G. Schleier, eds. Theory of Constraints Handbook. McGraw-Hill, pp. 1045-1065. Watson, E.F. et al., 1998. A simulation metamodel for response-time planning. Decision Sciences, 29(1), pp. 217-241. Watson, K.J., Blackstone, J.H. & Gardiner, S.C., 2007. The evolution of a management philosophy: the theory of constraints. Journal of Operations Management, 25(2), pp. 387-402. Wennberg, J.E., 2010. Tracking medicine: A researcher’s quest to understand health care, New York: Oxford University Press. Wolcott, H.F., 1997. Ethnographic research in education. In R. M. Jaeger, ed. Complementary Methods for Research in Education. American Educational Research Association. Womack, D.E. & Flowers, S., 1999. Improving system performance: a case study in the application of the theory of constraints. Journal of Healthcare Management, 44(5), p. 397. Womack, J.P. et al., 2007. The machine that changed the world, New York: Simon & Schuster. Wright, J., 2010. TOC for large-scale healthcare systems. In J. F. Cox III & J. G. Schleier, eds. Theory of Constraints Handbook. McGraw-Hill, pp. 955979. Wright, J. & King, R., 2006. We all fall down: Goldratt’s Theory of Constraints for healthcare systems, Great Barrington, MA: North River Press. Yang, C.L., Hsu, T.S. & Ching, C.Y., 2002. Integrating the thinking process into the product design chain. Journal of Industrial Technology, 18(2), pp. 26. Yin, R., 1994. Case study research, Beverly Hills, CA: Sage Publications, Inc.
191
% F Q B S U NF OU �P G �* OE VT U S J B M �& OH J OF F S J OH �B OE �. B OB H F NF OU �
) " �(ŗ�,) ) *ŗ
" BM U P � % % �� � � � � � � �
ŗ
� " � ) ,3ŗ)ŗ�) (-. ,�#(. -ŗ#(ŗ� #� & �ŗ�� ,0#� � ŗ
#6 4 * / & 4 4 � � & $ 0 / 0 . : � � " 3 5 � � % & 4 * ( / � � " 3 $ ) * 5 & $ 5 6 3 & � � 4 $ * & / $ & � � 5 & $ ) / 0 0 ( : � � $ 3 0 4 4 0 7 & 3 � � % 0 $ 5 0 3 " � % * 4 4 & 3 5 " 5 * 0 / 4 �
" B M U P �6 OJ W F S T J U Z �
9HSTFMG*aefjdb+
* 4 #/ �� � �� � � � � � � � � � � �� � � * 4 #/ �� � �� � � � � � � � � � � � � �� Q E G
� * 4 4 / � �� � � � � � � �� � * 4 4 / �� � � � � � � �� � * 4 4 / �� � � � � � � � � � Q E G
� � T J U Z � " B M U P �6 OJ W F S 4 D I P P M �P G �4 D J F OD F � % F Q B S U NF OU �P G �* OE VT U S J B M �& OH J OF F S J OH �B OE �. B OB H F NF OU � X X X � B B M U P � G J �
� " � ) ,3ŗ)ŗ �) (-. ,�#(. -ŗ#(ŗ� #� & �ŗ �� ,0#� � ŗ ' B D U P S T �J NJ U J OH �1 S P E VD U J W J U Z �J O�' J F M E �4 F S W J D F � 0 Q F S B U J P OT �
+ P I B O�( S P P Q �
% 0 $ 5 0 3 " � % * 4 4 & 3 5 " 5 * 0 / 4 �