of the real vehicle: 'Ford Fiesta'. The comparison shows that the results for reduced-scale models of sufficient complexity agree quite well with the results of ...
rd
The 33
International Congress and Exposition on Noise Control Engineering
Experimental Investigation of Acoustic Resonance Properties of Vehicle Compartments R. Gormana and V.V. Krylova Department of Aeronautical and Automotive Engineering, Loughborough University, Loughborough, Leicestershire, LE11 3TU, UK [R.Gorman; V.V.Krylov]@lboro.ac.uk
Abstract [300] This paper describes the results of the experimental investigations of acoustic resonance properties of vehicle compartments carried out on reduced-scale simplified wooden models and on a real five-door saloon. The reduced-scale models had different degrees of complexity and were produced in two modifications: with rigid interior walls (modelling ‘body in white’ condition) and with walls covered by felt (modelling the absorption caused by the presence of vehicle trim). Experimental investigations included measurements of the acoustic frequency response inside the cavities. After establishing all resonant frequencies of the cavities, the spatial distributions of the corresponding acoustic modes have been measured at some fixed resonant frequencies. The obtained experimental results are compared with the results of finite element calculations. Finally, the results of the experiments on the reduced-scale models are compared with the measurements taken in the interior of the real vehicle: ‘Ford Fiesta’. The comparison shows that the results for reduced-scale models of sufficient complexity agree quite well with the results of measurements carried out in the real car.
1
INTRODUCTION
Research into vehicle interior noise has been carried out for at least four past decades [1-6]. In spite of noticeable progress, there is still insufficient understanding of the acoustic resonant properties of a vehicle interior which are paramount in defining levels and frequency contents of vehicle interior noise. The present paper describes the results of the recent research into the acoustic resonant properties of the three quarter-scale simplified models of a generic five-door saloon. As a first step, a simple rectangular cavity is investigated, and the results are compared with analytical calculations to determine errors within experimentation. As a second step, the rectangular cavity is modified with added sides to create an octagonal cavity. The final modification to the cavity involves added wooden seats, giving a more realistic representation of a vehicle interior. To model the effects of trim, felt is added to the wooden interiors of all of the three above mentioned quarter scale cavities. This is to help understand the effects of different absorption materials in the cavity, of a real car interior. To perform theoretical analysis of the above models, Finite Element Analysis (FEA) has been used, with the boundary properties of the walls set as rigid. The results of both frequency response and mode shapes are compared with the obtained experimental data.
1/8
Finally, measurements have been taken of the frequency response and mode shapes of a compartment of a real car, the Ford Fiesta. The results are compared with measurements for the model of the irregular cavity lined with felt, as this is the closest representation to a real car interior. 2
EXPERIMENTAL TECHNIQUES
A rectangular box has been made to represent the simplest quarter scale model of a car interior, with the dimensions 0.55 x 0.35 x 0.25m3 (see Figure 1). The rectangular box is the basic element of construction, so that other sections could be added at a later stage. A grid of 30mm squares was marked on the bottom of the box, so that the microphone could be positioned accurately via the metal tubing. A 2 inch speaker was used to generate the sound inside the cavity.
Figure 1: Diagram of the rectangular cavity
A HP 3566A PC Spectrum Analyser was used to measure the frequency response of the cavity. To measure frequency response of the cavity, the speaker was excited in the frequency range of 100 2100Hz, in 400Hz bands.
Figure 3: Irregular cavity with added seats (photograph)
Figure 2: Diagram of the octagonal cavity
The second stage of the experiment was to find the spatial distributions of acoustic pressure in the modes to compare with the analytical results. A plane across Y = 0.18m was used for measurements as it represented the head position. The speaker was excited at the chosen resonant frequencies of the modes, according to the measurements of the initial experiments. The
2/8
microphone was positioned on the chosen plane, and the Sound Pressure Level (SPL) was measured for every point on the grid (every 30mm2). To give a better representation of a car interior, extra sides made of 12mm wood were added to the corners of the model, giving an octagonal shaped cavity (see Figure 2). The final quarter scale model represented the above-mentioned octagonal cavity with added seats made out of 50mm wooden blocks. One of the sides making the octagonal cavity was taken out to give extra room in the model (see Figure 3). 3
EXPERIMENTAL RESULTS 3.1
Rectangular Cavity
The measured resonance frequencies of the rectangular cavity before alterations are reproduced in Figure 4. The comparison of the experimental results with the analytical ones, calculated according to the well known formula, shows that the resonant frequencies found in the experiment agree well with the analytical solutions for lower order modes, with an error of less than 3% for the first 8 modes. The modal shapes need to be measured to confirm which particular modes are excited at measured frequencies for higher frequencies. The sound pressure distribution was measured for 3 modes: (1,0,0), (0,1,0) and (3,1,0), 306Hz, 579Hz and 1093Hz respectively, to compare it with the well-known analytical solutions and to confirm their association with the measured resonant frequencies. Figure 5 shows the measured shape of the mode (1,0,0) compared with the analytical form.
Figure 4: The measured frequency response of the rectangular cavity - vertical lines show theoretical resonant frequencies.
The errors are within usual limits known from earlier papers on similar topics [2,8]. The errors are due to a number of factors, e.g. frequency-dependant absorption of the cavity walls, added reflections from the speaker and the microphone, temperature variations in the room, etc.
3/8
a
b
Figure 5: Sound pressure distribution in the rectangular cavity for the mode (1,0,0) at Z = 0.18m, and f = 306Hz; a – calculation according to analytical equations , b – experimental
3.2
Octagonal Cavity
The frequency response of the octagonal cavity was measured using the same techniques as in the previous section. The sound pressure distribution was measured for the first 9 peaks of the frequency response and also for 2 frequencies, 702Hz and 967Hz, which were significant troughs on the graphs of the single speaker position. Thus, the frequencies of the chosen 11 modes were 360Hz, 578Hz, 685Hz, 702Hz, 729Hz, 881Hz, 967Hz, 1056Hz, 1128Hz, 1221Hz and 1280Hz. The results for the frequency response are shown on Figure 6.
Figure 6: Comparison the frequency responses of the rectangular and octagonal cavities, dashed and solid curves respectively
As one can see from Figure 6, the modes of the octagonal cavity are less frequent, but have a similar average SPL to the original cavity. Because the box is no longer rectangular, the standard analytical equations are no longer applied, although they can still give some idea of the resonant frequencies and the shapes of the modes.
4/8
3.3
Irregular Cavity with Added Seats
The third cavity measured had added blocks of wood representing seats in the cavity, (see Figure 3) to make it more realistic to a vehicle interior. The frequency response was measured again and compared to the previous two experiments The results are shown on Figure 7. It can be seen that the peaks are similar in SPL at lower frequencies to the rectangular cavity, but are less frequent. At higher frequencies the peaks have reduced amplitudes and increased bandwidths, and again they are less frequent. Unfortunately for the irregular cavity it is impossible to obtain any simple classification of the modes corresponding to the measured resonant frequencies: 267Hz, 576Hz, 642Hz, 700Hz, 770Hz 870Hz, 932Hz, 942Hz, 1042Hz and 1115Hz (first ten modes have been investigated). It can be seen from Figure 7 that the sound pressure has been reduced significantly, with results up to approximately 25dB lower than for the rectangular cavity. This is in agreement with Reference 9. Authors of Reference 10 concluded that the seats in a vehicle account for nearly half of its absorption. It can also be seen that the resonant frequencies have generally been shifted lower than the results measured for the empty cavity. The results presented here are again in close agreement with previous works [9,10]. As was suggested in Reference 11, this phenomenon might be due to an increase in the effective length of the cavity due to the presence of seats.
Figure 7: Comparison of the frequency response of the rectangular cavity (dashed curve), the octagonal cavity (solid curve) and the irregular cavity with added seats (dotted curve)
4
ADDING ABSORPTION MATERIAL
Felt material was added to all three cavities under investigation to study the absorption effect of trim in a real vehicle interior. The felt was attached to the wooden interior walls of the cavities, leaving the Perspex top uncovered to give the effects of windows. The frequency response of the cavities with the added felt was measured in the same way as before, taking an average of the three speaker positions. Figures 8 and 9 show the comparisons of the final two cavities with added felt, the octagonal and irregular cavities respectively. For the rectangular cavity (not shown here), the felt has reduced the overall SPL. The higher frequencies are affected the most with a drop in SPL of 36dB toward the 2kHz range, and only 6dB difference in the 300Hz range. As with the added chairs, the frequency responses have tended to lower and the peaks less frequent, with a flatter response towards the high frequency end.
5/8
For the octagonal cavity, the SPL had reduced considerably overall, to about 35dB. The peaks have a flatter response, especially at higher frequencies. For the irregular cavity the SPL is only slightly reduced in comparison to the un-felted cavity, up to 19dB drop. There are fewer peaks, which have a very flat response in the high frequency region. For both the octagonal and irregular cavities the resonant frequencies are once again shifted to the left of the spectrum. The best absorption for all is in the high frequency range. This is due to the fabric used having a higher absorption coefficient at the high frequency end. The thickness of the material would have to be large to reduce the SPL at lower frequencies, as investigated in Reference 10. It can be seen that there is relatively little difference to the SPL for the irregular cavity. As was suggested in Reference 10, the seats account for about a half of the absorption in the cavity already, so the felt probably has little effect when added to this.
Figure 9: Frequency Response of the irregular cavity with and without felt, solid and curves respectively
Figure 8: Frequency Response of the octagonal cavity with and without felt, solid and curves respectively
5
FINITE ELEMENT ANALYSIS
In the present paper hexahedral and tetrahedral elements were used to analyse the three above mentioned quarter scale models of the vehicle interior. The ideal size of elements used for meshing is about six per wavelength of the highest frequency of interest, therefore the maximum element size is approximately 27mm. The trial analysis of the rectangular cavity was very successful when compared to the analytical solutions, with only a 2% error for the first 25 resonant frequencies. For the octagonal cavity, the FEA results for the first six resonant frequencies are very accurate compared to the experimental data, within 1% error and the same mode shapes The next five modes though have large errors up to approximately 16%, with no similar mode shapes.
Figure 10: FEA picture of Mode (1,0,0) of the Irregular Cavity
6/8
Mode shapes for the irregular cavity are difficult to determine experimentally, so they cannot be compared with the FEA results. The resonant frequencies for the FEA are in good agreement for the first six modes, with an error of up to 4%. The next four modes are less accurate, with an error of up to 10% (see Figure 10 for the first mode). 6
REAL VEHICLE INTERIOR
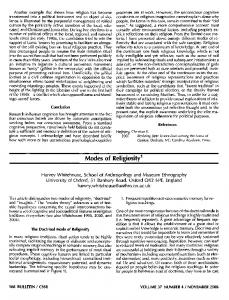
Measurements of sound pressure level and mode shapes were taken in an interior of a Ford Fiesta. A speaker was set up in the foot well of the front passenger and a microphone was placed in four locations in the vehicle interior. Each position was measured as before, but with the frequency range quartered, therefore 25Hz-525Hz in 100Hz bands. Mode shapes were plotted of the first four peaks from the frequency response, across the horizontal plane of the car in head position.
Figure 11: Frequency response of the Ford Fiesta compared with the response of the irregular cavity with added felt, solid and dashed curves respectively
There are only a few peaks in the sound pressure level in the vehicle interior. This is due to high frequency sound being absorbed by the trim, including the seats and fabric in the vehicle. When compared with the irregular quarter scale model (with quartered resonant frequencies), it can be seen that the SPL in the Ford Fiesta is considerably lower (see Figure 11). Also the peaks are shifted in comparison and also have a flatter response. This is mainly due to the larger volume of the real vehicle compartment (by 43 = 64 times, which corresponds to 36 dB). Since the volume of the enclosure is present in the denominator of the acoustic Green’s function, the average theoretical SPL of a real vehicle should be by around 36 dB lower. Also, the trim may cause additional correction to SPL. There are also more irregular surfaces in the real vehicle interior, allowing for more reflections and dissipation of sound energy.
7/8
7
CONCLUSIONS
From the investigations of the rectangular cavity it was concluded that the experimental results agree well with the analytical calculations. The octagonal cavity has a frequency response which is similar to that of the rectangular cavity. The modes are less frequent and are also shifted to higher frequencies. The irregular cavity has a frequency response of up to approximately 25dB lower than in the case of the rectangular cavity, and the modes are shifted to lower frequencies. The spatial distributions of the modes vary, and are difficult to classify. The addition of felt gave a reduction in SPL for all three cavities, although not greatly reduced for the irregular cavity. This is probably due to the added seats giving the largest contribution (see Reference 10), therefore the felt having little effect. The modes also seem to have shifted toward the left of the spectrum, in agreement with the results of Reference 12. Finite Element Analysis (FEA) of all three cavities was carried out. It was found that FEA agrees well with the experiments for cavities with irregular shapes, but only at low frequencies. The results for the real car (Ford Fiesta) demonstrate that the frequency response of the cavity has few peaks, with a very smooth behaviour in the higher regions. When compared with the model of irregular cavity with added felt, it shows a great reduction in amplitudes and fewer peaks across the spectrum. Investigation into reduced scale models of more realistic shapes and materials should be carried out to add further knowledge of the acoustics properties of vehicle interiors. REFERENCES [1]
S.K. Jha “Characteristics and Sources of Noise and Vibration and their Control in Motor Cars” Journal of Sound and Vibration; 47(4) pp 543-558, (1976). [2] E.Y. Nakansihi, SNY. Gerges “Acoustic Modal Analysis for Vehicle Cabin” Society of Automotive Engineers; ref. 952246, (1995). [3] V.V. Krylov, S.J. Walsh , R.E.T.B. Winward, “Modelling of Vehicle Interior Noise at Reduced Scale”, Proceedings of ‘Euronoise 2004’, Naples, Italy, May 2003 (on CD). [4] S.K. Jha, N. Cheilas “Acoustic Characteristics of a Car Cavity and Estimation of Interior Sound Field Produced by Vibrating Panel” The American Society of Mechanical Engineers; n 76-WA/DE-1, (1976). [5] M. Petyt, J. Lea, H. Koopman “A Finite Element Method for Determining the Acoustic Modes or Irregular Shaped Cavities” Journal of Sound and Vibration; 45 (4), pp 495-502, (1976). [6] H. Yashiro, K. Suzuki, I. Hagiwara, A. Arai “An Application of Structural-Acoustic Analysis to Car Body Structure” Society of Automotive Engineers; ref. 850961, (1985). [7] D.L. Smith, “Experimental Techniques for Acoustic Modal Analysis of Cavities” Proceedings of Internoise 1976 Conference, pp 129-132, (1976). [8] A. Craggs, C.J. Buma “The Effect of an Absorbent Lining on the Natural Frequencies and Modal Damping Factors of a Small Room” Applied Acoustics ; 28, pp 229-239, (1989). [9] J.G. Cherng, G. Yin, R.B. Bonhard, M. French. “Characterisation and Validation of Acoustic Cavities of Automotive Vehicles” Society of Photo-optical Instrumentation Engineers, vol. 1, pp 290-294, (2002). [10] P. Chen, G. Ebbitt, “Noise Absorption of Automotive Seats” Society of Automotive Engineers, ref: 980659, (1998). [11] D.J. Nefske, Jr, J.A. Wolf Jr, L.J. Howell “Structural-Acoustic Finite Element Analysis of the Automobile Passenger Compartment: A Review of Current Practice”, Journal of Sound and Vibration; 80 (2), pp 247-266, (1982). [12] D.J. Nefske, L.J. Howell, “Automobile Interior Noise Reduction Using Finite Element Methods” Society of Automotive Engineers, ref. 780365, (1978).
8/8