4Hirox-USA Inc., 1060 Main St., River Edge, New Jersey 07661, USA. 5Lawrence Livermore National Laboratory, 7000 East Ave., Livermore, California 94550, ...
JOURNAL OF APPLIED PHYSICS 108, 033502 共2010兲
Thermal stability of SrTiO3 / SiO2 / Si Interfaces at Intermediate Oxygen Pressures G. J. Yong,1 Rajeswari M. Kolagani,1 S. Adhikari,1 W. Vanderlinde,2 Y. Liang,3 K. Muramatsu,4 and S. Friedrich5 1
Department of Physics, Astronomy and Geosciences, Towson University, Towson, Maryland 21252, USA Laboratory for Physical Sciences, 8050 Greenmead Dr., College Park, Maryland 20740, USA 3 Motorola LabS, 2900 S. Diablo Way, Tempe, Arizona 85284, USA 4 Hirox-USA Inc., 1060 Main St., River Edge, New Jersey 07661, USA 5 Lawrence Livermore National Laboratory, 7000 East Ave., Livermore, California 94550, USA 2
共Received 16 February 2010; accepted 5 June 2010; published online 3 August 2010兲 The thermal stability of epitaxial SrTiO3 thin films grown by molecular-beam epitaxy on Si 共001兲 has been studied using x-ray diffraction 共XRD兲, optical microscopy 共OM兲, scanning electron microscopy 共SEM兲, and thermodynamic calculations. Our studies focus on the stability of the SrTiO3 / Si structures under the conditions typically employed in the pulse laser deposition 共PLD兲 growth of complex metal oxide heteroepitaxy on Si. We observe additional Bragg peaks in thermally treated SrTiO3 buffered Si structures, corresponding to possibly TiSi2 and/or SrSiO3, reaction products which are consistent with the reaction schemes we propose. In addition, OM and SEM reveal microstructures that are not readily accounted for solely by the solid state reactions as put forth by previous workers but can be reasonably explained by our proposed reaction schemes. Using our observations and thermodynamic analysis, we argue that reactions involving the gaseous species SiO共g兲, the reactivity of which has not been previously considered in this system, are important. We attribute the onset of degradation of the SrTiO3 film at high temperatures, to the circular void forming reaction Si共s兲 + SiO2共s兲 → 2SiO共g兲 at the interface and suggest that the reactions considered by previous workers involving all solid state reactants occurs only at the conclusion of degradation. Our results points to the need for keeping the PLD temperature as low as possible to minimize the production of reactive SiO共g兲 in avoiding the deleterious reactions. © 2010 American Institute of Physics. 关doi:10.1063/1.3460098兴 I. INTRODUCTION
The primary driving interest in development of molecular-beam epitaxy 共MBE兲 epitaxial SrTiO3 thin films on Si共001兲 has been the potential of the high dielectric SrTiO3 to possibly replace SiO2, thus enabling further miniaturization of Si based electronics. It has also been recognized that such MBE epitaxial SrTiO3 thin films on Si共001兲 could be used as substrates for the subsequent growth of other perovskite oxide thin films,1 thus offering a convenient pathway for integration of perovskite oxide functionality with Si. In either case, the thermal stability of the interface structure in epitaxial SrTiO3 thin films grown by MBE on Si共001兲 is a matter of interest. We have carried out thermal treatments of the SrTiO3 / Si structures to investigate the stability of the SrTiO3 layer. The motivation for this study emerged from our earlier work2 on the heteroepitaxy of rare earth manganite thin films on SrTiO3 buffered Si by pulse laser deposition 共PLD兲 where we observed circular defects on the film surface under certain conditions. We have since then been able to account for these circular defects as possibly arising from reactions involving gaseous species at the Si/ SrTiO3 interface. In order to better understand these interfacial reaction processes, we have carried out thermal treatments of the MBE SrTiO3 / Si structures 共without any other layers on top兲. The conditions of our thermal treatments are selected to be similar to the 0021-8979/2010/108共3兲/033502/8/$30.00
typical thermal cycles employed in the PLD heteroepitaxy of complex oxides on Si. Although there have been several experimental studies on the thermal stability of SrTiO3 on Si in the past, these studies have been mostly limited to very low O2 partial pressures 共high vacuum and ultrahigh vacuum conditions兲3–5 or very high O2 partial pressures 共a study in air兲6 and thus did not include the effect of oxygen ambients 共approximately few 100 mtorr兲 typically employed in PLD complex oxide heteroepitaxy. II. BACKGROUND
Before discussing the details of our work, some discussion of previous studies is in order. Growth of an amorphous interface layer 共AIL兲 upon heating the SrTiO3 / Si structure has been observed by numerous workers. The AIL is understood to be a mixture of Sr silicates and SiOx species.7,8 共Sr silicate is a general term including compounds such as SrSiO3, Sr2SiO4, and Sr3SiO5兲. Oxygen can diffuse through the top layers and react with the Si at the interface, forming SiO2 via the reaction: Si共s兲 + O2共g兲 → SiO2共s兲.
共1兲
Thermodynamically, reaction 共1兲 is favored at lower temperatures and higher O2 partial pressures; however, diffusion of O2 through the top layers is assisted by heating. Reaction 共1兲 causes a thickening of the AIL with the epitaxy
108, 033502-1
© 2010 American Institute of Physics
033502-2
J. Appl. Phys. 108, 033502 共2010兲
Yong et al.
leads to the exposure of clean Si substrate. The formation of circular voids in this case has been attributed to the interfacial reaction: Si共s兲 + SiO2共s兲 → 2SiO共g兲↑.
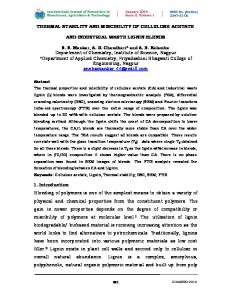
FIG. 1. Transmission electron microscopy of as grown MBE epitaxial SrTiO3 on Si共001兲.
of the SrTiO3 film remaining intact.4,5 At very low O2 partial pressures however, it is thought that growth of the AIL occurs at the expense of O loss from the SrTiO3 film.4,5 Growth of the AIL was observed upon annealing to 762 ° C in ⬃4 ⫻ 10−6 and ⬃1 ⫻ 10−8 torr,5 upon annealing to 777 ° C in ⬍10−9 torr,4 and upon annealing to 1000 ° C in air.6 共AIL growth is observed even during the MBE growth process itself, that is at lower temperatures ⬃550 ° C in partial pressure O2 ⬃ 2 ⫻ 10−7 torr; see Fig. 1兲.8 X-ray photoelectron spectroscopy 共XPS兲 showed a significant amount of Ti3+ states formed after the ⬃1 ⫻ 10−8 torr annealing.5 共Ti3+ states could arise from formation of SrTiO3−x or TiO2兲. At 877 ° C in ⬍10−9 torr, XPS indicated that the titanate 共Ti4+兲 completely reduces to metallic titanium 共Ti0+兲, likely in the form of titanium silicide.4 共Titanium silicide is a general term including compounds such as TiSi, TiSi2, Ti5Si3, and Ti5Si4兲. In addition, virtually all the SiO2 disappeared on Si.4 In a medium energy ion scattering 共MEIS兲 study,3 it was found that SrTiO3 films on Si are stable toward annealing in ⬍2.3⫻ 10−10 torr up to ⬃550 ° C, where SrO共g兲 desorption begins and the initially flat film starts to roughen. There are no significant changes at higher temperatures until partial film disintegration starts at 850 ° C, and is accompanied by additional SrO共g兲 along with SiO共g兲 and O2共g兲 desorption, pinhole formation, and finally Ti diffusion into the Si bulk. It was observed that heating to temperatures above 900 ° C inevitably lead to degradation and eventually to full decomposition. Atomic force microscopy imaging of a SrTiO3 / Si structure heated 950 ° C, showed a large fraction of the surface covered with 50–100 Å tall somewhat circular in shape islands 共which were identified to be TiSix by MEIS兲. They summarized their observations, with the reaction:
SrTiO3共s兲 + 3Si共s兲 → SiO共g兲↑+ SrO共g兲↑+ 21 O2共g兲↑ + TiSi2共s兲.
共2兲
Note that this reaction does not involve any gaseous species as reactants. Gaseous species were implicitly assumed to act only as nonreactive products in this reaction between two solids. Our results presented here suggest significantly different reaction paths. Also relevant to this work is the study of SiO2 / Si interfaces where it is observed that when a SiO2 film on Si is heated above 727 ° C in ultrahigh vacuum, it decomposes inhomogenously with the formation of circular voids,9 which
共3兲
The SiO2 decomposition is thought to be initiated in regions where a less stable sub-oxide 共SiO2−x兲 is present, followed by the formation and lateral growth of circular voids in the oxide.10 The initialization of the reaction is hindered in the presence of O2共g兲 which tends to convert the suboxide SiOx into the more stable SiO2. These circular voids which expose the clean Si substrate grow laterally as the reaction proceeds without a thinning of the remaining SiO2 film. The circular voids grow larger and overlap, eventually leaving the Si surface free of SiO2 共and pitted兲. Reaction 共3兲 can explain the observation that at 850 ° C in ⬍2.3⫻ 10−10 there was pinhole formation3 and is consistent with the XPS observation that at 877 ° C in ⬍10−9 torr, virtually all the SiO2 disappeared on Si.4 Circular defect mechanisms instigated by the high temperature, low O2共g兲 partial pressure reaction 共3兲 have been previously presented in the thermal decomposition of ZrO2 / SiO2 / Si and HfO2 / SiO2 / Si thin film systems.11–15 Based on our present results, we propose that the thermal decomposition in the SrTiO3 / SiO2 / Si system is also instigated by reaction 共3兲. In addition, we propose that some of the SiO共g兲 thus formed go on to further react and we present experimental evidence and thermodynamic calculations for candidate reactions.
III. EXPERIMENTAL DETAILS
The epitaxial SrTiO3 thin films on Si 共001兲 used in this study were grown by a Motorola MBE method 共Refs. 16 and 17兲 with the temperature ranging from ⬃400 ° C at the early stage to 550 ° C at the later stage of growth. First the original amorphous native SiO2 layer on the Si wafer is removed/ converted to a crystalline, silicate-like, pseudomorphic 共and possibly two-dimensional兲 Sr2SiO4 template layer by a flux of Sr共g兲.7 Then, the SrTiO3 film is grown when O2共g兲 is added and Sr共g兲 and Ti共g兲 fluxes are co-deposited. At a higher partial pressure of O2共g兲, the AIL forms and thickens during the growth of the epitaxial SrTiO3 film 共see Fig. 1兲. As mentioned before, the AIL is understood to be a mixture of Sr-silicates 共SrSiO3, Sr2SiO4, Sr3SiO5兲 and SiOx species 共including SiO, Si2O3 and SiO2兲.8 Growth of the AIL occurred via O2 diffusion through to the Si– SiO2 interface. Any subsequent heating can cause further thickening of the interface. We have performed thermal treatments on several such MBE grown pieces of 100 Å SrTiO3 buffered Si to study their thermal stability 共see Table I兲. These samples were analyzed by x-ray diffraction 共XRD兲 in parallel beam geometry with a Göbel mirror and Soller slit 共Bruker AXS model Discover D8兲, optical microscopy 共OM兲 共Nikon Optiphot2 microscope with JenOptik JENA ProgRes™ C12plus camera, OM in shadow mode 共Hirox Digital Optical Microscope KH7700兲, and scanning electron microscopy 共SEM兲 共LEO model 1550 FE兲.
033502-3
J. Appl. Phys. 108, 033502 共2010兲
Yong et al.
TABLE I. Summary of samples heat treatments. For all samples with heat treatment, at the end of the heating plateaus, the chamber was filled with ⬃400 torr of O2 and the samples were cooled down to room temperature while temperature was ramped down @ 1 ° C / min. Sample A No heat treatment. As received from Motorola Sample B Heated to 750 ° C @ 10 ° C / min in 400 mtorr O2 and held at 750 ° C for 5 min Sample C Heated to 820 ° C @ 10 ° C / min in 400 mtorr O2 and held at 820 ° C for 30 min
Sample D Heated up to 820 ° C @ 10 ° C / min in ⬃1 ⫻ 10−5 torr O2 held at 820 ° C for 30 min
Sample E Heated to 820 ° C @ 10 ° C / min in 400 mtorr O2 and held at 820 ° C for 1 h
Sample F Heated up to 820 ° C @ 10 ° C / min in ⬃1 ⫻ 10−5 torr O2 held at 820 ° C for 1 h
IV. RESULTS A. X-ray Diffraction „XRD…
forbidden Si
SrSiO3 (228) & (600) TiSi2(044) SrTiO3(004)
Si(004)
SrTiO3(002)
(a)
SrTiO3(001) SrTiO3(110) forbidden Si
Log Intensity(a.u.)
(b)
TiSi2(311) SrSiO3 (114) & (300) TiSi2(022)
We obtained x-ray 2- scans of samples A, B, C, D, E, and F for 2 between 10° and 158°. In the as-grown sample A scan shown in Fig. 2共a兲, we only observe SrTiO3共00ᐉ兲 and Si共00ᐉ兲 peaks 关with a hint of the SrTiO3共110兲 peak兴. The scans of the five thermally treated samples were essentially identical to one another and only one of these 2- scans 共sample F兲 is shown in Fig. 2共b兲. Along with the SrTiO3共00ᐉ兲, Si共00ᐉ兲, and SrTiO3共110兲 peaks there are two additional peaks at 44.24° and 97.84° 共which are absent in the unheated sample兲. We can index these additional peak as the 共022兲 and 共044兲 of TiSi2 and/or as the degenerate 共114兲共300兲 and 共228兲共600兲 peaks of SrSiO3.18 Our present data do not allow us to distinguish between these two products. It may be mentioned here that we have observed significant increase in the two-probe conductivity of all the heated samples from open circuit values in the untreated sample to hundreds of kilo ohm in the heated ones. This is
10 20 30 40 50 60 70 80 90 100 110 120 130 140 150 160
2(degrees)
FIG. 2. 共Color online兲 X-ray 2- scans shows development of peaks upon heating that can be indexed as TiSi2 and SrSiO3. 共a兲 Sample A shows only SrTiO3 and Si peaks. The lattice constant of silicon is such that SrTiO3 共with a lattice constant of 3.905 Å兲 is under compressive strain 共see inset兲. 共b兲 Sample F shows additional peaks that can be indexed as TiSi2 and SrSiO3 peaks.
consistent with the presence of significant amounts of TiS2 which is known to have high conductivity; it does not however rule out the presence of SrSiO3. It must be admitted that reduced SrTiO3−x 共and perhaps even SrSiO3−x兲 has significant conductivity although it can be argued that samples B, C, and E in which the heating were carried out in 400 mtorr O2 were not subjected to reducing conditions. It also must be mentioned that the peak indexed as TiSi2共311兲 was only observed weakly in one sample; sample F 关shown in Figs. 2共b兲 and 3共b兲兴. A Finer scans showing the SrTiO3共002兲 finite thickness fringes before and after heating are shown in Figs. 3共a兲 and 3共b兲. The heated sample 共F兲 shows additional peaks that can be indexed as TiSi2 and SrSiO3 peaks. Also, although there was a decrease in the intensity of the SrTiO3共002兲 peak in Fig. 3共b兲 compared to Fig. 3共a兲, the thickness of the SrTiO3 layer was essentially unchanged. The finite thickness fringes fits appear to be just as good before and after heating with essentially the same number 共20 or 21兲 unit cells of SrTiO3 in concordance with the idea that although small areas of the interface have inhomogenously developed into TiSi2 and/or SrSiO3, large areas of the SrTiO3 film remain essentially unchanged. This is consistent with the degradation of the SrTiO3共s兲 occurring non-uniformly instigated by the SiO2共s兲 + Si共s兲 → 2SiO共g兲 circular void forming reaction that occurs in the underlying interface. Scans for 共for the 2 range 42°–50°兲 of all samples are shown in Fig. 4. We discuss possible interface reactions leading to the formation of TiSi2共s兲 and SrSiO3共s兲 in Sec. V of this paper. Our XRD data also shows relaxation of the SrTiO3 film upon heating at intermediate values of O2 partial pressures. Figures 3 and 4 shows that the thermal treatments cause the SrTiO3共002兲 peak to shift to higher values of 2 corresponding to a decrease in the out of plane lattice constant. The out-of-plane SrTiO3 lattice parameter relaxed after completion of the heating cycle from an initial value of 3.93 to ⬃3.90 Å. This decrease is consistent with thermally induced stress relaxation of the SrTiO3 layer. SrTiO3 which has a cubic structure with bulk lattice constant 3.905 Å is under compressive strain on Si 关with a lattice constant 5.43088 Å; see Fig. 2共a兲 inset兴. SrTiO3 aligns with a 45° rotated cube-edge on cube-diagonal with respect to the Si
J. Appl. Phys. 108, 033502 共2010兲
Yong et al.
(a) Intensity(a.u.)
E C B A 42
38 39 40 41 42 43 44 45 46 47 48 49 50 51 52 53 54
43
44
45
38 39 40 41 42 43 44 45 46 47 48 49 50 51 52 53 54
2 (degrees)
FIG. 3. 共Color online兲 Finer x-ray 2- scans around the SrTiO3共002兲 peak before and after heat treatment showing the finite thickness fringes 共a兲 Sample without heat treatment shows only the SrTiO3共002兲 peak. The finite thickness fringes fit shown is calculated with 21 unit cells of SrTiO3 with a lattice constant of 3.9367 Å. 共b兲 The same sample after heat treatment 共sample F兲 shows additional peaks that can be indexed as TiSi2 and SrSiO3 peaks. Peak at 38.17° can be indexed as TiSi2共311兲 and peak at 44.41° can be indexed as TiSi2共022兲 and/or SrSiO3共114兲 and 共300兲. The finite thickness fringes fit shown is calculated with 20 unit cells of SrTiO3 with a lattice constant of 3.905 Å.
substrate. The tensile strain causes a tetragonal distortion of the SrTiO3 layer, with an out of plane lattice constant larger than the bulk value in the as-grown layer. Heating is expected to relax the strain thus decreasing the out of plane lattice constant, consistent with our results. Heating also causes disordering of the SrTiO3 film as can be seen from the increase in the FWHMrock 共rocking curve at full width half maximum兲 from 0.15° for the as made structure 共sample A兲 to higher values after heating 共see Fig. 4兲. Comparison of our results to previous work follows. McCready et al.6 did not report any extra peaks in their x-ray work upon heating. This may be related to the difference in the oxygen partial pressures in thermal treatment ambient 共since their annealing was done in air兲 or it could have been simply because they were primarily focused on following the temperature dependence of the SrTiO3 Bragg 共002兲 peak; i.e., they may have missed the extra peaks because their x-ray scan range was too narrow. MEIS measurements in ⬍2.3⫻ 10−10 torr upon annealing to 780 ° C were consistent with an increase in SrSixOy at the interface.3 XPS spectra upon annealing to 877 ° C, shows complete conversion of Ti4+ to Ti0 共consistent with titanium silicide; which is a general term including compounds TiSi, TiSi2, Ti5Si3, and Ti5Si4兲 共Ref. 4兲 while our data supports the production of TiSi2 in particular. Our XRD results are similar to McCready et al. XRD observations up to 1000 ° C at higher O2 partial
46
47
48
49
50
2
(a)
(b) Intensity(a.u.)
SrTiO3(002)
2.6 2.4 2.2 2.0 1.8 1.6 1.4 1.2 1.0 0.8 0.6 0.4 0.2 0.0
(b)
TiSi2(022) SrSiO3(311)&(300)
2.6 2.4 2.2 2.0 1.8 1.6 1.4 1.2 1.0 0.8 0.6 0.4 0.2 0.0
TiSi2(311)
Log Intensity(a.u.)
033502-4
F D A 42
43
44
45
46
47
48
49
50
2 FIG. 4. X-ray 2- scans of all the samples shows development of a peak upon heating that can be indexed as TiSi2共022兲 and SrSiO3共114兲 and 共300兲. Scans have been normalized to the SrTiO3共002兲 peak intensity and offset for clarity. 共a兲 Heated in 400 mtorr O2 共samples B, C, E兲 共b兲 Heated in ⬃1 ⫻ 10−5 torr O2 共samples D, F兲. Sample A: SrTiO3共002兲 c = 3.93 Å; FWHMrock = 0.15°. Sample B: SrTiO3共002兲 c = 3.90 Å; FWHMrock = 0.34°. 44.47° TiSi2共022兲 and/or SrSiO3共114兲 and 共300兲; FWHMrock = 0.204°. Sample C: SrTiO3共002兲 c = 3.91 Å; FWHMrock = 0.31°. 44.24° TiSi2共022兲 and/or SrSiO3共114兲 and 共300兲; FWHMrock = 0.23°. Sample D: SrTiO3共002兲 c = 3.89 Å; FWHMrock = 0.43°. 44.38° TiSi2共022兲 and/or SrSiO3共114兲 and 共300兲; FWHMrock = 0.21°. Sample E: SrTiO3共002兲 c = 3.91 Å; FWHMrock = 0.41°. 44.24° TiSi2共022兲 and/or SrSiO3共114兲 and 共300兲; FWHMrock. Sample F: SrTiO3共002兲 c = 3.90 Å; FWHMrock = 0.38°. 44.30° TiSi2共022兲 and/or SrSiO3共114兲 and 共300兲; FWHMrock = 0.30°.
pressures 共in air兲 in which they also observed that the SrTiO3 film relaxed after heating. Their out-of-plane SrTiO3 lattice parameter relaxed with a slight decrease in lattice parameter after completion of the first heating cycle with no additional relaxation during the second heating cycle.6 B. Optical Microscopy „OM…
Evidence of interface reactions induced by thermal treatments is also seen in our OM studies. Optical micrographs were taken with a Nikon Optiphot2 microscope with a JenOptik JENA ProgRes™ C12plus camera. After the annealing processes mentioned above, we observe distinct appearance of circular defect features 关Figs. 5共c兲–5共f兲兴 which are absent in as-grown sample 关Fig. 5共a兲兴 and the sample heated under milder condition 关Fig. 5共b兲兴. Note that the samples in which circular defects are absent关Figs. 5共a兲 and 5共b兲兴 also do not have the extra peaks in the x-ray data 共Fig. 4兲. Note also that the numerous smaller “bubble” defects are observed in all the heated samples 关Figs. 5共b兲–5共f兲兴. The circular defects are spaced nonuniformly throughout the substrate; and are in fact absent from most of the substrate area 共but the smaller “bubble” defects are present throughout兲. There tends to be a
033502-5
J. Appl. Phys. 108, 033502 共2010兲
Yong et al.
(a)
(b)
(c)
(d)
(a)
(b)
(c)
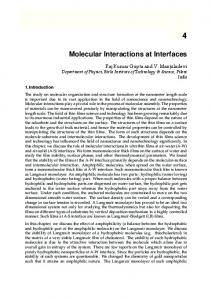
FIG. 7. SEM of sample C. 共a兲 Circular defect cluster, Mag= 25 000X. 共b兲 Isolated cone-shaped defect, Mag= 250 000X. 共c兲 Globular defect on top of flat square defect, Mag= 500 000X.
C. Scanning Electron Microscopy „SEM… (e)
(f)
FIG. 5. 共Color online兲 Optical micrographs at Mag= 1000X. 共a兲 Sample A, 共b兲 sample B, 共c兲 sample C, 共d兲 sample D, 共e兲 sample E, and 共f兲 sample F.
great deal more circular defects clustered near the edges of the heated substrates indicating that there is a greater tendency for circular defect formation at sites with greater residual stresses. 共Stresses arising from cleaving of the substrates before mounting on the heater block would primarily be located at the cleaved edges of the substrates. Residual stresses mean more broken bonds that; i.e., conversion of SiO2 into SiOx兲. We have also studied these samples using a specialized optical microscope 共Hirox Digital Optical Microscope KH-7700 in Shadow Mode兲 which is capable of displaying topological details, allowing us to determine whether defects are protruding or recessed. The images obtained with this microscope show that the “bubbles” seen in Figs. 5共b兲–5共f兲 were actually protrusions in and around the circular defects 关see Figs. 6共a兲 and 6共b兲兴. After heat treatment, the initially smooth SrTiO3 / SiO2 / Si substrates develop circular features with many protrusions on top of the surface. The distinct circular pattern of the larger circular defects can be partially explained by the circular voids formation decomposition mechanism of SiO2 on Si. The many protrusions 共on top of the SrTiO3 film兲 are suggestive of reactions involving one or more gas phases; they are difficult to explain via a reaction that has only solid state reactants 关such as such as reaction 共2兲兴 which would be constrained to mostly occur at the interface 共beneath the SrTiO3 film兲. It is noteworthy that the evolution of the circular defects as the heating treatments becomes more extreme; in Fig. 5共c兲; the circular defect is very faint while in Figs. 5共d兲–5共f兲, the circular defects have become larger and developed colorful interiors. (a)
(b)
FIG. 6. 共Color online兲 Optical microscope in shadow mode. 共a兲 Sample C, Mag= 4200X and 共b兲 sample D, Mag= 7000X.
SEM’s of sample C are shown in Fig. 7. All three images were acquired at 10 kV beam voltage and 5 mm working distance using an in-lens detector. Figure 7共a兲 shows a cluster of defects 共on top of the smooth SrTiO3 film兲 arranged in a distinct circular pattern. Figure 7共b兲 shows an isolated cone-shaped defect and Fig. 7共c兲 shows a globular defect on top of flat square defect 共on top of smooth SrTiO3 film兲. SEM’s of sample D are shown in Fig. 8. Figure 8共a兲 shows a cluster of defects 共on top of smooth SrTiO3 film兲 arranged in a somewhat circular pattern. Figure 8共b兲 shows another somewhat circular defect cluster 共on top of smooth SrTiO3 film兲. Figure 8共c兲 shows flat square defects 关compare to Fig. 7共c兲兴. Figure 8共a兲 was acquired at 3 kV beam voltage and 13 mm working distance using an in-lens detector. Figures 8共b兲 and 8共c兲 were acquired at 10 kV beam voltage and 6 mm working distance using an in-lens detector. The fact that these features are above the smooth SrTiO3 is difficult to explain in terms of reactions involving only solid state reactants as put forth by previous workers 关reaction 共2兲 and reactions 共III兲 and 共V兲 in Sec. V兲 as in those cases, one would expect the precipitates to occur primarily at the interface below the SrTiO3 film. This could cause some rippling of the SrTiO3 film 共and perhaps even some cracking if gaseous products were produced兲 but would not result in the features observed in Figs. 7 and 8. The structures above the SrTiO3 film could instead be caused by reactions involving one or more gaseous reactants 共as put forth below兲. Possible materials for the cone-shaped, globular, and flat square defects are TiSi2, SrSiO3, and SiO2 共as put forth below兲. V. THERMODYNAMIC CONSIDERATIONS
In this section, we examine some possible thermodynamic reactions involving gas phase reactants with TiSi2 and/or SrSiO3 as solid state products, consistent with our XRD observations above. In the discussion that follows, recall that the standard Gibbs free energy of formation ⌬Gⴰf of a compound is the change in Gibbs free energy that accompanies the formation of 1 mole of that substance from its component elements, at their standard states 共the most stable (a)
(b)
(c)
FIG. 8. SEM of sample D. 共a兲 Circular defect cluster, Mag= 10 000X. 共b兲 Circular defect cluster, Mag= 50 000X. 共c兲 Flat square defects, Mag = 300 000X
033502-6
J. Appl. Phys. 108, 033502 共2010兲
Yong et al.
form of the element at 25 ° C and 1 bar= 0.987 atm兲 共Table II兲. For each reaction below, ⌬Gⴰf,1000 K for the complete reaction was determined by subtracting the sum of the free energies of formation of the reactants from the sum of the free energies of formation of the products ⌬Gⴰf,1000
K
=
SiO2
SrTiO3
Si
(a)
(b)
vi⌬Gⴰf,1000 K − 兺 vi⌬Gⴰf,1000 K . 兺 Products Reactants
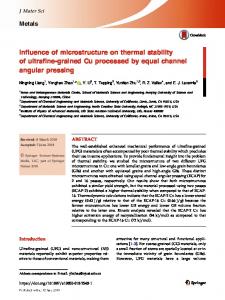
Earlier thermodynamic calculations show that SrTiO3共s兲, and all oxides of titanium such as TiO2共s兲 in contact with Si are intrinsically unstable at 1000 K in direct contact with each other, with reduction in the SrTiO3共s兲 and TiO2共s兲 and oxidation of the Si to be expected.19,20 关This is why the first input of MBE flux in the epitaxial growth of the SrTiO3 film on Si has to be Sr共g兲兴.7 The reactivity of SiO共g兲 has not been previously considered in those thermodynamic calculations for the Si/ SiO2 / SrTiO3 thin film system.19,20 关Although the reactivity SiO共g兲 has been considered in another similar, somewhat simpler system: ZrO2 on Si, for which thermodynamic calculations in thermal stability studies do include SiO共g兲兴.11,21 We first consider the possibility that the minute structures 共Figs. 7 and 8兲 that tend to aggregate in a circular pattern at the top of the heated samples 共Figs. 5 and 6兲 can be explained by the circular void forming reaction 关reaction 共3兲兴, together with reaction 共I兲 below:
(d)
(c)
FIG. 9. 共Color online兲 Schematic of possible reaction kinetics. 共a兲 A pinhole develops in the AIL region or is already present from the MBE process due to the reaction: Si共s兲 + SiO2共s兲 → 2SiO共g兲. 共b兲 Pinholes increase in size and become circular blisters 共cracks develop in the SrTiO3 film兲 due to the volume expansion caused by the production of SiO共g兲. 关Assuming that SiO共g兲 does not diffuse readily through SrTiO3共s兲 or SrTiO3−x共s兲.兴 Also, evolution of SrO共g兲 and some thinning of the SrTiO3共s兲 layer start occurring at ⬃550 ° C: SrTiO3共s兲 → SrO共g兲 + TiO2共s兲. 共c兲 The SiO共g兲 seep through the cracks and reacts directly with SrTiO3共s兲. 3SiO共g兲 + SrTiO3共s兲 → SrSiO3共s兲 3 + TiSi2共s兲 + 2 O2共g兲. Alternatively or concurrently, the SiO共g兲 and SrO共g兲 both seep through the cracks and react with each other forming two solids which nucleate and grow: 2SiO共g兲 + SrO共g兲 → SrSiO3共s兲 + Si共s兲. The Si共s兲 formed from the above reaction in direct contact with SrTiO3共s兲 and with TiO2共s兲 further reacts: 3Si共s兲 + SrTiO3共s兲 → SrSiO3 + TiSi2共s兲, 3Si共s兲 + 2SrTiO3共s兲 + 6SiO共g兲 → 2SrSiO3共s兲 + 2TiSi2共s兲 + 3SiO2共s兲, and 3Si共s兲 + TiO2共s兲 → SiO2共s兲 + TiSi2共s兲. 共d兲 When the voids become too large and the SrTiO3共s兲 film has too many cracks, the SrTiO3共s兲 film can collapse into the bare Si共s兲 substrate: 3Si共s兲 + SrTiO3共s兲 → SrSiO3共s兲 + TiSi2共s兲.
共3兲 Si共s兲 + SiO2共s兲 → 2SiO共g兲, 共I兲 3SiO共g兲 + SrTiO3共s兲 → SrSiO3共s兲 + TiSi2共s兲 + 23 O2共g兲 ⌬Gⴰf,1000
K
= + 63.093 kcal/mole.
Consider the possibility that as gaseous SiO共g兲 共from the SiO2 decomposition, circular void forming reaction兲 diffuses upwards through the SrTiO3共s兲 film, it reacts with the SrTiO3共s兲 forming solids SrSiO3 and TiSi2, first in crevices within the SrTiO3共s兲 and then as these precipitates grow, eventually extend above the SrTiO3 film in a roughly circular pattern. Although the ⌬Gⴰf,1000 K for reaction 共I兲 is positive 共meaning it should not be spontaneous兲, it must be recalled that thermodynamic calculations involving gaseous species may not be straightforward. The free energy of a gaseous species should correctly be determined as: ⌬Gⴰi = ⌬Gⴰf + RT ln ai, where ai, the activity, is set equal to the partial pressure of the gaseous component, Pi. Therefore, the free energy of the gaseous species could become much more negative 关thermodynamically favoring the forward direction of the reaction if a gaseous species is a product-such as O2 is in reaction 共I兲兴 as the temperature increases and/or the partial pressure of a gaseous product decreases. Moreover, the caveat regarding bulk versus thin film properties must be kept in mind. Standard thermodynamic data assume bulk materials are involved and it is well known that surface and interfacial reaction kinetics 共which are dominant in thin films兲 differ from those of the bulk. Furthermore, it is possible that the oxide共s兲 involved in reaction 共I兲 are oxygen deficient 共e.g., SrTiO3−x, SrSiO3−x兲. In summary, the positive free en-
ergy calculated for reaction 共I兲 calculated using tabulated values of standard state free energies does not preclude the occurrence of this reaction. Alternatively, one may also consider the circular void forming reaction 关reaction 共3兲兴 together with the reaction 共II兲 共below兲 between two gaseous species, and subsequent solid state reactions 共III兲, 共IV兲, and 共V兲 as responsible for the minute structures observed in Figs. 6–8. 共II兲 2SiO共g兲 + SrO共g兲 → SrSiO3共s兲 + Si共s兲 ⌬Gⴰf,1000
K
= − 113.431 kcal/mole.
Any Si formed in reaction 共II兲 can then further react:19,20 共III兲 3Si共s兲 + SrTiO3共s兲 → SrSiO3共s兲 + TiSi2共s兲 共⌬Gⴰf,1000K = − 19.133 kcal/mole兲, 共IV兲 3Si共s兲 + 2SrTiO3共s兲 + 6SiO共g兲 → 2SrSiO3共s兲 + 2TiSi2共s兲 + 3SiO2共s兲, ⌬Gⴰf,1000
K
= − 397.455 kcal/mole,
共V兲 3Si共s兲 + TiO2共s兲 → SiO2共s兲 + TiSi2共s兲 ⴰ 共⌬G1000
K
= − 75.146 kcal/mole兲.
Note that any SiO2共s兲 formed from reaction 共IV兲 and 共V兲 in contact with Si共s兲 can undergo further decomposition via reaction 共3兲.
033502-7
J. Appl. Phys. 108, 033502 共2010兲
Yong et al.
Reactions 共III兲, 共IV兲, and 共V兲 can also occur when SrTiO3 is in direct contact with Si; that is if the interface barrier 共the AIL兲 were to disappear and the SrTiO3 film were to come into direct contact with the Si. Reactions 共3兲, 共III兲, 共IV兲, and 共V兲 are somewhat consistent with the work of Liang et al.4 where XPS analysis showed that in ⬍10−9 torr at 877 ° C, virtually all the silicates and SiO2 disappeared on Si, and titanium was likely reduced to titanium silicide. The reaction mechanisms suggested above are summarized in Fig. 9. VI. IMPLICATIONS FOR METAL OXIDE HETEROEPITAXY ON SI
In a typical thin film growth process for metal oxide heteroepitaxy on Si by PLD employing a MBE SrTiO3 prebuffered substrate, the substrate is heated in 100–400 mtorr O2 ambient to a high temperature 共typically 700– 800 ° C兲 required for the multicomponent oxide growth. Our observations suggest that when considering the thermal stability of epitaxial SrTiO3 thin films on Si, the reactivity and diffusivity of gaseous species SiO共g兲 关and perhaps also of SrO共g兲兴 should be considered. The formation of SiO共g兲, occurs only at the interface between Si and SiO2; thus one may be inclined to surmise that if MBE substrates could be grown without SiO2, it would be possible to avoid the presence of SiO at the elevated temperature of the PLD. However since SiO2 forms in the AIL even in ultrahigh vacuum 共via oxygen
diffusion to the Si/ SiO2 interface from SrTiO3兲,4,5 it follows that it may not be possible to have a SrTiO3 / Si substrate that is free of SiO2 at the elevated temperature of the PLD. One can only suppress 共but not eliminate兲 the extent of the circular void forming decomposition reaction 共3兲 by keeping the PLD temperature as low as possible and by minimizing the time that the substrate is at higher temperatures. This implies faster heating and cooling rates before and after the PLD which unfortunately conflicts with the requirement of slow thermal kinetics necessary to minimize the effect of stresses 共which could result in oxide film cracking兲 due to the large 共approximately one order of magnitude兲 mismatch of thermal expansion coefficients between Si and the metal oxide layers. It is clear that the optimization process involve trade-offs. At elevated PLD temperatures, the presence of O2 is helpful as it suppresses the existence of the less stable suboxide SiO2−x at the interface which is most likely the sites where reaction 共3兲 instigates. It must be remembered that it is the partial pressure of O2 at the interface between Si and SiO2 that is important 共not the overall O2 pressure兲. For there to be a greater amount O2 diffusing through to the Si/ SiO2 interface at higher temperature, it is helpful for the AIL to be thinner. It is probably best to establish the oxygen partial pressure required for the PLD 共100–400 mtorr O2兲 at some lower temperature well below the PLD multicomponent oxide growth temperature.
TABLE II. Selected values of standard Gibbs free energy of formation. Reference Barin ⌬Gⴰf,1000
⌬Gⴰf,1000 共kcal/mole兲
⌬Gⴰf,800 共kcal/mole兲
p. 285 共Ref. 25兲
⫺44.564
⫺40.612
⫺229.407
p. 285 共Ref. 25兲
⫺174.663
⫺183.049
⫺234.550 ⫺16.063 ⫺160.547
⫺229.279 ⫺5.134 ⫺155.275
p. 286 共Ref. 25兲
⫺174.630
⫺182.981
p. 287 共Ref. 25兲 p. 403 共Ref. 24兲
⫺117.596 ⫺19.851
⫺122.242 ⫺16.905
p. 290 共Ref. 25兲 p. 290 共Ref. 25兲 p. 290 共Ref. 25兲
⫺296.897 ⫺480.977 ⫺662.929
⫺309.390 ⫺501.03 ⫺691.938
p. 289 共Ref. 25兲
⫺182.181
⫺190.652
p. 312 共Ref. 25兲 p. 312 共Ref. 25兲
⫺323.604 ⫺461.604
⫺336.816 ⫺479.056
共kcal/mole兲
共kcal/mole兲
22兲 22兲 22兲 22兲
⫺52.780 ⫺7.264 +64.980 ⫺78.440
⫺41.319 ⫺5.134 +74.125 ⫺66.612
p. 689 共Ref. 22兲
⫺234.591
p. 690 共Ref. 22兲 p. 674 共Ref. 23兲 p. 676 共Ref. 23兲
Substance O2共g兲 Si共s兲 Si共g兲 SiO共g兲 SiO2共s兲 Quartz SiO2共s兲 Cristobalite Sr共s兲 SrO共s兲 SrO共g兲 SrO2共s兲 SrTiO3共s兲 Sr2TiO4共s兲 Sr4Ti3O10共s兲 Ti共s兲 TiO共s兲 Ti2O3共s兲 Ti3O5共s兲 Ti4O7共s兲 TiO2共s兲 Rutile TiSi2共s兲 Ti5Si3共s兲 TiSi共s兲 SrSiO3共s兲 Sr2SiO4共s兲
Reference Pankratz ⌬Gⴰf,800
p. p. p. p.
584 674 675 688
共Ref. 共Ref. 共Ref. 共Ref.
p. p. p. p. p. p. p.
714 715 716 749 782 784 785
共Ref. 共Ref. 共Ref. 共Ref. 共Ref. 共Ref. 共Ref.
22兲 22兲 22兲 22兲 22兲 22兲 22兲
⫺441.061 ⫺609.980 ⫺1498.186 ⫺10.622 ⫺142.134 ⫺397.666 ⫺644.536
⫺429.897 ⫺593.737 ⫺1458.797 ⫺7.694 ⫺137.116 ⫺387.027 ⫺627.160
p. p. p. p. p. p.
786 788 752 753 680 680
共Ref. 共Ref. 共Ref. 共Ref. 共Ref. 共Ref.
22兲 22兲 23兲 23兲 23兲 23兲
⫺245.476 ⫺107.823 ⫺215.671 ⫺48.858 ⫺426.295 ⫺605.164
⫺239.668 ⫺100.085 ⫺194.088 ⫺43.783 ⫺415.923 ⫺589.663
033502-8
ACKNOWLEDGMENTS
This work was performed under the auspices of the U.S. Department of Energy by Lawrence Livermore National Laboratory under Contract No. DE-AC52-07NA27344. We acknowledge support from the undergraduate research grant to Sanjay Adhikari from the Jess and Mildred Fisher College of Science and Mathematics, Towson University. Thanks are due to Jeff Klupt for help with laboratory instrumentation. R.K. acknowledges support from the Cottrell College Science Award from the Research Corporation through Grant No. CC 6291. APPENDIX
Tabulated values of standard Gibbs free energy of formation are provided in Table II. 1
J. Appl. Phys. 108, 033502 共2010兲
Yong et al.
R. Droopad, Z. Yu, H. Li, Y. Liang, C. Overgaard, A. Demkov, X. Zhang, K. Moore, K. Eisenbeiser, M. Hu, J. Curless, and J. Finder, J. Cryst. Growth 251, 638 共2003兲. 2 G. Yong, R. Kolagani, D. Cox, R. Mundle, A. Davidson III, S. Friedrich, Z. Ali, O. Drury, L. Li, L. Ott, and Y. Liang, http://www.mrs.org/ 2006 Spring Proceedings Symposium GG 共Volume 928E兲 Paper No. 0928– GG05–05. 3 L. V. Goncharova, D. G. Starodub, E. Garfunkel, T. Gustafsson, V. Vaithyanathan, J. Lettieri, and D. G. Schlom, J. Appl. Phys. 100, 014912 共2006兲. 4 Y. Liang and A. A. Demkov in Materials Fundamentals of Gate Dielectrics, edited by A. A. Demkov and A. Navrotsky 共Springer, The Netherlands, 2005兲, pp. 313–348. 5 V. Shutthanandan, S. Thevuthasan, Y. Liang, E. M. Adams, Z. Yu, and R. Droopad, Appl. Phys. Lett. 80, 1803 共2002兲. 6 D. E. McCready, Y. Liang, V. Shutthanandan, C. M. Wang, and S. Thevuthasan, JCPDS-International Centre for Diffraction Data 共2006兲 ISSN 1097-0002 pp. 175–179.
Y. Liang, S. Gan, and M. Engelhard, Appl. Phys. Lett. 79, 3591 共2001兲. X. Hu, H. Li, Y. Liang, Y. Wei, Z. Yu, D. Marshall, J. Edwards, Jr., R. Droopad, X. Zhang, A. A. Demkov, K. Moore, and J. Kulik, Appl. Phys. Lett. 82, 203 共2003兲. 9 I. Kinefuchi, S. Takagi, Y. Matsumoto, H. Yamaguchi, and Y. Sakiyama, J. Chem. Phys. 128, 164712 共2008兲. 10 R. Tromp, G. W. Rubloff, P. Balk, F. K. LeGoues, and E. J. van Loenen, Phys. Rev. Lett. 55, 2332 共1985兲. 11 T. S. Jeon, J. M. White, and D. L. Kwong, Appl. Phys. Lett. 78, 368 共2001兲. 12 J.-P. Maria, D. Wicaksana, A. I. Kingon, B. Busch, H. Schulte, E. Garfunkel, and T. Gustafsson, J. Appl. Phys. 90, 3476 共2001兲. 13 K. Muraoka, Appl. Phys. Lett. 80, 4516 共2002兲. 14 H. Watanabe and N. Ikarashi, Appl. Phys. Lett. 80, 559 共2002兲. 15 S. Sayan, E. Garfunkel, T. Nishimura, W. H. Schulte, T. Gustafsson, and G. D. Wilk, J. Appl. Phys. 94, 928 共2003兲. 16 Y. Liang, Y. Wei, X. M. Hu, Z. Yu, R. Droopad, H. Li, and K. Moore, J. Appl. Phys. 96, 3413 共2004兲. 17 Z. Yu, Y. Liang, C. Overgaard, X. Hu, J. Curless, H. Li, Y. Wei, B. Craigo, D. Jordan, R. Droopad, J. Finder, K. Eisenbeiser, D. Marshall, K. Moore, J. Kulik, and P. Fejes, Thin Solid Films 462–463, 51 共2004兲. 18 PDF files: TiSi2 Nos. 35–0785 and SrSiO3 Nos. 30–1302. 19 K. J. Hubbard and D. G. Schlom, J. Mater. Res. 11, 2757 共1996兲. 20 J. Q. He, C. L. Jia, V. Vaithyanathan, D. G. Schlom, J. Schubert, A. Gerber, H. H. Kohlstedt, and R. H. Wang, J. Appl. Phys. 97, 104921 共2005兲. 21 J. P. Chang and Y.-S. Lin, Appl. Phys. Lett. 79, 3824 共2001兲. 22 I. Barin and O. Knacke, Thermochemical Properties of Inorganic Substances 共Springer-Verlag, Berlin, 1973兲. 23 I. Barin, O. Knacke, and O. Kubaschewski, Thermochemical Properties of Inorganic Substances, Supplement 共Springer-Verlag, Berlin, 1977兲. 24 L. B. Pankratz, Thermodynamic Properties of Elements and Oxides, Bulletin 672 共U.S. Dept. of the Interior, Bureau of Mines, Washington, DC, 1982兲. 25 L. B. Pankratz, J. M. Stuve, and N. A. Gokcen, Thermodynamic Data for Mineral Technology, Bulletin 677 共U.S. Dept. of the Interior, Bureau of Mines, Washington, DC, 1984兲. 7 8