thermal performance of two variable stiffness pan- els fabricated using ..... tour plot in Fig. 13. The maximum .... used to fully cure the adhesives used to attach the.
AIAA 2001-1190 Thermal Testing of Tow-Placed, Variable Stiffness Panels K. Chauncey Wu NASA Langley Research Center Hampton, Virginia Zafer GŸrdal Virginia Polytechnic Institute and State University Blacksburg, Virginia
42nd AIAA/ASME/ASCE/AHS/ASC Structures, Structural Dynamics and Materials Conference & Exhibit 16-19 April 2001 Seattle, Washington For permission to copy or to republish, contact the copyright owner named on the first page. For AIAA-held copyright, write to AIAA Permissions Department, 1801 Alexander Bell Drive, Suite 500, Reston, VA, 20191-4344.
AIAA 2001-1190 THERMAL TESTING OF TOW-PLACED, VARIABLE STIFFNESS PANELS K. Chauncey Wu* NASA Langley Research Center Hampton, Virginia 23681 Zafer GŸrdal Virginia Polytechnic Institute and State University Blacksburg, Virginia 24061
Abstract Commercial systems for precise placement of pre-preg composite tows are enabling technology that allows fabrication of advanced composite structures in which the tows may be precisely laid down along curvilinear paths within a given ply. For laminates with curvilinear tow paths, the fiber orientation angle varies continuously throughout the laminate, and is not required to be straight and parallel in each ply as in conventional composite laminates. Hence, the stiffness properties vary as a function of location in the laminate, and the associated composite structure is called a Òvariable stiffnessÓ composite structure. Previous analytical studies indicate that variable stiffness structures have great potential for improving the structural performance of composite structures. In the present research, an experimental program has been conducted to evaluate the thermal performance of two variable stiffness panels fabricated using the Viper Fiber Placement System developed by Cincinnati Machine. These variable stiffness panels have the same layup, but one panel has overlapping tows and the other panel does not. Results of thermal tests of the variable stiffness panels are presented and com_____________________ *Aerospace Engineer, Vehicle Analysis Branch, Mail Stop 365. Professor, Departments of Aerospace and Ocean Engineering, and Engineering Science and Mechanics, Associate Fellow AIAA. Copyright © 2001 by the American Institute of Aeronautics and Astronautics, Inc. No copyright is asserted in the United States under Title 17, U.S. Code. The U.S. Government has a royalty-free license to exercise all rights under the copyright claimed herein for Governmental Purposes. All other rights are reserved by the copyright owner.
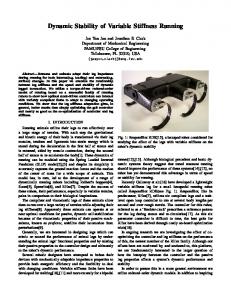
pared to results for a baseline cross-ply panel. Issues arising from the manufacturing processes used to fabricate the variable stiffness panels are also presented and discussed. Introduction The widespread use of polymer composite materials in aerospace vehicles has also resulted in the development of highly innovative, advanced composite structures like the V-22 aft fuselage and the JSF engine inlet duct. Many, if not all, of these complex structures require sophisticated manufacturing technology for their fabrication. A significant advancement in computernumerical-control (CNC) machine tool technology is the introduction of commercial systems for precise, repeatable placement of pre-preg composite tows. One example of such an advanced tow placement system is the Viper¤ Fiber Placement System1 (FPS), developed by Cincinnati Machine and shown in Fig. 1. Advanced tow placement systems like the Viper FPS are enabling technology that allows fabrication of complex composite structures in which the fibers in any given ply may be laid down along curvilinear paths. In these advanced composite structures, the fiber orientation angle is allowed to vary continuously in each ply and throughout the structure, and is not required to be straight and parallel in each ply as in conventional composite structures. These configurations are referred to as Òvariable stiffnessÓ or VS struc_____________________ ¤ Identification of commercial products and companies in this paper is used to describe the materials adequately. The identification of these commercial products does not constitute endorsement, expressed or implied, of such products by the National Aeronautics and Space Administration.
1 American Institute of Aeronautics and Astronautics
tures, because their stiffness properties also vary continuously over the domain of the structure. Several analytical studies have been performed to predict the structural performance of VS structures. GŸrdal and Olmedo2,3 presented solutions for in-plane response and buckling of constant-thickness VS panels with various boundary conditions and aspect ratios. Variable stiffness laminate designs were identified whose buckling loads were up to 80 percent higher than those of an equal-weight conventional angle-ply laminate. Waldhart 4 defined a manufacturing constraint on fiber radius of curvature for VS panels whose fiber paths are generated by shifting a reference path in one direction (the method used in Refs. 2 and 3), and also by projecting new fiber paths which are parallel to the reference path. These constraints were then applied to optimized designs from Refs. 2 and 3. Tatting5 applied the VS concept to the design of cylindrical shells such as fuselage structures, and showed that the largest improvement in the bending response of long cylinders was achieved through a circumferential shell stiffness variation. Langley6 evaluated the in-plane response of symmetric VS laminates with overlaps which are generated by placement of adjacent tows during the manufacturing process. These overlaps form areas of increased thickness in the laminate that resemble discrete stiffeners on the panel surface, and are much more complicated to model and analyze than the previous constantthickness laminates. These studies indicate that the VS concept has great potential for improving the structural performance of composite structures. However, no experimental work has been done thus far to evaluate the thermal performance of VS panels. The primary objective of the present work is to present the results of an experimental study to compare and evaluate the structural response of VS panels when subjected to thermal loads. The second objective of this study is to discuss unique issues related to the fabrication of the VS panels using the Viper FPS. Advanced tow placement systems Commercial systems for precise, repeatable placement of pre-preg tows are now being used for fabrication of advanced composite structures. These advanced tow placement systems represent a combination of the best features of auto-
mated tape layer and tape winding systems. An advanced tow placement system typically has a self-contained tow placement head with multiple degrees of freedom (DOF), which is then mounted on a motion base with several translational DOF. A mandrel with an additional rotational DOF provides a tool surface on which the tows are deposited. One widely used advanced tow placement system is the Viper FPS, developed and manufactured by Cincinnati Machine. The Viper FPS has a tow placement head that collimates up to 32 prepreg tows from individual supply reels. Each supply reel has a separate feed mechanism with the capability to cut and restart that tow. The tow feed mechanisms also permit the tows to be paid out at different rates, thus allowing the tow placement head centerline to precisely follow complex, curvilinear paths. Heaters inside the tow placement head provide for partial in-situ compaction of the tows, which allows fabrication of parts with concave surfaces. The Viper FPS has a total of seven DOF in the workspace: three rotational DOF on the tow placement head, two translational and one rotational DOF on the motion base, and one rotational DOF on the mandrel. The Viper FPS or similar systems are required to fabricate advanced composite structures like the VS panels in this study. Thus, they are enabling technology which can allow engineers to design composite structures that have reached their full performance potential through tailoring of the fiber orientation angles, both across the planform and through the thickness of the structure. Selection of design for fabrication The fiber orientation angle of a VS fiber in this study (shown in Fig. 2) is assumed to be a linear saw-tooth function with specified initial and final values. These values are specified at a given interval along a variation direction, and this variation direction may then be rotated through some angle about the global axes. Thus, a reference tow path may be described by four parameters. These parameters are Qo, the fiber orientation angle at the panel center, Q1, the fiber orientation angle at a specified distance a/2 along the variation direction, and F, the rotation angle of the variation direction with respect to the global coordinates. A representative fiber orientation angle is shown in Fig. 2, and the corresponding reference tow path
2 American Institute of Aeronautics and Astronautics
is shown in Fig. 3. In this study, additional tow paths are generated by shifting the reference path along an axis through the panel center and perpendicular to the variation direction. A condensed notation for a VS laminate is [F±]ns, where the subscript n indicates an integer number of repeating VS plies, and s indicates midplane symmetry. Studies performed by GŸrdal and Olmedo2,3 predicted that significant increases in buckling load are possible for square, simply supported VS panels. These constant thickness panels are loaded with end displacements applied parallel to the shift direction, but transverse to the fiber orientation angle variation. A series of VS laminate designs are identified whose buckling loads are higher than those of an equal-weight conventional angle-ply laminate. These designs all have fiber orientation angles that are smaller on the centerline than on the panel edges. This means that the center of the panel has a low stiffness in the loading direction, with a higher percentage of the total axial load applied through end displacement carried by the stiff, simply supported panel edges. A VS laminate with a [0±]9s layup has the highest buckling load of all the VS designs evaluated in these studies. The buckling load of this VS laminate is 79 percent higher than the highest straight angle-ply laminate buckling load (obtained with an equal-weight ±45 deg. layup). A VS ply from this laminate is shown in Fig. 4, with the reference tow path shown as a dark line, and the shifted paths shown as dashed lines. All of the fibers on the panel load axis centerline are oriented at 90 deg. to the panel load axis, which is undesirable because these fibers do not contribute to the laminate axial stiffness. This portion of the laminate also violates good composites design practice, which states that laminates should not have more than four contiguous plies with the same fiber orientation angle.7 Waldhart4 determined that this design violates a fiber curvature constraint that specifies the minimum radius of curvature for the tow placement head, and thus is not manufacturable with current technology. For the same panel geometry above, Waldhart identified a manufacturable VS laminate design with a buckling load which is 44 percent higher than the buckling load of a ±45 deg. laminate. This design has a [90±]9s layup. This design is close to the fiber curvature constraint boundary,
and thus may be difficult to manufacture. Reduction of the 75 deg. edge fiber orientation angle should make fabrication of the VS laminate easier, but will also slightly lower the buckling load. Small increases in buckling load are also predicted through replacement of the outermost VS plies with ±45 deg. straight-fiber plies. A modified design with a [±45/(90±)4]s layup is chosen for fabrication with the Viper FPS.8 Variable stiffness panel manufacturing The Viper FPS is used to fabricate three composite panels from AS4/977-3 pre-preg. Each panel has a 26 x 24.50 inch planform, with a 24 x 24 inch test section located between the mechanical test boundary supports. The first two panels both have the same VS layup, but one panel has overlapping tows and the other panel does not. These panels are used to quantify the improvements in thermal-structural performance due to the VS layup. The third panel has a conventional [±45]5s layup to provide a baseline for comparing the response of the two VS panels. The Viper FPS used for fabrication of the VS panels in this study is configured to apply up to 24, 1/8 inch-wide pre-preg tows during each pass of the tow placement head. In the first VS panel, all 24 tows are applied during each pass of the Viper FPS, which causes significant overlaps between tows from adjacent passes towards the panel edges. For the second VS panel, fabricated without overlaps, the tow cut/restart capability of the Viper FPS is used to maintain a constant 20-ply thickness across the whole panel while still applying the VS layup. Exact tow path As discussed above, the nominal layup of the two VS panels is [±45/(90±)4]s, which is both symmetric and balanced. The outer four plies of these laminates are straight-fiber ±45 deg. plies, and the inner 16 plies are VS plies with a fiber orientation angle of ±60 deg. at Y = 0 inches (the panel centerline), and ±30 deg. at Y = ±12 inches. The fiber orientation angle varies linearly between Y = 0 and ±12 inches, and repeats outside the ±12 inch limits. The relationship between the VS fiber orientation angle Q and the panel geometric coordinates X and Y is given by dY/dX = tan(Q). Since Q is a
3 American Institute of Aeronautics and Astronautics
linear function of Y, then dX = cot(Qo + mY)dY, where Qo is the fiber orientation angle on the centerline (60 deg. in Fig. 2), and m is the slope of the fiber orientation angle variation (2.5 deg./inch for -12 £ Y £ 0 inches, and -2.5 deg./inch for 0 £ Y £ 12 inches). Integration of this equation (with X = 0 at YÊ= 0) gives an analytical expression for the exact tow path of a +Q VS ply, which is X(Y ) =
±
±
1 m [tan2 (Q o ) + 1] 1 m [cot 2 (Q o ) + 1]
{tan(Q o )mY + ln[tan(Q o )cos(mY)+sin(mY)]} {cot(Q o )mY ± ln[cot(Q o )sin(mY)+cos(mY)]}
ln [tan(Q o )]
m [tan2 (Q o ) + 1]
(Eq. 1)
All of the tow paths within a ply are nominally identical to the exact tow path, but are shifted in both directions along the X-axis by integer multiples of (24 tows x 1/8 inch/tow)/sin(Qo = 60 deg.), or 3.464 inches. For a -Q VS ply, the tow path is reflected about the X-Z plane. As mentioned earlier, shifting of the tow paths may result in overlapping of the edges of the adjacent passes. These overlaps may assume the appearance of integral stiffeners in the finished panel. The exact stiffener pattern resulting from tow overlaps is shown in Fig. 5 for the test section of the first VS panel, with predicted laminate thicknesses between 36 and 20 plies. This pattern shows step thickness discontinuities between the stiffened regions which could cause local voids and load path variations. Actual tow path The actual tow paths which the Viper FPS tow placement head centerline follows during fabrication of the first -Q VS ply (actually the third ply laid down on the tool surface) are shown in Fig. 6 for the VS panel without overlaps. Each tow path in the figure requires a separate pass by the Viper FPS. The tow paths within the test section are essentially identical to the reference tow path which passes through the origin (shown as a bold line in the figure), but are shifted by multiples of 3.550 inches along the X-axis. The fiber orientation angles for this ply are shown in Fig. 7, with lighter shades of gray corresponding to smaller magnitudes. Since the VS panel with overlaps is laid up on a flat tool surface, the layup is asymmetric, with a raised stiffener pattern on the back of the actual
panel (see Fig. 8). The test section is outlined in white in the figure. For the VS panel without overlaps, use of the tow drop/add capability may result in resin-rich pockets or voids whose locations (shown as black dots in Fig. 7) may be predicted from manufacturing data provided by Cincinnati Machine. These data include descriptions of the paths followed by the tow placement head during panel fabrication, and which of the 24 tows were placed at any given location within each ply. These manufacturing data are further processed and evaluated to determine correlation between the exact and actual tow paths. Good agreement is found for the first two VS plies in both of the VS panels. This correlation is shown in Fig. 9, where the exact tow paths generated with Eq. 1 (shown as dashed lines) are plotted with the actual tow paths from Fig. 6. The majority of the differences between the exact and actual tow paths in the figure are due to the two different Xdirection shift increments listed above. Manufacturing ply shift Further analyses of the manufacturing data show that the centerpoint of each subsequent VS ply with the same orientation is shifted by integer multiples of 3/16 inch in both the X- and Ydirections. The reference tow paths for the eight -Q VS plies of the VS panel without overlaps are shown in Fig. 10. As described above, the centerpoint for ply 3 passes through the origin, and the centerpoints for the next seven VS plies are each shifted by an additional (3/16 ´ Ö2) inches along the line Y = X. Note that the ply numbers switch from odd to even as they pass the nominal laminate symmetry plane between plies 10 and 11. The centerpoints of the +Q VS plies are shifted by the same increments along the line YÊ=Ê-X. From a manufacturing point of view, the purpose of these ply shifts is to avoid collocation of ply drops and seams between successive passes on the panel planform, since they would occur at the same points within each ply of the same orientation. Collocation of ply drops and seams would cause local resin-rich regions through the panel thickness, which could degrade the laminate strength and stiffness. Unfortunately, these ply shifts cause the actual layups for the two VS laminates to be both asymmetric and unbalanced. Thus, every point on the VS panel planform has a unique layup, making the structure even more
4 American Institute of Aeronautics and Astronautics
complicated than originally intended. The reference tow paths for the ±45 deg. plies of the VS panels do not exhibit the centerpoint shifts described above. It would be desirable to incorporate the benefits of the ply shifts (no collocation of tow drops and edges) in VS panels, while still minimizing the detrimental effects (asymmetry and imbalance in the layup). Two possible methods for reducing the impact of the ply shifts are now proposed. One solution would be to reduce the magnitude of the ply shift X- and Y-increment from 3/16 inch (1.5 tow widths) to 1/16 inch (0.5 tow widths). While this option does allow the tow drops to be closer together, it also reduces the variation in fiber orientation angles at any given point. Another scheme, which can also be used with the one just described, is to alternate the direction of the shift increment. Several options are illustrated in Fig. 11 for the -Q plies of a VS panel, along with the current scheme used in fabrication of the panels in this study. Zero indicates no shift (where the VS ply is origin-centered as in Fig. 6), 1 is a shift of some magnitude in the direction shown in Fig. 9, and -1 is a shift in the opposite direction. These schemes have the same advantage as the one above, but with the disadvantage that the tow drops and voids in several plies are collocated on the panel planform, but not in adjacent plies. These options should be evaluated with analytical methods to predict their effectiveness in reducing the panel anisotropy. Panel imperfections The geometric imperfections of the three composite panels are determined from surveys performed with a Brown and Sharpe 7300 coordinate measuring machine (CMM) fitted with a Renishaw PH-9 indexable probe head. The CMM can locate a point in space with a accuracy of ±0.0003 inches in its workspace. Front and back surface measurements are taken at a grid of evenly spaced locations (1/8 inch for the VS panel with overlaps, and 1/2 inch for the VS panel without overlaps and baseline panel) over the 24 ´ 24 inch test sections. The asymmetric, unbalanced layups introduced due to the ply shifts caused the two VS panels to warp badly after panel consolidation. A plot of the front (tool) surface geometric imperfec-
tions is shown in Fig. 12 for the VS panel with overlaps. The maximum amplitude is 0.383 inches and the minimum amplitude is -0.331 inches, with a root-mean-square (RMS) amplitude of 0.152 inches. The front surface imperfections of the VS panel without overlaps are qualitatively identical to the ones in Fig. 12. The maximum amplitude is 0.417 inches, the minimum amplitude is -0.371 inches, and the RMS amplitude is 0.166 inches for this panel. The surface contours for the two VS panels are very similar, which leads to the conclusion that the anticlastic shapes of the VS panels are due entirely to the ply shifts, not from the thickness variations caused by the tow overlaps. The front surface imperfections for the baseline panel have a maximum amplitude of only 0.031 inches, and a minimum amplitude of -0.022 inches. The RMS amplitude for the baseline panel is 0.013 inches, or 8 percent of the average amplitude of the VS panels. The ply shifts, if present, should have no effect on the baseline panel because it is a conventional composite laminate whose fiber orientation angles are the same throughout each ply. Laminate and ply thickness The measured thicknesses of the two 20-ply panels are computed as the difference of the front and back surface measurements. The average thickness of the VS panel without overlaps is 0.149 inches, with a standard deviation of 0.0026 inches, and the average thickness of the baseline panel is 0.153 inches, with a standard deviation of 0.0019 inches. The average ply thicknesses for these panels are 0.00745 and 0.00765 inches, respectively. The VS panel without overlaps weighs 5.48 lbs, and the baseline panel weighs 5.65 lbs, for an average material density of 0.0579 lb/in3. The measured thicknesses of the VS panel with overlaps are computed and shown in a contour plot in Fig. 13. The maximum thickness of this panel is 0.289 inches, and the minimum thickness is 0.140 inches. An analysis of the manufacturing data for the VS panel with overlaps shows that the maximum laminate thickness is 38 plies, and the minimum thickness is 18 plies. The actual VS panel with overlaps weighs 6.77 lbs. Multiplication of the material density, number of plies, differential area, and ply thickness gives a differential weight at each point in the panel planform where the
5 American Institute of Aeronautics and Astronautics
manufacturing layups are defined, and summation gives an estimate of the panel weight. An assumed ply thickness of 0.00765 inches results in a predicted weight of 6.78 lbs, which is very close to the actual weight of the panel. Fiber orientation angle Before advanced fiber placement systems can be used for fabrication of advanced composite structures, it is necessary to quantify the precision and accuracy of the fiber orientation angles as the tows are laid down in the workspace. If the tows can be placed in a predictable, repeatable manner during the manufacturing process, then the nominal values can be used in the design of VS structures with a high degree of confidence that the actual angles will conform to their desired values. If this is achievable, laminate designers can then include the fiber orientation angle throughout the structure as a design variable, further opening the design envelope and leading to even more highly optimized composite structures.
raise the temperature within the enclosure. The oven is built from plywood, with foam and ceramic board insulation lining the interior. Perforated sheet-metal baffles are installed within the oven to ensure uniform heating of the panel by the forcedair heater unit. The oven is installed in a 500 klb electrohydraulic compression test stand, thus allowing mechanical loads to be applied to the panel either with or without the thermal loads. A personal computer-based data acquisition system is used to collect information from the test instrumentation as well as load and stroke data from the test stand. The panel is supported in the oven by fixtures that prevent rigid-body motion of the panel while still allowing thermal free expansion. The panel rests on two small quartz rollers that support the panelÕs weight while preventing direct contact between the panel and lower heated platen. Small quartz cones are attached to the corners of the oven face opposite spring-loaded steel plungers to support the corners of the panel. Shadow moirŽ interferometry
The actual fiber orientation angles for the reference tow path in Fig. 6 are computed from manufacturing data and plotted with their exact values in Fig. 14. The differences between the exact and actual ply angles are shown in Fig. 15, with a RMS difference of 0.38 degrees over the 24.50 inch width of the VS panel. This leads to the conclusion that the Viper FPS can precisely orient the composite tows at their desired angles, which is significant because it means that manufacturers can precisely and accurately control the fiber orientation angle during the fabrication process. Thermal free-expansion tests
The front face of the oven described above is a clear glass pane that allows observations of the panel using shadow moirŽ interferometry during both thermal and mechanical load tests. Shadow moirŽ interferometry is an experimental technique used to obtain qualitative and quantitative measurements of the panel normal (out of plane) displacements. Only qualitative measurements are taken during the tests in this study, so thermal deformations of the moirŽ system are not considered to be significant.
One objective of the present work is to experimentally evaluate the structural response of the VS and baseline panels when subjected to thermal loads. For each of the three panels discussed above, several thermal tests of the unconstrained panel are performed. In these tests, the panel (without edge and end fixtures) is heated from room temperature to a maximum of 150 degrees Fahrenheit (deg. F).
A grid of thin black lines (50 lines/inch) on photographic film base is mounted on the glass front of the oven. A polarized, high-intensity light source is used to project shadows from the grid onto the panel inside the oven. As the panel deforms, the interference patterns (moirŽ) between the grid and shadows appear to shift. A Hasselblad 70 mm camera is used to take still photographs, and a tripod-mounted video camera is used to record video imagery, of the moirŽ patterns during the tests.
Test facility
Instrumentation
A capability for thermal testing is developed which includes an oven with thermal control. Electrical resistance and forced-air heaters are used to
For the thermal test, the panel response is measured with thermocouple and strain gage instrumentation. The thermocouple and strain gage
6 American Institute of Aeronautics and Astronautics
patterns used for the three panels are shown in Fig. 16. Ten thermocouples, arranged as back-toback pairs, are attached to the panel front and back surfaces. The thermocouples have an accuracy of ±1.8 deg. F, and are used to measure the panel surface temperature during heating. Between 18 and 34 electrical-resistance strain gages, arranged in back-to-back pairs, are bonded to the panel surfaces to measure strains from the thermal tests. The strain gages are deployed to measure either axial strains, or both axial and transverse strains at discrete points on the panel. Strain data are taken as functions of temperature for gages bonded to Corning ultra-low-expansion titanium silicate blocks to determine the thermal output of the strain gages.9 After the thermal test, the thermal output data are subtracted from the total strain collected during the test to obtain the true free-expansion thermal strains. No panel axial displacements are recorded during the thermal tests. However, four linear variable displacement transducers (LVDTÕs) are located at the corners of the test stand platens to measure their relative motion during the thermal test. Heating profile Electrical resistance and forced-air heaters are used to gradually raise the temperature within the oven to a maximum of 150 deg. F. A feedback control system is used to provide closed-loop, real-time thermal control. Electrical thermocouples are attached to the heated platens and oven to provide feedback to the control system, as well as measurements of the temperature input, to the data acquisition system. The temperatures inside the oven are raised from room temperature to 90 deg. F as a step input, then held at that level for 5 minutes to allow all temperatures to equalize. The temperatures are then increased to 150 deg. F at 2 deg. F/minute. To complete the heating cycle, the temperatures are held at 150 deg. F for 20 minutes to allow the panel to reach its maximum temperature. A representative heating profile is shown in Fig. 17. Test results Five thermal tests are performed for each of the three panels. The first test for each panel is used to fully cure the adhesives used to attach the
strain gages. Typical test results from the later tests are presented in this section. As noted above, the strain data presented here are corrected for the strain gageÕs thermal output caused by the thermal loading. A shadow moirŽ photograph of the VS panel without overlaps during the free-expansion thermal test is shown in Fig. 18. The contours in this figure correspond to the anticlastic panel geometry from Fig. 12. No changes are observed in these contours during the thermal tests. This is probably due to the relatively low resolution of the shadow moirŽ system and the small induced deformations, and does not mean that the panels do not deform during the thermal test. VS panel with overlaps Back-to-back axial and transverse strains at the center of the VS panel with overlaps are plotted against the average panel temperature in Fig. 19. The location of the gages is indicated by a black ring on the gage pattern in the figure. As expected, the strain response is linear with temperature. The extensional (in-plane) coefficient of thermal expansion (CTE) of the laminate is equal to the slope of a plot of the average strain as a function of temperature. The approximate layup at the panel center (determined from manufacturing data) is [±45/(±58)4]s. This layup has a relatively high axial CTE of 5.06 ´ 10-6 in/in/deg. F, and a low transverse CTE of 0.06 ´ 10-6 in/in/deg. F. These measured CTEÕs are computed using the average axial and transverse strains from Fig. 19. A set of experimentally determined material properties (shown in Table 1) and the [±45/(±58)4]s panel layup are used as input for a commercial laminate analysis code.10 Using classical lamination theory (CLT), the laminate analysis code predicts an axial CTE of 7.12 ´ 10-6 in/in/deg. F, and a transverse CTE of -1.64 ´ 10-6 in/in/deg. F for this layup. The measured and predicted CTE values are listed and compared in Table 2. Back-to-back axial and transverse strain data are also taken at a point 5 inches to the right of the panel center on the transverse centerline, and are analyzed as described above. The 20-ply layup of the VS panel with overlaps is approximately [±45/(±48)4]s at this point, which is close to an orthotropic cross-ply layup. However, the meas-
7 American Institute of Aeronautics and Astronautics
ured axial CTE of this layup (2.96 ´ 10-6 in/in/deg. F) is still significantly higher than the transverse CTE (0.51 ´ 10-6 in/in/deg. F). A comparison with predicted values is also shown in Table 2.
baseline panel is about 7 deg. F lower than the maximum temperature for the VS panels because the heating profile used for the tests of this panel did not include the 20 minute hold at 150 deg. F shown in Fig. 17.
VS panel without overlaps Discussion Back-to-back axial and transverse strains at the panel center are plotted against the average panel temperature in Fig. 20 for the VS panel without overlaps. Analyses of the test data show that this layup has an axial CTE of 3.86 ´ 10-6 in/in/deg. F, and a transverse CTE of -0.36 ´ 10-6 in/in/deg. F. The 20-ply layup at the panel center is approximately [±45/(±57)4]s. A laminate analysis predicts an axial CTE of 6.78 ´ 10-6 in/in/deg. F, and a transverse CTE of Ð1.58 ´10-6 in/in/deg. F. These measured and predicted CTE values are compared in Table 2. While the extensional CTE trends for this panel are similar to those described above for the VS panel with overlaps, the bending strains, which are proportional to the difference between the front and back surface strains, are reversed. Comparisons of the measured and predicted CTEÕs at two points, located 5 and 10 inches to the right of the centerpoint along the transverse centerline, are also shown in Table 2. The approximate layups at these points are [±45/(±47)4 ]s and [±45/(±35)4]s, which are both 20-ply laminates. Good correlation is observed between test and predicted CTE values at these points. Note that a direct comparison may be made between the first point evaluated here and the corresponding point described above on the VS panel with overlaps. However, a direct comparison is not possible for the second point on this panel, because the corresponding laminate thickness on the VS panel with overlaps is approximately 0.245 inches (32 plies). Baseline panel For the baseline panel, back-to-back axial and transverse strains at the panel center are plotted against the average panel temperature in Fig. 21. The strains are linear and approximately equal, which is as expected, since the [±45]5s laminate should have the same CTE in both the axial and transverse directions. The measured CTE of this layup is 1.58 x 10⁻⁶ in/in/deg. F, which compares well with the predicted value of 1.47 ´ 10-6 in/in/deg. F. The maximum temperature for the
A plot of the measured and predicted CTEÕs is shown in Fig. 22, with predicted CTE values plotted at 1-degree increments of the fiber orientation angle. The correlation between the measured and predicted CTEÕs for the composite panels ranges from excellent (1.5 percent error) to poor (104 percent error). The best correlation is obtained where the layups are close to an orthotropic crossply laminate (i.e., [±45]5s), but good correlation is also observed for the [±45/(±35)4]s laminate. Poor correlation is obtained for larger fiber orientation angles. The correlation between the measured and predicted CTEÕs is somewhat surprising, since the fiber angles (and CTEÕs) of the VS panels change dramatically across the panel width, and only slightly across the panel height due to the manufacturing ply shifts. In comparison, the CLT-based laminate analysis assumes that the laminate is a conventional composite structure with the same fiber angles at every point. It would therefore be reasonable to expect that CLT is unsuited for thermal analysis of VS structures, but the correlation in Fig. 22 indicates that this is not the case, at least for low to intermediate fiber orientation angles. Thus, a numerical procedure with an accurate fiber orientation model should also be used to predict the thermal performance of the VS laminates and model the interactions between the adjacent laminates of varying layups and thicknesses, an effort which is, at present, outside the scope of this paper. A qualitative analysis of the bending strains for the VS panel with overlaps indicates that the outof-plane deformations become more exaggerated during the thermal test. In other words, the panel geometry at the maximum temperature looks like the one shown in Fig. 12, but with even larger amplitudes. Similar analyses for the VS panel without overlaps indicate that, when heated, it tries to return to a flat configuration. This behavior is what one would expect since the panel was cured on a flat surface at approximately 350 deg. F, and is an indication of the residual stresses induced during
8 American Institute of Aeronautics and Astronautics
the curing due to the variation of the fiber orientation angle over the planform area of the panel as well as the unanticipated through-the-thickness variation. This behavior is the opposite of what was observed for the VS panel with overlaps, which suggests that the different deformation patterns may be due to the raised stiffeners on the back of the panel. Quantitative comparisons of the strains for the two VS panels also shows that the strain magnitudes are larger for the VS panel with overlaps, which may also be due to the additional strain from the raised stiffeners. Concluding remarks Previous analytical studies demonstrate that the VS concept has great potential for improving the structural performance of composite structures. In this study, the results of experiments to compare and evaluate the structural response of VS panels when subjected to thermal loads are presented and discussed. Comparisons between experimental CTEÕs and results generated with CLT show that the best correlation is achieved for laminates that are close to a ±45 deg. Layup. An additional goal of this study is to identify and discuss several fabrication issues for the VS panels. Differences between the exact and actual tow paths are quantified. The manufacturing ply shift is also quantified and its effects on the panel hardware are discussed. Several options are presented for achieving the same benefits with a reduced impact on the panel hardware. Composite materials have revolutionized aerospace structures in the past three decades. The recent introduction of advanced fiber placement systems now allows composite manufacturers to precisely and accurately control the fiber orientation angle during fabrication of the structure. This capability now allows designers of composites to use the fiber orientation angle as a design variable in their analyses, not only throughout each ply as with conventional composites, but at each point within a ply in an advanced composite structure. The present work represents a first step towards developing a verified, reliable capability for the analysis and design of such highly tailored composite structures.
national SAMPE Symposium, Vol. 34, Book 2, May 1989, pp. 1822-1833. 2. GŸrdal, Z., and Olmedo, R.: In-Plane Response of Laminates with Spatially Varying Fiber Orientations: Variable Stiffness Concept. AIAA Journal, Vol. 31, No. 4, April 1993, pp. 751-758. 3. Olmedo, R., and GŸrdal, Z.: Buckling Response of Laminates with Spatially Varying Fiber Orientations. Proceedings of 34th AIAA/ ASME/ASCE/AHS/ASC Structures, Structural Dynamics, and Materials Conference. April 1921, 1993, La Jolla, CA, pp. 2261-2269. Available as AIAA-93-1567. 4. Waldhart, C., GŸrdal, Z., and Ribbens, C.: Analysis of Tow Placed, Parallel Fiber, Variable Stiffness Laminates. Proceedings of 37th AIAA/ASME/ASCE/AHS/ASC Structures, Structural Dynamics, and Materials Conference. April 15-17, 1996, Salt Lake City, UT. Available as AIAA-96-1569. 5. Tatting B. F.: Analysis and Design of Variable Stiffness Composite Cylinders. Ph. D. Dissertation, Virginia Polytechnic Institute and State University, 1998. 6. Langley, P. T.: Finite Element Modeling of Tow-Placed Variable-Stiffness Composite Laminates. M. S. Thesis, Virginia Polytechnic Institute and State University, 1999. 7. GŸrdal, Z., Haftka, R. T., and Hajela, P.: Design and Optimization of Laminated Composite Materials. John Wiley and Sons, Inc., New York, 1998. 8. Tatting B. F., and GŸrdal, Z.: Design and Manufacture of Tow-Placed Variable Stiffness Composite Laminates with Manufacturing Considerations. Proceedings of 13th U.S. National Congress of Applied Mechanics (USNCAM). June 21-26, 1998, Gainesville, FL. 9. Anon., Strain Gage Thermal Output and Gage Factor Variation with Temperature. TN-504-1, Measurements Group, Inc., Raleigh, NC, 1993.
References 1. Evans, D. O., Vaniglia, M. M., and Hopkins, P. C.: Fiber Placement Process Study. 34th Inter-
10. Nairn, J. A.: Utah Laminatesª Manual, Version 2.0. RSAC Software, Salt Lake City, UT, 1988.
9 American Institute of Aeronautics and Astronautics
Table 1: Measured ply properties of AS4/977-3 material
_________________________________________________________________________________ E1 E2 G12 n1 2 a1 a2
18.83 x 10⁶ lb/in2 1.34 x 10⁶ lb/in2 0.74 x 10⁶ lb/in2 0.36 -0.19 x 10⁻⁶ in/in/deg. F 19.1 x 10⁻⁶ in/in/deg. F
_________________________________________________________________________________
Table 2: Measured and predicted coefficients of thermal expansion for variable stiffness and baseline panels
_________________________________________________________________________________ Rosette location, in. Layup, deg.
Gage orientation
CTE, 10-6 in/in/deg. F Test CLT
Error, percent
_________________________________________________________________________________ VS panel with overlaps (X=0, Y=0) Axial [±45/(±58)4 ]s Transverse
5.06 0.06
7.12 -1.64
28.9 103.7
(X=0, Y=5) [±45/(±48)4 ]s
Axial Transverse
2.96 0.51
2.85 0.28
3.9 82.1
VS panel without overlaps (X=0, Y=0) Axial [±45/(±57)4 ]s Transverse
3.86 -0.31
6.78 -1.58
43.1 80.4
(X=0, Y=5) [±45/(±47)4 ]s
Axial Transverse
2.53 0.66
2.38 0.65
6.3 1.5
(X=0, Y=10) [±45/(±35)4 ]s
Axial Transverse
-0.98 5.04
-1.39 6.02
29.5 16.3
1.58
1.47
7.5
Baseline panel (X=0, Y=0) [±45]5s
_________________________________________________________________________________
10 American Institute of Aeronautics and Astronautics
Courtesy of Cincinnati Machine
1. Advanced fiber placement system.
Fiber orientation angle
Q1
Qo
a/2 Variation direction
2. Fiber orientation angle for VS ply.
11 American Institute of Aeronautics and Astronautics
Y Shift direction
Q1 a/2 Variation direction
Qo
F X
3. Reference tow path for VS ply.
Y
Shift direction
Endÿshortening direction
X Fiberÿangle variation direction
4. [0±] VS ply.
12 American Institute of Aeronautics and Astronautics
36ÿplies
28ÿplies 20ÿplies
5. Exact stiffener pattern for VS panel with overlaps.
20
Y-coordinate,ÿin.
10
0
-10
-20 -20
Reference towÿpath
-10
0
10
20
X-coordinate,ÿin. 6. Actual tow paths for ply 3 of VS panel without overlaps.
13 American Institute of Aeronautics and Astronautics
20
Q,ÿdeg -32.59 -35.77 -38.95 -42.14 -45.32 -48.50 -51.68 -54.86 -58.05 ÿÿÿÿ Towÿdrop/tow notÿplaced
Y-coordinate,ÿin.
10
0
-10
-20 -20
-10
0 X-coordinate,ÿin.
10
20
7. Fiber orientation angles for ply 3 of VS panel without overlaps.
8. Back surface of VS panel with overlaps.
14 American Institute of Aeronautics and Astronautics
20
Actualÿtowÿpath Exactÿtowÿpath 0
-10
-20 -20
-10
0
20
10
X-coordinate,ÿin. 9. Comparison of exact and actual tow paths for VS ply.
20
Plyÿ18 10 Y-coordinate,ÿin.
Y-coordinate,ÿin.
10
Plyÿshiftÿdirection
Plyÿ3 0
-10
-20 -20
Plyÿ12
Plyÿ9 -10
0
10
20
X-coordinate,ÿin. 10. Shifted reference tow paths for VS panel without overlaps.
15 American Institute of Aeronautics and Astronautics
-1 3 7
0
5
3 2
4
3 7
5
5
0
1
-1
5
7
7
12 14 16 18
12 14 16 18
12 14 16 18
7
1.5 -0.5 -1.5 0.5 3 7
1.5 -0.5 -1.5 0.5 3
5
7
5
9
9
9
12 14 16 18
12 14 16 18
12 14 16 18
16
11. Current and proposed VS panel ply shift schemes.
12
Z,ÿin.ÿ -0.299 -0.234 -0.169 -0.104 -0.039 0.026 0.091 0.156 0.221 0.286 0.351
Y-coordinate,ÿin.
6
0
-6
-12 -12
-6
0 X-coordinate,ÿin.
1
5 9
5
0
3 9
3
12 18
6
-1
3
1.5 -0.5 -1.5 0.5
9 14
7
1
9
Currentÿplyÿshiftÿscheme 1
0
6
12
12. Measured front surface geometric imperfections for cured VS panel with overlaps
16 American Institute of Aeronautics and Astronautics
12
t,ÿin. 0.147 0.160 0.174 0.187 0.201 0.215 0.228 0.242 0.255 0.269 0.282
Y-coordinate,ÿin.
6
0
-6
-12 -12
-6
0 X-coordinate,ÿin.
6
12
13. Measured thicknesses for VS panel with overlaps.
0
Fiberÿorientationÿangle,ÿdeg.
-30
-40
Actualÿangle
-50
Exactÿangle
-60 -20
-10
0
10
20
Y-coordinate,ÿin. 14. Comparison of exact and actual fiber orientation angles for reference tow path.
17 American Institute of Aeronautics and Astronautics
(Exactÿ-ÿactual)ÿfiber orientationÿangle,ÿdeg.
2
1
0
-1
-2 -20
-10
0
10
20
Y-coordinate,ÿin. 15. Differences between exact and actual fiber orientation angles for reference tow path.
Thermocoupleÿpatternÿ forÿallÿpanels
Strainÿgageÿpatternÿfor VSÿpanelÿwithÿoverlaps
X
Frontÿofÿpanelsÿshown Allÿpatternsÿrepeatÿon backÿofÿpanels
Thermocouples Y
Strainÿgageÿpatternÿ forÿVSÿpanelÿ withoutÿoverlaps 16. Instrumentation layout for VS and baseline panels.
18 American Institute of Aeronautics and Astronautics
Biaxialÿstrainÿgages Axialÿstrainÿgages
Strainÿgageÿpatternÿ forÿbaselineÿpanel
Temperature,ÿdeg.ÿF
150
125
Averageÿofÿ5ÿcontrol thermocouplesÿshown
100
75 0
500
1000
1500
2000
2500
3000
Time,ÿsec.
17. Representative heating profile.
18. Shadow moirŽ photo of VS panel without overlaps.
19 American Institute of Aeronautics and Astronautics
3500
500
Strain,ÿmicrostrain
400
Rosetteÿlocation
2
300 1 200 Gageÿlocation andÿorientation 1ÿ-ÿAxialÿfront 2ÿ-ÿAxialÿback 3ÿ-ÿTransverseÿfront 4ÿ-ÿTransverseÿback
3
100 0
4
-100 -200 75
100
125
150
175
Temperature,ÿdeg.ÿF 19. Strain vs. temperature for VS panel with overlaps.
500 Rosetteÿlocation
Strain,ÿmicrostrain
400 300
1
200 2 Gageÿlocation andÿorientation 1ÿ-ÿAxialÿfront 2ÿ-ÿAxialÿback 3ÿ-ÿTransverseÿfront 4ÿ-ÿTransverseÿback
100 4 0 -100 -200 75
3
100
125
150
Temperature,ÿdeg.ÿF 20. Strain vs. temperature for VS panel without overlaps.
20 American Institute of Aeronautics and Astronautics
175
500 Rosetteÿlocation
Strain,ÿmicrostrain
400 300 200 1,ÿ4
100
Gageÿlocation andÿorientation 1ÿ-ÿAxialÿfront 2ÿ-ÿAxialÿback 3ÿ-ÿTransverseÿfront 4ÿ-ÿTransverseÿback
2,ÿ3 0 -100 -200 75
100
125
150
175
Temperature,ÿdeg.ÿF 21. Strain vs. temperature for baseline panel.
a,ÿ10-6ÿin./in./deg.ÿF
8 6
[±45/(±Q)4]sÿlaminate CLTÿaxial CLTÿtransverse Testÿaxial Testÿtransverse Testÿ[±45]5s
4 2 0 -2 30
35
40
45
50
55
60
Q,ÿdeg. 22. Comparison of measured and predicted laminate CTEÕs.
21 American Institute of Aeronautics and Astronautics