applied sciences Article
Thin-Walled CFST Columns for Enhancing Seismic Collapse Performance of High-Rise Steel Frames Yongtao Bai 1 , Jiantao Wang 1 , Yashuang Liu 2 and Xuchuan Lin 3, * 1 2 3
*
Department of Civil Engineering, Xi’an Jiaotong University, Xi’an 710049, China;
[email protected] (Y.B.);
[email protected] (J.W.) School of Architectural Engineering, Beijing University of Technology, Beijing 100124, China;
[email protected] Institute of Engineering Mechanics, China Earthquake Administration, Harbin 150080, China Correspondence:
[email protected]; Tel.: +86-182-0123-7617
Academic Editor: Zhong Tao Received: 30 November 2016; Accepted: 24 December 2016; Published: 5 January 2017
Abstract: This paper numerically studied the collapse capacity of high-rise steel moment-resisting frames (SMRFs) using various width-to-thickness members subjected to successive earthquakes. It was found that the long-period component of earthquakes obviously correlates with the first-mode period of high-rises controlled by the total number of stories. A higher building tends to produce more significant component deterioration to enlarge the maximum story drift angle at lower stories. The width-to-thickness ratio of beam and column components overtly affects the collapse capacity when the plastic deformation extensively develops. The ratio of residual to maximum story drift angle is significantly sensitive to the collapse capacity of various building models. A thin-walled concrete filled steel tubular (CFST) column is proposed as one efficient alternative to enhance the overall stiffness and deformation capacity of the high-rise SMRFs with fragile collapse performance. With the equivalent flexural stiffness, CFST-MRF buildings with thin-walled members demonstrate higher capacity to avoid collapse, and the greater collapse margin indicates that CFST-MRFs are a reasonable system for high-rises in seismic prone regions. Keywords: thin-walled structures; concrete filled steel tubes; high-rise buildings; seismic performance; dynamic collapse; local buckling
1. Introduction The 2011 Great East Japan earthquake had devastating losses on human life, buildings and infrastructures near the seismic epicenter, and long-period ground motions excited resonance with high-rise buildings [1]. Extensive high-rise steel buildings were constructed during the period 1965~2000, especially in the period of construction-boom (i.e., 1980~1995) of high-rise buildings. CFST (concrete filled steel tubular) columns have been more adopted in high-rise buildings since 1992. There is a high probability that severe earthquakes with magnitude class over the design expectation might occur in the coming years [2]. Severe damage and collapse potentials exist in existing high-rise buildings. Several studies on the collapse behavior of steel frame were addressed. Symmetry limit theory for steel beam-columns originally revealed the steady-state path of cantilever members [3,4]. A symmetry limit theory has been extended to reveal the phenomenon of deformation concentration at lower stories in the process of dynamic instability for the weak-beam-type frames [5]. Seismic resistance capacity of high-rise buildings subjected to long-period ground motions was studied on the basis of E-Defense shaking table tests [6]. Sidesway collapse of deteriorating structural systems under seismic excitations was analytically and experimentally addressed [7]. However, the strength deterioration such as local Appl. Sci. 2017, 7, 53; doi:10.3390/app7010053
www.mdpi.com/journal/applsci
Appl. Sci. 2017, 7, 53 Appl. Sci. 2017, 7, 53
2 of 13 2 of 13
deterioration such as local buckling has not been fully investigated in the evaluation of seismic‐ resistant capacity of high‐rise steel buildings with thin‐walled sectional members. buckling has not been fully investigated in the evaluation of seismic-resistant capacity of high-rise The behavior of CFST columns and structural systems has been investigated. Tao et al. steel buildings with thin-walled sectional members. experimentally investigated the behavior of CFST stub columns, and beam columns under various The behavior of CFST columns and structural systems has been investigated. Tao et al. experimentally loading protocols have also been investigated [8–15]. They found that CFST demonstrated ductile investigated the behavior of CFST stub columns, and beam columns under various loading protocols behavior for the applications in seismic resistant structures. A fiber element model that is able to have also been investigated [8–15]. They found that CFST demonstrated ductile behavior for the predict the ultimate response of CFST members was also presented and agreed well with the applications in seismic resistant structures. A fiber element model that is able to predict the ultimate experimental results. Kawano and Sakino (2003) investigated the seismic resistance of CFST trusses response of CFST members was also presented and agreed well with the experimental results. Kawano [16,17]. Kawakami et al. (2004) studied a method to improve the distribution of story drift angle and Sakino (2003) investigated the seismic resistance of CFST trusses [16,17]. Kawakami et al. (2004) responses in CFST moment‐resistant frames under severe earthquakes [18]. Nakahara et al. (2008) studied a method to improve the distribution of story drift angle responses in CFST moment-resistant conducted a research on the bond behavior of concrete filled steel tubular frames under cyclic frames under severe earthquakes [18]. Nakahara et al. (2008) conducted a research on the bond horizontal load [19]. Han et al. (2009) experimentally studied the seismic behavior of concrete‐filled behavior of concrete filled steel tubular frames under cyclic horizontal load [19]. Han et al. (2009) steel tubular frame to reinforced concrete (RC) shear wall high‐rise mixed structures [20]. Nenavit experimentally studied the seismic behavior of concrete-filled steel tubular frame to reinforced and Hajjar (2012) conducted a nonlinear seismic analysis of circular concrete‐filled steel tube concrete (RC) shear wall high-rise mixed structures [20]. Nenavit and Hajjar (2012) conducted a members and frames [21]. Nevertheless, the research on deterioration behavior and collapse‐resistant nonlinear seismic analysis of circular concrete-filled steel tube members and frames [21]. Nevertheless, capacity of high‐rise CFST buildings, especially considering the effect of member deterioration, is still the research on deterioration behavior and collapse-resistant capacity of high-rise CFST buildings, limited. Since the existing high‐rise steel moment‐resisting frames (SMRFs) entail collapse potential especially considering the effect of member deterioration, is still limited. Since the existing high-rise when subjected to long‐period ground motions, CFST columns are proposed to substitute the hollow steel moment-resisting frames (SMRFs) entail collapse potential when subjected to long-period ground steel section (HSS) columns because the composite action can delay the local buckling and improve motions, CFST columns are proposed to substitute the hollow steel section (HSS) columns because the the strength of in‐filled concrete. composite action can delay the local buckling and improve the strength of in-filled concrete. In this paper, the seismic performance of existing high‐rise SMRFs with compact and thin‐walled In this paper, the seismic performance of existing high-rise SMRFs with compact and thin-walled members subjected to over‐design long‐period ground motions is numerically studied. The effect of members subjected to over-design long-period ground motions is numerically studied. The effect of component deterioration is taken into account to investigate the collapse capacity. Then, thin‐walled component deterioration is taken into account to investigate the collapse capacity. Then, thin-walled CFST columns are used to replace the HSS columns in high‐rise SMRFs based on flexural stiffness, in CFST columns are used to replace the HSS columns in high-rise SMRFs based on flexural stiffness, order to enhance the collapse margin of the high‐rise SMRFs that demonstrated fragile collapse in order to enhance the collapse margin of the high-rise SMRFs that demonstrated fragile capacity. collapse capacity. 2. Modeling and Analysis Methods 2. Modeling and Analysis Methods 2.1. Simplified Fiber Element Models 2.1. Simplified Fiber Element Models A fiber fiber element element program developed is utilized to conduct the elasto‐plastic A program thatthat has has beenbeen developed is utilized to conduct the elasto-plastic analysis analysis of structures under various loading procedures The stiffness of cross sections is of structures under various loading procedures [16,22]. The[16,22]. stiffness of cross sections is numerically numerically integrated by dividing the section into a number of parallel layers referred to as stress integrated by dividing the section into a number of parallel layers referred to as stress fibers. Accurate fibers. Accurate nonlinear stress–strain models are applied to these fibers to define the mechanical nonlinear stress–strain models are applied to these fibers to define the mechanical behavior of each behavior The of each member. The law of for fiber discretization for hollow H‐shaped steel and hollow section member. law of fiber discretization H-shaped steel and section members is shown in members is shown in Figure 1. Figure 1. t D
tw tf
Discretization of stress fiber Assumed plastic region
H D
B
Figure 1. Fiber element discretization and plastic region. Figure 1. Fiber element discretization and plastic region.
On the longitudinal definition of elements, the plastic length at both ends of each element On the longitudinal definition of elements, the plastic length at both ends of each element depends depends on the thickness and outer size of the steel tubes. In this study, the plastic length is on the thickness and outer size of the steel tubes. In this study, the plastic length is determined as determined as a constant value, but the stress–strain models are consistent with the assumption of a constant value, but the stress–strain models are consistent with the assumption of the constant the constant plastic length of the member depth D, as shown in Figure 1. In the frame analysis
Appl. Sci. 2017, 7, 53
3 of 13
Appl. Sci. 2017, 7, 53
3 of 13
plastic length of the member depth D, as shown in Figure 1. In the frame analysis program, the geometric hasnonlinearity been rigorously by adopting the moving coordinatethe system for program, nonlinearity the geometric has formulated been rigorously formulated by adopting moving each element. Therefore, the program can trace the nonlinear behavior up to collapse phenomenon. coordinate system for each element. Therefore, the program can trace the nonlinear behavior up to For dynamic analysis, the time history response of high-rise building models is calculated 3 of 13 by the collapse phenomenon. For dynamic analysis, the time history response of high‐rise building models Appl. Sci. 2017, 7, 53 average acceleration method (β = 1/4), based on the Newmark’s method. The convergence is is calculated by the average acceleration method (β = 1/4), based on the Newmark’s method. The program, the geometric nonlinearity has been rigorously formulated by adopting the moving guaranteed based on Newton–Raphson method. convergence is guaranteed based on Newton–Raphson method. coordinate system for each element. Therefore, the program can trace the nonlinear behavior up to The patterns The patterns of of local local buckling buckling of of HSS HSS and and CFST CFST members members are are obviously obviously different different due due to to the the collapse phenomenon. For dynamic analysis, the time history response of high‐rise building models confined byby in-filled concrete. For unfilled rectangular or squareor CFSTs under axial compression, confined effect effect in‐filled concrete. For unfilled rectangular square CFSTs under axial is calculated by the average acceleration method (β = 1/4), based on the Newmark’s method. The the inward buckling is effectively prevented. Thus, the local buckling pattern of steel tubes influences compression, the inward buckling is effectively prevented. Thus, the local buckling pattern of steel convergence is guaranteed based on Newton–Raphson method. strength deterioration with internal restraint from the in-filled concrete. tubes influences strength deterioration with internal restraint from the in‐filled concrete. The patterns of local buckling of HSS and CFST members are obviously different due to the Figure 2 shows theby stress–strain relation For for steel material with and deterioration Figure 2 shows the stress–strain relation for steel material with and without deterioration effects. confined effect in‐filled concrete. unfilled rectangular or without square CFSTs under effects. axial The strength deterioration and and the corresponding negative slope inslope compressive direction The post-buckling post‐buckling strength deterioration the corresponding negative in compressive compression, the inward buckling is effectively prevented. Thus, the local buckling pattern of steel tubes influences strength deterioration with internal restraint from the in‐filled concrete. enlarges the ratio ofthe residual toresidual maximum The strain. stress–strain models for confined concrete in direction enlarges ratio of to strain. maximum The stress–strain models for confined Figure 2 shows the stress–strain relation for steel material with and without deterioration effects. CFST columns are shown in Figure 3. The post-crushing strength degradation reduces the unloading concrete in CFST columns are shown in Figure 3. The post‐crushing strength degradation reduces the The post‐buckling strength and the negative slope that in compressive stiffness if the ratio of residual to deterioration maximum strain is acorresponding constant value [23]. Note the splitting unloading stiffness if the ratio of residual to maximum strain is a constant value [23]. Note that the direction enlarges the ratio of residual to maximum strain. The stress–strain models for confined crack of the confined concrete in CFST columns occurs when the associated tubular face is subjected to splitting crack of the confined concrete in CFST columns occurs when the associated tubular face is concrete in CFST columns are shown in Figure 3. The post‐crushing strength degradation reduces the tensile force. In this loading condition, the CFST columns enable the support of plastic deformation subjected to tensile force. In this loading condition, the CFST columns enable the support of plastic unloading stiffness if the ratio of residual to maximum strain is a constant value [23]. Note that the without the local buckling in steel tubes. In addition, the tensile strength of the confined concrete is deformation without the local buckling in steel tubes. In addition, the tensile strength of the confined splitting crack of the confined concrete in CFST columns occurs when the associated tubular face is much less theless yielding of steel tubes. of Thus, the splitting crack be neglected in the concrete is than much than strength the yielding strength steel tubes. Thus, the can splitting crack can be subjected to tensile force. In this loading condition, the CFST columns enable the support of plastic stress–strain relation of the concrete model [24]. neglected in the stress–strain relation of the concrete model [24]. deformation without the local buckling in steel tubes. In addition, the tensile strength of the confined concrete is much less than the yielding strength of steel tubes. Thus, the splitting crack can be neglected in the stress–strain relation of the concrete model [24].
(a)
(b)
(a) (b) Figure 2.2. Stress–strain relation of thin‐walled steel sections. (a) Model with post‐buckling Figure Stress–strain relation of thin-walled steel sections. (a) Model with post-buckling deterioration; Figure 2. Stress–strain relation of thin‐walled steel sections. (a) Model with post‐buckling deterioration; (b) Model without post‐buckling deterioration. (b) Model without post-buckling deterioration. deterioration; (b) Model without post‐buckling deterioration.
(a)
(a)
(b)
(b)
Figure 3. Stress–strain relation of confined concrete. (a) Model with post‐crushing deterioration;
Figure Stress–strain (a) Model Model with Figure 3. 3. Stress–strain relation relation of of confined confined concrete. concrete. (a) with post-crushing post‐crushing deterioration; deterioration; (b) Model without post‐crushing deterioration. (b) Model without post-crushing deterioration. (b) Model without post‐crushing deterioration. In the numerical simulations of steel and CFST structures using the fiber element method, it is assumed that the cross section remains plane, and the strain distribution keeps linear along with the In the numerical simulations of steel and CFST structures using the fiber element method, it is In the numerical simulations of steel and CFST structures using the fiber element method, it is depth of the cross section. The stress should be located at the centroid of each parallel fiber element, assumed that the cross section remains plane, and the strain distribution keeps linear along with the assumed that the cross section remains plane, and the strain distribution keeps linear along with the and vertical discretization is neglected for torsion or bi‐axial bending. Besides, the effects of creep depth of the cross section. The stress should be located at the centroid of each parallel fiber element, and shrinkage of concrete were not in the scope of this paper. The confinement effect and slipping of
and vertical discretization is neglected for torsion or bi‐axial bending. Besides, the effects of creep and shrinkage of concrete were not in the scope of this paper. The confinement effect and slipping of
Appl. Sci. 2017, 7, 53
4 of 13
depth of the cross section. The stress should be located at the centroid of each parallel fiber element, and vertical discretization is neglected for torsion or bi-axial bending. Besides, the effects of creep and shrinkage of concrete were not in the scope of this paper. The confinement effect and slipping of concrete on the strength and deterioration are taken into account in the normalized stress–strain relationship of the confined concrete. Post local-buckling strength and stiffness deterioration of steel tubular walls is taken into account in the constitutive relationship of steel plate elements. 2.2. Thin-Walled Steel Columns The width-to-thickness ratio, λ, has been classified to control the occurrence of local buckling of flexural H-shaped steel members [25]. The λ of H-shaped steel beams is classified as a compact cross p section (FA represents a compact cross section) when λ is equal to or less than 9 235/Fy, and the non-compact cross section (FB represents a non-compact cross section) when λ is equal to or less than p 11 235/Fy for flanges, where Fy is the nominal yield strength of steel materials. For square hollow steel sectional columns, the critical values of the compact and non-compact cross sections are given as p p 33 235/Fy and 37 235/Fy. Note that the above λ are classified on the basis of the various types of steel materials. Both of the above advantages contribute to the ductile behavior of the CFST column due to the delay of local-buckling and the confined effect on the in-filled concrete. The compact and thin-walled CFST columns are employed in high-rise CFST building models in order to be analogous to the steel moment-resisting frame (SMRF) building models with various sectional compactness. According to the Recommendations for the Design and Construction of Concrete Filled Steel Tubular Structures [26]—different from the ranks of the width–thickness ratio (FA, FB) on HSS members by the Building Standards Act of Japan [25]—the ranks of the width–thickness ratio (B/t) of CFST members is required differently, such as Ru ≥ 0.02 for the compact FA section; and Ru ≥ 0.02 for the thin-walled FB section. Rectangular CFST members can be Ru calculated as Ru =
γr t · · Rα 0.15 + 3.79 NN0 B
(1)
where B is the width of the rectangular steel tube, t is the thickness of the steel tube, Fc is the nominal design strength of the concrete, N is axial loading, N0 is the yield strength of the CFST columns which is approximately equal to As ·fy + Ac ·fc , γr is a coefficient defined by the buckling length lk of the CFST members, (if lk /D ≤ 10, γr = 1.0, if lk /D > 10, γr = 0.8), and R α is defined as follows: Rα
= 1.0 −
Fc − 40.3 , if R α ≥ 1, R α = 1 566
(2)
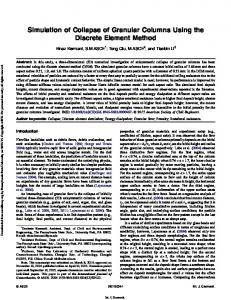
3. Seismic Performance of the Thin-Walled SMRFs 3.1. Building Models Extensive high-rise steel buildings have been constructed since 1965, especially during the construction-boom period of high-rises in the 1980s. CFST columns were initially employed in high-rise steel buildings in Japan [2]. Figure 4 shows a tendency of the various structural systems for high-rises based on 300 building cases higher than 100 meters constructed from 1966 to 1998 in Japan. The CFST system shows a stably ascending tendency since 1981. In addition, the HSS columns in the high-rise buildings higher than 80 meters usually filled with concrete but this was not accounted as CFST buildings. Thus, the realistic number of existing high-rise CFST buildings should be higher than what is presented in the statistical database as provided in Figure 4. Generic existing high-rise steel moment-resisting frames with 20, 30 and 40 story levels are selected as the prototypes, as shown in Figure 5. The damping factor of the building models is simply assumed as an identical value of 2% in order to eliminate the influence of the varying damping factors on the seismic responses of structures. The slab composite action for beam components, the P-∆ effect
80 Existing high-rise buildings (h>100m) S RC SRC CFT
Case number
60
Appl. Sci. 2017, 7, 53
40
5 of 13
20
and strong-column weak-beam are considered in the structural design. The high-rise building models are seismically designed according to current Japanese seismic design standards [27]. The design 0 base shear coefficient is obtained based on the standard shear coefficient of the seismic demand of buildings, the seismic intensity of areas, and the types of ground soils. According to the statistical database on high-rises of steel and CFST buildings, steel materials 76 66 71 81 86 91 of96SM490 and SN490 are the most -80 -70 -75 -85 -90 -95 frequently used in existing steel office buildings, therefore the steel -00 material SM490 and SN490 with Construction decades the nominal yield strength of σy = 320 MPa and the ultimate tensile strength of σu = 490 MPa are used in the modellingFigure 4. Statistical databases of various existent high‐rise buildings. of high-rise building models in this paper. Besides, the concrete with the compressive strength of 60 MPa is used in the composite slabs and CFST columns. Design procedures include, the allowable stress method and time-history dynamic analyses subjected moderate earthquakes Generic existing high‐rise steel moment‐resisting frames with to20, 30 and rare 40 story levels are controlled by peak ground velocity (PGV). The input ground motions for the dynamic design include selected as the prototypes, as shown in Figure 5. The damping factor of the building models is simply Art-Hachi as a synthetic wave, El-Centro-NS, Hachinohe-NS and Tafe-EW as observed waves. Besides, assumed as an identical value of 2% in order to eliminate the influence of the varying damping factors CHB009-NS and C-San-EW waves are long-period ground motions with the intensity of a maximum on the seismic responses of structures. The slab composite action for beam components, the P‐Δ effect capacity earthquake (Level 2). Appl. Sci. 2017, 7, 53 5 of 13
Case number
and strong‐column weak‐beam are considered in the structural design. The high‐rise building models are seismically designed according to current Japanese seismic design standards [27]. The design base 80 Existing high-rise buildings (h>100m) shear coefficient is obtained based on the standard shear coefficient of the seismic demand of S 60 buildings, the seismic intensity of areas, and the types of ground soils. According to the statistical RC SRC database on high‐rises of steel and CFST buildings, steel materials of SM490 and SN490 are the most CFT 40 frequently used in existing steel office buildings, therefore the steel material SM490 and SN490 with the nominal yield strength of σy = 320 MPa and the ultimate tensile strength of σu = 490 MPa are used 20 in the modelling of high‐rise building models in this paper. Besides, the concrete with the compressive strength of 60 MPa is used in the composite slabs and CFST columns. Design procedures 0 include, the allowable stress method and time‐history dynamic analyses subjected to moderate rare earthquakes controlled by peak ground velocity (PGV). The input ground motions for the dynamic 76 66 71 81 86 91 96 -80 -70 -75 wave, -85 -90 -95 -00 Hachinohe‐NS and Tafe‐EW as design include Art‐Hachi as a synthetic El‐Centro‐NS, Construction decades observed waves. Besides, CHB009‐NS and C‐San‐EW waves are long‐period ground motions with Figure 4. Statistical databases of various existent high‐rise buildings. Figure 4. Statistical databases of various existent high-rise buildings. the intensity of a maximum capacity earthquake (Level 2).
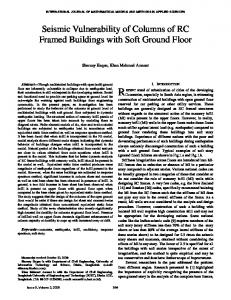
5.0m+19 @ 4.0m=81m 5.0m+29 @ 4.0m=121m 5.0m+39 @ 4.0m=161m
w
H
Generic existing high‐rise steel moment‐resisting frames with 20, 30 and 40 story levels are selected as the prototypes, as shown in Figure 5. The damping factor of the building models is simply assumed as an identical value of 2% in order to eliminate the influence of the varying damping factors t t on the seismic responses of structures. The slab composite action for beam components, the P‐Δ effect t and strong‐column weak‐beam are considered in the structural design. The high‐rise building models steel tubular B B are seismically designed according to current Japanese seismic design standards [27]. The design base column Cross section of members shear coefficient is obtained based on the standard shear coefficient of the seismic demand of H-shaped steel B B beam buildings, the seismic intensity of areas, and the types of ground soils. According to the statistical assumed database on high‐rises of steel and CFST buildings, steel materials of SM490 and SN490 are the most plastic hinge zone selected part frequently used in existing steel office buildings, therefore the steel material SM490 and SN490 with for planar model the nominal yield strength of σy = 320 MPa and the ultimate tensile strength of σ u = 490 MPa are used 4 bays @ 8.0m in the modelling of high‐rise building models in this paper. Besides, the concrete with the Element discretization Plan view Elevation view compressive strength of 60 MPa is used in the composite slabs and CFST columns. Design procedures Figure 5. Members, element discretization, plan and elevation view of high‐rise SMRF (steel include, the allowable stress method and time‐history dynamic analyses subjected to moderate rare Figure 5. Members, element discretization, plan and elevation view of high-rise SMRF (steel earthquakes controlled by peak ground velocity (PGV). The input ground motions for the dynamic moment‐resisting frame) models. moment-resisting frame) models. design include Art‐Hachi as a synthetic wave, El‐Centro‐NS, Hachinohe‐NS and Tafe‐EW as observed waves. Besides, CHB009‐NS and C‐San‐EW waves are long‐period ground motions with 3.2. Model Validation 3.2. Model Validation the intensity of a maximum capacity earthquake (Level 2). The numerical model is validated by simulating a static cyclic test on a planar CFST frame The numerical model is validated by simulating a static cyclic test on a planar CFST frame with with threeunder storiescyclic underloading cyclic loading [23,28]. The frame specimen constructed squareCFST three stories [23,28]. The frame specimen was was constructed by by square CFST columns and H-shaped steel beams. The cross section of the CFST columns is uniformly columns and H‐shaped steel beams. The cross section of the CFST columns is uniformly fabricated fabricated as 150 × 150 × 4.5 using the steel material STKR400 with σy = 409 MPa and σu = 477 MPa. B
4 bays @ 8.0m
f
tf
B
steel tubular column
B B
B
B
assumed plastic hinge zone
bays @ 8.0m
Cross section of members
H-shaped steel beam
5.0m+19 @ 4.0m=81m 5.0m+29 @ 4.0m=121m 5.0m+39 @ 4.0m=161m
w
H
t t as 150 × 150 × 4.5 using the steel material STKR400 with σ y = 409 MPa and σu = 477 MPa. The BH‐200
Appl. Sci. 2017, 7, 53
6 of 13
Appl. Sci. 2017, 7, 53
6 of 13
2 The BH-200 × 100 × 6 × 6 H-shaped steel using the steel material SS4002 with σy = 337 N/mm × 100 × 6 × 6 H‐shaped steel using the steel material SS400 with σ y = 337 N/mm and σu = 444 N/mm2, 2 6 of 13 and σAppl. Sci. 2017, 7, 53 infilled u = 444 N/mm , is adopted as the beam components. The compressive strength of the is adopted as the beam components. The compressive strength of the infilled concrete in CFST concrete in CFST columns is 31.3 MPa based on four concrete cylinder test results. Horizontal cyclic columns is 31.3 MPa based on four concrete cylinder test results. Horizontal cyclic loading is applied × 100 × 6 × 6 H‐shaped steel using the steel material SS400 with σy = 337 N/mm2 and σu = 444 N/mm2, loading is applied on the top of the frame specimen, and constant axial loads with the axial load ratio on the top of the frame specimen, and constant axial loads with the axial load ratio N = 0.2∙ cNu × 2 are is adopted as the beam components. The compressive strength of the infilled concrete in CFST N = 0.2 · N × 2 are applied on two CFST columns simultaneously. Figure 6 shows the elevation view c u applied on two CFST columns simultaneously. Figure 6 shows the elevation view of the CFST frame columns is 31.3 MPa based on four concrete cylinder test results. Horizontal cyclic loading is applied of themodel. CFST frame model. on the top of the frame specimen, and constant axial loads with the axial load ratio N = 0.2∙cNu × 2 are
applied on two CFST columns simultaneously. Figure 6 shows the elevation view of the CFST frame 3000 model.
Height (mm) Height (mm)
3000 2000
2000 1000
0
1000 0 400
800
1200 1600 2000 2400
Span (mm)
0 Figure 6. Modelling of the CFST (concrete filled steel tubular) frame specimen.
400 (concrete 800 1200 filled 1600 2000 Figure 6. Modelling of the0 CFST steel2400 tubular) frame specimen.
Span (mm)
Comparisons of hysteretic load (H) versus roof drift ratio (R) curve between experimental and Figure 6. Modelling of the CFST (concrete filled steel tubular) frame specimen. Comparisons of hysteretic load (H) versus roof drift ratio (R) curve between experimental and analytical results are presented in Figure 7. The hysteretic curve before R ≤ 2% shows slight plastic deformation while the strength degradation was not induced by local buckling. Furthermore, local analytical results are presented in Figure 7. The hysteretic curve before R ≤ 2% shows slight plastic Comparisons of hysteretic load (H) versus roof drift ratio (R) curve between experimental and buckling was triggered, associated with post‐peak strength deterioration which was incorporated in deformation while the strength degradation was not induced by local buckling. Furthermore, local analytical results are presented in Figure 7. The hysteretic curve before R ≤ 2% shows slight plastic the numerical modeling. More than 85% of the maximum strength is maintained; even the roof drift buckling was triggered, associated with post-peak strength deterioration which was incorporated in the deformation while the strength degradation was not induced by local buckling. Furthermore, local ratio R reaches 5%. Through simulating this cyclic test of the CFST frame, the numerical modeling buckling was triggered, associated with post‐peak strength deterioration which was incorporated in numerical modeling. More than 85% of the maximum strength is maintained; even the roof drift ratio approach is promising to accurately predict the seismic behavior of CFST frames, including the the numerical modeling. More than 85% of the maximum strength is maintained; even the roof drift R reaches 5%. Through simulating this cyclic test of the CFST frame, the numerical modeling approach elasto‐plasticity, damages and strength deterioration. The seismic performance of CFST frame ratio R reaches 5%. Through simulating this cyclic test of the CFST frame, the numerical modeling is promising to accurately predict the seismic behavior of CFST frames, including the elasto-plasticity, structures would be overestimated if the deterioration effects of steel tube and confined concrete were approach is promising to accurately predict the seismic behavior of CFST frames, including the damages and strength deterioration. The seismic performance of CFST frame structures would be neglected. Hence, deterioration effects should be appropriately considered in simulating the seismic elasto‐plasticity, damages and strength deterioration. The seismic performance of CFST frame overestimated if the deterioration effects of steel tube and confined concrete were neglected. Hence, performance of high‐rise steel and CFST buildings. structures would be overestimated if the deterioration effects of steel tube and confined concrete were
deterioration effects should be appropriately considered in simulating the seismic performance of neglected. Hence, deterioration effects should be appropriately considered in simulating the seismic 400 400 high-rise steel and CFST buildings. performance of high‐rise steel and CFST buildings. Deterioration Deterioration Experiment
Experiment
400 200
Deterioration Experiment
H (kN) H (kN)
H (kN) H (kN)
400 200
200 0
-400 -6
200 0
-2000
-2000
-200 -400 -6
Deterioration Experiment
-3
-3
0
R (%)
(a)
0
3
3
6
-200 -400 -6
6
-400 -6
-3
-3
0
R (%)
(b)
0
3
6
3
6
R (%) (a) Hysteretic curve R (%)simulation results and experimental results. Figure 7. Comparisons between (a) (b) when R ≤ 2%; (b) Hysteretic curve when R = 5. Figure 7. Comparisons between simulation results and experimental results. (a) Hysteretic curve
3.3. Dynamic Analysis Figure 7. Comparisons between simulation results and experimental results. (a) Hysteretic curve when when R ≤ 2%; (b) Hysteretic curve when R = 5. R ≤ 2%; (b) Hysteretic curve when R = 5. Time‐history dynamic analysis on high‐rise SMRFs under the Level 2 earthquakes is conducted 3.3. Dynamic Analysis to compare the seismic responses of the building using compact and thin‐walled members. The
3.3. Dynamic Analysis ground motions C‐San‐EW is a long‐period ground motion synthesized based on the characteristics
Time‐history dynamic analysis on high‐rise SMRFs under the Level 2 earthquakes is conducted
to compare the seismic analysis responses the building using compact and thin‐walled members. The to Time-history dynamic onof high-rise SMRFs under the Level 2 earthquakes is conducted ground motions C‐San‐EW is a long‐period ground motion synthesized based on the characteristics compare the seismic responses of the building using compact and thin-walled members. The ground
Appl. Sci. 2017, 7, 53
7 of 13
motions C-San-EW is a long-period ground motion synthesized based on the characteristics of basin Appl. Sci. 2017, 7, 53 7 of 13 Appl. Sci. 2017, 7, 53 7 of 13 areas near the Pacific Ocean, and CHB009-NS was observed in the Great East Japan earthquake, 2011. of basin areas near the Pacific Ocean, and CHB009‐NS was observed in the Great East Japan Maximum story drift angle θmax,i of the ith-story can be calculated by the horizontal drift of the of basin areas near the Pacific Ocean, and CHB009‐NS was observed in the Great East Japan earthquake, 2011. Maximum story drift angle θ max,i of the ith‐story can be calculated by the horizontal ith-story divided by the story height. Figures 8 and 9 show the distributions of the θmax,i for the SMRFs earthquake, 2011. Maximum story drift angle θ max,i of the ith‐story can be calculated by the horizontal drift of the ith‐story divided by the story height. Figures 8 and 9 show the distributions of the θ max,i with various overall story levels. drift of the ith‐story divided by the story height. Figures 8 and 9 show the distributions of the θ max,i for the SMRFs with various overall story levels. The seismic demand of Level 2 (θmax ≤ 0.01) was satisfied when subjected to Art-Hachi, for the SMRFs with various overall story levels. was satisfied when subjected to Art‐Hachi, El‐ The seismic demand of Level 2 (θmax ≤ 0.01) El-Centro-NS, Hachinohe-NS and Tafe-EW waves, while the C-San-EW wave excited excessive story The seismic demand of Level 2 (θ max ≤ 0.01) was satisfied when subjected to Art‐Hachi, El‐ Centro‐NS, Hachinohe‐NS and Tafe‐EW waves, while the C‐San‐EW wave excited excessive story drifts on the 20S and 30S models. This means that the high-rise SMRFs fulfill the same seismic demand Centro‐NS, Hachinohe‐NS and Tafe‐EW waves, while the C‐San‐EW wave excited excessive story drifts on the 20S and 30S models. This means that the high‐rise SMRFs fulfill the same seismic at drifts designon level regardless of the width-to-thickness ratios members. The long-period component the design 20S and 30S models. This means that the of high‐rise SMRFs fulfill the same seismic of demand at level regardless of the width‐to‐thickness ratios of members. The long‐period earthquake waves obviously correlates with the first-mode period of high-rises which is controlled demand at design level regardless of the width‐to‐thickness ratios of members. The long‐period by component of earthquake waves obviously correlates with the first‐mode period of high‐rises which thecomponent of earthquake waves obviously correlates with the first‐mode period of high‐rises which total number of stories. For instance, the C-San-EW wave shows extremely large excitation on the is controlled by the total number of stories. For instance, the C‐San‐EW wave shows extremely large structures with ‘first-mode’ natural period T1 between 2 s and 4 s. In contrast, the maximum story is controlled by the total number of stories. For instance, the C‐San‐EW wave shows extremely large excitation on the structures with ‘first‐mode’ natural period T 1 between 2 s and 4 s. In contrast, the drift angle subjected to the observed CHB009-NS is relatively small; even the wave is characterized excitation on the structures with ‘first‐mode’ natural period T 1 between 2 s and 4 s. In contrast, the maximum story drift angle subjected to the observed CHB009‐NS is relatively small; even the wave maximum story drift angle subjected to the observed CHB009‐NS is relatively small; even the wave with the long-period component. is characterized with the long‐period component. is characterized with the long‐period component. 20S-FAc-FAb (with-deterioration)
15
Story level Story level
15 10 10
30
Art-Hachi El-Centro-NS Art-Hachi Hachinohe-NS El-Centro-NS Taft-EW Hachinohe-NS CHB009-NS Taft-EW C-San-EW CHB009-NS C-San-EW
30
30S-FAc-FAb (with-deterioration)
Level 2
20
10 10
5
0.005
max max
0.01 0.01
0 0 0 0
0.015 0.015
(a) (a)
0.005 0.005
max max
0.01
Art-Hachi El-Centro-NS Art-Hachi Hachinohe-NS El-Centro-NS Taft-EW Hachinohe-NS CHB009-NS Taft-EW C-San-EW CHB009-NS C-San-EW 0.015
0.01
40S-FAc-FAb (with-deterioration) 40S-FAc-FAb (with-deterioration)
35 30
20
5
0.005
40 35
Level 2
Level 2
0 0 0 0
40
30S-FAc-FAb (with-deterioration) Level 2
Story level Story level
20S-FAc-FAb (with-deterioration)
Story level Story level
20 20
Level 2 Level 2
30 25 25 20
Art-Hachi El-Centro-NS Art-Hachi Hachinohe-NS El-Centro-NS Taft-EW Hachinohe-NS CHB009-NS Taft-EW C-San-EW CHB009-NS
20 15 15 10 10 5 5 0 0 0 0
0.015
0.005 0.005
(b) (b)
max max
C-San-EW 0.01
0.015
0.01
0.015
(c) (c)
Figure 8. Maximum story drift angle of high‐rise SMRFs with compact members under Level 2 Figure 8. 8. Maximum of high‐rise high-rise SMRFs SMRFswith withcompact compactmembers members under Level Figure Maximum story story drift drift angle angle of under Level 2 2 earthquakes. (a) 20S model; (b) 30S model; (c) 40S model. earthquakes. (a) 20S model; (b) 30S model; (c) 40S model. earthquakes. (a) 20S model; (b) 30S model; (c) 40S model.
15
Story level Story level
15 10
20S-FBc-FBb (with-deterioration) Art-Hachi El-Centro-NS Art-Hachi Hachinohe-NS El-Centro-NS Taft-EW Hachinohe-NS CHB009-NS Taft-EW C-San-EW CHB009-NS C-San-EW
5
10 10
0 0
0.005
max max
(a) (a)
0.01 0.01
0.015 0.015
40S-FBc-FBb (with-deterioration) 40S-FBc-FBb (with-deterioration)
35 30
20
Level 2
0.005
40 35
20
Level 2
0 0 0 0
40
Level 2
10 5
30S-FBc-FBb (with-deterioration) Level 2
30
0
0
0.005 0.005
max max
(b)
(b)
0.01 0.01
Art-Hachi El-Centro-NS Art-Hachi Hachinohe-NS El-Centro-NS Taft-EW Hachinohe-NS CHB009-NS Taft-EW C-San-EW CHB009-NS C-San-EW 0.015 0.015
Story level Story level
20
30S-FBc-FBb (with-deterioration)
30
20S-FBc-FBb (with-deterioration)
Story level Story level
20
Level 2 Level 2
30 25 25 20 20 15 15 10 10 5 5 0 0 0 0
0.005 0.005
max max
Art-Hachi El-Centro-NS Art-Hachi Hachinohe-NS El-Centro-NS Taft-EW Hachinohe-NS CHB009-NS Taft-EW C-San-EW CHB009-NS C-San-EW 0.01 0.015 0.01
0.015
(c) (c)
Figure 9. Maximum story drift angle of high‐rise SMRFs with thin‐walled members under Level 2 Figure 9. Maximum story drift angle of high‐rise SMRFs with thin‐walled members under Level 2 earthquakes. (a) 20S model; (b) 30S model; (c) 40S model. Figure 9. Maximum story drift angle of high-rise SMRFs with thin-walled members under Level 2 earthquakes. (a) 20S model; (b) 30S model; (c) 40S model. earthquakes. (a) 20S model; (b) 30S model; (c) 40S model.
The collapse capacity of high‐rise SMRFs with thin‐walled FB members (20S‐FBc‐FBb, where the The collapse capacity of high‐rise SMRFs with thin‐walled FB members (20S‐FB ‐FBbincremental , where the subscripts c and b indicate column and beam components) is assessed based on cthe The collapse capacity of high-rise SMRFs with thin-walled FB members (20S-FB subscripts c and b indicate column and beam components) is assessed based on the incremental c -FBb , where dynamic analysis (IDA) method by excessively scaling the intensity of input ground motions. The the subscripts c and b indicate column and beam components) is assessed based on the incremental dynamic analysis (IDA) method by excessively scaling the intensity of input ground motions. The IDA approach was proposed on the basis of the analogy with the incremental static push‐over (SPO) IDA approach was proposed on the basis of the analogy with the incremental static push‐over (SPO) dynamic analysis (IDA) method by excessively scaling the intensity of input ground motions. The IDA analysis. IDA was developed by [29], and is widely used in collapse studies [30,31]. The IDA method analysis. IDA was developed by [29], and is widely used in collapse studies [30,31]. The IDA method approach was proposed on the basis of the analogy with the incremental static push-over (SPO) is capable of estimating the seismic performance of building structures covering the whole process is capable of estimating the seismic performance of building structures covering the whole process analysis. IDA was developed by [29], and is widely used in collapse studies [30,31]. The IDA method from elastic to ultimate global collapse eventually. Usually, the IDA approach requires a sufficient from elastic to ultimate global collapse eventually. Usually, the IDA approach requires a sufficient is capable of estimating the seismic performance of building structures covering the whole process amount of input ground motions to run time‐history analysis to eliminate the uncertainty from the amount of input ground motions to run time‐history analysis to eliminate the uncertainty from the variety of ground motions. In this study, since the high‐rise building systems highly relate to the variety of ground motions. In this study, since the high‐rise building systems highly relate to the
Appl. Sci. 2017, 7, 53
8 of 13
from elastic to ultimate global collapse eventually. Usually, the IDA approach requires a sufficient amount of input ground motions to run time-history analysis to eliminate the uncertainty from the Appl. Sci. 2017, 7, 53 8 of 13 Appl. Sci. 2017, 7, 53 8 of 13 variety of ground motions. In this study, since the high-rise building systems highly relate to the characteristics of long-period ground motions, the Art-Hachi with flat velocity spectral shape is used characteristics of long‐period ground motions, the Art‐Hachi with flat velocity spectral shape is used characteristics of long‐period ground motions, the Art‐Hachi with flat velocity spectral shape is used toto provide stable excitations in the wide range of the long‐period domain. provide stable excitations in the wide range of the long-period domain. to provide stable excitations in the wide range of the long‐period domain. Figure 10 shows the vertical distribution of the maximum story drift angle of thin-walled FB Figure 10 shows the vertical distribution of the maximum story drift angle of thin‐walled FB Figure 10 shows the vertical distribution of the maximum story drift angle of thin‐walled FB buildings with 20, 30 and 40 story levels. φ is the incremental factor of the Art-Hachi wave. Note buildings with 20, 30 and 40 story levels. φ is the incremental factor of the Art‐Hachi wave. Note that buildings with 20, 30 and 40 story levels. φ is the incremental factor of the Art‐Hachi wave. Note that that higher buildings produce more significant component deterioration to enlarge the maximum higher buildings produce more significant component deterioration to enlarge the maximum story higher buildings produce more significant component deterioration to enlarge the maximum story story drift angle. The deterioration effects triggered by the local buckling amplify the θmax at lower drift angle. The deterioration effects triggered by the local buckling amplify the θ max at lower stories drift angle. The deterioration effects triggered by the local buckling amplify the θ max at lower stories stories and reduce the θ at higher stories because the inflexion point changes the deflection pattern. max and reduce the θmax max at higher stories because the inflexion point changes the deflection pattern. For and reduce the θ at higher stories because the inflexion point changes the deflection pattern. For For instance, the inflexion point is located at the fifth floor for the 20S-FB c -FB b building when the φ instance, the inflexion point is located at the fifth floor for the 20S‐FB c‐FB b building when the φ is instance, the inflexion point is located at the fifth floor for the 20S‐FB c‐FBb building when the φ is isscaled to 3. Thus, the width‐to‐thickness ratio (FB rank) of beam and column components overtly has scaled to 3. Thus, the width-to-thickness ratio (FB rank) of beam and column components overtly scaled to 3. Thus, the width‐to‐thickness ratio (FB rank) of beam and column components overtly has has effects on the seismic responses when the plastic deformation extensively develops. In particular, effects on the seismic responses when the plastic deformation extensively develops. In particular, the effects on the seismic responses when the plastic deformation extensively develops. In particular, the the collapse capacity of the 40S-FB c -FB collapse capacity of the 40S‐FB c‐FB b model is captured at the Art‐Hachi (φ = 2, 3). b model is captured at the Art-Hachi (φ = 2, 3). collapse capacity of the 40S‐FBc‐FBb model is captured at the Art‐Hachi (φ = 2, 3).
10 10
30S-FA -FB , Art-Hachi c-FBb, Art-Hachi 30S-FAwith deterioration c b with deterioration non deterioration non deterioration
20 20
Story level Story level
15 15
Story level Story level
30 30
20S-FB -FB , Art-Hachi c 20S-FBwith -FB ,b Art-Hachi c bdeterioration with deterioration non deterioration non deterioration
10 10
5
0.01 0.01
0.02
0.03 0.03
max 0.02 max
(a) (a)
0 0 0 0
40S-FB -FB , 40S-FBc -FBb , c b Art-Hachi Art-Hachi
30 30
with deterioration withdeterioration deterioration non non deterioration
20 20 10 10
5 0 0 0 0
40 40
Story level Story level
20 20
0.01 0.01
0.02
max 0.02 max
0 0 0 0
0.03 0.03
0.01 0.01
(b) (b)
max max
0.02 0.02
0.03 0.03
(c) (c)
Figure 10. Distribution of maximum story drift angle of high‐rise SMRF models with thin‐walled Figure 10. Distribution of of maximum maximum story story drift drift angle angle of Figure 10. Distribution of high-rise high‐rise SMRF SMRF models models with with thin-walled thin‐walled c‐FBb; (b) 30S‐FBc‐FBb; (c) 40S‐FBc‐FBb. members. (a) 20S‐FB members. (a) 20S-FB -FB ; (b) 30S-FB -FB ; (c) 40S-FB -FB . c c c b b b members. (a) 20S‐FBc‐FBb; (b) 30S‐FBc‐FBb; (c) 40S‐FBc‐FBb.
Ultimate sidesway collapse is regarded when the induced story drift angle does not recover, Ultimate sidesway collapse collapse is is regarded regarded when when the the induced induced story story drift drift angle angle does does not not recover, recover, Ultimate sidesway meaning the residual story drift angle is equal to the maximum story drift angle. The relation between meaning the residual story drift angle is equal to the maximum story drift angle. The relation between meaning the residual story drift angle is equal to the maximum story drift angle. The relation between the maximum and residual story drift angle with respect to the incremental factor is plotted to present the maximum and residual story drift angle with respect to the incremental factor is plotted to present the maximum and residual story drift angle with respect to the incremental factor is plotted to present the incipient collapse, as shown in Figure 11. Residual story drift angle stays at a low deformation the incipient collapse, as shown in Figure 11. Residual drift of angle staysmotions. at a lowThe deformation the incipient collapse, as shown in Figure 11. Residual story drift angle stays at a low deformation level (i.e., 0.01 rad), and becomes very sensitive to the story intensity ground collapse level (i.e., 0.01 rad), and becomes very sensitive to the intensity of ground motions. The level (i.e., 0.01 rad), and becomes very sensitive to the intensity of ground motions. The collapse collapse potential of the 40S‐FB c‐FB b building exists when the incremental factor of Art‐Hachi is scaled to 2. potential of the 40S-FB -FB building exists when the incremental factor of Art-Hachi is scaled to 2. potential of the 40S‐FB ‐FB b building exists when the incremental factor of Art‐Hachi is scaled to 2. c b The ratio of residual to maximum story drift angle is an important indicator to judge the criteria of The ratio of residual to maximum story drift angle is an important indicator to judge the criteria of The ratio of residual to maximum story drift angle is an important indicator to judge the criteria of incipient collapse. incipient collapse. incipient collapse.
Art-Hachi 20S-FBc-FBb Art-Hachi 20S-FBcmax,with -FBb
2
2 1
1 0 0
0.01
0.01
max (rad)
0.02
0.02
max,non max,with res,with max,non res,non res,with
res,non 0.03
0.03
Art-Hachi
3
3 2
30S-FBc-FBb max,with 30S-FB -FBb c
2 1
1 0 0
0 0
0.01
0.01
max (rad)
0.02
0.02
max,non max,with res,with max,non res,non res,with
res,non
4
Incremental Incremental factorfactor ( ) ( )
3
Incremental factorfactor ( ) ( ) Incremental
Incremental factor ( ) Incremental factor ( )
Art-Hachi
4
3
0 0
4
4
4
4
3
3 2
2
Art-Hachi 40S-FBc-FBb Art-Hachi 40S-FBc-FBb
Incipient deterioration of frame
Incipient deterioration of frame
max,with
1
1
0.03
0 0
0.03
0 0
0.01
0.01
max (rad)
0.02
max,non max,with res,with max,non res,non res,with
res,non0.03
0.02
max (rad) (c) (a) (b) (c) Figure 11. Incremental maximum and residual story drift angles of 20S building models. (a) 20S‐FBc‐ max (rad) (a)
(b) (rad) max
0.03
FBb; (b) 30S‐FBc‐FBb; (c) 40S‐FBc‐FBb. Figure 11. Incremental maximum and residual story drift angles of 20S building models. (a) 20S‐FB c‐ Figure 11. Incremental maximum and residual story drift angles of 20S building models. FBb; (b) 30S‐FBc‐FBb; (c) 40S‐FBc‐FBb. (a) 20S-FBc -FBb ; (b) 30S-FBc -FBb ; (c) 40S-FBc -FBb .
4. Collapse Mitigation Using CFST Columns
4. Collapse Mitigation Using CFST Columns 4.1. CFST Columns with Equivalent Capacity 4.1. CFST Columns with Equivalent Capacity As discussed in the previous section, the collapse potential of high‐rise SMRFs with thin‐walled sectional columns exists when subjected to strong earthquakes that exceed the design criterion. As discussed in the previous section, the collapse potential of high‐rise SMRFs with thin‐walled
Appl. Sci. 2017, 7, 53
9 of 13
4. Collapse Mitigation Using CFST Columns 4.1. CFST Columns with Equivalent Capacity Appl. Sci. 2017, 7, 53
9 of 13
As discussed in the previous section, the collapse potential of high-rise SMRFs with thin-walled sectional exists subjected strongcapacity earthquakes thatbe exceed the design criterion. Effective columns alternatives for when enhancing the to collapse should proposed based on either 3 Effective alternatives for enhancing the collapse capacity should be proposed based on either equivalent equivalent flexural stiffness K (12EI/h ) or ultimate strength Mu. In seismic design, the flexural flexural stiffness K (12EI/h3 ) or ultimate strength Mu . In seismic design, the flexural stiffness dominates stiffness dominates the deformation capacity to resist moderate earthquakes. The CFST columns with the deformation capacity to resist moderate earthquakes. The CFST columns with equivalent flexural equivalent flexural stiffness efficiently reduce the size of cross sections or the thickness in terms of stiffness efficiently reduce the size of cross sections or the thickness in terms of the same cross section, the same cross section, as shown in Figure 12. Besides, the composite effects delay the local buckling as shown in Figure 12. Besides, the composite effects delay the local buckling of restrained tubes of restrained tubes and improve the crushing strength of confined concrete. Given this consideration, and improve the crushing strength of confined concrete. Given this consideration, equivalent CFST equivalent CFST members substitute the thin‐walled HSS columns to build the comparative high‐ members substitute the thin-walled HSS columns to build the comparative high-rise CFST-MRFs, rise CFST‐MRFs, as summarized in Table 1. The same analysis procedures performed in the previous as summarized in Tableto 1.quantify The same analysis procedures performed in the section were section were repeated the enhancement of collapse capacity by previous using the thin‐walled repeated to quantify the enhancement of collapse capacity by using the thin-walled CFST columns. CFST columns. Rectangular steel tube Confined concrete Rectangular CFT
equilibrium CFT with smaller section
equilibrium CFT with smaller thickness
Figure 12. CFST columns equivalent to the HSS (hollow steel section) columns Figure 12. CFST columns equivalent to the HSS (hollow steel section) columns. Table 1. Details of various high‐rise building models. Table 1. Details of various high-rise building models. Component (Column, Height Width‐to‐Thickness Ranks ‘First Mode’ Natural B/t Ratio Component Height Width-to-Thickness ‘First Mode’ Beam) (Story) (Column, Beam) Period B/t Ratio (Column, Beam) 81 m (20) (Story) RanksFA, FA (Column, Beam) Natural Period 2.32~2.38 s HSS 1 columns, SMRF 1 121 m (30) FA, FB 3.54~3.61 s 17~30 81 m (20) FA, FA 2.32~2.38 s 1 H‐shaped beams HSS columns, 121 m (30) FA, FB 3.54~3.61 s 17~30 161 m (40) FB, FB 4.53~4.66 s SMRF 1 H-shaped beams 161 m (40) FB, FB 4.53~4.66 s 81 m (20) FA, FA 2.26~2.32 s CFST columns, 81 m (20) FA, FA 2.26~2.32 s CFST‐MRF 1 121 m (30) FA, FB 3.32~3.47 s 14~40 CFST columns, H‐shaped beams 121 m (30) FA, FB 3.32~3.47 s 14~40 CFST-MRF 1 161 m (40) FA, FB 4.12~4.38 s H-shaped beams 161 m (40) FA, FB 4.12~4.38 s 1 SMRF: steel moment‐resisting frames; HSS: hollow steel section; CFST: concrete filled steel tubular; 1 SMRF: steel moment-resisting frames; HSS: hollow steel section; CFST: concrete filled steel tubular; MRF: MRF: moment‐resisting frames. moment-resisting frames. Case Case
4.3. Collapse Capacity Enhancement 4.2. Collapse Capacity Enhancement As discussed in the previous section, the 40S‐FBc‐FBb building showed the most significant As discussed in the previous section, the 40S-FBc -FBb building showed the most significant sensitivity to global collapse in the range of the intensity of ground motion (e.g., Art‐Hachi: sensitivity to global collapse in the range of the intensity of ground motion (e.g., Art-Hachi: PGV = 210 m/s, φ = 2). The thin‐walled CFST columns with equivalent flexural stiffness are used to PGV = 210 m/s, φ = 2). The thin-walled CFST columns with equivalent flexural stiffness are used to substitute the HSS columns in the 40S‐FBc‐FBb building, aiming to improve the intensity of ground substitute the HSS columns in the 40S-FBc -FBb building, aiming to improve the intensity of ground motions associated with the incipient collapse. Figure 13 shows the distribution of maximum story motions associated with the incipient collapse. Figure 13 shows the distribution of maximum story drift drift angle of the 40S‐FBc‐FBb and the comparative 40CFT‐high‐det. (FBc‐FBb) buildings when angle of the 40S-FBc -FBb and the comparative 40CFT-high-det. (FBc -FBb ) buildings when subjected subjected to the Art‐Hachi with φ = 2. It is noted that sidesway collapse at the bottom two stories of to the Art-Hachi with φ = 2. It is noted that sidesway collapse at the bottom two stories of the the 40S‐FBc‐FBb building is efficiently prevented by using a thin‐walled CFST column. This implies 40S-FBc -FBb building is efficiently prevented by using a thin-walled CFST column. This implies that that high‐deterioration significantly influences the collapse resistant capacity of high‐rise SMRF high-deterioration significantly influences the collapse resistant capacity of high-rise SMRF buildings buildings under high‐level ground motions that have a larger probability of occurrence than the under high-level ground motions that have a larger probability of occurrence than the building model building model with a low level of deterioration effect. with a low level of deterioration effect.
Appl. Sci. 2017, 7, 53 Appl. Sci. 2017, 7, 53 Appl. Sci. 2017, 7, 53
10 of 13 10 of 13 10 of 13 40
Story level Story level
30
20
10
40
30 40CFT-high-det. 40CFT-high-det. 40S-FB -FB c b 40S-FB -FB
20
c
b
Art-Hachi, (=2.0) Art-Hachi, (=2.0) 10
0 00 0
0.01 0.02 0.01IDR (rad)0.02 Peak
Peak IDR (rad)
0.03 0.03
Figure 13. Distribution of maximum story drift angle of high‐rise SMRF and CFST‐MRF (moment Figure 13. Distribution of maximum story drift angle of high-rise SMRF and CFST-MRF (moment Figure 13. Distribution of maximum story drift angle of high‐rise SMRF and CFST‐MRF (moment resisting frame) models. resisting frame) models. resisting frame) models.
For the collapse safety of various high‐rise buildings, the SMRFs with thin‐walled members face For the collapse safety of various high‐rise buildings, the SMRFs with thin‐walled members face For the collapse safety of various high-rise buildings, the SMRFs with thin-walled members face larger challenges of collapse than the equivalent CFST‐MRFs. From the demonstration in Figure 14, larger challenges of collapse than the equivalent CFST‐MRFs. From the demonstration in Figure 14, larger challenges of collapse than the equivalent CFST-MRFs. From the demonstration in Figure 14, the incipient collapse has been induced with different intensity levels, indicating that the collapse the incipient collapse has been induced with different intensity levels, indicating that the collapse the incipient collapse has been induced with different intensity levels, indicating that the collapse capacity of the SMRFs with thin‐walled members is enhanced by the CFST‐MRF buildings with the capacity of the SMRFs with thin‐walled members is enhanced by the CFST‐MRF buildings with the capacity of the SMRFs with thin-walled members is enhanced by the CFST-MRF buildings with the equivalent flexural stiffness. The 40S‐FB c‐FBb building could collapse until the φ is up to around 1.5, equivalent flexural stiffness. The 40S‐FB equivalent flexural stiffness. The 40S-FBcc‐FB -FBbb building could collapse until the φ is up to around 1.5, building could collapse until the φ is up to around 1.5, while the incipient collapse of the 40CFT‐S c‐FBb building model did not occur until the φ achieves while the incipient collapse of the 40CFT‐S while the incipient collapse of the 40CFT-Scc‐FB -FBbb building model did not occur until the φ achieves building model did not occur until the φ achieves around 4.0. around 4.0. around 4.0. 6
6 PGV / PGV =2.67
CFT PGV col S / PGV col =2.67 CFT col S col
4 Incipient collapse of CFT building Incipient collapse of CFT building
4
2
2 Incipient collapse of Incipient collapse of steel model steel model
0 00 0
0.05 0.05
Art-Hachi Art-Hachi 40CFT-Sc-FBb model 40CFT-Sc-FBb model 40S-FBc-FBb model 40S-FBc-FBb model
0.1 0.1 (rad) (rad)
max max
0.15 0.15
Figure 14. Incremental maximum story drift angle of high‐rise SMRF and CFST‐MRF models. Figure 14. Incremental maximum story drift angle of high‐rise SMRF and CFST‐MRF models. Figure 14. Incremental maximum story drift angle of high-rise SMRF and CFST-MRF models.
The high‐rise CFST‐MRFs demonstrate greater collapse capacity than the equivalent SMRFs, but The high‐rise CFST‐MRFs demonstrate greater collapse capacity than the equivalent SMRFs, but The high-rise CFST-MRFs demonstrate greater collapse capacity than the equivalent SMRFs, this finding is only supported when the input ground motion is Art‐Hachi. As mentioned before, the this finding is only supported when the input ground motion is Art‐Hachi. As mentioned before, the but this finding is only supported when the input ground motion is Art-Hachi. As mentioned before, Art‐Hachi wave is characterized by a flat velocity spectral shape in the domain of the long‐period Art‐Hachi wave is characterized by a flat velocity spectral shape in the domain of the long‐period the Art-Hachi wave is characterized by a flat velocity spectral shape in the domain of the long-period branch. Similar waves such as the BCJ‐L2, Yokohama and JSCA‐Kobe are selected to perform the IDA branch. Similar waves such as the BCJ‐L2, Yokohama and JSCA‐Kobe are selected to perform the IDA branch. Similar waves such as the BCJ-L2, Yokohama and JSCA-Kobe to compare the collapse capacity of these two types of high‐rises. are selected to perform the IDA to compare the collapse capacity of these two types of high‐rises. to compare the collapse capacity of these two types of high-rises. Seismic response tends to become sensitive and collapse may occur suddenly after going beyond Seismic response tends to become sensitive and collapse may occur suddenly after going beyond Seismic response tends to become sensitive and collapse may occur suddenly after going beyond the limit‐state of their collapse capacities. Thus, a collapse safety coefficient is proposed to quantify the limit‐state of their collapse capacities. Thus, a collapse safety coefficient is proposed to quantify the limit-state of their collapse capacities. Thus, a collapse safety coefficient is proposed to quantify the seismic safety of buildings to prevent deterioration and collapse. A process that progresses from the seismic safety of buildings to prevent deterioration and collapse. A process that progresses from the seismic safety of buildings to prevent deterioration and collapse. A process that progresses from elasticity to elasto‐plasticity until ultimate strength to component‐deterioration and global‐collapse. elasticity to elasto‐plasticity until ultimate strength to component‐deterioration and global‐collapse. elasticity to elasto-plasticity until ultimate strength to component-deterioration and global-collapse. The PGV of earthquakes is considered to be associated with the corresponding performance demand The PGV of earthquakes is considered to be associated with the corresponding performance demand The PGV of earthquakes is considered to be associated with the corresponding performance demand in performance‐based seismic design, e.g., the so called ‘Level 2’ is treated as the maximum capacity in performance‐based seismic design, e.g., the so called ‘Level 2’ is treated as the maximum capacity in performance-based seismic design, e.g., the so called ‘Level 2’ is treated as the maximum capacity earthquake. The PGV at the Level 2 can be used as the reference to quantify the collapse margin. The earthquake. The PGV at the Level 2 can be used as the reference to quantify the collapse margin. The earthquake. The PGV at the Level 2 can be used as the reference to quantify the max collapse margin. relation between the intensity measure of the PGV and the performance indicator θ of high‐rise relation between the intensity measure of the PGV and the performance indicator θ max of high‐rise SMRF and CFST‐MRF buildings under Art‐Hachi, BCJ‐L2, Yokohama and JSCA‐Kobe waves are SMRF and CFST‐MRF buildings under Art‐Hachi, BCJ‐L2, Yokohama and JSCA‐Kobe waves are
Appl. Sci. 2017, 7, 53
11 of 13
The relation between the intensity measure of the PGV and the performance indicator θmax of high-rise Appl. Sci. 2017, 7, 53 11 of 13 SMRF and CFST-MRF buildings under Art-Hachi, BCJ-L2, Yokohama and JSCA-Kobe waves are respectively demonstrated in Figure 15. The average collapse margin λcol of the 40CFT-Scc-FB building respectively demonstrated in Figure 15. The average collapse margin λ col of the 40CFT‐S ‐FBbb building is larger than 2.10, which improves 60% compared to 1.34 of the 40S-FB -FB building. c is larger than 2.10, which improves 60% compared to 1.34 of the 40S‐FBc‐FBbb building. 4
4
2
PGVcol=1.25m/s Collapse margin
40CFT-(FA)c-FBb
3
PGV (m/s)
PGV (m/s)
3
40S-FBc-FBb Individual Mean. Incipient collapse (individual) Incipient collapse (mean.)
Incipient collapse
2 Collapse margin 1
1
Individual Average (with deterioration) Average (non deterioration)
MIDRcol=1.25m/s 0 0
0.02
MIDRdet
0.04
0.06
0 0
0.025
0.05
MIDRdet
0.075
0.1
Figure 15. Average collapse margin of high‐rise SMRF and CFST‐MRF models. Figure 15. Average collapse margin of high-rise SMRF and CFST-MRF models.
5. Conclusions 5. Conclusions In this this paper, paper, collapse capacity of high‐rise using width-to-thickness various width‐to‐thickness In thethe collapse capacity of high-rise SMRFsSMRFs using various members members subjected to successive earthquakes is numerically studied. It was found that the long‐ subjected to successive earthquakes is numerically studied. It was found that the long-period period component of earthquakes obviously correlates with the first‐mode period of high‐rises component of earthquakes obviously correlates with the first-mode period of high-rises controlled by controlled by the total number of stories. Higher buildings to produce more significant the total number of stories. Higher buildings tend to produce more tend significant component deterioration component deterioration to enlarge the maximum story drift angle at lower stories. The width‐to‐ to enlarge the maximum story drift angle at lower stories. The width-to-thickness ratio (FB rank) of thickness ratio (FB rank) of beam and column components overtly has effects on the collapse capacity beam and column components overtly has effects on the collapse capacity when the plastic deformation when the plastic deformation The story ratio of residual to significantly maximum story drift extensively develops. The ratioextensively of residualdevelops. to maximum drift angle is sensitive angle is significantly sensitive to the collapse capacity of various building models. The thin‐walled to the collapse capacity of various building models. The thin-walled CFST column is proposed as CFST column is proposed as one efficient alternative to enhance the overall stiffness and deformation one efficient alternative to enhance the overall stiffness and deformation capacity of the high-rise capacity of the high‐rise SMRFs with fragile performance. With the equivalent flexural SMRFs with fragile collapse performance. Withcollapse the equivalent flexural stiffness, thin-walled CFST stiffness, thin‐walled CFST columns are capable of improving the collapse margin for more than 60% columns are capable of improving the collapse margin for more than 60% of the high-rise SMRFs of the the high‐rise SMRFs under the identical Based on on the comparative study on the under identical earthquakes. Based on the earthquakes. comparative study the collapse capacity of high-rise collapse capacity of high‐rise SMRF and CFST‐MRF buildings, CFST‐MRF buildings demonstrate SMRF and CFST-MRF buildings, CFST-MRF buildings demonstrate significantly higher capacity to significantly higher capacity to avoid collapse, and the greater collapse margin indicates that CFST‐ avoid collapse, and the greater collapse margin indicates that CFST-MRFs are a reasonable system for MRFs are in a seismic reasonable system for Moreover, high‐rises constructional in seismic prone regions. Moreover, high-rises prone regions. difficulties exist when theconstructional HSS columns difficulties exist when the HSS columns are substituted by CFST columns in engineering practice, are substituted by CFST columns in engineering practice, which needs further investigation. which needs further investigation. Acknowledgments: The authors gratefully acknowledge the support for this research from the National Natural Science Foundation of China (NSFC) under Grant No. 51508459, Natural Science Foundation of Shaanxi Province Acknowledgments: The authors gratefully acknowledge the support for this research from the National Natural (2016JQ5086), and China Postdoctoral Science Foundation Grant (2016M592792). Science Foundation of China (NSFC) under Grant No. 51508459, Natural Science Foundation of Shaanxi Province (2016JQ5086), and China Postdoctoral Science Foundation Grant (2016M592792). Author Contributions: Yongtao Bai contributed to the conception of this paper; Jiantao Wang and Yashuang Liu contributed to numerical modeling and dynamic analysis; Xuchuan Lin contributed to provide the earthquake Author Contributions: Yongtao Bai contributed to the conception of this paper; Jiantao Wang and Yashuang database and discuss the results. Liu contributed to numerical modeling and dynamic analysis; Xuchuan Lin contributed to provide the Conflicts of Interest: The authors declare no conflict of interest. earthquake database and discuss the results.
Conflicts of Interest: The authors declare no conflict of interest. References 1.
Architectural Institute of Japan. Preliminary Reconnaissance Report on the 2011 Off the Pacificcoast of Tohoku Earthquake; Architectural Institute of Japan: Tokyo, Japan, 2011. Architectural Institute of Japan. Preliminary Reconnaissance Report on the 2011 Off the Pacificcoast of Tohoku Architectural Institute of Japan. Structural Response and Performance for Long Period Seismic Ground Motions; Earthquake; Architectural Institute of Japan: Tokyo, Japan, 2011. Architectural Institute of Japan: Tokyo, Japan, 2007. Architectural Institute of Japan. Structural Response and Performance for Long Period Seismic Ground Motions; Nakamura, T.; Uetani, K. Symmetry Limit Theory for Steel Beam-Columns (Part 1: A General Formulation). Architectural Institute of Japan: Tokyo, Japan, 2007. J. Struct. Constr. Eng. 1989, 398, 109–119. Nakamura, T.; Uetani, K. Symmetry Limit Theory for Steel Beam‐Columns (Part 1: A General Formulation). J. Struct. Constr. Eng. 1989, 398, 109–119. Nakamura, T.; Uetani, K. Symmetry Limit Theory for Steel Beam‐Columns (Part 2: Finite Element Analysis. J. Struct. Constr. Eng. 1990, 408, 43–54.
References
1. 2. 2. 3. 3. 4.
Appl. Sci. 2017, 7, 53
4. 5. 6.
7. 8. 9. 10. 11. 12. 13. 14. 15. 16. 17. 18. 19. 20. 21. 22. 23. 24. 25. 26. 27. 28.
12 of 13
Nakamura, T.; Uetani, K. Symmetry Limit Theory for Steel Beam-Columns (Part 2: Finite Element Analysis. J. Struct. Constr. Eng. 1990, 408, 43–54. Uetani, K.; Tagawa, H. Deformation Concentration Phenomena in the Process of Dynamic Collapse of Weak-Beam-Type Frames. J. Struct. Constr. Eng. 1996, 483, 51–60. Chung, Y.; Nagae, T.; Hitaka, T.; Nakashima, M. Seismic Resistance, Capacity of High-Rise Buildings Subjected to Long-Period Ground Motions: E-Defense Shaking Table Test. J. Struct. Eng. 2010, 136, 637–644. [CrossRef] Lignos, D.G.; Krawinkler, H.; Whittaker, A.S. Prediction and validation of sidesway collapse of two scale models of a 4-story steel moment frame. Earthq. Eng. Struct. Dyn. 2011, 40, 807–825. [CrossRef] Tao, Z.; Han, L.H.; Zhao, X.L. Behaviour of concrete-filled double skin (CHS inner and CHS outer) steel tubular stub columns and beam-columns. J. Constr. Steel Res. 2004, 60, 1129–1158. [CrossRef] Tao, Z.; Han, L.H.; Zhao, X.L. Experimental behaviour of stiffened concrete-filled thin-walled hollow steel structural (HSS) stub columns. J. Constr. Steel Res. 2005, 61, 962–983. [CrossRef] Patel, V.I.; Uy, B.; Prajwal, K.A.; Aslani, F. Confined concrete model of circular, elliptical and octagonal CFST short columns. Steel Compos. Struct. Int. J. 2016, 22, 497–520. [CrossRef] Patel, V.I.; Liang, Q.Q.; Hadi, M.N.S. Numerical analysis of high-strength concrete-filled steel tubular slender beam-columns under cyclic loading. J. Const. Steel Res. 2014, 92, 183–194. [CrossRef] Montuori, R.; Piluso, V. Analysis and modelling of CFT members: Moment curvature analysis. Thin-Walled Struct. 2015, 86, 157–166. [CrossRef] Elremaily, A.; Azizinamini, A. Behavior and strength of circular concrete-filled tube columns. J. Constr. Steel Res. 2002, 58, 1567–1591. [CrossRef] Shams, M.; Saadeghvaziri, M.A. Nonlinear response of concrete-filled steel tubular columns under axial loading. ACI Struct. J. 1999, 96, 1009–1017. Susantha, K.A.S.; Ge, H.; Usami, T. Cyclic analysis and capacity prediction of concrete-filled steel box columns. Earthq. Eng. Struct. Dyn. 2002, 31, 195–216. [CrossRef] Kawano, A.; Sakino, K. Seismic Resistance of CFT trusses. Eng. Struct. 2003, 25, 607–619. [CrossRef] Kawano, A.; Nejime, H.; Tokuda, M. Seismic-Resistant Capacity of Steel Multi-Story Frames with CFT Truss Beams. J. Struct. Constr. Eng. 2005, 589, 181–185. Kawakami, S.; Kawano, A.; Okamoto, Y. A method to Improve Distribution of Story Drift Angle Responses in CFT Moment-Resistant Frames under Severe Earthquake. J. Struct. Constr. Eng. 2004, 585, 223–229. Nakahara, H.; Sakino, K.; Kawano, A. Bond Behavior of Concrete Filled Steel Tubular Frames under Cyclic Horizontal Load. J. Struct. Constr. Eng. 2008, 73, 465–472. [CrossRef] Han, L.; Li, W.; Yang, Y. Seismic behaviour of concrete-filled steel tubular frame to RC shear wall high-rise mixed structures. J. Constr. Steel Res. 2009, 65, 1249–1260. [CrossRef] Denavit, M.D.; Hajjar, J.F. Nonlinear Seismic Analysis of Circular Concrete-Filled Steel Tube Members and Frames. J. Struct. Eng. 2012, 138, 1089–1098. [CrossRef] Bai, Y.; Kawano, A.; Odawara, K.; Matsuo, S. Constitutive models for hollow steel tubes and concrete filled steel tubes considering the strength deterioration. J. Constr. Steel Res. 2012, 77, 1141–1150. [CrossRef] Bai, Y.; Lin, X.; Mou, B. Numerical modeling on post-local buckling behavior of circular and square concrete filled steel tubular beam columns. Int. J. Steel Struct. 2016, 16, 1–16. [CrossRef] Bai, Y.; Lin, X. Numerical simulation of collapse behavior of steel resistant frame considering post local buckling behavior. Thin Walled Struct. 2015, 94, 424–434. Ministry of Land, Infrastructure, Transport and Tourism. Building Standards Act of Japan; MLIT: Tokyo, Japan, 2007. Architectural Institute Japan. Recommendations for Design and Construction of Concrete Filled Steel Tubular Structures; Architectural Institute of Japan: Tokyo, Japan, 2008. Bai, Y.; Shi, Y.; Deng, K. Collapse analysis of high-rise steel moment frames incorporating deterioration effects of column axial force-bending moment interaction. Eng. Struct. 2016, 127, 402–415. [CrossRef] Sakai, J.; Matsui, C.; Yanagida, Y.; Hitaka, T.; Inumaru, K. A Study on Elastic-Plastic Behavior of 3-Story Frames with CFT Columns (Part 1); Summaries of Technical Papers of Annual Meeting Architectural Institute of Japan; C-1, Structures III, Timber Structures Steel Structures Steel Reinforced Concrete Structures; Architectural Institute of Japan: Tokyo, Japan, 2001; pp. 1163–1164.
Appl. Sci. 2017, 7, 53
29. 30. 31.
13 of 13
Vamvatsikos, D.; Cornell, C.A. Incremental Dynamic Analysis. Earthq. Eng. Struct. Dyn. 2002, 31, 491–514. [CrossRef] Zareian, F.; Krawinkler, H. Assessment of probability of collapse and designfor collapse safety. Earthq. Eng. Struct. Dyn. 2007, 36, 1901–1914. [CrossRef] Liel, A.B.; Deierlein, G.G. Assessing the Collapse Risk of California’s Existing Reinforced Concrete Frame Structures: Metrics for Seismic Safety Decisions; Report No. 166; The John A. Blume Earthquake Engineering Center, Stanford University: Stanford, CA, USA, 2008. © 2017 by the authors; licensee MDPI, Basel, Switzerland. This article is an open access article distributed under the terms and conditions of the Creative Commons Attribution (CC-BY) license (http://creativecommons.org/licenses/by/4.0/).