Abstract. An experimental 3D interface to an object oriented database is ... functions such as file management and program execution. ... use graphical software tools. ..... An experimental 3D interface developed at Apple Computers [24] uses a.
Three Dimensional Interface for an Object Oriented Database Martin H Rapley and Jessie B Kennedy Computer Studies Dept., Napier University 219 Colinton Road, Edinburgh EH14 1DJ
Abstract An experimental 3D interface to an object oriented database is described. It is hoped that using such techniques will help make complex data structures more comprehensible and easier to navigate. A number of 3D visualisation techniques are used to encourage exploration of the data space. The visualisations inform users about the structure and contents of the database by showing classes, objects, and relationships between objects. A discussion of related work is presented followed by a description and initial evaluation of WINONA a prototype 3D interface to an OODB.
1 Introduction The user interface is a neglected part of most database systems. Object oriented databases (OODB) have a particular need for high quality interfaces as they are used to store diverse types of data, and often have complex schemas which reflect the nature of the real world data. The types of data which have to be handled include graphical images and sounds. Graphical interfaces are the obvious solution as they provide a simple way of interacting directly with the data. The system described here uses three dimensional computer graphic techniques to present a number of different visualisations of the contents of an OODB. Three dimensional graphics are used because this allows a greater density of information to be presented in the limited screen area. The visualisations have been designed to help users better understand the structure and relationships within the database, and to more easily navigate the data. Ease of use is further enhanced by allowing direct manipulation of the visualisation to access further information.
1.1 Why visualise? Visualisation encompasses a wide variety of real world application areas with one goal in common, to make some set of abstract data more comprehensible. It is known that a picture can convey a large amount of information in a clear and
simple way. Generally, visualisation has been used to make very abstract numerical information much easier to understand. Now the same ideas are being used to help in understanding all sorts of processes such as computer programming and project management. In addition graphical user interfaces can be considered a form of visualisation as they provide a graphical representation of abstract operating system functions such as file management and program execution. OODBs are suited to visualisation as they have a complex underlying model and structure which can be better explained using graphical representations. Though the concepts of class hierarchies, aggregation, and relationships are fairly simple in themselves it is when they are combined in a highly connected network that even those most comfortable with the concepts have difficulty in understanding all the intricacies. The aim of visualisation in this project is to remove the need for the user to conceive and maintain a complex mental model of the OODB. This can be achieved by giving an explicit representation of the structure of the database. However, the problem is finding an effective representation that can either be directly mapped to the real structure or make use of a relevant and easily understood metaphor
1.2 Interfaces to Databases Database systems are only just starting to take full advantage of graphical interfaces. In particular, those promoting object oriented databases are beginning to realise that to gain greater acceptance for their systems they must provide easy to use graphical software tools. Databases are highly interactive and therefore require good interfaces. Interactions take many forms, from designing and creating schemas to querying, browsing, and manipulating database contents. Barclay and Kennedy [1] have shown the advantages of providing a graphical interface to an ecological database. The complexity of a graphical user interface can be directly related to the expressiveness and complexity of the underlying data model. The highly expressive nature of an OODB comes at the cost of complexity, therefore it is much more difficult to produce a good interface. Whilst there is no definitive definition of an OODB it is recognised that there are some core features which every OODB should have, such as complex object modelling, encapsulation and inheritance [2,3]. Examining both commercial and research systems [4] it is possible to conclude that most effort so far has been in the areas of structural schema design and database browsing although some work has been done on visual querying (GEMSTONE and GOOD) and visual manipulation (ObjectStore and O2). Schema design follows the same approach as most object oriented design tools in providing a graphical editor for placing classes and relationships. The browsers tend to use the form metaphor showing information textually rather than graphically. These are usually difficult to navigate, often requiring tedious backtracking if the wrong option is chosen. One proposed solution to this is to browse using 'information
spaces' [5] where objects are placed in a multi-dimensional space according to their attributes and their relationships to each other. Designing interfaces for an OODB holds a number of challenges [6]. Complex data held in OODBs such as bitmaps, structural relationships, and sounds require more complex interfaces than the simple tabular data of relational systems. They need standard mechanisms for displaying and interacting with object oriented data that have no special representation of their own. Some OODBs already supply 4GL type forms interfaces. Different views of the same data may be required, e.g. data relating to a building might be seen by those working in it as simple floor plans, while maintenance staff require technical data such as wiring to be shown, and a heating engineer wants to see airflow's. The OODB also has HCI implications. Objects can store their own interface, so you can tell them to display themselves rather than being reliant on a representation given to the object by the system (this depends on the ability of database to hold such information) and OODBs have complex schema which require clever graphical tools to create them. Standard interfaces could be provided in several ways. Each class could inherit its user interface from the superclass [7], i.e. all objects in that class will be shown in this way. Then it is simply a matter of calling the display method of the class to see its visual form. Another advantage of this approach is that the interface is easy to extend using standard inheritance and overriding. The visualisations in this case are two dimensional graphs showing the schema, with nodes, which represent the different classes, displayed as icons. These visualisations were evaluated [8] and it was found that the graph representation was not necessarily the best one to use. Alternatively, there could be a separate display handler which takes data from the database server and displays it in a standard way. Finally, there could be display objects which deal with many classes of object by using rules for displaying given objects, e.g. if it is text, show it as a grey rectangle with black text. This option has the advantage that you can provide more than one display object for a given class allowing the user to choose which one is most suitable. Also it allows for portability between interface systems - it is only necessary to re-implement these object display classes. It has been suggested [9] that using three dimensional displays in conjunction with the standard 'desktop' metaphor would be a good approach to building a database interface. The idea is that users will respond more favourably to something which has some familiarity rather than a completely new concept. It is also suggested that the user can be encouraged to interact more freely with the database if presented with an interesting and stimulating interface. Although the implementation is for a specific application, that of protein chemistry, the same methods could be used for any type of data. The three dimensional information system (3DIS) [10] takes a completely different approach by allowing all objects and relationships to be seen at the same time. This is an experimental system which represents data and mappings between data in a simple three dimensional form. All information is treated uniformly with every data item an object in the system. The aim to provide a simple formal geometric representation for databases. There are three orthogonal axes: Range,
Mapping, and Domain. If there is a mapping from a domain object to a range object this is represented by an "on-point" at a position defined by the triple (domain Object, mapping, range Object). Lines on the graph parallel to one of the axes can show a full range of domain, mapping or range objects. Similarly a plane can represent all objects in two dimensions of the database. The point, line, and plane are representations of queries and answers to queries. Subsets are represented by sublines or subplanes.
1.3 Visualisation In the past five years there has been an explosion in the amount of research work in the area of data visualisation [11]. This has been prompted both by the requirements of users and by the wide availability of computer graphics hardware powerful enough to produce good results quickly. The aim of this research is to make abstract data more comprehensible by showing it in graphical form. There are a number of techniques which can be employed to produce a useful visual representation. These include animation, 3D graphics, and rendering. One of the challenges of visualisation is to find the best way of representing the data, because each type of data has its own particular characteristics, so that although one technique may work well for one type of data it may not be applicable to another. The visualisation process has to involve the colours, textures, and animation's that make the data easiest to understand. This is especially difficult when there are many dimensions to the data, which have to be shown on a 2D display. The usefulness of a representation is determined by its descriptive capacity, potential for comparison, aid in focusing attention, and versatility. By combining volume visualisation with hypermedia, a high quality graphical interface to an educational medical database was developed [12]. The data had to be divided and labelled, for example picking out the skull and brain as two separate parts of a head. These labels could then be used as hypertext to point out differently coloured areas in the volume. The user is provided with various types of tool which can be used to explore the image and consult the knowledgebase. Moving from 2D visualisations of electronic charge density to 3D volumetric renderings, [13] presented the benefits of the third dimension in aiding comprehension. Far quicker and better understanding of the processes at work resulted. It was also found that depth was easier to perceive in stereoscopic views of still images than in non-stereoscopic animated images. The main process in visualisation is creating a mapping from the data to the graphical representation. There are two complementary approaches to this, a special purpose language which provides flexibility at the cost of a longer learning process, and visual dataflow programming which is more restrictive but easier to learn. A new language for molecular visualisation called Pdbq [14] has been developed. It is an interpreted language based on C, providing data types, control structures, operators, and built-in functions appropriate to the task. The aim was to
provide a powerful and flexible language capable of handling low and high level objects of interest fast enough to encourage experimentation and improve productivity while remaining easy to use. Making the language interpreted provides the speed but there is a steep learning curve. Once a program is perfected it can be incorporated into the more usable dataflow programs. The dataflow technique is a toolkit approach, using the visual programming idea of having graphical symbols to represent program elements, for example, AVS [15] and AVE [16]. The dataflow is an attractive abstraction as it highlights the mapping of data to representation and allows for interactive exploration of different mapping methods. AVS was designed to make the development of interactive scientific visualisations much easier. The concept was to have software building blocks which could be interconnected to form the required application. The dataflow technique suffers in that it is not a true visual programming environment, is often inefficient when handling large amounts of data, and can lead to complex networks of modules.
1.4 Three dimensional interfaces The current generation of graphical user interfaces have taken on a standard look and feel, with windows, menus, and mouse pointer helping create the metaphorical desktop environment. This approach has taken hold because it is very much easier for novice users. However, as this form of user interface has become universally accepted it has also been quite thoroughly examined and found wanting in a number of respects [17]. One problem is that a screen full of windows can become difficult to manage. This results from the user wishing to take advantage of the friendlier interface by working on more than one thing at a time, and also from having to handle larger volumes of information. A solution has been to move from the two and a half dimensions of windows environments to fully three dimensional interfaces by introducing depth to the display. Navigating in the 2D space of the windows type interface has been made very easy by the use of mouse and pointer. The success of the mouse as an input device is a result of the direct and immediate response that it provides. The introduction of a third dimension adds a complication to the interaction when using a mouse. The problem is that the mouse only returns two dimensional movement information so there is no way that it can be used in the same direct way for three dimensional interaction. The solution is a new input device such as a spaceball or dataglove but as yet these are expensive and thus rarely available. Even with a suitable input device the interaction is more complex because it will probably be necessary to use a 3D cursor, i.e. a cursor which moves in and out of the 3D space. Another problem is navigating in what will very likely be a very large 3D space. Moving between distant points would be tedious and/or difficult. A three dimensional display introduces hidden information because any object shown will have a rear view which is not visible. Thus it is also necessary to have some means of rotating the viewpoint.
An experimental user interface [18,19,20,21,22] has been created which copes with the demands of large amounts of information. The graphical power of today's technology is used to introduce new ways of visualising information. A number of visual abstractions are used to help the user comprehend the information presented. A linear abstraction called the Perspective Wall is used to overcome the problem of large flat workspaces which cannot be accommodated on a single screen in a readable form. Usually a subpart of the space is shown full-size and an overview shows how it relates to the whole. The Perspective Wall distorts the information by folding the 2D information onto a 3D wall which has a central area of interest and two perspective areas on either side which show the context. If something in the contextual area is selected the wall smoothly scrolls the area of interest to the centre. Hierarchical data, for example directory structures or class hierarchies, is made more comprehensible by using the Cone Tree. These are 3D representations that give a uniform layout to the data, with each level represented by a cone. The cones are drawn in such a way as to not obscure those behind. Selecting a node on a cone causes it to rotate so that the selected item is at the front. If a child item is selected then its parent cone is also rotated to the front of that level. It is difficult to show a large wide hierarchy in 2D on a single screen unless scaled down to a point where individual elements are difficult to distinguish, whereas it can be shown quite easily in 3D cone form without loss of information. Robertson et al investigate the advantages and challenges of three dimensional interfaces. A range of techniques are used to increase information processing capabilities. Firstly an effort is made is to enlarge the workspace available to the user. This is achieved in two ways, firstly by introducing their own version of the rooms concept where there are multiple 3D workspaces which users can move through, and secondly by using animation and 3D perspective to increase the density of information shown on one screen. The introduction of 3D workspaces requires new navigation and manipulation techniques. Users can walk through the workspace by using special on screen controls worked by mouse clicks. This allows general exploration but to move to particular areas of interest in a 3D display is quite difficult, especially with 2D pointing devices, and it is for this reason a technique called logarithmic motion was devised where a target point is specified and a ray created between the current view direction and target point, along which the user can move, either towards or away from. Similarly objects can be moved along such rays. The rooms can be navigated either by clicking on door objects or by using the overview which shows all the 3D workspaces, and which even allows rooms to be reached into and manipulated. A Governor mechanism is used to maximise human interaction rates, i.e. the Interactive Objects are scheduled to be in tune with human reactions. An example of this is to complete any animation in about a second, which is fast enough to be usable but not so fast as to disorientate the user. The Cone Tree has been used to good effect in another interface [23]. In the "Viznet" system it is used to show hierarchical part-of relationships in a multimedia database. However, the main focus of this system is the use of "Fisheye" views of information, i.e. using exaggerated perspective to look at an object of greatest interest whilst maintaining a less detailed view of other available
information. A spherical representation is used in a similar way to the "perspective wall" described above. Here, an object is represented by an icon on the surface of a sphere. Directly related objects are shown together on one surface, the closer two icons are the closer the relationship. The sphere can be rotated and by clicking on a particular icon it is possible to move down to a level which shows objects which are related but indirectly, through another object. An experimental 3D interface developed at Apple Computers [24] uses a combination of 3D mouse and 3D cursor to provide direct manipulation of 3D objects. The aim was to find a way of matching the performance of the two dimensional mouse so that three dimensional interaction would be made just as easy. The results of user observations have shown the promise of such an approach. The use of three dimensional interfaces is supposed to take advantage of the users everyday skill in working with spatial information. Some research, however, has shown that using spatial information does not necessarily help and can sometimes introduce complications to what should be a simple interaction. One test of spatial versus symbolic representation [25] found that performance was better using symbolic information rather than two or three dimensional spatial information.
1.5 Summary Graphical schema design and browsing are now common, while querying and manipulation are still to receive the attention they deserve, as they would benefit greatly from an interactive graphical interface. There is still a need for research into the provision of graphical interfaces to databases, and most particularly object oriented databases. It is difficult to provide flexible representations of complex semantically rich objects. Each of the different mechanisms for providing visualisations of objects offer advantages and disadvantages therefore the choice is dependent on the type of application. If a portable application is to be provided then classes of display objects may be the answer, whereas if extensibility is more important, then inheriting visualisations may be the best approach. Graphical representation such as 3DIS may have appeal for those with mathematical backgrounds but for others it is extremely difficult to understand. The more complex a relationship being modelled the harder it is to comprehend. This shows that it is quite easy to design a three dimensional interface which is theoretically attractive but too difficult to use in practice. Users evaluation of prototype interfaces should help prevent this situation. A special visualisation language, perhaps in the form of a library of classes, is one possibility that so far has not been used on C++ based object oriented databases but might be worth consideration. Clearly the best approach to creating graphical visualisations would be a graphical interface that allowed different aspects of the visualisation process to be controlled. The dataflow technique is an example of this but is perhaps not directly relevant to working with the more general information stored in an OODB.
The Cone Tree and Perspective Wall are a good starting point for developing visualisations as both are successful when used for particular types of data. The Cone Tree is good for hierarchical relationships but cannot cope with the possibility of overlapping subtrees, for example the case of the subpart which is used by two superparts. The Perspective Wall is effective when displaying a high density of information but is restricted in the visibility of contextual information, i.e. the two side walls are more difficult to read than the centre wall. The "fisheye" view could be useful in providing focus in a display which holds a large number of objects, and the use of a degree of interest function would help in this process. The idea of having many representations of differing levels of detail could also be useful, especially in controlling the complexity of a visualisation. As 3D input devices are rare it is necessary to find a way of using the 2D mouse for 3D work. It may be possible to use the 3D cursor method even with the 2D mouse. Care must be taken that spatial information will actually provide benefits in terms of comprehension and ease of use. Three dimensional graphics will be presented as a part of a normal windows type interface as this evolutionary rather than revolutionary approach is more likely to succeed in attracting users. It would be too easy to design and implement a fantastical three dimensional interface which no one would want to use as it bore no relation to current working practices.
2 WINONA The WINdows Object Navigation Application (WINONA) described, displays three dimensional visualisations of the contents of an object oriented database which allow the user to interact directly with the database. This experimental system is being used to investigate how three dimensional graphics can be used to visualise the contents of a database and thus help the user fully understand the database in terms of the structures, the types, and the objects which it holds. The following criteria were addressed in the design of the system. The display should be designed to encourage users to explore the information. This would entail using representations which make interaction much easier than in current textual or two dimensional graphical interfaces. Perspective would be used to enhance the illusion of depth while colour and other means would be used to highlight the objects of interest within the display. It should be possible to manipulate the views by rotating, translating, and zooming. Different visualisations would be used to show different aspects of the database by displaying different subsets of the following elements: classes, objects, object attributes, object methods, and links between related objects. It should be possible to tailor the display to show only those elements of interest to the user. Standard dialog boxes and menus would be used to provide a familiar method of interaction when dealing with more detailed information about objects and classes. It should be possible to save the state of visualisations so that the user can return to a previously created visualisation.
2.1 Prototyping An iterative development process was followed whereby a sequence of prototype interfaces were produced, each of which was evaluated and the results used to improve the subsequent prototype. Basic elements of an OODB could be shown in a visualisation. Classes could be displayed either in relation to other classes or in relation to their own object instances. The relationships could be hierarchical, e.g. 'part-of', or simple associations, and could be one to one, one to many, or many to many. To encourage users to explore the data, visualisations of a database were devised which would make interactions as easy as possible. By producing attractive and exciting visualisations it was hoped that the interactive process would be made more stimulating than the standard form type of interface used at present. Numerous ideas were sketched to see how a three dimensional space might be used to both aid understanding of the database and show a higher density of information. Trying to invent good three dimensional display ideas through working in a two dimensional space is rather difficult, requiring a highly developed mental modelling capability. At first the idea of using metaphors was appealing, i.e. to use something in the real world as a metaphor for the computer model, a widely used example being the 'desktop' environments. One example of a metaphor, relating to nature, was that of seeing the classes as trees in a forest, objects as fruit on those trees, and vines between trees representing relationships. This forest could be explored, trees climbed and fruit picked. (See Fig. 1)
Fig. 1. Forest metaphor
Another natural world metaphor saw classes as mountains of objects that could be flown over and around. The library metaphor had classes as subject areas and objects as individual books. The user could walk round the library picking
books off the shelves, looking inside for detailed information, and perhaps following references to related books. The Universe metaphor had classes as stars around which orbited the object planets. These metaphors were attractive as ideas but would be difficult to implement, so simpler geometrical representations were then devised.The idea was to combine a set of simple geometrical shapes so that they represented a logical visualisation of the structure and contents of an OODB. There were three elements, each of which could have a different representation. The class was seen as something which would contain its instances. The instances would be smaller elements, placed inside the class representation. The third element was the link which was most simply represented by a line between two instances. These elements were combined in a way that gave a true representation of the underlying structure. A number of simple database schemas were designed in order to find out what types of structure were possible. There were two obvious hierarchical structures, the inheritance and aggregation relationships. Other relationships might be hierarchical or simple mappings. An example of a hierarchical relationship which depends on the semantics of the relationship is the manager (staff class) who manages (relationship) other staff. In the real world this would be seen as a hierarchical relationship from the overall manager, down through middle managers, to the non-management staff, but in the schema it is simply a one to many relationship. There is no way this sort of implicitly hierarchical relationship can be recognised unless it is explicitly labelled. This calls into question the current standard notations for representing relationships which are implicitly hierarchical. The visualisation should distinguish between hierarchical and nonhierarchical relationships. There were two alternatives considered. Links could be drawn in such a way that they indicate the type of relationship as in standard graphical notations, or the spatial positioning could be used to show the difference. The latter option was chosen as it seemed to be a more intuitive use of the three dimensional space. The first prototype was a set of drawings of visualisation ideas. The aim of presenting these for evaluation was to get some quick feedback on the quality, applicability, and comprehensibility of the approach being taken. There follows a description of the five representations together with the actual designs. 1. The representation in Fig. 2 shows a root object pointing to a disc containing subpart or child objects. Each subpart is represented as a smaller disc within the main disc. Within the subdiscs are even smaller discs which represent the subpart objects of that object - i.e. how many subparts the selected part has. To look further down the hierarchy you select a disc and its contents are zoomed to the next disc where the same representation is used, so allowing traversal of the hierarchy. Objects in the selected hierarchy are labelled suitably and the details of one object are shown in a popup window. 2. The representation in Fig. 3 is similar to the first except a rectangular representation is used and the number of subparts is represented by the "vertical" height of the bar or line. Again this can be used to navigate a hierarchy.
Fig. 2. Visualisation design 1
Fig. 3. Visualisation design 2
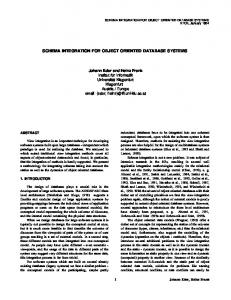
3. Fig. 4 shows another variant on the first which uses a pie representation to show the number of subparts - the bigger the slice the greater the number of subcomponents. It is possible that the size representations could be of a subcomponent of an object, for example to represent its weight attribute if it were a machine component, rather than the number of subparts. To see details of an instance you select a slice. 4. Fig. 5 shows a version of the 3DIS representation of a database which instead of trying to display every object on the axes shows only the instances of given classes and their related classes. For example the domain is of parts and the range is of subparts. The way this is presented is somewhat cluttered but has possibilities, especially for representing overlapping data, e.g. where workers can have more
than one boss. It may however be too abstract for most people. To see details of a relationship you select a blob. The selected object and its related object are shown in detail in two popup windows, with the name of the relationship and an arrow drawn between them. This example was used to test if what was considered a bad representation would also be criticised by evaluators.
Fig. 4. Visualisation design 3
AAAA AAAAAAAA AAAAAAAA AAAA AAAA AAAAAAAA AAAAAAAA AAAAAAAA AAAAAAAA AAAAAAAA AAAA AAAAAAAA AAAAAAAA AAAAAAAA AAAAAAAA AAAAAAAA AAAA AAAA AAAA AAAAAAAA AAAAAAAA AAAAAAAA AAAAAAAA AAAAAAAA AAAA AAAA AAAA AAAA AAAA AAAA AAAA AAAA AAAAAAAA AAAAAAAA AAAAAAAA AAAAAAAA AAAAAAAA AAAA AAAA AAAA AAAA AAAA AAAA AAAAAAAAAAAAAAAAAAAAAAAA AAAA AAAA AAAA AAAA AAAA AAAA AAAAAAAAAAAAAAAAAAAAAAAA AAAA AAAA AAAA AAAA AAAA AAAA AAAAAAAAAAAAAAAAAAAAAAAA AAAA AAAA AAAA AAAA AAAA AAAA AAAAAAAAAAAAAAAAAAAAAAAA AAAA
Fig. 5 . Visualisation design 4
5. Fig. 6 is yet another hierarchical visualisation which borrows from 3DIS the use of points on a grid. Each plane is one class in the hierarchy - each blob representing an instance. An object in a higher plane which is related to an object in the next lower plane has a line drawn between it. This allows representation of intersecting sets of sub objects as they will have more than one connection with the
upper plane. To see details of an object, including the related objects, you select a blob.
Fig. 6. Visualisation design 5
The designs were shown to a number of people who had knowledge of object-oriented databases and interface techniques. In general the designs were looked upon favourably, all except the 3DIS type display which was universally condemned as incomprehensible (even in this simplified form). The prototype displays provided a useful means of finding problems and inspiring suggestions for improvements. A number of possible difficulties were discovered. For example, in the hierarchical displays it is impossible to select a subinstance and move up the hierarchy. Another problem with the hierarchical displays is that they do not cope with the possibility of one object lower down in the hierarchy being connected to different objects above. The grid visualisation does handle this sort of relationship as every object in a class is shown. It was thought that the ability to represent information such as the number of related instances, or the size of a particular object attribute, e.g. weight, would be useful. Feelings about the methods of representation varied. The bar chart idea was easily understood and easy to judge but the pie chart approach was thought less easy to understand. The circles within circles was also thought difficult to judge, and was anyway seen as problematic for showing numbers higher than about twenty. As a result of the prototypes it was decided to develop the interface based on visualisation number 5. Four further prototypes of increasing functionality were developed resulting in the version being reported here.
2.2 Present Interface Currently two types of visualisation are provided. Fig. 7 depicts the hierarchical visualisation and Fig. 8 the circular wall.
Fig. 7 . Hierarchical Visualisation
The hierarchical display shows database classes as equally sized squares arranged on a number of levels. The positioning of class squares reflects their position in the class hierarchy of the database schema. The proximity of one class to another implies the closeness of the relationship between those classes. Within each class square are the much smaller object visualisation squares, each representing one object of that class. These are arranged so that they always remain within the class boundary square. The density of object squares in a class square thus indicates the number of instances there are of that class. The circular wall of classes visualisation was based on the perspective wall and sphere ideas described earlier. The idea was that selecting an object would cause directly related objects to be highlighted on the other classes. The wall can then be rotated to see those related objects. The interior of the cylinder shows link lines between related objects. This combines some of the perspective or fisheye effect with a more general relationship visualisation. Hierarchical relationships are not represented therefore the hierarchical visualisation aids in a fuller understanding of the database schema. The circular display represents database classes as fixed width rectangles with variable length. The length changes according to the number of instances there are of that class. The class rectangles are arranged in a ring, each one perpendicular and touching its neighbours. This
arrangement allows each class rectangle to grow to any length. Again, each instance of the class is visualised as a small square within the class rectangle.
Fig. 8 . Circular wall visualisation
The visualisations have been incorporated into a standard Microsoft Windows style application with title and menu bars at the top, status bar at the bottom, and work area in the centre. The work area can hold many visualisation windows which are organised using the standard Windows multiple document interface technique. Each visualisation window is divided into three viewing areas (viewers), one large square viewer takes up two thirds of the screen to the right, and two equally sized smaller viewers are at the left. Each of these viewers is used to display a visualisation, appropriately scaled. It is intended that the user will work mostly on the visualisation in the large work viewer, with occasional interactions in the smaller viewers. If the visualisation in a smaller viewer becomes of most interest it can be swapped into the large viewer. Figs. 9 -11 show the current prototype in use. Apart from the different structures, the visualisations show exactly the same sort of information. Each class has a label which is displayed beside the relevant class visualisation. An iconic representation can be used in conjunction with the class label or on its own, as a more visual indication of the class type. Both icons and labels can be toggled on and off when required.
Fig. 9 . WINONA
The object has four different representations, each showing more information. The visualisation starts off by showing only that objects exist, using a small square within the class visualisation. When the object is selected the square is enlarged, given a different colour, and labelled. If there is a bitmap image to go with the particular object then the user can choose to show it, by itself or with the label. The most detailed view of object information can be chosen by double clicking on an object. This causes a popup window to appear which shows the objects attributes and methods in the form of scrollable lists. Relationships between objects are also visualised, and again the visualisation can be user-customised. When no relationships are to be shown only the selected object is highlighted, in red, and labelled. If direct relationships are to be shown then directly related objects are highlighted in yellow, and labelled. A further level of connection can also be shown, so that objects related via some intermediary object are also highlighted and labelled. If highlighting of related objects is not clear enough, then it is also possible to have linking lines drawn between each related object. Users can directly interact with the visualisation in a number of ways. The mouse pointer is used to select objects of interest. When the left mouse button is pressed the system automatically detects which viewer, class and object are being selected. These are then highlighted as described above. Relationship lines are drawn if required.
Fig. 10. WINONA - iconic representation of classes
As previously mentioned, double clicking on an object causes a popup window of detailed information to be displayed. However, this popup has two buttons, 'next' and 'previous', which allow all the object instances to be navigated by moving backwards or forwards through the instances of the class. For example, when 'next' is pressed the attributes values in the window are changed accordingly, and the related visual object is highlighted as though it had been chosen using the mouse. Thus it is possible to quickly move through the set of objects examining the attributes, and seeing relationships between that object and other objects. This popup also handles simple querying of the database for objects in that class. By double clicking on an attribute, another window appears where a query can be selected. This facility is currently limited, only allowing simple string searches, e.g. select objects whose labels begin with the letter 't', but it would be fairly easy to extend it to handle all sorts of queries. The important aspect of the query is that the results cause the popup to display only those objects matching the query, so pressing next and previous shows the next or previous object which matches the query, and again the attributes and relationships are shown. By depressing the control key while selecting objects, either with the mouse or using the 'next' and 'previous' buttons, the previous selection will be retained. This allows the user to view many objects and their relationships together. In conjunction with the query facility it is possible to highlight in the visualisation all those objects matching the query.
Fig. 11. WINONA - querying
A floating toolbar is provided for manipulating the visualisation displays. Six arrow buttons allow the display to be rotated around each of the x, y and z axes. Each visualisation is treated as a single object so that the whole of the selected visualisation will be rotated together. Two buttons, 'in' and 'out', can be used to increase or decrease the size of the visualisation. Finally, four other arrow type buttons can be used to move the visualisation up, down, left, or right. Originally the visualisation system was intended to read from any OODB, transform the data to some intermediate form, and then visualise it. Thus there would be two separate phases to the process. The pre-processing stage would, over time, be developed so that it was capable of handling the data storage formats of all the major object oriented databases. Pre-processing would involve finding out the structure of the data held in the database, i.e. what classes were used and how were they related, so that an intermediate version of the schema could be created. Then it would be necessary to navigate this structure to access the data and transform that to a suitable form. The visualisation process would then be a simple matter of interpreting the intermediate form of the data and displaying it in the chosen graphical form. The database for which the pre-processor was written was POET, an OODB running on PCs. However, version 2 of POET has no data dictionary facilities for accessing the database structure, although this facility is expected in a future version. It was therefore decided that a specific example database would be developed and used. The data structures would be known and therefore could be
directly accessed using normal methods and this restriction would not affect experimentation with visualisations.
3 Discussion 3.1 Challenges The design and building of an effective, interesting, and easy to use three dimensional interface to an object oriented database has proved a difficult problem. In the end a reasonably useful experimental interface has been created but the most important results of the project are the insights that have been gained into the challenges this type of work offers: • it is very difficult to find three dimensional representations that are simple, work for all structures, and can display large volumes of data in a comprehensible way • there are issues relating to how the visualisation is created, totally automatically, part automatic/part user defined or totally user defined • how does the user specify what is to be visualised, the whole database or just a small part • the visualisations can be either dependent or independent of the information that is being visualised • using three dimensional graphics introduces perceptual problems that are absent when working in only two dimensions • navigation of a two dimensional space is much easier to handle than moving about in three dimensions • the capabilities of the databases themselves have a bearing on the work that can be done, particularly in terms of making the interface non-application specific • implementing this type of interface is affected very much by the hardware and software being used
3.2 Database visualisation Visualisation can use metaphorical representations, which take a familiar real world structure as their basis, in the hope that the user will transfer their knowledge of the real world and apply it to understand the visualisation. The alternative approach, as used in the experimental interface, is to construct an abstract representation which relates well to the data being visualised and is easy to understand. The latter approach was taken because the implementation looked to be less difficult. In an OODB there are two basic types of relationship that can be visualised, the hierarchical and non-hierarchical. The first problem is thus to find a way of showing the difference between these two types of relationship. The hierarchical relationship was divided into three types, i.e. inheritance, part-of, and implicit.
Inheritance and part-of are recognisable as standard elements of object oriented design but the implicit hierarchy is a relationship specific to the data, i.e. the role of the specific data element affects how it should be shown. An example of implicit hierarchy is the manager employee relationship which the real world sees as hierarchical, and so should be visualised as such to make sense, but it is not represented as hierarchical in standard object oriented design techniques. The experimental interface does not show this type of hierarchical relationship. In Winona only the part-of hierarchical relationship is represented, and in the most obvious way, by having a direct correspondence between the spatial positioning of a class in the visualisation and its position in the schema , i.e. containers are placed above their constituent classes in the representation. The relation of sub parts of a hierarchy to their super part is also be indicated by spatial positioning, i.e. constituent classes are not only placed below, but also in close proximity to, their containers. The problem is that it is possible for one class to be a sub part of many classes and so it would have to be shown in close proximity to all of them. Again, it would have been possible to use symbols and connecting lines to indicate relationships, as in two dimensional object oriented designs, but this would have moved away from the aim of using only three dimensional spatial positioning and so was not used. The experimental interface relies purely on spatial positioning to indicate part-of hierarchies. This is partly successful in that users can see that certain classes contain other classes but it requires explicit representation of object relationships for the user to gain full understanding of the relationships between classes. Non-hierarchical relationships are also shown in Winona, and also cause problems in terms of spatial positioning. Directly related classes are shown on the same level in the hierarchical visualisation to show the relationship is nonhierarchical. However, it is possible for classes involved in different hierarchical relationships, and so perhaps on different levels, to be directly related in a nonhierarchical way. The visualisation can thus cause confusion, indicating hierarchy where there is none. This highlights the difficulty of providing a meaningful representation of the database structure using only spatial positioning. The difficulties described in finding representations that give a valid view of a whole database might be lessened if it was made possible to visualise only a small subset of classes at one time. The objects or instances of a class have to be given some visual form. In the experimental interface a very simple approach is taken. Each object is given a direct representation as a small square within the relevant class square. This indicates both the presence of objects in that class, and the number of objects. In order to avoid information overload, no other information is provided unless the object is selected or is involved in a selected relationship. Most relationships will involve a small subset of objects and therefore giving them a more detailed visualisation should not cause a problem. This gradual revealing of more detail confirms to the idea of degree of interest. Only when the user indicates an interest in a particular object is that object shown in more detail. The experimental interface has four levels of detail, the square indicating existence, the label, the
icon, and the popup information window. Each one allows the user to get more and more information about the object of interest. Even though the lowest level of detail takes up very little screen space there are still problems in trying to show very large numbers of objects. The hierarchical visualisation has fixed size class squares into which any number of object squares must fit. Eventually it will be impossible to distinguish individual objects as they are packed closer and closer together. One way of overcoming this is shown in the circular wall where each class is represented by a rectangle which grows in size to accommodate more objects. It is also possible that objects need not be shown at all, unless involved in a selected relationship, but this would mean finding another way of representing class size information. Visualisation of objects can be somewhat dependent on the type of data. Some data is inherently visual, e.g. photographs, so there is scope for showing that data directly within the visualisation but another piece of data may just be stored as text and so the only way to show it is to show the text. Abstract numerical data could be given as just numbers but would be more effectively presented in graphical form, e.g. a bar graph. The experimental interface provides the four standard representations which don't take into account the special needs of the different types of data being viewed. It would have been necessary to provide some mechanism for users to specify how each type of data was to be visualised, if each type of object was to be displayed differently. If each class provided their own visual representation this would not be required.
3.3 Working in three dimensions Though we all inhabit the three dimensional world there are still relatively few people who are used to thinking and working with three dimensional representations in a computer display. Users of computer aided design packages and molecular modelling packages become familiar with the requirements of three dimensional work but the average user is more used to looking at flat pages of text. This general unfamiliarity means that when three dimensional displays and interfaces are used they must try and exploit all the available techniques to aid perception and understanding of the three dimensional space. The experimental interface is relatively poor in helping the user to understand what they are seeing. Perspective projection is used to foreshorten objects, meaning that the nearer the object is the larger it is, and a form of hidden line removal is provided which adds to the users understanding because nearer objects hide farther away ones. Other techniques such as shading, transparency, and casting shadows would all add to the users perception of the three dimensional space. Even when the image is understood it can still be difficult to position it in such a way that it reveals exactly the information you want to see. It is possible to bring one object of interest to the front and find that another one is then hidden or too far away.
A three dimensional graphical representation involves more complicated interactions than are present with two dimensional systems. These interactions relate to navigation and selection. Navigation of the experimental interface visualisations takes a very primitive form, working in much the same way as most computer aided design systems. The visualisation is treated as a single object which can be rotated around any axis, translated along any axis, and made larger or smaller. This has the advantage of familiarity but for larger visualisations it would be better to have some finer control, such as rotating one level, or even one class, at a time. Selecting objects of interest within a three dimensional space also throws up challenges. In the experimental interface the mouse pointer selection technique is maintained because it is familiar to most users but in some cases this is not the best approach. The true feeling of direct manipulation is lost because the users cannot move their cursor about in the 3D world to select the object of interest.
3.4 Future directions This work has revealed many areas suitable for future research: 1. There is enormous potential for the use of metaphors in this type of work. Some possible ideas have been discussed previously but there are no doubt many others that could be tried. 2. Other visual cues, such as colour and shape, for distinguishing between hierarchical and non hierarchical relationships could be tried. For example, the superclass(es) of a class could be shown as blue and subclass(es) shown as red whenever a class is selected. 3. With an inheritance hierarchy the challenge is how to represent relationships that can involve members of the generic or special type, both of which might be useful to the user at some stage in the interaction. An example of this is when you have a teacher, who is a special type of person. A user might wish to see which people (including teachers) read a particular newspaper, or see which teachers teach a certain subject. The interface has to handle showing the data as either type and must provide a way for the user to specify which one they wish to see at any one time. Should general and specialised classes be shown at the same time? The answer is probably not, because the user will be interested in relationships involving either the general or specific classes but not both. One way of dealing with the visualisation and interfacing problems this involves would be to show only the most general class at first and allow the user to indicate in some way that the specialised subclasses should be shown instead. There must therefore be an indication in the visual class that shows it has subclasses or a superclass so that the user sees a choice can be made. An alternative approach would be to show all subclasses in a hierarchy with a symbolic representation to show their exact relationships to each other. Only when a subclass was selected or involved in a selection would the irrelevant classes be removed from the visualisation. This is a reasonable approach but there may be structures which cause conflicts in terms of
placement, e.g. something many levels down in an inheritance hierarchy may be at the top of a part-of hierarchy. The complexity of relationships in the schema of an OODB make it difficult, perhaps impossible, to predict all the structures that the visualisation process will have to cope with, and so it may be impossible to make it completely generic. 4. The realm of implicitly hierarchical relationships needs to be investigated to see if there are many such real world relationships which will cause problems. In the type of relationship it is possible for recursion so that it will be necessary to show one class many times, taking different positions in the hierarchy, or there will have to be some sort of graphical representation linking objects within one class that shows their relative positions in a hierarchy. 5. The visual representation of large numbers of objects needs to be studied. Possible solutions include forcing a query to be performed on very large classes so that only subsets are shown, or alternatively, putting objects that have common attribute values into grouped objects which are then visualised (the grouped object may indicate in the visualisation how large the group is). 6. The experimental interface works only with a specific database whose structures are known. This information is used to hardcode the visualisation layout into the program. Any real system would have to include an automatic layout algorithm. Having laid out one small database by hand, and thought about how this may be done automatically, it was concluded that this would be a difficult task to achieve quickly. The difficulty stems purely from the complexity of an OODB schema, with multiple hierarchies and inter-relationships possible. The alternative to automatic layout is to allow the user to create their own. It is envisaged that power users would create these layouts, perhaps only showing part of a database, using their expert knowledge of the schema. These would then be made available to other users in a similar way to relational database 'views'. It may be possible to allow the user to create an initial layout and then use an algorithm which tidies it up in such a way that relationships are shown in as simple a way as possible. These ideas and others should be investigated. 7. A more effective approach to navigation could be investigated. One idea would be to make the visualisation a virtual world which can be explored. The user could then move about within the world as though inside that space. Walking in such a virtual world is not the best means of moving from one point of interest to another, especially if they are far apart, as the user would find passing through masses of uninteresting data very tedious. Techniques such as moving along lines of interest have proved successful but other navigation methods need to be found. It is also possible that for some visualisations it is necessary to restrict the user's ability to manipulate the scene. For example, in the experimental interface it would be quite valid to stop the user from rotating the hierarchical visualisation in such a way that the sense of what is above and below in the hierarchy is lost. 8. The usefulness of a three dimensional input device, such as a space ball, should be examined, together with a 3D cursor, as the combination might improve usability. 9. The informal user evaluations have shown that even a relatively primitive interface that makes use of three dimensional graphics has advantages over a
standard two dimensional interface. It would be useful to take a number of three dimensional visualisation approaches and perform a careful study of how performance compares with a conventional two dimensional interface. 10. Having tried to find a good three dimensional graphics library written in C++ and conforming to object oriented standards there is clear scope for such a library to be written. For this type of work it is particularly important that interactive functions are provided, e.g. what object is the mouse pointer nearest to. 11. There is obvious potential in three dimensional visualisations of object oriented databases for the creation of visual queries and to carry out visual manipulation. For example, in the experimental interface simple manipulations such as deleting an object could have been implemented relatively simply by adding a mechanism, such as pressing the delete key, to delete the selected object. Querying is a much more challenging prospect, however if all object attributes were given a visual representation then it would seem to be an easy further step to provide a way of selecting ranges of values for an attribute visually, perhaps using direct manipulation with the mouse. It is possible that current research is concentrating too closely on trying to find visual equivalents of the old textual query rather than using visual techniques to devise completely new ways of querying.
Bibliography 1. Barclay, P. and Kennedy, J., 1992, Using a Persistent System to Construct a Customised Interface to an Ecological Database, in R.L. Cooper (ed), proc. of First International Workshop on Interfaces to Database Systems, SpringerVerlag (Workshop in Computer Science Series). 2. Atkinson M et al, 1990, The object-oriented database system manifesto, in Deductive and Object-Oriented Databases, Elsevier Science, Amsterdam, Netherlands 3. Atwood, T., 1993. ODMG 93: The Object DBMS Standard, Object Magazine Vol. 3 No. 3 September-October, pp 37-44 4. Kapel, G & Min Tjoa, A., 1992, State of the Art and Open Issues on Graphical User Interfaces to Databases, Information and Software Technology, Vol. 34, No. 11, pp. 721-730 5. Caplinger, M., 1986. Graphical database browsing, 3rd ACM SIGOIS Conference OIS C.Hewitt and S.Zdonik (eds), pp 113-121 6. Sawyer, P., Colebourne, A., Somerville, I., and Mariani, J., 1992. Object oriented database systems: a framework for user interface development, Proceedings - International Workshop on Interfaces to Databases, Glasgow 7. Paton, N., al-Qaimari, G., Kilgour, A., 1992. An Extensible Interface to an Extensible Object-Oriented Database System, Proceedings - International Workshop on Interfaces to Databases, Glasgow 8. Paton, N., al-Qaimari, G., 1993. Visualising Advanced Data Modelling Constructs, Dept of Computing and Electrical Engineering, Heriot-Watt Univ. 9. Boyle, J., Fothergill, J.E., & Gray, P.M.D., 1993. Design of a 3D user interface to a database, Database Issues for Data Visualisation Workshop
10. Afsarmanesh, H. & McLeod, D., 1989. The 3DIS: An Extensible ObjectOriented Information Management System, ACM Transactions on Information Systems Vol. 7 No. 4 October, pp 339-377 11. Pickover, C. A., 1991, Computers and the Imagination, Alan Sutton Publishing, UK. 12. Hohne, K.H., Bomans, M., Riemer, M., Schubert, R., Tiede, U. and Lierse, W., 1992. A Volume Based Anatomical Atlas, IEEE Computer Graphics and Applications, Vol. 12 No. 4, pp. 72-77 13. Wolfe, R. H., Needels, M., Arias, T., Joannopoulos, J. D., 1992. Visual Revelations from Silicon Ab Initio Calculations, IEEE Computer Graphics and Applications, Vol12 No4, pp.45-53 14. Palmer T. C., 1992, A Language for Molecular Visualisation, IEEE Computer Graphics and Applications, Vol.. 12, No. 3, pp23-32 15. Upson, C., Faulhaber, T., Kamlins, D., Laidlaw, D., Schlegel, D., Vroom, J., Gurwitz, R., van Dam, A., 1989. The Application Visualization System : A Computational Environment for Scientific Visualization, IEEE Computer Graphics and Applications, Vol.9 No.4, pp. 30-42 16. Dyer, D.S., 1990, A Dataflow Toolkit for Visualization, IEEE Computer Graphics and Applications, Vol.10 No.4. pp. 60-69 17. Shneiderman, B., 1992, Designing the User Interface, Addison-Wesley, USA 18. Robertson, G.G., Card, S.K., and Mackinlay, J.D., 1991. Rapid Controlled Movement through Virtual 3D Workspaces, Proceedings of ACM CHI'91 Conference on Human Factors in Computing Systems pp 461-462 19. Robertson, G.G., Card, S.K., and Mackinlay, J.D., 1991. Cone Trees: Animated 3D Visualisation of Hierarchical Information, Proceedings of ACM CHI'91 Conference on Human Factors in Computing Systems pp 184-194 20. Robertson, G.G., Card, S.K., and Mackinlay, J.D., 1991. The Perspective Wall : Detail and Context Smoothly Integrated, Proceedings of ACM CHI'91 Conference on Human Factors in Computing Systems pp 173-179 21. Robertson, P.K., 1991. A Methodology for Choosing Data Representations, IEEE Computer Graphics and Applications, Vol. 11 No. 3, pp. 56-67 22. Robertson, G.G., Card, S.K., and Mackinlay, J.D., 1993. Information Visualization using 3D Interactive Animation, Communications of the ACM, Vol. 36 No. 4, pp. 57-71 23. Fairchild, K.M., Serra, L., Hern, N., Hai, L.B., Leong A.T., 1993, Dynamic Fisheye Information Visualisations, In R.A.Earnshaw, M.A.Gigante, H.Jones (Eds.) Virtual Reality Systems. London: Academic Press 24. Venolia, D., 1993, Facile 3D Direct Manipulation, in proceedings of ACM CHI'93 Conference on Human Factors in Computing Systems 25. Dumais, S.T., & Jones, W.P., 1986. The Spatial Metaphor for User Interfaces: Experimental Test of Reference by location versus Name, ACM Transactions on Information Systems, Vol. 4 No. 1, pp 42-63