METHODS ARTICLE published: 10 October 2013 doi: 10.3389/fncir.2013.00151
NEURAL CIRCUITS
Three-dimensional mapping of microcircuit correlation structure R. James Cotton 1 , Emmanouil Froudarakis 1 , Patrick Storer 1 , Peter Saggau 1,2 and Andreas S. Tolias 1,3* 1 2 3
Department of Neuroscience, Baylor College of Medicine, Houston, TX, USA Department of Bioengineering, Rice University, Houston, TX, USA Department of Computational and Applied Mathematics, Rice University, Houston, TX, USA
Edited by: G. J. Augustine, Korea Institute of Science and Technology, South Korea Reviewed by: Thomas Knopfel, RIKEN Brain Science Institute, Japan David Fitzpatrick, Max Planck Florida Institute for Neuroscience, USA *Correspondence: Andreas S. Tolias, Department of Neuroscience, Baylor College of Medicine, One Baylor Plaza, Houston, TX 77030, USA e-mail:
[email protected]
Great progress has been made toward understanding the properties of single neurons, yet the principles underlying interactions between neurons remain poorly understood. Given that connectivity in the neocortex is locally dense through both horizontal and vertical connections, it is of particular importance to characterize the activity structure of local populations of neurons arranged in three dimensions. However, techniques for simultaneously measuring microcircuit activity are lacking. We developed an in vivo 3D high-speed, random-access two-photon microscope that is capable of simultaneous 3D motion tracking. This allows imaging from hundreds of neurons at several hundred Hz, while monitoring tissue movement. Given that motion will induce common artifacts across the population, accurate motion tracking is absolutely necessary for studying population activity with random-access based imaging methods. We demonstrate the potential of this imaging technique by measuring the correlation structure of large populations of nearby neurons in the mouse visual cortex, and find that the microcircuit correlation structure is stimulus-dependent. Three-dimensional random access multiphoton imaging with concurrent motion tracking provides a novel, powerful method to characterize the microcircuit activity in vivo. Keywords: acousto-optical deflectors, two-photon imaging, motion-tracking, correlation structure, microcircuit activity, population coding
INTRODUCTION The outermost part of the brain—the cerebral cortex—is a 3D sheet of neural tissue that contains billions of nerve cells communicating through trillions of connections. Research over the last five decades has shown that single neurons in the cortex perform complex and subtle computations. However, little is known about how cortical neurons interact with each other to acquire their functional properties and how ensemble activity patterns are organized to process information. Interestingly, anatomical connectivity between cortical neurons is locally dense via both vertical and horizontal connections (Gilbert and Kelly, 1975; Douglas and Martin, 2004; Song et al., 2005; Yoshimura et al., 2005; Thomson and Lamy, 2007; Otsuka and Kawaguchi, 2009; Yu et al., 2009). Moreover, the local wiring of the cortex is remarkably specific, demonstrating local higher order connectivity motifs (Song et al., 2005; Perin et al., 2011) and increased connection probability between more similarly tuned neurons (Ko et al., 2011, 2013). With the development of high throughput electron microscopy of brain tissue, the complete wiring diagrams of small volumes of neocortex may be available in a few years (Denk and Horstmann, 2004; Livet et al., 2007; Bock et al., 2011; Helmstaedter et al., 2013). Given the locally dense, specific, and three-dimensional nature of cortical connectivity, it is important to simultaneously monitor the activity of a large number of nearby neurons in 3D to link our understanding of anatomical connectivity (structure) with population activity
Frontiers in Neural Circuits
(function) in order to unravel the underlying computations. For example, measuring the simultaneous activity of large populations of neurons in vivo is necessary for deciphering the principles of population coding. Theoretical work has shown that the precise structure of correlated neuronal variability, so called noise correlations, can significantly enhance or diminish the information capacity of neural ensembles (Zohary et al., 1994; Abbott and Dayan, 1999; Sompolinsky et al., 2001; Wilke and Eurich, 2002; Averbeck and Lee, 2004; Shamir and Sompolinsky, 2004; Ecker et al., 2011). However, these studies typically rely on extrapolating the population correlation structure from data recorded with pairs of neurons, but the assumptions behind this extrapolation can dramatically change the results (Shamir and Sompolinsky, 2006; Ecker et al., 2011; Pernice et al., 2013). Therefore, it is important to decode real populations to validate these theoretical studies and ultimately determine the impact of correlations on population coding (Graf et al., 2011; Berens et al., 2012). Simultaneously recording the activity of large population of neurons from local microcircuits has been hindered by the lack of appropriate methods. Electrophysiology, while providing excellent temporal resolution, is limited in terms of scalability, recording density, utilizing fluorescent cell markers, and the precise localization of neurons. Alternatively, two-photon fluorescence laser-scanning microscopy (Denk et al., 1990) and population-staining methods (Stosiek et al., 2003) enable mapping the properties of all cells in
www.frontiersin.org
October 2013 | Volume 7 | Article 151 | 1
Cotton et al.
Three-dimensional mapping of microcircuit correlation structure
a local volume with excellent spatial resolution. However, traditional in vivo two-photon microscopy works by moving mechanical components, which limits temporal resolution due to inertia. Moreover, scanning axially is even more inertia-limited due to the mass of the objective lens (e.g., 10 Hz) (Göbel et al., 2007). So while all the cells in a volume can be characterized independently, these methods are limited for studying their coordinated activity and interactions. Three-dimensional two-photon imaging using acousto-optic deflectors (AODs) circumvents these limitations by allowing fast random-access 3D imaging (Reddy and Saggau, 2005; Reddy et al., 2008). Inertia-free scanning within a single plane has been applied successfully for in vivo studies using two acoustooptic deflectors (Grewe et al., 2010) and spatial light modulators (Nikolenko et al., 2008). Inertia free imaging also has the benefit of hopping directly between neurons, and thus not wasting time imaging from locations that are not of interest (i.e., neuropil). More recently, 3D-RAMP scanning with AODs was demonstrated in vivo to measure the orientation tuning preference of neurons (Katona et al., 2012). However, one major drawback of using random access scanning for in vivo research is that without an image sequence (Katona et al., 2012), it is challenging to determine if coordinated changes in fluorescence across the population are attributable to neural activity or movement. Because the main purpose of population recording is to characterize the coordinated ensemble activity, this is a critical limitation. Here we describe the design of a microscope for in vivo studies using 3D random-access multi-photon (3D-RAMP) excitation that can perform neural population recording and simultaneous 3D motion tracking of the tissue by interleaving imaging from orthogonal planes. This was made possible with a custom field programmable gate array (FPGA)-based real time controller capable of continuously scanning complex patterns. The microscope employs four acousto-optic deflectors instead of traditional galvanometric and piezo scanning devices. Therefore, it can generate any desired 3D scanning path with a temporal resolution that is one to two orders of magnitude faster than current in vivo 3D two-photon imaging systems. We used this method to record the activity from populations of up to 411 cells in layers 2/3 of the primary visual cortex of the mouse and characterized the activity structure of local populations of neurons. In agreement with previous reports (Kohn and Smith, 2005; Ecker et al., 2010; Denman and Contreras, 2013) we found higher noise correlations for pairs of neurons with similar tuning preference than more dissimilarly tuned pairs. In addition, we found a stimulus dependence of the correlation structure, where presentation of a stimulus near the preferred orientation of a pair of cells caused higher noise correlations than presentation of non-preferred stimuli.
MATERIALS AND METHODS 3D-RAMP MICROSCOPE
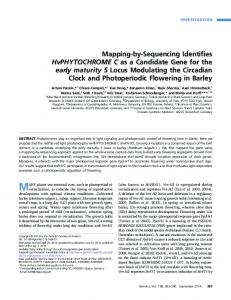
The 3D-RAMP scanner contains four AODs (OAD-1121, Isomet, VA) using TiO2 as the acousto-optical medium. The AODs are connected by 1:1 telescopes (200 mm focal length lenses) to optically map the pivot points of all deflectors into the back focal plane of the objective (Figure 1). The light source is a tunable
Frontiers in Neural Circuits
ultrafast Ti:S laser (Chameleon Vision II, Coherent). The overall system efficiency (output/input power) is about 14%. The expanded laser beam diameter is 10 mm throughout, and imaging is performed with a water immersion objective (20x 1.0NA, Olympus, Japan) mounted to a modified open frame microscope (Moveable Objective Microscope, Sutter Instruments). The collection path is split by a dichroic mirror into the longer wavelength (red channel) and shorter wavelength (green channel) and measured with two high quantum efficiency GaAsP photomultiplier tubes (H7422P-MOD, Hamamatsu, Japan). Three-dimensional imaging is performed using a pair of AODs for both the X and Y axis (Reddy et al., 2008). By driving a deflector with a linear frequency sweep (chirp), a beam with cylindrical phase is generated with a time-dependent mean angle (Figure 1B1). Pairing two deflectors, each with the sound propagating in opposite directions, the time-dependent component can be removed and the cylindrical phase curvature doubled. In this scheme, a difference in the frequencies creates a desired residual lateral offset. In order to achieve spherical phase curvature and lateral offset in the perpendicular direction, an orthogonal pair of deflectors was used (Figure 1B2). The same frequency ramp was used across all four AODs, creating the spherical curvature required for axial scanning and independent control of lateral positioning (Figure 1B3). This scheme allows moving the twophoton excitation point arbitrarily in three dimensions. To hop to a new location, the appropriate acoustic signal is presented to the deflectors, and the collected signal is blanked for the time it takes the new sound to propagate across the deflector crystal (10 μs). The dwell time was set to 10 μs, giving a time per point of 20 μs or an overall rate of 50,000 samples per second. This optical configuration results in a field-of-view of 200 × 200 μ m laterally and 100 μm axially. More details of the principles underlying 3DRAMP microscopy have been described previously (Reddy and Saggau, 2005; Reddy et al., 2008) and a photograph of the system can be found in Supplementary Figure 1. In our system, a mirror on a motorized mount allowed remote switching of the illumination path between a traditional galvanometric scanning system and the 3D-RAMP scanner. To ensure correct alignment and function of the deflectors, we measured the wavefront tilt and curvature entering the back-focal aperture of the objective lens using a wavefront sensor (WFS1507AR, Thorlabs, Newton, NJ). We swept each individual AOD back and forth through its frequency range while holding the others at the center frequency. This confirmed that the wavefront tilt per MHz of frequency change was the same for each AOD, which would not be the case if the telescopes were misadjusted. In addition, this procedure verified that each AOD tilted only in either the X or Y axis and that there was no rotational misalignment. The tilting procedure was repeated with the beam diameter limited to 1 mm and imaged with a standard camera to verify that all AODs were optically pivoting in the backfocal plane, which verified the AOD placement along the optical path. Another important alignment procedure was to repeatedly hop between the center frequency and a frequency with very low efficiency for each AOD while focusing in fluorescein solution, in order to time the latency from the hop time to the change in fluorescence. When each AOD was correctly centered along its
www.frontiersin.org
October 2013 | Volume 7 | Article 151 | 2
Cotton et al.
Three-dimensional mapping of microcircuit correlation structure
FIGURE 1 | (A) Layout of 3D-RAMP Microscope. The expanded beam of a pulsed Ti:S laser is shaped in its collimation and angle at the backfocal plane of the objective lens by a chain of 4 AODs and telescopes, resulting in 3D positioned focus. (B) Principle of controlling the axial position of the laser focus. For clarity, a side and a top view of the scanning unit are shown. The direction and frequency of the chirped sound waves at two pairs of AODs creates the desired focal
offset. Note that for simplicity a case with no desired lateral offset is shown here. This helps visualizing how the 2nd AOD of every pair compensates for the unwanted lateral displacement of the beam by the chirp. (C) Point spread function. Square figure to the left shows PSF in horizontal plane and figure to right shows axial section through PSF. (D) Spiny pollen imaged at 3 axial depths. Number to the left indicates offset from natural focal plane.
acoustic axis the latency was the same and approximately equal to the propagation time across the AOD (10 μs with our AODs). CONTROL MODULE
To efficiently perform in vivo 3D-RAMP experiments, we needed a control system that could generate complex scan patterns continuously for long periods of time and simultaneously record voltage traces such as electrophysiology. We developed a new control system and matching user-interface software. Frequency ramps are generated using a four-channel digital synthesis board (AD9959 Evaluation Board, Analog Devices, Norwood, MA), which is updated synchronously across all channels. Two cascaded RF amplifiers (IA100 and DA104–2, Isomet) provide the 1.5 watts of RF power required to efficiently drive the AODs. The parameters for the subsequent ramp are clocked into the AD9959 during the hopping and dwell time of the previous point by custom firmware running on a field-programmable gate array (FPGA, PXIe-7965R with NI-5751 adapter module, National Instruments, Austin, TX) through a digital interface. The 16-channel, 14-bit, 50-MHz adapter module for the FPGA acquires the photomultiplier tube and electrophysiology data, which is then demultiplexed and pre-processed by the FPGA. Demultiplexing the optical signals involves blanking the data during the transition from one point to another and binning it during the dwell time. The FPGA then sorts the data into points from the functional scan and points from the motion planes (see Motion Tracking below). Voltage traces from the continuous channels (e.g., electrophysiology) are downsampled to the scanning rate (50 kHz). Running the code on an FPGA guarantees the difficult real time constraints required for this type of system are met. The corresponding user interface software allows one to perform a volume scan and select cells using a semi-supervised
Frontiers in Neural Circuits
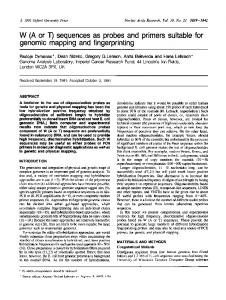
FIGURE 2 | Visualization of a scanning path and interleaved motion tracking planes. (A) The location of all cells is labeled green and the scanning path is labeled blue. Interleaved into this scanning path are points located in two orthogonal motion tracking planes placed over a vessel and neuroglia. Motion tracking is computed from these orthogonal image planes in 3D (see Methods for details). (B) Movement traces from a session with little lateral movement but axial drift. (C) Movement traces from a session with large abrupt movements.
method that identifies the three dimensional center of neurons (see Supplementary Movie 1 for visualization of experimental paradigm). It is important to record signals from the center of the cell bodies in order to minimize neuropil contamination (Göbel and Helmchen, 2007). The user interface also allows placing motion-tracking planes in three dimensions over high contrast objects (Figure 2). During imaging, all electrical channels and the calcium fluorescence traces can be visualized in real-time. SURGICAL METHODS, DYE LOADING, AND ELECTROPHYSIOLOGICAL RECORDING
All procedures performed on mice were conducted in accordance with the ethical guidelines of the National Institutes of
www.frontiersin.org
October 2013 | Volume 7 | Article 151 | 3
Cotton et al.
Three-dimensional mapping of microcircuit correlation structure
Health and were approved by the Baylor College of Medicine IACUC. Male C57CL/6J mice (age: p40–p60) were initially anesthetized with Isoflurane (3%) and anesthesia was maintained by either Isoflurane (2%) or a mixture of Fentanyl (0.05 mg/kg), Midazolam (5 mg/kg), and Medetomidin (0.5 mg/kg), with anesthesia boosts of half the initial dose administered every 3 h. The temperature of the mouse was maintained between 36.5 and 37.5◦ C throughout the whole procedure using a homeothermic blanket system (Harvard Instruments). In some experiments, the cardiac and respiratory rate were simultaneously monitored and recorded using a MouseOx (Starr Life Sciences Corp). Part of the skin over the skull was resected and the location of the craniotomy determined (approximately 2.5–2.9 mm lateral to the mid-line sagittal suture and anterior to the Lambda suture). A head-post bar was secured to the skull using bone cement, then a 0.5–1.5 mm craniotomy was performed over the region of interest. The mouse was transferred to a traditional galvanometric imaging system with a 10x objective (Nikon CFI Plan Apo 10×) for two-photon guided injection of the membranepermeable calcium indicator Oregon green 488 BAPTA-1 AM (OGB-1, Invitrogen) and the astrocyte specific fluorescent dye sulforhodamine 101 (SR-101, Invitrogen). Dye solution was prepared as previously described (Garaschuk et al., 2006) and bolus loading injections were performed (Wu and Saggau, 1994; Stosiek et al., 2003). We used a pulsed low pressure protocol with a glass micropipette and a computer controlled pressure system (Picospritzer II) to inject ∼300 μm below the surface of the cortex (Garaschuk et al., 2006). The window was then sealed using a glass coverslip secured with dental cement. After allowing 1 h for dye uptake, each injection resulted in a stained area of