548. Downloaded by [ Heriot-Watt University Library] on [19/11/15]. Copyright .... mesh of the RC beam failing in flexure, which was analysed in Part 1). The.
Proc. Instn Ciu. Engrs, Part 2, 1991, 91, Sept., 545-560
PAPER 9141
STRUCTURAL BUILDING AND
BOARD
Three-dimensional non-linear finite-element model for structural concrete. Part2: generality study F. GoNZALEZ VIDOSA, Ing, PhD* M. D. KOTSOVOS, Dipl-Ing, PhD, DSc?
The three-dimensional finite-element model for structural concrete, proposed on the basis of an objectivity study described in the first part of this two-paper series, is now applied to a wider range of problems in an attempt to establish its generality. Additional examples are presented which, together with the examples outlined previously, provide sufficient evidence to suggest that the numerical scheme based on ‘constant’ parameters, and requiring only the specification of the uniaxial cylinder compressive strength of the concrete mix adopted, represents a useful and reliable tool for purposes of practical design and analysis.
Introduction The development of an engineering 3-D finite-element (FE) model for the description of the behaviour (up to failure) of concrete structures was outlined in the companion paper‘ by reference to the key material parameters as well as those procedural variables which, through an objectivity study, were found to provide the most reliable predictions. While the study of the objectivity of a given model deals with the sensitivity of its analytical predictions to the factors and parameters incorporated into the computational strategy (e.g. FE mesh, iterative technique, shear-retention factor (SRF), etc), a model’s generality implies that it can successfully predict the behaviour of arbitrary structural configurations. This Paper, therefore, aims at investigating the generality of the FE scheme by presenting the results obtained by applying the FE model to various different problems encompassing a wider range of structural components. These include a plain-concrete (PC) prism under central patch load, an overreinforced reinforced-concrete (RC) beam with stirrups failing in shear, and a RC slab exhibiting punching failure. Accordingly, by combining the predictions for the three members studied in reference 1 with those for the three additional components considered here, the generality of the numerical model can be discussed by reference to a total of six different Written discussion closes 15 November; for further details see p. ii. * Profesor, Departamento de Ingenieria de la Construccion. Universidad Polidnicade Valencia, Spain. t Professor, Department of Civil Engineering, National Technical University of Athens, Greece. $ Reader, Department of Civil Engineering, Imperial College of Science, Technology and Medicine, London. 545
Downloaded by [ Heriot-Watt University Library] on [19/11/15]. Copyright © ICE Publishing, all rights reserved.
G O N Z A L E Z VIDOSA, KOTSOVOS AND PAVLOVIC
structural elements. In contrast to the numerical examples in reference 1, only one computer run per structural element has been carried out in the present Paper. These runs incorporate the factors that led to the most stable and accurate predictions in reference 1: i.e. mainly the single-crack procedure (which was found to provide a successful tnol for dealing with large stress redistributions that arise as a result of cracking in both PC and RC structures), the locally-updated NewtonRaphson method (the NR-plus method, which was found to reduce the risk of propagation of spurious mechanisms), and theunderintegrated serendipity 20-node or the Lagrangian 27-node finite elements. As in reference 1, analytical results will be compared with experimental data in terms of ultimate load, crack patterns andload-deflexion curves. Finally, it should be noted that no attempt has been made to alter meshes based on initial engineering judgement in order to improve the accuracy of the predictions, as this seems to be the only sensible way ofjudging thegenerality of the model.
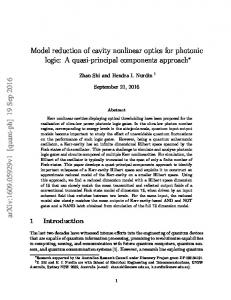
PC prism underpatch loading 2. As for the PC case study investigated in reference 1, this example mimics one of the PCprisms under concentrated loading tested by Niyogi’ but, instead of concentric strip loads, the loading applied at both ends consists of (concentric) square patch loads transmitted throughsteel bearing plates. Fig. 1 shows the mesh of 20-node underintegrated elements used for the analysis of the present prism (f,= 28.8 MPa, ultimate bearing stress = 30.4 MPa). Once again,only one-eighth of the complete prism is analysed on account of three planes of symmetry. 3. While the type of bearing plate is of secondary importance for prisms under strip loading, for patch (square or circular) loading cases the ultimate loads are quite sensitive to the boundary loading condition^.^ This iswhy two types of loading condition had to be considered in the present study. The first loading type is a uniformly-distributed load, and this relates to a flexible bearing plate. The second type of loading is a constant applied displacement imposed at all nodal points of the loading area,which relates to a rigid bearing plate. 4. The analytical predictions of ultimate loads yielded 66% and 103% of the experimental ultimate load for uniform applied load (load step = 2 MPa) and uniform applied displacement (displacement step = 0.0075mm) respectively. Such sensitivity compares well with the large scatter of ultimate bearing stresses that is observed in tests for prisms under square or circular concentrated loads. This scatter is quite large in the present case (total/loaded area = 4), for which values between 60% and 130% off, are to be e ~ p e c t e d The . ~ close correlation between thepredictions for the uniform-displacement case and the experimental result ( M S L I E X P = 1.03) suggests that a rigid-plate situation was practically attained during testing. 5. In contrast to the case of prisms under strip loading, prisms under square or circularloading are reported to fail at the same load level reported for first cracking,’ and this is also quite well reproduced by the analyses, since the prisms remain uncracked upto the maximum sustained load (20 MPa for uniform applied stress, 31.3 MPa for uniform applied displacement-see Fig. 2). The differences in the analytical crack patterns shown in Fig. 2 simply reflect the different states of stress that occur before cracking, as discussed el~ewhere.~ Since the experimental loaddeflexion curve was not reported, no comparison can be made between analysis and test data of this type. 546
Downloaded by [ Heriot-Watt University Library] on [19/11/15]. Copyright © ICE Publishing, all rights reserved.
3-D M O D E L F O R S T R U C T U R A L C O N C R E T E : P A R T
101-6
2
X
XJ
Fig. I . PC prism under patch loading. FE mesh for one-eighth ofstructure, consisting of 4 brick elements (all dimensions in mm)
RC beam with stirrups undercentral point loading failing in shear 6. This structural element is an overreinforced RC beam with stirrups reported as beam A-l by Bresler and Scordeli~.~ is similar It to beam OA-l (also reportedin reference 4, and analysed by means of the present numerical model in reference l), the difference being the addition of shear and compression reinforcement. The experimental details of beam A-l (12 ft) and the experimental crack pattern of beam A-2 (1 5 f t k t h e latter being reported as typical for both A- 1 and A-2-are described fully in reference4. The failure of the beam was brittle and took place at 547
Downloaded by [ Heriot-Watt University Library] on [19/11/15]. Copyright © ICE Publishing, all rights reserved.
GONZALEZ VIDOSA. KOTSOVOS AND PAVLOVIC 31.3 MPa
20 MPa Load step 10
1I
0
0
DM 30
II
O
T
Fig. 2. PC prism under patch loading. Crack patterns for maximum sustained load, which coincides with Jirst cracking: (a) uniform applied stress: (b) uniform applied displacement
467 kN without yielding of the tension bars (the flexural failure load would have been 563 kN).4 Diagonal cracking began at the same load level as for the beam without stirrups (267 kN), but did not lead to collapse. Failure eventually occurred as a result of splitting of the compressive zone in the vicinity of the point load. It is worth noting that the approximate gain in strength with respect to beam OA-l predicted by most current codes is only about 60% of the actual (experimental) gain. 7. Figure 3 shows the FE mesh used for the analysis of beam A-l. Such a mesh is identical to that used for beam OA-l (see reference l), but it now incorporates more steel elements in order to assess the effect of the additional transverse and compression reinforcement on the analytical prediction. As for beam OA-l,' the cover of the tension reinforcement has been neglected, the relevance of which will be discussed later. Since the spacing of the stirrups is almost equal to that in the actual beam (203 mm instead of 210 mm), the adjustmentrequired to keep the area per unit length the same was minimal. The compression steel was placed at the top face, and this alsoappears tobe a relatively minor deviation from the test. 8. The maximum sustained load in the analysis is 450 kN, which compares well with the experimental failure load (467 kN). Fig. 4 shows the crack patterns at various load levels up tofailure. These patterns indicate that the fracture processes of the beam with stirrups (A-l) are quite similar to those of the beam without stirrups up to atotal applied loadequal to 225 kN. On the otherhand, the diagonal cracking that takes place suddenly in the analysis of beam OA-l at 250 kN is delayed by the presence of stirrups, and it occurs gradually as the load increases (see Fig. 4 for 300 kN, 375 kN and 450 kN-the crack pattern for beam OA-l is described fully in reference 5). The splitting of the compressive zone initiates at 350 kN, but does not lead to the immediate collapse of the beam since 548
Downloaded by [ Heriot-Watt University Library] on [19/11/15]. Copyright © ICE Publishing, all rights reserved.
3-D MODEL FOR STRUCTURAL CONCRETE: PART
2
the stirrups confine the compressive zone. As can be observed by reference to the crack pattern of the last performed iteration (load step ‘777’ (475 kN) in Fig. 4), failure occurs as a result of extensive splitting of the compressive zone,which is in good agreement with the experimental modeof failure? Furthermore, the gainin strength with respect to the analysisof the beam without stirrups predictedby the L
Fig. 3. RC beam with stirrups under central point loading failing in shear. FE mesh for one-fourth of structure, consisting of 30 brick elements (the position of the steel elements is indicated by dashes) (alldimensions in mm) 549
Downloaded by [ Heriot-Watt University Library] on [19/11/15]. Copyright © ICE Publishing, all rights reserved.
GONZALEZ VIDOSA, KOTSOVOS AND PAVLOVIC
present analysis is 150 kN,which also compares well with the experimental gain of 133 kN.In this respect, Table 1 shows a comparison of analytical failure loads reported by several researcher^,^-^ for both the present case studies of beams OA-l and A-l, and other similar beam types drawn from the experimental evidence in reference 4. It is worth noting that all the 2-D (planestress) analyses referred in the table overestimated the strength of the beam without stirrups and underestimated the gain in strength caused by the introduction of the stirrups. Clearly, a proper modelling of the confinement caused by the stirrups can be
step
Load
3
75 kN
Load step
5
125 kN
Load step
7
175 kN
Load step
9
225 kN
1
1
1
Fig. 4 (above and facing). RC beam with stirrups under central point loading failing in shear. Crack patterns at various load stages 550 Downloaded by [ Heriot-Watt University Library] on [19/11/15]. Copyright © ICE Publishing, all rights reserved.
3-D MODEL FOR STRUCTURAL CONCRETE: PART
2
achieved only by means of a formal 3-D modelling, and this appears to be the reason why the present method of analysis is capable of predicting a gain in strength similar to thatobserved in the experiment. 9. Finally, Fig. 5 shows a comparison between the experimental and analytical loadcieflexion curves, the latter being softer than the former one. Nevertheless, it should be recalled that, as for beam OA-l (see reference l), the cover to the tension reinforcement has been neglected in the FE discretization. Now, while this has little effect on collapse-load predictions, it does play a noticeable role when esti-
Load step 12
300 kN
Load step 15
375 kN
1
#
Load step18450
kN
1
Load step 777
Fig. 4-continued 55 1 Downloaded by [ Heriot-Watt University Library] on [19/11/15]. Copyright © ICE Publishing, all rights reserved.
GONZALEZ VIDOSA, KOTSOVOS AND PAVLOVIC
Table 1. Comparison between experimental and analytical failure loads reported by several authors for beam data drawn from reference 4, including numerical case studies of beams OA-l and A-l modelled in present two-paper series (loads in k N )
I
I
I
I
I
I
500
400
30C
L'
3
/"
U 0 _1
20c
1 oc
0
Experimental 2-D (total depth) 3-D (effective depth) I
1
2
4
I 6
I
8 Deflexlon. mm
I 10
I
I
12
14
Fig. 5. RC beam with stirrups under central point loading failing in shear. Comparison of experimental and analytical load-deflexion curves (2-D analysis curve has
been taken fromreference 10) 552
Downloaded by [ Heriot-Watt University Library] on [19/11/15]. Copyright © ICE Publishing, all rights reserved.
3-D M O D E L FOR STRUCTURAL CONCRETE: PART
2
mating beam deflexions. This is illustrated in Fig. 5 by the stiffer response obtained through a2-D version of the present model," in which the totaldepth of the beam has been allowed for.
RC slab exhibiting punching failure 10. The last structural element studied in the present Paper is a RC square slab, denoted as B-l4 in the paper by Elstner and Hognestad," and reported fully in this reference in respect of the relevant experimental details (member description, load4eflexion curve, crack patterns, etc.). The percentage of tension steel was very high (3%) and the slab lacked any shear reinforcement. The RC plate was simply supported at all edges and corners, and subjected to a concentrated square load atmid-span. Failure occurredas a result of punching at a loadof 578 kN (130 kips) before any yielding of the tension bars. It is worth noting that, according to the yield-line theory, the flexural failure load is 912 kN (i.e. 57.8% higher than the actual failure load). 11. The details of the adopted FE mesh are shown in Fig. 6. The mesh comprises 25 Lagrangian finite elements (363 nodes and 1089 degrees of freedom
I Fig. 6. RC slab exhibiting punching failure. F E mesh for one-fourth of structure, consisting of 25 Lagrangian elements (the positionof the steel elements is indicated by dashes) (alldimensions in mm) 553 Downloaded by [ Heriot-Watt University Library] on [19/11/15]. Copyright © ICE Publishing, all rights reserved.
GONZALEZ VIDOSA, KOTSOVOS AND PAVLOVIC
(DOF))for the concrete, and 110 bar elements for the tension steel (the position of which is indicated by means of dashes). Although only one-fourth of the slab is analysed on account of symmetry, it is clear that additional savings would be achieved by implementing ‘edge’ (i.e. triangular-based) brick elements, so as to also make use of the symmetry with respect to thediagonals and hence to analyse one-eighth of the whole slab. With regard to the choice of the Lagrangian FE mesh, it should be noted that, before its choice, three other serendipity meshes were considered for consistency with the other analyses in the present Paper (all incorporating underintegrated serendipity meshes); these were based on 5 X 5 X 1 HX20A elements (228 nodes, 684 DOF), 5 X 5 X 2 HX20A elements (360 nodes, 1080 DOF), and 9 X 9 X 2 HX20A elements (1040 nodes, 3120 DOF). However, the Lagrangian mesh was preferred for the following reasons. The first alternative mesh (25 HX2OA elements) had only two Gauss points across thethickness of the slab, and did not allow a good distribution of the tension steel in plan. Therefore, this discretization was considered too rough. The second alternative mesh (50 HX20A elements) had four Gauss points across the thickness, but it still involved a poor modelling of the steel in plan. Finally, the third alternativemesh (162 HX20A Load steD 3
Load step 6
97 kN
194 kN
t
4 .
*
\
\
\
\
Q
4 b
Q
4
m 4 +l
4
b
b
6
4 4
4
0
Load step 9
\
\
\
4
b
4 Load step 12
290 kN
387 kN 1
4
b a
a
‘a\
+l 6
b 4
4
4
6
4
Q
\
\
Q
4
Fig. 7 (abooe and facing). RC slab exhibiting various load stages
Q
4 0
punching failure. Crack patterns at
554
Downloaded by [ Heriot-Watt University Library] on [19/11/15]. Copyright © ICE Publishing, all rights reserved.
3-D MODEL FOR STRUCTURAL CONCRETE: PART
2
elements) was discarded on account of the steep rise in computer resources inherent in the scheme. 12. As in the previous case studies, only one computer run incorporating the NR-plus iterative method and the single-crack procedure was carried out. The maximum number ofnew cracks allowed to form in the course of a particular iteration was increased to nine (instead of the maximum of three compatible with the ' SCA' for 3-D Lagrangian meshes, as argued in reference l), in order to avoid an excessive number of iterations. Note that such a number corresponds to a similar proportion with respect to the total number of Gauss points in the mesh (9/675 = 0.013 for the present analysis, 3/324 = 0.009 for the refined Lagrangian mesh of the RC beam failing in flexure,which was analysed in Part 1). The analytical results are discussed below by reference to the crack patterns in Fig. 7, and the loaddeflexioncurves in Fig. 8. 13. The prediction of the maximum sustained load is 548 kN, which compares rather well with the experimental failure load (578 kN, i.e. 5.5% above the FE Load step
+
13
419 kN
Load step 15
484 kN
Load step
548 kN
17
Load step 777
+
_ _ a
h a
m 4
a b
0
b 4
4
a
F i g . 7-continued 555 Downloaded by [ Heriot-Watt University Library] on [19/11/15]. Copyright © ICE Publishing, all rights reserved.
GONZALEZ VIDOSA, KOTSOVOS AND PAVLOVIC I
Fig. 8. RC slab exhibiting punching failure. Comparison of experimental and analytical load-deflexion curves (2-D analysiscurve has been takenfrom reference 12, in which implied axisymmetry is based on approximating 3-D problem to that of an ‘equivalent ’ circular shape inscribed within square plan; clearly, such a simplijication resultsin poor deflexion estimates)
model’s value). As in the test, cracking occurs in the form of radial and circumferential cracks, the former being represented in Fig. 7 by means of circle symbols, since they are quasi-parallel to the reference section (parallel to the X Z plane in Fig. 6), while the latter are marked by means of oriented dashes. (Note that the present reference section relates to a low percentage of the total number of Gauss points of the mesh (45/675 = 0.067), and, therefore, it involves less relative information than in previous quasi 2-D analyses.) The predicted fracture process is as follows. The first flexural cracks appear at mid-span at a total applied load equal to 97 kN (1 7% of the experimental failure load). Subsequently, radial and circumferential cracks spread gradually from mid-span towards the support. The extension of cracking on thetensile face compares well with the experimentally-reported one in reference 11. As Fig. 8 shows, the predicted load-deflexion response up to load step 12 (387 kN) is very close to the experimental curve (unlike the prediction from a simplified axisymmetric analysis”), and then deviates from the latter. It should be noted that this deviation coincides with the occurrence of a large 556 Downloaded by [ Heriot-Watt University Library] on [19/11/15]. Copyright © ICE Publishing, all rights reserved.
3-D MODEL FOR STRUCTURAL CONCRETE: PART
2
Fig. 9. RC slab exhibiting punching failure. Crack pattern at maximum sustained load predicted bymeans of a 2-D axisymmetrical analysisfor an ‘equivalent ’ circular slab (seereference 12)
number of horizontal cracks(‘splitting’) within the compressive zoneat load step 13, whichcauses a loss in the overall stiffness of the slab. It appears thatthe latter prediction of extensive ‘splitting’is unrealistic, since such behaviour has notbeen reportedastypical of slabbehaviour.” Besides, it is worth noting that such prediction of cracking coincides with the prediction of de Borst and NautaI3 by means of an axisymmetric analysis with full integration (serendipity 8-nodefinite elements with 3 X 3 Gauss points), but does not occur by means of an axisymmetric analysis with underintegration” (see Fig. 9, 8-node finite elements with 2 X 2 Gauss points). Therefore, it appears that the above prediction of splitting relates to the overly rigid nature of fully-integrated elements (in this case, the Lagrangian element for which such behaviour was not observed in the earlier objectivity study’)rather than to actual slab behaviour; thus it seems that the use of the underintegrated serendipity elements would have been preferable, but for the additional computational resources required, as mentioned earlier. Finally, the crack pattern of the last performed iteration (load step ‘ 777 ’) shows that divergence takes place as aresult of a local mechanismin the zone of the concentrated load, which occurs before yielding of the reinforcement. (For a more detailed explanation of the punching-failure mechanism in slabs, see the 2-D study in reference 12.)
Discussion of results and conclusions 14. The three case studies that were analysed numerically herein, combined with the previous three case studies presentedin Part 1,’ cover a sufficiently wide range of structural-configurationtypes(includingbothplainand reinforcedconcrete elements) to enable (at least) tentative conclusions to be drawn as to its generality. (Additional examples, involving more particular types of structure, where somewhat greater care might need to be exercised with the FE modelling, are also a ~ a i l a b l e and , ~ will be published in due course in the relevant specialist literature.) Table 2 shows a summary comparison between predicted and actual collapse loads. It will be recalled that the predictions in the table correspond to runs that incorporated those factors which led to the most stable and accurate predictions in the earlier objectivity study reported in Part 1: i.e. the single-crack procedure, the NR-plus iterative method and either the underintegrated 20-node or the 27-nodefinite elements. 15. It may be seen that the agreement of the predictions with the experimental data is within 3-10%. Furthermore, all the predicted typesof failure (i.e. brittle or ductile) are in good agreement with the tests. Considering next the predictions of 551 Downloaded by [ Heriot-Watt University Library] on [19/11/15]. Copyright © ICE Publishing, all rights reserved.
G O N Z A L E Z V I D O S A , KOTSOVOS
A N D PAVLOVIC
Table 2. Comparison between predicted and experimental failure loads for six structural elements modelled in present two-paper series*
Structural element
Failure load: analysis/experiment
PC prism under strip loading PC prism under patch loading RC beam failing in flexure RCbeam OA-l failing in shear RCbeam A-l RC slab failing in punching
1.10
1.03 1.03 0.90 0.96 0.95
* The numerical tests wererun on a UNIX machine rated at 3 MWetstnes/s; the run times for the six case studies were (respectively) approximately:1 h 12 min; 2 h 24 min; 3 h 47 min; 8 h 35 min; 9 h 52 min; 14 h 31 min. (It should be noted that the particular version of FINEL used is very disk IjO intensive on account of swapping; therefore, the run times given might be smaller on a machine with more RAM memory.) crack patterns, it may also be concluded that there is good agreement between modelling and experimental observations. Nevertheless, itshould be borne in mind that the crack patterns represent only rough indications of actual cracking, an implicit limitation of the smeared modelling of the phenomenonadopted herein. Finally, with regard to the loadcieflexion curves, the analyses involving a fair discretization of the full depth of the structural element (i.e. the RC beam failing in flexure (see Part l), and theRC slab, but ignoring beams OA-l (see Part 1) and A-l that possess large cover) indicate that the model tends to overestimate moderately the actual deflexions, which might be explained in terms of the ignoring of the ‘ tension-stiffening’ effect. However, it should be noted that the overestimates are far from being as large as those reported by means of simplified layered analyses that ignore such effects.14 16. Thistwo-paperreportonthe 3-D FE modelling of concrete structures should not beviewedmerely as a listing of a series of successfully-conducted analyses on various structural forms. (For some of which, incidentally, 3-D modelling is mandatory: either because full triaxial effects are relevant even though the problem might appear to be amenable to 2-D analysis4.g. the PC prism under strip loading-r simply because the geometry of the problem cannot be reduced to 2-D treatment4.g. theRC slab that exhibits punching failure.) In addition, the main features of the thinking behind the model itself should be stressed. It is this thinking, in fact, which has enabled a generally-applicable analytical methodology to be developed for arbitrary structures instead of the usual ‘tuning’ of a model to specific structural types and/or experimental data, with retuning’ of parameters necessary as soon as other problems are tackled. Accordingly, in the past, studies of the general validity of proposed non-linear models for concrete structures have rarely been reported,the reason for this, usually, being their limited success. Instead, most published work has focused on therole of various factors believed to affect analytical predictions (such as tension stiffening, aggregate interlock, strain softening, FE mesh, etc.), with the result that a large number of these factors are L
558
Downloaded by [ Heriot-Watt University Library] on [19/11/15]. Copyright © ICE Publishing, all rights reserved.
3-D MODEL FOR STRUCTURAL CONCRETE: PART
2
regarded as key parameters for the FE modelling of concrete. What is surprising is that such factors have received much more attention than the inclusion of the feature that is actually of paramount importance in the successful modelling of concrete structures,namely the triaxial properties of concrete at the material level. In the present work, on the other hand, emphasis is placed on a proper quantitative formulation-based on triaxial test data-f the stressstrain relationships and of the failure envelope under static loading. Therefore, the resulting FE model incorporates the main properties of material concrete: the large effect of the confining stresses on the strength of the material; the sudden loss of load-carrying capacity beyond peak-stress levels; and the very sharp decrease in shear stiffness under increasing loading. In addition, the FE model formulation requires only the specification off, ,which, besides being the only readily available (and understood) parameter in practical design, avoids the subjectivity of assigning other material parameters which are rarely measured (e.g. initial Young’s modulus, uniaxial tensile strength, fracture energy, etc.) and for which the experimental scatter is large (certainly when compared to that off,). Although a second material parameter, p, is also required (its justification in the present model being of a numerical, rather than a physical, nature), its value may safely befixed at 0.1 (despite the usual relative insensitivity of predictions to p values between 0.1 and 0.5*). Since most mix-design methods are based on achieving a specific value off, , the present numerical procedure may beused to predict the behaviour of structures of unknown experimental response, the actual behaviour of which could, if required, be confirmed a posteriori by means of a restricted series of tests. The FE model thus provides a potentially reliable basis for the analysis and design of complex structural members. 17. With regard to the basic mode of failure of structural concrete, all the 3-D case studies confirmed previous 2-D numerical predictions in that the material failure envelope has always been attained in tension (i.e. at least one principal stress is tensile), with no (fully) compressive failures ever detected for any of the case studies. Therefore, the inclusion of strain-softening branches in compression is irrelevant from a structural viewpoint, even were these actually to exist. This finding also suggests that even the formal inclusion of a failure criterion in compression (i.e. all principal stresses are compressive) may be regarded as irrelevant. The reason for this failure type becomes clear on recalling the extremely rapid increase in lateral expansion of a concrete specimen as the peak compressive stress is approached, as was stressed in reference 1. A direct consequence is the setting up of tensile stresses in regions of a structure which are immediately adjacent to regions of maximum compressive stresses. As a result, the latter (compressive) stresses (usually deemed to be critical in compression zones) can never, in fact, reach their peak (‘ultimate’) values since earlier tensile failure in the orthogonal direction occurs. This explains, for example, the sudden horizontal crackingin the compressive region of flexural members thought to exhibit ‘(compressive)concrete failure’. More generally, it provides the theoretical basis for the well-known observation, often made by experienced designers, that concrete (in compressive zones) always failsin tension.
Acknowledgements 18. The work is part of the ‘ C O I N 4 o n c r e t e offshore in the nineties’ managed programmepromoted by theMarine Technology Directorate, spon559 Downloaded by [ Heriot-Watt University Library] on [19/11/15]. Copyright © ICE Publishing, all rights reserved.
G O N Z A L E Z V I D O S A , KOTSOVOS A N D P A V L O V I C sored jointly by the Science and Engineering Research Council, Department of Energy and Offshore Industry, managed by the London Centre for Marine Technology. The first Author also expresses his gratitude to the Bank of Bilbao, the British Council, and the Valencian Ministry of Culture for financial support throughout this project.
References 1. G O N Z ~ L VIDOSA EZ F. et al. Three-dimensional non-linear finite-element model for structural concrete. Part 1: main features and objectivity study. Proc. Instn Ciu. Engrs, Part 2,1991,91, Sept., 517-544. 2. NIYOGI S. K. Concrete bearing strength-support, mix, size-effect.J . Struct. Diu. Am. Soc. Ciu. Engrs, 1974, 100(8), 1685-1702. 3. KOTSOVOS M. D. and NEWMAN J. B. Effect of boundary conditions upon the behaviour of concrete under concentrations of load. Mug. Concr.Res., 1981,331 16), 161-170. 4.BRESLER B. and SCORDELIS A. C. Shear strength of reinforced concrete beams. J . Am. Concr. Inst.,1963,60(1), 51-74. 5. G O N Z ~ L EVIDOSA Z F. Three-dimensionalfinite element analysis of structural concrete under static loading. Imperial College, University of London, 1989, PhD thesis. 6. CEDOLIN L. and DEIPOLIS. Finite element studies of shear-critical R/C beams. J . Engng Mech. Diu. Am. Soc. Ciu. Engrs, 1977,103(3),395410. 7. OTTOSEN N. S. 2-D finite element analysis of massive RC structures. J . Struct. Diu. Am. Soc. Civ. Engrs, 108(8), 1874-1883. 8. B~DARD C. and KOTSOVOS M. D. Fracture processes of concrete for NLFEA methods. J . Struct. Engng Am. Soc. Ciu. Engrs, 1986,112(3),573-587. 9. BALAKRISHNAM S. and MURRAY D.W. Prediction of response of concrete beams and panels by nonlinear finite element analysis. Proc. IABSE Colloq. on Computational Mechanics of Concrete Structures-Advances and Applications, Delft University Press, Delft, 1987,393-404. 10. BBDARDC. Non-linear Jinite element analysis of concrete structures. Imperial College, University of London, 1983, PhD thesis. 11. ELSTNER R. C. and HOGNESTADE. Shearing strength of reinforced concrete slabs. J . Am. Concr. Inst., 1956,53(1), 29-58. 12. G O N Z ~ L E Z VIDOSA F. et al. Symmetrical punching of reinforced concrete slabs: an analytical investigation based on nonlinear finite element modeling. J . Am. Concr. Inst., 1988,85(3),241-250. 13. DE BORST R. and NAUTAP. Non-orthogonal cracks in a smeared finite element model. Engng Computations, 1985,ql). 3546. 14. LINC. S. and SCORDELIS A. C. Nonlinear analysis of RC shells of general form. J . Struct. Diu. Am. Soc. Civ. Engrs,1975,101(3),523-538.
560 Downloaded by [ Heriot-Watt University Library] on [19/11/15]. Copyright © ICE Publishing, all rights reserved.