PHYSICS OF FLUIDS 23, 123303 (2011)
Three-dimensional numerical simulation of drops suspended in Poiseuille flow at non-zero Reynolds numbers Amireh Nourbakhsh, Saeed Mortazavi,a) and Yaser Afshar Department of Mechanical Engineering, Isfahan University of Technology, 84156-83111 Isfahan, Iran
(Received 10 August 2011; accepted 3 November 2011; published online 7 December 2011) A finite difference=front tracking method is used to study the motion of three-dimensional deformable drops suspended in plane Poiseuille flow at non-zero Reynolds numbers. A parallel version of the code was used to study the behavior of suspension on a reasonable grid resolution (128 ! 128 ! 128 grids). The viscosity and density of drops are assumed to be equal to that of the suspending medium. The effect of Capillary number, the Reynolds number, and volume fraction are studied in detail. It is found that drops with small deformation behave like rigid particles and migrate to an equilibrium position about half way between the wall and the centerline (the Segre-Silberberg effect). However, for highly deformable drops there is a tendency for drops to migrate to the middle of the channel, and the maximum concentration occurs at the centerline. The concentration profile obtained across the channel is in agreement with that measured by Kowalewski (T. A. Kowalewski, “Concentration and velocity measurement in the flow of droplet suspensions through a tube,” Exp. Fluids 2, 213 (1984)) experimentally for viscosity ratios less than or equal to one. The effective viscosity of suspension decreases with Capillary number in agreement with the creeping flow limit. Also, the effective viscosity increases with the Reynolds C 2011 American Institute of Physics. [doi:10.1063/1.3663565] number of the flow. V
I. INTRODUCTION
The flow of suspensions of deformable particles, such as drops, cells, and capsules has been a matter of interest for many years. The flow of slurries, microfluidic systems, oil recovery by chemical flooding, advanced materials processing, waste treatments, and food processing are typical application of these flows. In these applications, it is often necessary to predict or manipulate the rheology of suspensions. The rheological properties of suspensions depend on a number of parameters including the volume fraction, initial spatial distribution, particle size distribution, the structural constitution, and associated mechanical properties of the interfaces. The dynamic interaction of these factors determines the suspension microstructure, from which the macroscopic rheological properties develop. Predicting the rheological behavior of suspensions has been a longstanding challenge in continuum and statistical mechanics. The migration of dilute suspensions of neutrally buoyant solid particles in pipe flow was first observed by Segre and Silberberg1,2 at finite Reynolds numbers. They found that the particles migrate away from both the wall and the centerline and accumulate at a certain equilibrium position about 0.6 times the tube radius. The remarkable Segre-Silberberg effect has been verified by many experimental works. For example, Goldsmith and Mason3 observed that a rigid particle stayed at its initial radial position at very small Reynolds numbers and migrated to intermediate positions at finite Reynolds numbers. While experiments of Goldsmith and Mason used mostly a single drop and dilute suspensions, Kowalewski4 conducted experiments on concentrated suspension of drops and measured the concentration and velocity profiles a)
Electronic mail:
[email protected].
1070-6631/2011/23(12)/123303/11/$30.00
of droplet suspensions flowing through a tube. An experimental study of the migration of dilute suspensions of particles in Poiseuille flow in a wide range of Reynolds numbers (67-1700) was performed by Matas et al.5 They extended the results of Segre and Silberberg and showed that the tubular pinch effect in which particles accumulate is moved toward the wall as the Reynolds number increases. Several authors have simulated detailed motion of random and ordered suspensions numerically. Zhou and Pozrikidis6 simulated the pressure-driven flow of a periodic suspension of drops by a boundary integral method and showed that when the viscosity of drops is the same as that of the suspending fluid, the drops migrate toward the centerline of the channel. A single drop with a viscosity ratio of 10 moves to an equilibrium position at about halfway between the wall and the centerline. Nott and Brady7 simulated the pressure-driven flow of a non-Brownian suspension at zero Reynolds number using Stokesian Dynamics. They indicated that the particles gradually migrate toward the centre of the channel, resulting an inhomogeneous concentration profile, and a blunting of the velocity profile. Simulations of a concentrated suspension of several three-dimensional drops in a linear shear flow have been conducted by Loewenberg and Hinch.8 They observed a shear thinning behavior for the suspension, and in contrast to rigid particles, the viscosity of the emulsion weakly increased with volume fraction. Threedimensional numerical simulations on the motion of a large number of deformable cells in micro channels were presented by Doddi and Bagchi9 by an immersed boundary method. They analyzed the three dimensional trajectories and velocity fluctuations of individual cells in the suspension. Results of dynamic simulations of the pressure-driven flow of a two-dimensional suspension in a channel confined
23, 123303-1
C 2011 American Institute of Physics V
123303-2
Nourbakhsh, Mortazavi, and Afshar
between two parallel walls were considered by Li and Pozrikidis.10 They illustrated the effect of the Capillary number and viscosity ratio on the distribution of drops across the channel width and the effective viscosity of suspension. Feng, Ho, and Joseph11,12 conducted a two-dimensional finite element simulation of the motion of a solid particle in a Couette and a Poiseuille flow at finite Reynolds numbers. They observed that a neutrally buoyant particle exhibits the Segre-Silberberg effect in Poiseuille flow. Mortazavi and Tryggvasson13 used a finite-difference=front tracking method to study the motion of two- and three-dimensional drops suspended in pressure-driven channel flow at finite Reynolds numbers. They observed that in the limit of a small Reynolds number, the motion of the drop depends strongly on the viscosity ratio. At a higher Reynolds number, the drop moves to an equilibrium position about halfway between the centerline and the wall or it undergoes oscillatory motion. The motion of a neutrally buoyant three-dimensional drop between two parallel plates has been simulated by Nourbakhsh and Mortazavi.14 They found that a neutrally buoyant drop migrates to an equilibrium lateral position about halfway between the wall and the centerline at finite Reynolds numbers. Bayareh and Mortazavi15 presented results of simulation of cross-stream migration of a drop in simple shear flow at finite Reynolds numbers. They showed that a drop migrates to the centerline of the channel in a shear flow. The motion of two-dimensional deformable drops suspended in a linear shear flow at non-zero Reynolds numbers was studied by Mortazavi et al.16 They studied the lateral migration of a drop and observed that at a relatively high Reynolds number and small deformation, the drop migrates to an equilibrium position, which is a little off the channel centerline. They also simulated the suspension of 36 drops and found that suspension of drops at finite Reynolds numbers exhibits a shear thinning behavior. Bayareh and Mortazavi17 simulated the collision of two equal-size drops in an immiscible phase undergoing a shear flow. The size and vertical distribution of drops in dispersed liquid-liquid pipeline flows were studied experimentally by Lovick and Angeli.18 They measured drop velocities at different locations in a pipe cross section and observed that the mixture velocity did not affect the drop size of either phase significantly. Here, we present simulations of suspensions of threedimensional deformable drops in a periodic channel at finite Reynolds numbers. The simulations yield information on several aspects of the flow, discussing the effects of Capillary number, the Reynolds number, and volume fraction. 27 drops are suspended in a 3 by 3 by 3 arrangements inside the channel. Drops are initially organized as a regular array and their relative positions are slightly perturbed. The relative size of drops are f ¼ 0:121 and f ¼ 0:138 for volume fractions; / ¼ 0:2 and / ¼ 0:3, respectively.
Phys. Fluids 23, 123303 (2011)
two flat plates in the z direction. The height, depth, and length of the channel are the same. In absence of drops, the flow is a fully-developed parabolic flow and is driven by a constant pressure gradient. We decompose the pressure gradient in the channel as (Mortazavi and Tryggvason13) rp ¼ rpo þ rp0 ;
(1)
where rpo is the external specified pressure gradient and rp0 is the perturbation pressure gradient to be computed as part of the solution. Gravity is neglected and buoyancy effects are absent. B. Governing equations
The governing equations for the flow of multi-fluid systems are the Navier-Stokes equations. In conservative form they are @qu þ r:quu ¼ $ rP þ qfþr:lðruþrT uÞ @t ð þ rk0 n0 db ðx $ x0 Þds0
(2)
where, u is the velocity, P is the pressure, q and l are the discontinuous density and viscosity fields, respectively. r is the surface tension coefficient, f is a body force and the surface tension force is added at the interface. The term db is a twoor three-dimensional d function constructed by repeated multiplication of one-dimensional d functions. j is the curvature
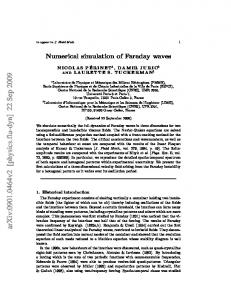
II. GOVERNING EQUATIONS AND NUMERICAL METHOD A. Problem setup
The geometry of the flow is shown in Figure 1. The motion of drops is studied in a channel that is bounded by
FIG. 1. (Color online) The geometry for the simulation of drops in a channel.
123303-3
Three-dimensional numerical simulation
Phys. Fluids 23, 123303 (2011)
for two-dimensional flow and twice the mean curvature for three-dimensional flows. n is a unit vector normal to the front, x is the position in Eulerian coordinate, and x0 is a Lagrangian representation of the interface. The Navier-Stokes equations are solved by a secondorder projection method using centered differences on a fixed staggered grid. Both the drop and the ambient fluid are taken to be incompressible, so the velocity field is divergence free r:u ¼ 0:
(3)
Equation (3), when combined with the momentum equation, leads to a non-separable elliptic equation for the pressure. If the density is constant, the elliptic pressure equation is solved by fast Poisson solver (FISHPACK), but when the density of the drop is different from the suspending fluid, the equation is solved by a multigrid method (Adams19). Equations of state for the density and the viscosity are Dq ¼ 0; Dt
Dl ¼ 0: Dt
(4)
Equation (4) states that the density and the viscosity of a fluid particle remain constant. C. Boundary conditions
The boundary condition on the plates is the no-slip condition. The domain is periodic in the x- and y-directions. Normal stress shows a jump across the interface by surface tension and tangential stresses are continuous across the surface of drop.
level-set method. The volume-of-fluid method uses a marker function. The main difficulty in using VOF method is the maintenance of a sharp boundary between two phases and the computation of the surface tension. The level-set method defines the interface by a level-set function, but this approach has some difficulties in preserving the mass conservation. There are recent efforts in conserving mass in levelset method (see for example Gorokhovski and Herrmann20). Here, a finite difference/front tracking method is used. This approach was described in detail by Unverdi and Tryggvason21,22 and Tryggvason et al.23 and only a brief outline is given here. The Navier-Stokes equations are solved by a second-order projection method using centred differences on a fixed, staggered grid. To keep the boundary between the drop and the ambient fluid sharp and to accurately compute the surface tension, the boundary is represented by connected marker points (the front) that are advected by the flow velocity, interpolated from the fixed grid. To maintain the front resolution, new marker points are inserted when the distance between points becomes too large. Points are also deleted if the distance between two points becomes smaller than a prescribed value. The singularities at the front (density and viscosity gradients and surface tension) are approximated on the fixed grid by smooth functions with a compact support. The density and viscosity fields are reconstructed at each time step by integrating the smooth grid delta function, after the front has been moved, and the body force due to surface tension is added to the nodal values of the discrete NavierStokes equations. As drops move and deform, the density and the viscosity need to be updated. This is done by solving a Poisson equation for an indicator function IðxÞ such that
D. Dimensionless parameters
The governing non-dimensional numbers are as follows: the ratio of the viscosity of the drop fluid to the suspending medium k ¼ li =lo , the density ratio a ¼ qi =qo (the viscosity and density of the drop liquid are denoted by li and qi , respectively, and the suspending fluid has viscosity lo and density qo ), the ratio of the radius of the drop to channel height f ¼ a=H, the volume fraction u, the bulk Reynolds number is defined in terms of the undisturbed channel centerline velocity (Uc ), and the channel height, Reb ¼ qo Uc H=lo , the particle Reynolds number is defined as Rep ¼ qUc a2 =lH, the Capillary number describes the ratio of the viscous stress to the interfacial tension, Ca ¼ Uc lo =r. The effective viscosity of suspension is defined as leff ¼ lo Qp =Q, where Qp is the volume flow rate through the channel without drops (Qp ¼ 2Uc H=3), and Q is the actual flow rate through the channel subject to the same pressure gradient. E. Numerical method
Different numerical methods have been developed for simulating flows with interfaces. These methods can be divided into two groups, depending on the type of grids used: moving grid and fixed grid. Two important approaches of fixed-grid methods are the volume-of-fluid (VOF) and
qðxÞ ¼ qo þ ðqi $ qo ÞIðxÞ;
(5)
lðxÞ ¼ lo þ ðli $ lo ÞIðxÞ:
(6)
A new version of the code written for parallel machines was used in the current study. The parallelization method combines a domain decomposition approach for the field or Eulerian quantities and a master-slave approach for the front, where each front has a master processor that gathers data from the other (slave) processors which share this front. Unlike the serial code, there is not one single linked list for all the fronts; rather, each front is represented by its own linked list. III. RESULTS A. Resolution test and validation
We investigate the dependence of the results to grid resolution by considering three grid resolutions (64 ! 64 ! 64 128 ! 128 ! 128, and 256 ! 256 ! 256 grid points). 27 drops with a relative size of f ¼ 0:121 are initially released inside the channel. Drops are placed in a regular array (3 by 3 by 3) and their relative positions are slightly perturbed. The flow parameters are: Reb ¼ 20, Ca ¼ 0:05, a ¼ k ¼ 1, and / ¼ 0:2. Figure 2 shows the relative viscosity of suspension versus time at three grid resolutions. There is a slight change in the relative viscosity when the grid is refined from the coarse grid to intermediate one. However, the difference
123303-4
Nourbakhsh, Mortazavi, and Afshar
FIG. 2. The relative viscosity versus non-dimensional time at three different grid resolutions.
Phys. Fluids 23, 123303 (2011)
between the relative viscosity for the two fine grids is almost negligible. This is an indication of the convergence of the results as the grid is refined. Figure 3 presents the lateral positions of the drops versus time for three grid resolutions. Similar to what observed in Figure 2, the paths of drops slightly change from the coarse grid to intermediate grid. But, the paths for the intermediate and fine grids are almost the same. To validate the results of the current study, a case with low Reynolds number is considered, and it is compared with that considered by Doddi and Bagchi9 for zero Reynolds number. The steady state velocity profile is plotted in Figure 4. Other flow conditions (Reb ¼ 20) as well as the Newtonian velocity profile are also plotted for comparison. The steady state velocity profile obtained in the present study for Reb ¼ 1 and Ca ¼ 0:6 is close to that found by Doddi and Bagchi9 at zero Reynolds number. Our results show that the relative viscosity converges to that predicted by numerical simulations preformed in the zero Reynolds number limit.
FIG. 3. (Color online) The lateral position of the drops versus non-dimensional time for three grid resolutions.
123303-5
Three-dimensional numerical simulation
Phys. Fluids 23, 123303 (2011)
FIG. 4. Average velocity profiles and the corresponding Newtonian velocity profile.
B. Effect of deformation
The effect of deformation on the behavior of suspension is investigated by changing the Capillary number while other non-dimensional numbers are fixed. Different flow conditions are examined. Figure 5 depicts three snap shots of drops in the channel for two Capillary numbers (Ca ¼ 0:05, 0:8). Other flow parameters are: Reb ¼ 40, k ¼ 1, a ¼ 1, and / ¼ 0:3. Drops at large Capillary number are highly deformable. As the Capillary is raised or the surface tension is reduced, drops become more deformable in the wall regions where the shear rate is large. The distribution of drops across the channel was examined by dividing the channel width into equal slices. The number of drops that lie in each slice are then counted and divided by the total number of drops. This density distribution is also averaged in time after an initial transient period. Figure 6 presents the density distribution of drops across the channel for two Reynolds numbers (Reb ¼ 20, 40) and / ¼ 0:2. Also three Capillary number were examined (Ca ¼ 0:05,0:5, and 0:8). At a low Capillary number (Ca ¼ 0:05) the density distribution shows two peaks in the wall regions. This behavior is observed for the two Reynolds numbers examined. This is an inertia effect that has been addressed by Segre and Silberberg1,2 for the flow of suspensions of solid spheres at finite Reynolds numbers. In other words, particles migrate to an equilibrium position at about half way between the centerline and the wall when the Reynolds number is not zero. The effect was further investigated by Feng et al.12 and Mortazavi and Tryggvason13 by numerical simulations. The distribution of drops across the channel changes when the Capillary number is raised (Ca ¼ 0:8). For both Reynolds numbers (20, 40), a maximum peak appears in the center of the channel. And, the peaks in the wall regions reduce in magnitude. This behavior shows that for highly deformable drops, there is a tendency for drops to migrate to the center of the channel. As a result, the maximum concentration occurs at the centerline. This effect is
FIG. 5. (Color online) Three snapshots of drops for Capillary number Ca ¼ 0.05 (left) and Capillary number Ca ¼ 0.8 (right) at Reb ¼ 40 and / ¼ 0.3.
mainly due to deformation of drops. It has been observed by many investigators. Chan and Leal24 predicted that deformable drops migrate to the center of channel in Couette and Poiseuille flow at zero Reynolds number using a perturbation theory. The effect was further studied by Zhou and Pozrikidis6 and Mortazavi and Tryggvason13 by numerical simulations. Here, even the flow is at finite Reynolds numbers, the lateral force due to deformation suppresses the inertia effect (Segre-Silberberg effect) and moves the drops to the center of channel. Thus, the concentration of drops at the centerline becomes maximum. The effect is observed at both Reynolds numbers examined (Reb ¼ 20, 40). We compare the concentration profiles obtained here with that measured by Kowalewski4 in Figure 7. Kowalewski4 observed that for viscosity ratios less than one, the concentration of drops is maximum at the tube axis. However, for highly viscous drops the concentration of drops becomes maximum in a region close to the tube wall which is a characteristic of solid particles (Figure 7). The flow conditions in experiments by Kowalewski4 as well as that shown by the current study are summarized in Table I. The results obtained
123303-6
Nourbakhsh, Mortazavi, and Afshar
Phys. Fluids 23, 123303 (2011)
FIG. 7. Comparison of droplet concentration profiles measured by Kowalewski4 and the current work.
drops inside the channel except that r was replaced by the distance from the centerline of channel. The fluctuation energy of the flow is plotted across the channel width for different Capillary numbers in Figure 8. The fluctuation energy was computed from hu0 u0 ðzÞi ¼
"X N X M j¼1 i¼1
þ
FIG. 6. The density distribution of drops across the channel for the simulation of 27 drops with three different Capillary numbers.
here are in qualitative agreement with experiments of Kowalewski.4 We note that the viscosity ratio in the current study (k ¼ 1) is different from that considered by Kowalewski4 (k ¼ 0:07). Also the Capillary numbers reported in Table I for experiments of Kowalewski4 are approximate values since the composition (density) of suspending fluid was not known precisely. The Capillary numbers are based on the average velocity inside the channel in Table I. The concentration profile inside the tube in experiments by Kowalewski4 was obtained from "ð R #$"ð R # cs u2prdr u2prdr ; (7) c¼ 0
0
where cs is the local concentration of drops inside the tube. We used a similar formula to compute the concentration of
N X M X j¼1 i¼1
%
N X M &2 X ui;j ðzÞ $ uavg ðzÞ þ v2i;j ðzÞ
#$ 2 wi;j ðzÞ ðM ! NÞ:
j¼1 i¼1
(8)
Here ui;j is axial velocity, vi;j and wi;j are the velocity components in the y- and z-directions, respectively, and uavg ðzÞ is the average axial velocity at a distance z from the lower wall. M and N are the number of grid points in x- and ydirections, respectively. This fluctuation energy is averaged over time after an initial transition period. Following Nott and Brady,7 the fluctuation energies are scaled using the square of the average shear velocity ðauavg =HÞ. The fluctuation energy is larger for more rigid drops. Drops that are less deformable displace more across the channel when they interact. More deformable drops slide past each other more easily. As a result, the fluctuation energy enhances when TABLE I. The flow conditions in experiments by Kowalewski (Ref. 4) and the current study.
----______ Current work
k
a!
a=D
/
Re
Reb
Ca
0.07 7.2 1
0.05 0.02 0.242
0.025 0.01 0.121
0.28 0.2 0.2
12 30 20
24 60 40
0.07 0.08 0.5
123303-7
Three-dimensional numerical simulation
Phys. Fluids 23, 123303 (2011)
deformable drops is less inside the channel and the flow rate becomes larger for more deformable drops. C. Effect of the Reynolds number
FIG. 8. The variation of the fluctuation energy across the channel width for simulations with different Capillary numbers.
We present results that show the effect of the Reynolds number on the concentration of drops across the channel and the effective viscosity of suspension. Two Capillary numbers are examined (Ca ¼ 0:05, 0:8). Figure 10 shows the concentration of drops across the channel for three Reynolds numbers (Reb ¼ 10, 20, and 40). For almost rigid drops (Ca ¼ 0:05), two peaks are observed close the channel walls. The flow is dominated by inertia and deformation plays no significant role. The peaks get larger as the Reynolds number is raised. For highly deformable drops (Ca ¼ 0:8), the maximum peak is at the centerline. Also the peaks increase in magnitude as the Reynolds number increases (Figure 10(b)) which is an inertia effect. The relative viscosity of suspension is plotted in Figure 11 for different Reynolds numbers and Capillary
Capillary number is reduced. The fluctuation energy is larger in the wall regions where the shear rate is large. It is minimum at the center of channel where the shear rate is almost zero, and the interaction between drops is weak. The trend observed here for the fluctuation energy is similar to that obtained by Nott and Brady7 in their numerical simulations of solid particles at zero Reynolds number. In summary, the results obtained here show that the concentration profiles are dominated either by the inertia of the flow (for nearly spherical drops) which drives the drops to wall regions, or by the deformation of drops (high Capillary numbers) which moves the drops to the channel centerline. Figure 9 presents the relative viscosity of suspension as a function of Capillary number. Different Reynolds numbers are examined. The relative viscosity decreases with Capillary number. This is basically a deformation effect. More deformable drops show less resistance against the flow compared to rigid ones. As a result, the blockage developed by more
FIG. 9. The relative viscosity versus Capillary number at three Reynolds numbers.
FIG. 10. The density distribution of drops across the channel for the simulation of 27 drops with three different Reynolds numbers.
123303-8
Nourbakhsh, Mortazavi, and Afshar
FIG. 11. The relative viscosity versus non-dimensional time at different Reynolds numbers.
numbers. The effective viscosity increases with the Reynolds number. This is mainly due to interaction between drops that is pronounced as the Reynolds number increases. The figure also shows a case with low Reynolds number (Reb ¼ 1) which is an indication of small inertia limit. The fluctuation energy of the flow is plotted across the channel width for different Reynolds numbers in Figure 12. As expected the fluctuation energy increases as the Reynolds number is raised. Since the flow is simulated at finite Reynolds numbers, the inertia of the flow is included in the simulations. As a result, we observe an increase in the fluctuation energy (suspension temperature) with the Reynolds number. It should be pointed out that the fluctuation energy across the channel is due to random interaction of drops with each other. These fluctuations also do exist in the zero Reynolds number limit. These fluctuations have been observed and computed by Nott and Brady7 in pressure-driven flow of suspensions at zero Reynolds number for solid particles. In the current study, since drops are deformable, the fluctuation
Phys. Fluids 23, 123303 (2011)
energy is also affected by drop deformation. The deformation of drops weakens the interaction between drops, and reduces the fluctuation energy compared to rigid particles. We also present the Reynolds stresses developed in the flow of suspension. The Reynolds stresses are plotted as a function of time in Figure 13. The Reynolds stresses are scaled by the square of the average shear velocity ðauavg =HÞ. The Reynolds stresses are plotted for different Reynolds numbers. Results show that the Reynolds stresses have reached a nearly stationary state. The normal components of the Reynolds stresses (Rxx, Ryy, Rzz) obtain positive mean values. They also enhance as the Reynolds number increases. The off-diagonal components (Rxy, Ryz, and Rxz) oscillate around zero and they are nearly unaffected by the Reynolds number. The average drop deformation (Taylor deformation parameter) is plotted in Figure 14 for different Reynolds numbers. The Taylor deformation parameter is defined as D ¼ ðL $ bÞ=ðL þ bÞ;
(9)
where L and b are the lengths of the major and minor axes of the drop, respectively. The Capillary number is the same for all cases. One can see that the drop deformation is nearly the same for all Reynolds numbers. As a result, the proper non-dimensional number for the interfacial tension is the Capillary number. (There is a slight increase in amplitude of oscillations.) D. Effect of the volume fraction
The effect of volume fraction on the behavior of suspension was studied by considering two volume fractions (/ ¼ 0:2, 0:3). Other flow conditions are: Reb ¼ 40, Ca ¼ 0:8. The volume fraction was raised by increasing the drop size while the number of drops was fixed (27 drops). Figure 15 presents the relative viscosity for two volume fractions. The effective viscosity increases with the volume fraction. The behavior is similar to that observed by Nott and Brady for suspension of solid particles at zero Reynolds number. Here, the dependence of effective viscosity with volume fraction is weaker than suspension of solid particles. The effective viscosity has increased by eight percent when the volume fraction is raised by fifty percent. E. Cluster formation
FIG. 12. The variation of the fluctuation energy across the channel width for simulations with different Reynolds numbers.
We perform a quantitative analysis on cluster formation in flow of suspension inside the channel. The study is limited to the case where the drops are nearly spherical (low Capillary number). The methodology is the same as that used by Durlofsky and Brady.25 For nearly spherical drops, the separation distance between two drops is measured, and if this separation is smaller than a prescribed value, the particles are marked as belonging to the same cluster. The effect of Reynolds number on cluster formation is examined in Figure 16. The other flow conditions are: Ca ¼ 0:05, / ¼ 0:2 and the separation distance is assumed to be: d=R ¼ 0:02. The percentage of drops that belong to a cluster is plotted as a function of the number of drop in a cluster
123303-9
Three-dimensional numerical simulation
Phys. Fluids 23, 123303 (2011)
FIG. 13. The Reynolds stresses as a function of non-dimensional time for different Reynolds numbers.
FIG. 14. The average drop deformation (D ¼ (L-b)=(Lþb)) versus nondimensional time at three different Reynolds numbers, L and b are the lengths of the major and minor axes of the drop, respectively.
FIG. 15. The relative viscosity versus non-dimensional time at two volume fractions.
123303-10
Nourbakhsh, Mortazavi, and Afshar
FIG. 16. Percentage of drops that belong to a cluster as a function of the number of drops in a cluster for two Reynolds numbers.
(N). Comparison of the graphs for the two Reynolds numbers shows that the percentage of drops that belong to a cluster of a given size decreases with increasing the Reynolds number. For example, the percentage of drops that belong to clusters of three drops changes from 13% for Reb ¼ 20 to 9% for Reb ¼ 40. The average size of clusters is addressed by the average moment of the cluster size distribution X .X Sns ns (10) S! ¼ s
s
Here, S is the number of drops in a cluster and ns is the number of clusters containing S drops. The summation is over all possible cluster sizes. Computing this value for our simulations, we get: S!¼ 2:68 for Reb ¼ 20 and S!¼ 2:24 for Reb ¼ 40. Bayareh and Mortazavi26 performed threedimensional simulation of suspension of drops in simple shear flow at finite Reynolds numbers and obtained that the average size of clusters is S!¼ 2:48 for Reb ¼ 10, Ca ¼ 0:075 and / ¼ 0.195. One can conclude that the average cluster size is larger in Poiseuille flow compared to simple shear flow at the same flow conditions. IV. CONCLUSIONS
In the present study, a finite difference=front tracking method has been used for simulation of the motion of several three-dimensional drops suspended in plane Poiseuille flow, accounting for the effect of inertia and deformation. Very few works exist that attempt to consider interaction of multiple drops in a dense suspension. The simulations for a system of 27 drops in a periodic channel showed that nearly spherical drops gradually migrate to a location between the channel axis and the walls (the Segre-Silberberg effect), resulting in a considerably inhomogeneous distribution and a blunting velocity profile at steady state. The study of the effect of Capillary number in section 3.2 showed that Capillary number plays an important role in determining not only the magnitude, but also the direction of
Phys. Fluids 23, 123303 (2011)
the migration of the drops across the channel. The behavior of highly deformable drops is completely different from drops with small deformation. Drops with large deformation obtain a large peak in the middle of the channel, whereas nearly circular drops move to an equilibrium position about halfway between the centerline and the wall. As the Capillary number increases, the relative viscosity decreases. The presence of drops causes a blunting of velocity profile across the channel. The fluctuation energy of the flow across the channel (suspension temperature) was also computed for different flow conditions. It is of interest because it is closely related to the diffusivity of suspension. The fluctuation energy is lowest in the middle of channel where the shear rate is small and the interaction between drops is weak. It increases as one moves away from the channel centerline and becomes maximum close to the walls. It vanishes in the wall regions where no drops are present. The fluctuation energy decreases with Capillary number since the interaction between drops gets weaker as the Capillary number is raised. The effect of the Reynolds number was investigated by considering four Reynolds numbers (1, 10, 20, 40) and two Capillary numbers (0:05, 0:8). At a low Capillary number (0:05), when the Reynolds number is relatively large (Reb ¼ O(10)), the flow is dominated by inertia and the peaks in the density distribution of drops in the wall regions enhance as the Reynolds number is raised. Also for a large Capillary number (0:8), the large peak at the middle of channel enhances with Reynolds number. The fluctuation energy of the flow across the channel increases as the Reynolds number increases. The variation of the Reynolds stresses with the Reynolds number was also investigated. The normal components (Rxx, Ryy, Rzz) obtain positive values and they increase as the Reynolds number is raised. The off-diagonal components (Rxy, Ryz, and Rxz) oscillate around zero and they are nearly unaffected by the Reynolds number. Simulations performed with different volume fractions revealed that the effective viscosity of suspension is an increasing function of the volume fraction (in agreement with the creeping flow limit). However, drops deform more and orient more in the flow direction as the volume fraction increases. The analysis made on the average size of clusters in the flow of suspension showed that the average size of clusters is reduced as the Reynolds number increases. 1
G. Segre and A. Silberberg, “Behaviour of macroscopic rigid spheres in Poiseuille flow, Part 1. Determination of local concentration by statistical analysis of particle passages through crossed light beams,” J. Fluid Mech. 14, 115 (1962). 2 G. Segre and A. Silberberg, “Behaviour of macroscopic rigid spheres in Poiseuille flow, Part 2. Experimental results and interpretation,” J. Fluid Mech. 14, 136 (1962). 3 H. L. Goldsmith and S. G. Mason, “The flow of suspensions through tubes. I. Single spheres, rods and discs,” J. Colloid Sci. 17, 448 (1962). 4 T. A. Kowalewski, “Concentration and velocity measurement in the flow of droplet suspensions through a tube,” Exp. Fluids 2, 213 (1984). 5 J. P. Matas, J. F. Morris, and E. Guazzelli, “Inertial migration of rigid spherical particles in Poiseuille flow,” J. Fluid Mech. 515, 171 (2004). 6 H. Zhou and C. Pozrikidis, “Pressure-driven flow of suspensions of liquid drops,” Phys. Fluids 6, 80 (1994). 7 P. Nott and J. Brady, “Pressure-driven flow of suspensions: Simulation and theory,” J. Fluid Mech. 275, 157 (1994).
123303-11 8
Three-dimensional numerical simulation
M. Loewenberg and E. J. Hinch, “Numerical simulation of a concentrated emulsion in shear flow,” J. Fluid Mech. 321, 395 (1996). 9 S. K. Doddi and P. Bagchi, “Three-dimensional computational modeling of multiple deformable cells flowing in micro vessels,” Phys. Rev. E 79, 046318 (2009). 10 X. Li and C. Pozrikidis, “Wall-bounded shear flow and channel flow of suspensions of liquid drops,” Int. J. Multiphase Flow 26, 1247 (2000). 11 D. J. Feng, H. H. Hu, and D. D. Joseph, “Direct simulation of initial value problems for the motion of solid bodies in a Newtonian fluid. Part 1. Sedimentation,” J. Fluid Mech. 261, 95 (1994). 12 D. J. Feng, H. H. Hu, and D. D. Joseph, “Direct simulation of initial value problems for the motion of solid bodies in a Newtonian fluid. Part 2. Couette and Poiseuille flows,” J. Fluid Mech. 277, 271 (1994). 13 S. Mortazavi and G. Tryggvason, “A numerical study of the motion of drops in Poiseuille flow, Part 1: Lateral migration of one drop,” J. Fluid Mech. 411, 325 (2000). 14 A. Nourbakhsh and S. Mortazavi, “A three-dimensional study of the motion of a drop in plane Poiseuille flow at finite Reynolds numbers,” Iran. J. Sci. Technol., Trans. B: Eng. 34 (B2), 179 (2010). 15 M. Bayareh and S. Mortazavi, “Numerical simulation of the motion of a single drop in a shear flow at finite Reynolds numbers,” Iran. J. Sci. Technol., Trans. B: Eng. 33 (B5), 441 (2009). 16 S. Mortazavi, Y. Afshar, and H. Abbuspour, “Numerical simulation of two-dimensional drops suspended in simple shear flow at nonzero Reynolds numbers,” J. Fluids Eng. 133, 031303 (2011).
Phys. Fluids 23, 123303 (2011) 17
M. Bayareh and S. Mortazavi, “Binary collision of drops in simple shear flow at finite Reynolds numbers: Geometry and viscosity ratio effects,” Adv. Eng. Software 42, 604 (2011). 18 J. Lovick and P. Angeli, “Droplet size and velocity profiles in liquid-liquid horizontal flows,” Chem. Eng. Sci. 59, 3105 (2004). 19 J. Adams, “MUDPACK: Multigrid FORTRAN software for the efficient solution of linear elliptic partial differential equations,” Appl. Math. Comput. 34, 113 (1989). 20 M. Gorokhovski and M. Herrmann, “Modeling primary atomization,” Annu. Rev. Fluid Mech. 40, 343 (2008). 21 S. O. Unverdi and G. Tryggvason, “A front-tracking method for viscous incompressible multi-fluid flows,” J. Comput. Phys. 100, 25 (1962). 22 S. O. Unverdi and G. Tryggvason, “Computations of multi-fluid flows,” Physics 60 (D), 70 (1962). 23 G. Tryggvason, B. Bunner, A. Esmaeeli, D. Juric, N. Al-Rawahi, W. Tauber, J. Han, S. Nas, and Y. J. Jan, “A front-tracking method for the computations of multiphase flow,” J. Comput. Phys. 169, 708 (2001). 24 P. C. Chan and L. G. Leal, “The motion of a deformable drop in a secondorder fluid,” J. Fluid Mech. 92, 131 (1979). 25 L. J. Durlofsky and J. Brady, “Dynamic simulation of bounded suspensions of hydro dynamically interacting particles,” J. Fluid Mech. 200, 39 (1989). 26 M. Bayareh and S. Mortazavi, “Three-dimensional numerical simulation of drops suspended in simple shear flow at finite Reynolds numbers,” Int. J. Multiphase Flow 37, 1315 (2011).