remote sensing Article
Three-Dimensional Surface Displacement Field Associated with the 25 April 2015 Gorkha, Nepal, Earthquake: Solution from Integrated InSAR and GPS Measurements with an Extended SISTEM Approach Haipeng Luo 1 and Ting Chen 1,2, * 1 2
*
School of Geodesy and Geomatics, Wuhan University, 129 Luoyu Road, Wuhan 430079, China;
[email protected] Key Laboratory of Geospace Environment and Geodesy, Ministry of Education, 129 Luoyu Road, Wuhan 430079, China Correspondence:
[email protected]; Tel.: +86-27-6877-1723
Academic Editors: Cheinway Hwang, Wenbin Shen, C.K. Shum, Stéphane Calmant, Norman Kerle and Prasad S. Thenkabail Received: 8 March 2016; Accepted: 28 June 2016; Published: 30 June 2016
Abstract: Three-dimensional surface displacement field associated with the 25 April 2015 Gorkha, Nepal earthquake is derived from an integration of Interferometric Synthetic Aperture Radar (InSAR) and Global Positioning System (GPS) measurements, with an extended SISTEM (Simultaneous and Integrated Strain Tensor Estimation From Geodetic and Satellite Deformation Measurements) approach (ESISTEM) proposed in this study. In ESISTEM approach, both surrounding InSAR and GPS measurements can be used as constraints in deriving surface displacements; while only surrounding GPS measurements are used in SISTEM approach. Besides the constraints from surrounding GPS measurements, the ESISTEM approach makes surrounding InSAR measurements available for constraining the derived deformations based on surface elastic theory for the first time. From the north to the south, derived surface displacement field shows prevailing southward horizontal deformations, and gradually varied vertical deformations ranging from ´0.95 to 1.40 m within 120 km to the north of Kathmandu. This reveals that ruptures of Main Himalayan thrust (MHT) system were confined in subsurface and did not propagate to the Main Frontal Thrust (MFT) fault, in accordance with field investigation as well as geodetic and seismic studies. Relation between vertical deformations and earthquake-induced landslides is briefly discussed. Keywords: InSAR; GPS; 3D surface displacement field; ESISTEM; 2015 Gorkha earthquake
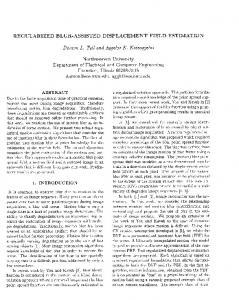
1. Introduction On 25 April 2015, a devastating MW 7.9 Gorkha, Nepal, earthquake (hereafter called the Gorkha earthquake) occurred in central Nepal along the trace of Main Himalayan Thrust (MHT) system and damaged the city of Kathmandu. This earthquake induced geohazards such as avalanches and landslides and caused more than 9000 fatalities [1–4]. Surface deformations caused by this earthquake were measured with geodetic techniques such as Interferometric Synthetic Aperture Radar (InSAR) and Global Positioning System (GPS) encompassing the deformation area. Horizontal GPS measurements show predominantly southward and slightly westward motions in regions significantly deformed (Figure 1). Vertical GPS measurements show a maximum uplift of 1.26 m at the station KKN4, and a maximum subsidence of 0.59 m at the station CHLM, both located to the north of Kathmandu [5]. As revealed by InSAR analysis [6], unlike continental earthquakes of this massive size, Remote Sens. 2016, 8, 559; doi:10.3390/rs8070559
www.mdpi.com/journal/remotesensing
Remote Sens. 2016, 8, 559
Remote Sens. 2016, 8, 559
2 of 14
2 of 14
surface investigation reveals the lack ofreveals surfacethe ruptures in surface regions significantly This was massive size, surface investigation lack of ruptures in deformed. regions significantly also confirmed with geodetic and seismic studies [7–10]. In addition, a total of 4312 coseismic andof deformed. This was also confirmed with geodetic and seismic studies [7–10]. In addition, a total postseismic landslides were mapped from satellite images [2], and reported to be [2], seemingly influenced 4312 coseismic and postseismic landslides were mapped from satellite images and reported to be by vertical deformations, mapped from the Japan Aerospace eXploration Agency (JAXA) ALOS-2 seemingly influenced by vertical deformations, mapped from the Japan Aerospace eXploration interferogram and thought to be almostand entirely vertical. three-dimensional surface displacement Agency (JAXA) ALOS-2 interferogram thought to be A almost entirely vertical. A three-dimensional field due displacement to this earthquake needed better understand theto deformation patternsthe caused by the surface field is due to thistoearthquake is needed better understand deformation Gorkha earthquake. patterns caused by the Gorkha earthquake.
Figure 1. Data coverage and tectonic setting of the Gorkha earthquake. Blue and red vectors represent Figure 1. Data coverage and tectonic setting of the Gorkha earthquake. Blue and red vectors represent observed and ESISTEM-derived displacements, respectively. Red dashed lines outline the zones with observed and ESISTEM-derived displacements, respectively. Red dashed lines outline the zones with significant landslides [2], and grey circles show distribution of landslide [11]. Thick black lines significant landslides [2], and grey circles show distribution of landslide [11]. Thick black lines represent represent the Main Frontal Thrust (MFT) [12,13]. The red star represents the epicenter of the the Main Frontal Thrust (MFT) [12,13]. The red star represents the epicenter of the earthquake, and the earthquake, and the purple square represents the city of Kathmandu. Filled triangles represent GPS purple square represents the city of Kathmandu. Filled triangles represent GPS stations CHLM and stations CHLM and KKN4; all triangles are GPS validation stations. KKN4; all triangles are GPS validation stations.
InSAR measures high-resolution earth surface displacements in satellite’s line-of-sight (LOS) InSAR measures high-resolution earth surface displacements in satellite’s line-of-sight (LOS) directions, while discrete GPS maps three-dimensional displacements. Data from these two directions, while discrete GPS maps three-dimensional displacements. Data from these two techniques techniques can be integrated to derive the three-dimensional surface displacement fields with some can be integrated to deriveA the three-dimensional displacement with some special special methods [14–17]. SISTEM (Simultaneoussurface and Integrated Strainfields Tensor Estimation from methods [14–17]. A SISTEM (Simultaneous and Integrated Strain Tensor Estimation from Geodetic and Geodetic and Satellite Deformation Measurements) approach was proposed by Guglielmino et al. [15] Satellite Deformation Measurements) approach was proposed byfor Guglielmino al. [15] based on elastic based on elastic theory. This approach works pointwisely: a specific et point, three-dimensional theory. This approach formeasurements a specific point, three-dimensional displacements can be displacements can be works relatedpointwisely: to InSAR LOS with linear equation, and can be constrained related to InSAR LOS measurements with linear equation, and can be constrained by surrounding by surrounding GPS measurements based on elastic theory; these related and constrained equations GPS on elastic theory;and these related and equations be combined can measurements be combined inbased a uniform framework solved with theconstrained weighted least squarecan (WLS) approach. The SISTEM approach has been used in derivation of ground deformations [15,18,19].
Remote Sens. 2016, 8, 559
3 of 14
in a uniform framework and solved with the weighted least square (WLS) approach. The SISTEM approach has been used in derivation of ground deformations [15,18,19]. In this study, we derive the three-dimensional surface displacement field due to the Gorkha earthquake from an integration of InSAR and GPS measurements. Possible relation from the displacement field to earthquake-induced landslides is discussed. The derivation is implemented with an extended SISTEM (ESISTEM) approach introduced in this study, which will use both surrounding InSAR and GPS measurements to constrain derived surface displacement field. 2. Methods In this section, we briefly summarize the SISTEM approach (refer to Guglielmino et al. [15] for details), and then introduce the ESISTEM approach. 2.1. SISTEM Approach p
p
p
A point P with position pxe , xn , xv q on earth surface is deformed by an earthquake, and surrounded i i i q, and by M experimental points (EPs) whose positions and displacements are pxEPs,e , xEPs,n , xEPs,v i i i pue , un , uv q, respectively, with i “ 1, 2, . . . , M. Based on the elastic theory, the estimates of displacement components Uj pj “ e, n, vq of point P can be constrained by these surrounding EPs with: (1)
uEPs “ AEPs l
where 1 is a 12 ˆ 1 vector composed of unknown parameters, T l “ rUe , Un , Uv , εee , εen , εev , εnn , εnv , εvv , ωe , ωn , ωv s , with ε and ω representing strain tensor and rigid body rotation tensor, respectively. uEPs is the vector composed of displacements of these M EPs: uEPs T “ ruEPs,e T , uEPs,n T , uEPs,v T s (2) with
T
uEPs,j “ ru1EPs,j , u2EPs,j , . . . , uM EPs,j s , pj “ e, n, vq
(3)
AEPs is a linear matrix with the form: T
AEPs “ rAEPs,e T , AEPs,n T , AEPs,v T s where T
T
T T
(4)
AEPs,j “ rpA1EPs,j q , pA2EPs,j q , . . . , pAM EPs,j q s , pj “ e, n, vq
(5)
i i i i i i AEPs,e “ r1, 0, 0, ∆xEPs,e , ∆xEPs,n , ∆xEPs,v , 0, 0, 0, 0, ∆xEPs,v , ´∆xEPs,n s, pi “ 1, 2, . . . , Mq
(6)
i i i i i i AEPs,n “ r0, 1, 0, 0, ∆xEPs,e , 0, ∆xEPs,n , ∆xEPs,v , 0, ´∆xEPs,v , 0, ∆xEPs,e s, pi “ 1, 2, . . . , Mq
(7)
i i i i i i AEPs,v “ r0, 0, 1, 0, 0, ∆xEPs,e , 0, ∆xEPs,n , ∆xEPs,v , ∆xEPs,n , ´∆xEPs,e , 0s, pi “ 1, 2, . . . , Mq
(8)
with
p
in which ∆xij “ xij ´ x j denotes the distance between point P and the ith EPs in the jth direction. In real cases, surrounding GPS measurements are used as EPs to construct the constraint Equation (1) for point P. If there are InSAR LOS measurements on this point P, a new equation can then be constructed by relating LOS measurements uPLOS to displacements on point P: uPLOS “ APLOS l where
(9)
Remote Sens. 2016, 8, 559
4 of 14
APLOS “ rSPe , SPn , SPv , 0, 0, 0, 0, 0, 0, 0, 0, 0s
(10)
with rSPe , SPn , SPv s denoting the unit vector pointing from point P toward the satellite. Combing Equations (1) and (10) gives: ˜
¸ uEPs,GPS uPLOS
˜ “
¸ AEPs,GPS APLOS
(11)
l.
In this equation uEPs,GPS and AEPs,GPS are used to replace uEPs and AEPs for clarity. The estimate of three-dimensional displacements on point P is the WLS solution of Equation (11). 2.2. ESISTEM Approach Assuming that there is an InSAR LOS measurement uQ EPs,LOS with a unit vector
Q Q rSQ EPs,e , SEPs,n , SEPs,v s on an experiment point (EP) Q whose position and displacements are
Q Q Q Q Q pxQ EPs,e , xEPs,n , xEPs,v q and puEPs,e , uEPs,n , uEPs,v q, respectively. We can obtain, according to SISTEM approach, the constraint on point P from displacements of Q as:
˛ ¨ Q ˛ uQ AEPs,e EPs,e ˚ Q ‹ ˚ Q ‹ ˝ uEPs,n ‚ “ ˝ AEPs,n ‚l uQ AQ EPs,v EPs,v ¨
(12)
Q Q For point Q, relation between three-dimensional displacements puQ EPs,e , uEPs,n , uEPs,v q and InSAR
LOS measurement uQ EPs,LOS is:
T
Q Q Q Q Q Q uQ EPs,LOS “ rSEPs,e , SEPs,n , SEPs,v sruEPs,e , uEPs,n , uEPs,v s
(13)
Substitution of Equations (12) into (13) yields:
uQ EPs,LOS
¨ Q ˛ AEPs,e ´ ¯ ˚ Q ‹ Q Q “ SQ EPs,e , SEPs,n , SEPs,v ˝ AEPs,n ‚l Q AEPs,v “ AQ l EPs,LOS
(14)
This equation shows a relation between unknown parameters at point P and InSAR LOS measurement of EP Q. On the other hand, this equation can be used as the constraint equation for point P from InSAR LOS measurement of surrounding EP Q. If a total of N surrounding EPs with InSAR LOS measurements are selected as constraints, the corresponding constraint equation will be: (15)
uEPs,LOS “ AEPs,LOS l where
T
uEPs,LOS “ ru1EPs,LOS , u2EPs,LOS , . . . , uN EPs,LOS s and T
T
(16) T T
AEPs,LOS “ rpA1EPs,LOS q , pA2EPs,LOS q , . . . , pAN EPs,LOS q s
(17)
Remote Sens. 2016, 8, 559
5 of 14
Combining Equations (11) and (15), we get: ¨
˛ ¨ ˛ uEPs,GPS AEPs,GPS ˚ ‹ ˚ ‹ ˝ uEPs,LOS ‚ “ ˝ AEPs,LOS ‚l uPLOS APLOS
(18)
The estimate of three-dimensional displacements on point P is therefore the WLS solution of Equation (18) in this ESISTEM approach. Compared to SISTEM approach (Equation (11)), this ESISTEM approach (Equation (18)) allows surrounding InSAR LOS measurements to constrain derived surface displacements. The GPS based constraints play an important role; the InSAR LOS based constraints, however, will contribute slightly higher accuracy to the modeled displacements, as they are not directly in east, north or vertical directions, but in LOS directions. The ESISTEM approach will be validated with synthetic tests and the Gorkha earthquake case below. In SISTEM approach, weighting of data is determined based on both distance of EPs to the point, and data uncertainties. In ESISTEM approach, because the InSAR based constraints introduced in ESISTEM approach is the linear superposition of constraints in east, north and vertical components, data weighting of these surrounding InSAR LOS based constraints is also based on both distance and data uncertainties. The ESISTEM approach works pointwisely, and spatial correlation of InSAR data is not taken into account. Estimates of displacements were reported to be best with evenly distributed GPS EPs in SISTEM approach [15]. Because of the linear superposition relation, in ESISTEM approach, N surrounding InSAR LOS EPs with even distribution are preferred. For a point to be carried out for displacements, a small number of EPs will contribute to derived displacements very limited; while a large number of N EPs will bias the derived displacements and their fit to InSAR LOS measurements on this point because of the over-constrained. A proper number of N EPs will allow moderate InSAR LOS based constraints (the second row in Equation (18)) as well as acceptable fit of derived displacements to InSAR LOS measurements on this point (the last row in Equation (18)). The selection is therefore non-unique and is implemented through trial and error. 2.3. Synthetic Validation The ESISTEM approach is tested and compared with the SISTEM approach with synthetic tests, in which simulated LOS and GPS measurements are obtained from surface displacements due to an assumed fault slip based on elastic dislocation theory. The fault geometry and slip distribution shown in Table S1 and Figure S1a, respectively. Assuming a rigidity of 30 GPa, the three-dimensional surface displacement fields on a 100 ˆ 100 grid with cell size of 500 ˆ 500 m (Figure 2a1–a3; called herein “true displacement fields”) can be generated from the fault slip in a homogeneous elastic half-space [20]. Two InSAR LOS images are calculated from the true displacement fields with unit vectors similar to that of ENVISAT satellite missions (Figure S2), and are added with spatially correlated noises with 3 cm standard deviation on a spatial scale of 10 km [21,22]. The InSAR LOS images with added noise are shown in Figure S1b,c. For the ascending LOS image, an area is assumed to lack measurements because of some inherent shortcomings such as decorrelation of interferometric phase signals [23]. Displacements of 100 randomly distributed points, assumed to be GPS stations, are extracted from the true displacement fields, and subsequently added with Gaussian noises with means zero and standard deviations 5 mm and 10 mm for horizontal and vertical components, respectively [16,24,25] (Figure 2).
Remote Sens. 2016, 8, 559
6 of 14
Figure 2. Solutions of ESISTEM and SISTEM approaches for synthetic tests: (a1–a3) three-dimensional surface displacement fields from fault slip shown in Figure S1 with elastic dislocation theory [20], termed true displacement fields; (b1–b3) modeled three-dimensional surface displacement fields for east, north and vertical components, respectively, from an integration of InSAR (shown in Figure S1) and GPS data (black dots) using ESISTEM approach; (c1–c3) modeled displacement fields from an integration of InSAR and GPS data using SISTEM approach; (d1–d3) differences between ESISTEM-derived and true displacements; and (e1–e3) differences between SISTEM-derived and true displacements. The rectangle (black line) covers the region lacking InSAR LOS data from ascending track, and the dashed rectangle the region of fault plane projected onto surface.
Remote Sens. 2016, 8, 559
7 of 14
Figure 2b1–b3 shows the three-dimensional displacement fields derived with the ESISTEM approach, and Figure 2d1–d3 shows their corresponding differences with respect to the true displacement fields, in which 64 surrounding InSAR LOS EPs are used. The derived surface displacement fields vary, respectively, from ´2.3 to 20.8 cm, from ´6.9 to 21.6 cm, and from ´10.0 to 25.7 cm for the east, north and vertical components; and their corresponding differences typically range from ´2 to 2 cm. Large differences exist where GPS measurements are sparse, and become most obvious for the north component. This could be attributed to the insufficient constraints from GPS measurements there and the less sensitivity of InSAR LOS measurements in the north component (Sn = 0.08). Figure 2c1–c3,e1–e3 shows the SISTEM solutions, which are similar to that of ESISTEM solutions for most of the regions. This, on the other hand, reveals the slight contribution from InSAR constraints. However, in the area lacking ascending LOS measurements, derived displacements with SISTEM approach have differences to the true ones up to 9.5 cm for east component, and up to 3.5 cm for vertical component, while corresponding differences with ESISTEM approach have maxima 4.5 cm for the east component and 1.8 cm for the vertical component. In SISTEM model, modeled displacements in this area are constrained by surrounding GPS measurements alone, while, in ESISTEM model, they are constrained by surrounding InSAR and GPS measurements. Contribution from InSAR LOS based constraints introduced in this study is slight for most regions, but plays an important role in regions with insufficient data. 3. Data For the Gorkha earthquake, synthetic aperture radar (SAR) data were acquired with JAXA ALOS-2 satellites. We use 21 February 2015/2 May 2015 pair (track 157), 22 February 2015/3 May 2015 pair (track 048), and 31 March 2015/28 April 2015 pair (track 047) (Figure 1; Table S2). These SAR data were processed with GMTSAR; LOS data were detrended by removing a gradient ramp estimated from far-field displacements [26], to account for possible orbit errors and/or ionospheric delays [27]. The InSAR LOS data are in cells ~1 km ˆ ~1 km. Unit vectors are shown in Figure S3. Soon after the earthquake, GPS measurements at 12 continuous GPS stations of the Nepal Geodetic Array became available [5]. In addition, measurements at permanent GPS stations of the Crustal Movement Observation Network of China and the campaign GPS measurements in southern Tibet were reported [28,29]. All horizontal GPS measurements are used in the derivation of surface displacement field, while all vertical GPS measurements are only used as validations. 4. Results Figure 3 shows the derived three-dimensional surface displacement field associated with the Gorkha earthquake using ESISTEM approach, where 100 surrounding InSAR LOS EPs are used. The significantly deformed region locates to the north of Kathmandu and to the east of the epicenter, covering an area of ~150 km by 120 km. Horizontal deformations are predominantly southward. Two subsidence regions (“S1” and “S2”) are separated by the northern portion of uplifted region (“U1”). From the north to the south, vertical displacements vary from nearly zero to subsidence up to 0.95 m (“S1” zone), and then turn to uplift up to 1.40 m to the north of Kathmandu. The modeled vertical displacement field is validated by comparing to vertical GPS measurements that are not included in the derivation (Figure 4). Good agreement between them shows the robust estimate of vertical displacement field. InSAR data are less sensitive to the horizontal components of deformations; in this Gorkha earthquake horizontal GPS measurements are very sparse and are all included in the derivation of surface displacement field.
Remote Sens. 2016, 8, 559
8 of 14
Figure 3. Solutions associated with the 25 April 2015 Gorkha, Nepal, earthquake using ESISTEM approach. (a) Three-dimensional surface displacement field. Two subsidence and one uplift zones are marked with “S1”, “S2” and “U1”, respectively. White arrows show the modeled horizontal displacements and are every 20 km. Grey dashed lines delimit the region that modeled displacements have high accuracy, and red dashed lines outline the zones with significant landslides [2]. Thick black lines represent the Main Frontal Thrust (MFT) [12,13]. The red star represents the epicenter of the earthquake, and the purple square the city of Kathmandu. Other symbols are shown in the legend. (b) Profiled vertical deformations along X-X’ and Y-Y’ shown in (a).
Figure 4. Comparison of displacements modeled with ESISTEM approach and GPS observations at validation stations.
Remote Sens. 2016, 8, 559
9 of 14
5. Discussion 5.1. Robust Estimate in Regions Significantly Deformed In the region significantly deformed, the sharp variation in vertical component is continuous; only one significant surface fracture ~1 km long was found in the district of Kathmandu, and was interpreted to be a localized extension ridge [6]. The subsidence-to-uplift variation in vertical deformations, together with the predominantly southward horizontal motion, indicates that this earthquake was a thrust event that did not rupture the surface. In addition, surface deformations terminate to the north of Main Frontal Thrust (MFT) fault, suggesting that the earthquake may not rupture the MFT. This is in accordance with field investigation as well as geodetic and seismic studies [1,9,30,31]. The derived displacement field matches well with that predicted from elastic dislocation models [5,29,32] in deformation patterns but is different in maximum values; for example, the forward-modeled vertical deformations range from ´1.25 to 1.25 m in Elliott et al. [29], and our ESISTEM-derived ones range from ´0.90 to 1.40 m. Standard deviations for derived displacement field are smaller than 2 cm for the regions significantly deformed in all three components and are large at locations with sparse GPS measurements (Figure 5). Residuals between modeled and observed data (used in model) reveal a good compatibility between InSAR and GPS (Figure 1 and Figure S4). SISTEM-derived displacement field (presented in Figure S5) is similar to the ESISTEM-derived one. Differences between them are large (up to ˘0.5 m) in areas with insufficient data coverage (Figure S6). Moreover, standard deviations for ESISTEM-derived displacements are slightly smaller than those for SISTEM solution, especially in the region with insufficient data (dashed rectangle in Figure 5). This is attributed to the InSAR LOS based constraints in ESISTEM solution. The ESISTEM approach makes surface measurements along oblique directions possible as constraints in derivation of surface displacement field [33–35]. Contributions from different data are investigated (Figure S7). We construct four models: Model (a), combining InSAR images Tracks 048 and 157 and horizontal GPS with ESISTEM approach; Model (b), combining InSAR images Tracks 048 and 047 and horizontal GPS with ESISTEM approach; Model (c), combining InSAR images Tracks 048 and 157 and horizontal GPS with SISTEM approach; and Model (d), combining InSAR images Tracks 048 and 047 and horizontal GPS with SISTEM approach. Results show small but obvious discrepancies among them: displacement fields derived with Tracks 048 and 157 (Models (a) and (c)) show northward deformations in “R2” region, while those derived with Tracks 048 and 047 (Models (b) and (d)) show northeastward deformations in “R2” region and have larger maximum vertical deformations in “R1” region. Model resolution test is carried out with the same data coverage of the Gorkha earthquake (Figure S8), which is done with the procedure as follows: (1) a forward model is carried out to generate three-dimensional surface displacement field from fault slip distribution in Grandin et al. [8] using Okada’s theory [20]; (2) simulated data with same data coverage as those in the Gorkha earthquake are extracted; and (3) three-dimensional displacement fields are derived with SISTEM and ESISTEM approaches, and are compared with the input one, respectively. In regions significantly deformed, differences between input and synthetic displacement fields are small (Figure S8c,e), comparable to other cases [15,36]. In the region marked with grey ellipses, ESISTEM-derived displacements have smaller differences with respect to the input ones than SISTEM-derived displacements, which is contributed from the InSAR LOS based constraints there. Even though GPS observations are not as dense as desired, estimates of displacements are in some degree robust in regions significantly deformed, for the following reasons: (1) the good fit of derived vertical displacements to vertical GPS measurements; (2) the good resolution test solution; (3) the comparability of derived displacement field to those predicted from the elastic dislocation models; and (4) the small standard deviations of estimates. However, because of the lower sensitivity of InSAR LOS measurements in the north–south direction, derived displacements in this direction are not as
Remote Sens. 2016, 8, 559
10 of 14
desirable as the vertical ones. In addition, InSAR data contain possible early postseismic deformations, which may contaminate derived coseismic displacements. Remote Sens. 2016, 8, 559
9 of 14
Figure 5. Standard deviations of the derived displacement fields associated with the Gorkha Figure 5. Standard deviations of the derived displacement fields associated with the Gorkha earthquake: earthquake: (a–c) standard deviations using ESISTEM approach, for east, north and vertical (a–c) standard deviations using ESISTEM approach, for east, north and vertical components, components, respectively; (d–f) standard deviations using SISTEM approach, where the white dashed respectively; (d–f) standard deviations using SISTEM approach, where the white dashed rectangle rectangle marks the region where standard deviations for ESISTEM are smaller than that for SISTEM marks the region where standard deviations for ESISTEM are smaller than that for SISTEM approach; approach; and (g–i) the differences between standard deviations using ESISTEM and SISTEM and (g–i) the differences between standard deviations using ESISTEM and SISTEM approaches (i.e., the approaches (i.e., the ESISTEM-derived minus the SISTEM-derived). Squares represent horizontal GPS ESISTEM-derived minus the SISTEM-derived). Squares represent horizontal GPS stations. stations.
5.2. Relation to Earthquake-Induced Landslides SISTEM-derived displacement field (presented in Figure S5) is similar to the ESISTEM-derived one. The earthquake-induced landslides [2,11]m)are mainly in the data subsidence region of S6). the Differences between them are large (up to ±0.5 in located areas with insufficient coverage (Figure Moreover, standard deviations forsignificant ESISTEM-derived displacements are slightly those displacement field (Figure 3). The landslides terminate roughly to thesmaller north ofthan the uplift for SISTEM especially the region with insufficient (dashed rectangle in Figure 5). zone (Figuresolution, 3). We compare thein landslides distribution induceddata by the Gorkha earthquake to those This is attributed the2008 InSAR LOS based in ESISTEM solution. ESISTEM induced by the 12 to May Wenchuan MW constraints 7.9 earthquake [37–39], and by theThe 8 October 2005approach Kashmir makes measurements along oblique possible as constraints derivation of such surface MW 7.6surface earthquake [40,41]. In addition to directions other factors that may influence in the landslides as displacement field [33–35]. geological materials beyond the scope of this study, there are two similar features: (1) landslides Contributions from different data significantly are investigated (Figure S7).hanging We construct Model (a), induced by these three earthquakes locate in the wall;four andmodels: (2) highly varied combining InSAR images Tracks 048 and 157 and horizontal withto ESISTEM approach; (b), vertical deformations may influence landslides. However, GPS contrary the Wenchuan andModel Kashmir combining images Tracks causes 048 andboth 047 significant and horizontal GPS with ESISTEM approach; Modelwall, (c), events, theInSAR Gorkha earthquake uplifts and subsidences in the hanging combining InSAR images Tracks 048 and 157 and horizontal GPS with SISTEM approach; and Model (d), combining InSAR images Tracks 048 and 047 and horizontal GPS with SISTEM approach. Results show small but obvious discrepancies among them: displacement fields derived with Tracks 048 and 157 (Models (a) and (c)) show northward deformations in “R2” region, while those derived with
Remote Sens. 2016, 8, 559
11 of 14
and, interestingly, the landslides appear to be related to the subsidence region. In addition, the total number of induced landslides in the Gorkha earthquake is reported to be far less than those induced by a similar massive earthquake, such as Wenchuan earthquake, probably because the ruptures were confined in subsurface [2]. 5.3. Sensitivity of ESISTEM to InSAR Errors InSAR measurements contain spatially correlated noises primarily caused from atmospheric and ionospheric structures [21,42]. Noises could be described with two parameters: standard deviation of InSAR noises, and length scale on which noises are correlated. We make further analysis for sensitivities of ESISTEM and SISTEM approaches to observation errors (Figure 6). Means (µ) and standard deviations (σ) of differences between modeled and true displacements are used to evaluate the sensitivity performances. For both ESISTEM and SISTEM approaches, means and standard deviations increase with the increase of standard deviation of InSAR noises, but slightly fluctuate with the increase of length scale. This shows the sensitivity of both methods to InSAR variance. In addition, ESISTEM solutions have slightly smaller differences to the true ones, which is contributed from the InSAR LOS constraints. Direct sensitivities of both SISTEM and ESISTEM approaches to wavelength need further investigation.
Figure 6. Sensitivities of SISTEM and ESISTEM approaches to: (a) standard deviation of InSAR noises; and (b) length scale.
6. Conclusions We derived the three-dimensional surface displacement field associated with the 25 April 2015 Gorkha, Nepal, earthquake from integrated InSAR and GPS measurements, with an extended SISTEM (Simultaneous and Integrated Strain Tensor Estimation From Geodetic and Satellite Deformation Measurements) approach proposed in this paper. Derived field reveals a predominantly southward horizontal motion and a continuous subsidence-to-uplift variation from the north to the south within ~120 km to the north of Kathmandu, and this event did not rupture the MFT. Landslides induced by this earthquake are comparable to those induced by the 12 May 2008 Wenchuan MW 7.9 earthquake and by the 8 October 2005 Kashmir MW 7.6 in the that they were concentrated in hanging wall, but incomparable to them in total landslides number and subsidence-correlated distribution. The extended SISTEM (ESISTEM) approach uses both surrounding InSAR and GPS measurements to constrain modeled surface displacement field. Compared to GPS based constraints, contribution from InSAR LOS based constraints, introduced in this study, is slight for most regions, but plays an important role in regions with insufficient data. Sensitivity analysis shows that accuracy of results with ESISTEM approach depends in some degree on InSAR quality.
Remote Sens. 2016, 8, 559
12 of 14
Supplementary Materials: The following are available online at www.mdpi.com/2072-4292/8/7/559/s1, Table S1: Fault geometry in the synthetic tests, Table S2: Interferograms associated with the Gorkha earthquake used in this Study, Figure S1: Fault slip distribution and InSAR LOS measurements used in the synthetic tests, Figure S2: Unit vectors relating InSAR LOS measurements to surface displacements used in synthetic tests, Figure S3: Unit vectors relating InSAR LOS measurements to surface displacements for the ALOS images used in the Gorkha earthquake, Figure S4: Comparisons of observed and modeled InSAR LOS displacements for the Gorkha earthquake, Figure S5: Three-dimensional surface displacement field due to the Gorkha earthquake modeled with SISTEM approach, Figure S6: Differences between derived displacements with RSISTEM and SISTEM approaches, Figure S7: Comparison of solutions with different input, Figure S8: Model resolution test for Gorkha earthquake given data coverage. Acknowledgments: The authors thank academic editor Prasad S. Thenkabail and five anonymous reviewers for their comments and helpful suggestions, which highly improved the quality of the manuscript. Thanks are given to Robert Tenzer for proof reading, and to Shengliang Pu for helpful discussion. Figures are plotted with the GMT software [43]. This study is supported by the State Key Development Program for Basic Research of China (No. 2013CB733304), the National Natural Science Foundation of China (No. 41274019), the Fundamental Research Funds for the Central Universities (No. 2042016kf0161), the State Key Laboratory of Geodesy and Earth’s Dynamics, Institute of Geodesy and Geophysics, CAS (No. L09-05), and the China Scholarship Council (No. 201406275123). Author Contributions: Ting Chen and Haipeng Luo conceived the study, performed the experiments, and drafted and reviewed the manuscript. Conflicts of Interest: The authors declare no conflict of interest.
References 1. 2.
3.
4.
5.
6.
7.
8.
9.
10. 11. 12.
Avouac, J.; Meng, L.; Wei, S.; Wang, T.; Ampuero, J. Lower edge of locked Main Himalayan Thrust unzipped by the 2015 Gorkha earthquake. Nat. Geosci. 2015, 8, 708–711. [CrossRef] Kargel, J.S.; Leonard, G.J.; Shugar, D.H.; Haritashya, U.K.; Bevington, A.; Fielding, E.J.; Fujita, K.; Geertsema, M.; Miles, E.S.; Steiner, J.; et al. Geomorphic and geologic controls of geohazards induced by Nepals 2015 Gorkha earthquake. Science 2016, 351, c8353. [CrossRef] [PubMed] Kobayashi, T.; Morishita, Y.; Yarai, H. Detailed crustal deformation and fault rupture of the 2015 Gorkha earthquake, Nepal, revealed from ScanSAR-based interferograms of ALOS-2. Earth Planets Space 2015. [CrossRef] Moss, R.E.S.; Thompson, E.M.; Scott Kieffer, D.; Tiwari, B.; Hashash, Y.M.A.; Acharya, I.; Adhikari, B.R.; Asimaki, D.; Clahan, K.B.; Collins, B.D.; et al. Geotechnical effects of the 2015 magnitude 7.8 Gorkha, Nepal, earthquake and aftershocks. Seismol. Res. Lett. 2015, 86, 1514–1523. [CrossRef] Galetzka, J.; Melgar, D.; Genrich, J.F.; Geng, J.; Owen, S.; Lindsey, E.O.; Xu, X.; Bock, Y.; Avouac, J.P.; Adhikari, L.B.; et al. Slip pulse and resonance of the Kathmandu basin during the 2015 Gorkha earthquake, Nepal. Science 2015, 349, 1091–1095. [CrossRef] [PubMed] Angster, S.; Fielding, E.J.; Wesnousky, S.; Pierce, I.; Chamlagain, D.; Gautam, D.; Upreti, B.N.; Kumahara, Y.; Nakata, T. Field Reconnaissance after the 25 April 2015 M 7.8 Gorkha Earthquake. Seismol. Res. Lett. 2015, 86, 1506–1513. [CrossRef] Feng, G.; Li, Z.; Shan, X.; Zhang, L.; Zhang, G.; Zhu, J. Geodetic model of the 2015 April 25 MW 7.8 Gorkha Nepal Earthquake and MW 7.3 aftershock estimated from InSAR and GPS data. Geophys. J. Int. 2015, 203, 896–900. [CrossRef] Grandin, R.; Vallée, M.; Satriano, C.; Lacassin, R.; Klinger, Y.; Simoes, M.; Bollinger, L. Rupture process of the MW = 7.9 2015 Gorkha earthquake (Nepal): Insights into Himalayan megathrust segmentation. Geophys. Res. Lett. 2015, 42, 8373–8382. [CrossRef] Hayes, G.P.; Briggs, R.W.; Barnhart, W.D.; Yeck, W.L.; McNamara, D.E.; Wald, D.J.; Nealy, J.L.; Benz, H.M.; Gold, R.D.; Jaiswal, K.S.; et al. Rapid characterization of the 2015 MW 7.8 Gorkha, Nepal, earthquake sequence and its seismotectonic context. Seismol. Res. Lett. 2015, 86, 1557–1567. [CrossRef] Wang, K.; Fialko, Y. Slip model of the 2015 MW 7.8 Gorkha (Nepal) earthquake from inversions of ALOS-2 and GPS data. Geophys. Res. Lett. 2015, 42, 7452–7458. [CrossRef] Collins, B.D.; Jibson, R.W. Assessment of existing and potential landslide hazards resulting from the 25 April 2015 Gorkha, Nepal earthquake sequence. U.S. Geol. Surv. 2015. [CrossRef] Avouac, J. Mountain building, erosion, and the seismic cycle in the Nepal Himalaya. Adv. Geophys. 2003, 46, 1–80.
Remote Sens. 2016, 8, 559
13.
14.
15.
16.
17. 18.
19.
20. 21. 22. 23.
24. 25. 26.
27.
28. 29.
30.
31.
32.
13 of 14
Ader, T.; Avouac, J.; Liu-Zeng, J.; Lyon-Caen, H.; Bollinger, L.; Galetzka, J.; Genrich, J.; Thomas, M.; Chanard, K.; Sapkota, S.N.; et al. Convergence rate across the Nepal Himalaya and interseismic coupling on the Main Himalayan Thrust: Implications for seismic hazard. J. Geophys. Res. 2012. [CrossRef] Gudmundsson, S.; Sigmundsson, F.; Carstensen, J.M. Three-dimensional surface motion maps estimated from combined interferometric synthetic aperture radar and GPS data. J. Geophys. Res. Solid Earth 2002, 107, 11–13. [CrossRef] Guglielmino, F.; Nunnari, G.; Puglisi, G.; Spata, A. Simultaneous and integrated strain tensor estimation from geodetic and satellite deformation measurements to obtain three-dimensional displacement maps. IEEE Trans. Geosci. Remote 2011, 49, 1815–1826. [CrossRef] Luo, H.; Liu, Y.; Chen, T.; Xu, C.; Wen, Y. Derivation of 3-D surface deformation from an integration of InSAR and GNSS measurements based on Akaike’s Bayesian Information Criterion. Geophys. J. Int. 2016, 204, 292–310. [CrossRef] Samsonov, S.; Tiampo, K. Analytical optimization of a DInSAR and GPS dataset for derivation of three-dimensional surface motion. IEEE Geosci. Remote Sens. 2006, 3, 107–111. [CrossRef] Guglielmino, F.; Bignami, C.; Bonforte, A.; Briole, P.; Obrizzo, F.; Puglisi, G.; Stramondo, S.; Wegmüller, U. Analysis of satellite and in situ ground deformation data integrated by the SISTEM approach: The 3 April 2010 earthquake along the Pernicana fault (Mt. Etna—Italy) case study. Earth Planet. Sci. Lett. 2011, 312, 327–336. [CrossRef] Guglielmino, F.; Anzidei, M.; Briole, P.; Elias, P.; Puglisi, G. 3D displacement maps of the 2009˝ L1 Aquila earthquake (Italy) by applying the SISTEM method to GPS and DInSAR data. Terra Nova 2013, 25, 79–85. [CrossRef] Okada, Y. Surface deformation due to shear and tensile faults in a half-space. Seismol. Soc. Am. 1985, 75, 1135–1154. Lohman, R.B.; Simons, M. Some thoughts on the use of InSAR data to constrain models of surface deformation: Noise structure and data downsampling. Geochem. Geophys. Geosyst. 2005, 6. [CrossRef] Barnhart, W.D.; Lohman, R.B. Automated fault model discretization for inversions for coseismic slip distributions. J. Geophys. Res. 2010, 115. [CrossRef] De Michele, M.; Raucoules, D.; de Sigoyer, J.; Pubellier, M.; Chamot-Rooke, N. Three-dimensional surface displacement of the 2008 May 12 Sichuan earthquake (China) derived from Synthetic Aperture Radar: Evidence for rupture on a blind thrust. Geophys. J. Int. 2010, 183, 1097–1103. [CrossRef] Fukuda, J.; Johnson, K.M. A Fully Bayesian inversion for spatial distribution of fault slip with objective smoothing. Bull. Seismol. Soc. Am. 2008, 98, 1128–1146. [CrossRef] Fukuda, J.; Johnson, K.M. Mixed linear-non-linear inversion of crustal deformation data: Bayesian inference of model, weighting and regularization parameters. Geophys. J. Int. 2010, 181, 1441–1458. [CrossRef] Lindsey, E.O.; Natsuaki, R.; Xu, X.; Shimada, M.; Hashimoto, M.; Melgar, D.; Sandwell, D.T. Line-of-sight displacement from ALOS-2 interferometry: MW 7.8 Gorkha Earthquake and MW 7.3 aftershock. Geophys. Res. Lett. 2015, 42, 6655–6661. [CrossRef] Feng, W.; Lindsey, E.; Barbot, S.; Samsonov, S.; Dai, K.; Li, P.; Li, Z.; Almeida, R.; Chen, J.; Xu, X. Source characteristics of the 2015 MW 7.8 Gorkha (Nepal) earthquake and its MW 7.2 aftershock from space geodesy. Tectonophysics 2016. [CrossRef] Su, X.; Wang, Z.; Meng, G.; Xu, W.; Ren, J. Pre-seismic strain accumulation and co-seismic deformation of the 2015 Nepal Ms 8.1 earthquake observed by GPS. Chin. Sci. Bull. 2015, 60, 2115–2123. (In Chinese) [CrossRef] Zhao, B.; Du, R.; Zhang, R.; Tan, K.; Qiao, X.; Huang, Y.; Zhang, C. Co-seismic displacements associated with the 2015 Nepal MW 7.9 earthquake and MW 7.3 aftershock constrained by Global Positioning System Measurements (in Chinese). Chin. Sci. Bull. 2015, 60, 2758–2764. [CrossRef] Elliott, J.R.; Jolivet, R.; González, P.J.; Avouac, J.P.; Hollingsworth, J.; Searle, M.P.; Stevens, V.L. Himalayan megathrust geometry and relation to topography revealed by the Gorkha earthquake. Nat. Geosci. 2016, 9, 174–180. [CrossRef] Parameswaran, R.M.; Natarajan, T.; Rajendran, K.; Rajendran, C.P.; Mallick, R.; Wood, M.; Lekhak, H.C. Seismotectonics of the April–May 2015 Nepal earthquakes: An assessment based on the aftershock patterns, surface effects and deformational characteristics. J. Asian Earth Sci. 2015, 111, 161–174. [CrossRef] Awmoore. M7.8 Gorkha, Nepal Earthquake, 25 April 2015. Available online: http://aria.jpl.nasa.gov/node/ 43 (accessed on 29 June 2016).
Remote Sens. 2016, 8, 559
33. 34. 35. 36. 37. 38.
39. 40. 41.
42. 43.
14 of 14
Fialko, Y.; Sandwell, D.; Simons, M.; Rosen, P. Three-dimensional deformation caused by the Bam, Iran, earthquake and the origin of shallow slip deficit. Nature 2005, 435, 295–299. [CrossRef] [PubMed] Pathier, E.; Fielding, E.J.; Wright, T.J.; Walker, R.; Parsons, B.E.; Hensley, S. Displacement field and slip distribution of the 2005 Kashmir earthquake from SAR imagery. Geophys. Res. Lett. 2006. [CrossRef] Tronin, A.A. Satellite remote sensing in seismology: A review. Remote Sens. Basel 2010, 2, 124–150. [CrossRef] Hu, J.; Wang, Q.; Li, Z.; Zhao, R.; Sun, Q. Investigating the ground deformation and source model of the Yangbajing geothermal field in Tibet, China with the WLS InSAR technique. Remote Sens. 2016, 8. [CrossRef] Dai, F.C.; Xu, C.; Yao, X.; Xu, L.; Tu, X.B.; Gong, Q.M. Spatial distribution of landslides triggered by the 2008 Ms 8.0 Wenchuan earthquake, China. J. Asian Earth Sci. 2011, 40, 883–895. [CrossRef] Xu, C.; Xu, X.; Yao, X.; Dai, F. Three (nearly) complete inventories of landslides triggered by the 12 May 2008 Wenchuan MW 7.9 earthquake of China and their spatial distribution statistical analysis. Landslides 2014, 11, 441–461. [CrossRef] Yin, Y.; Wang, F.; Sun, P. Landslide hazards triggered by the 2008 Wenchuan earthquake, Sichuan, China. Landslides 2009, 6, 139–152. [CrossRef] Kamp, U.; Growley, B.J.; Khattak, G.A.; Owen, L.A. GIS-based landslide susceptibility mapping for the 2005 Kashmir earthquake region. Geomorphology 2008, 101, 631–642. [CrossRef] Sato, H.P.; Hasegawa, H.; Fujiwara, S.; Tobita, M.; Koarai, M.; Une, H.; Iwahashi, J. Interpretation of landslide distribution triggered by the 2005 Northern Pakistan earthquake using SPOT 5 imagery. Landslides 2007, 4, 113–122. [CrossRef] Hanssen, R.A. Radar Interferometry: Data Interpretation and Error Analysis; Springer: New York, NY, USA, 2001. Wessel, P.; Smith, W.H.F. New, improved version of the generic mapping tools released. Eos Trans. AGU 1998, 579. [CrossRef] © 2016 by the authors; licensee MDPI, Basel, Switzerland. This article is an open access article distributed under the terms and conditions of the Creative Commons Attribution (CC-BY) license (http://creativecommons.org/licenses/by/4.0/).