Apr 10, 1997 - 1Now at Exxon Production Research Company, Houston, Texas. Copyright ... FLOW BENEATH THE SOUTHEAST INDIAN RIDGE. 80. -40 .â¢â¢kâ¢.
JOURNAL OF GEOPHYSICAL RESEARCH, VOL. 102, NO. B4, PAGES 7783-7802, APRIL 10, 1997
Three-dimensional structure of asthenospheric flow beneath the Southeast Indian Ridge BrianP. West,WilliamS. D. Wilcock,andJean-Christophe Semp•r•1 Schoolof Oceanography, Universityof Washington,Seattle
Louis G•li D6partementde G6osciences Marines,InstitutFranqaisde Recherchepourl'Exploitationde la Mer, Plouzan6,France
Abstract. Both geophysicalandgeochemical evidencesuggests the presenceof along-axis asthenospheric flow towardthe Australian-Antarctic Discordance(AAD) beneaththe Southeast Indian Ridge (SEIR). We usea three-dimensional, finite-volumeformulationof viscousflow to investigatethe structureof asthenospheric motionbeneaththe SEIR. Our resultsshowthat simplecontinentalseparationin either a constant-or variable-viscositymantlewithout horizontal temperaturegradientsis unableto reproducethe inferredasthenospheric flow velocitiesand observedgeographicdistributionof the "Indian"and "Pacific"uppermantleisotopicprovinces. The presenceof a cooler,moreviscousmantledirectlybeneaththe AAD is necessary to reproduce observedconstraints.High viscosities beneaththe AAD inducesignificantalong-axisflow beneaththe neighboringSEIR thatadvectswarmermaterialoverthe cooler,moreviscousmantle. In passiveflow models,a temperature anomalyof about300øCat a 400-kmdepthis required. Simulationsthatincludetheeffectsof buoyancyforcesreducetherequiredtemperature anomalyto
100ø-200øC,a resultin goodagreement with otherestimates of theregionaltemperature anomaly. Thesemodelsalsomatchobservednear-axisvariationsin residualdepthandcrustalthickness.In bothpassiveandbuoyantsimulations, the presenceof high-viscosity(cooler)uppermantle beneaththe AAD resultsin reducedupwelling,consistent with low extentsof decompressional meltinginferredfrom geochemical andgeophysical constraints.Along-axisflow actsto subdue temperaturevariationswithin the meltingregionrelativeto the deepermantleandresultsin a temperatureinversionin the subaxialasthenosphere. This effectmay alsoreducethe variationsin geochemical parameters suchasNa8.0 andFe8.0with axialdepthbelowthoseobservedin global correlations.
Introduction
The present-daySouthernOcean formed via the rifting of Gondwana,beginning around 100 Ma at the western end of Australia and then propagatingeastwardat approximately2
evidence [Sempdrd et al., 1996, 1997]. The AustralianAntarctic Discordance (AAD) lies near the center of the SEIR
between the Amsterdam-Kerguelenand Balleny-Tasmantid hotspots(Figure 1, inset). The AAD is a regionof unusually thin oceanic crust, rough topography, deep regional cmyr-1 [Mutter etal.,1985;Cande andMutter, 1982].Unlike bathymetry, and axial depths (Figure 1) and is believed to other boundariesof Gondwana, the rifting of Australia and representthe surface expressionof regionally cooler mantle Antarctica was not a direct result of hot-spot influence and is temperatures.To the west of the AAD, the SEIR displaysa associatedwith the long-termpresenceof cooler than normal transition from predominantly axial ridges between 88ø and upper mantle temperatures[Veevers,1982]. Initial spreading 102ø E to a more subduedaxial topographicvariationbetween between the two continentsoccurred at an extremely slow half 107ø and 114øE [Semp•rd et al., 1997]. The axis of the SEIR
rateof 2-6 mmyr-1 from96 Ma until45-43Ma andthe., accelerated to an average halfrateof 30-35mmyr-! as significantglobal plate reorganization occurred[Mutter et al., 1985]. At present, the intermediate spreading Southeast Indian Ridge (SEIR) extends from the Macquarie to the Rodrigues triple junctions, separating the Indo-Australian from the Antarctic plate (Figure 1, inset). Over the length of the SEIR, significantgradientsin mantle temperatureare inferred from geochemicaland geophysical
1NowatExxonProduction Research Company, Houston, Texas. Copyright1997 by the AmericanGeophysical Union. Papernumber96JB03895. 0148-0227/97/96JB-03895509.00
to the east of the AAD is associatedwith a 10-km-wide, 500m-high axial ridge similar to that of .the East Pacific Rise
(EPR) [West et al., 1994; Sempdrdet al., 1996]. In contrast, the SEIR within the AAD is characterized by a 500- to 1500-mdeep,5- to 20-km-wide rift valley, a featureusuallyassociated with slow-spreadingcenters [Palmer et al., 1993; West et al., 1994; Sempdrdet al., 1996]. Axial depths also vary significantlybetween 90ø and 145øE, ranging from 2500 m near 140øE and 100øE to nearly 4750 m within the AAD (Figure 1). Using a current model of the formation of axial topography [Chen, 1996a, b; Phipps Morgan and Chen, 1993], thesecontrastsin axial depthand morphologyrequire thicker crust and warmer mantle temperaturesboth to the east and west of the AAD.
The geochemicalcontrastsbetweenthe AAD and regionsto the east and west along the SEIR are also consistentwith the 7783
7784
WEST
ET AL.: ASTHENOSPHERIC
80
120
FLOW
BENEATH
THE SOUTHEAST
INDIAN
RIDGE
160 -20
-40.••k•
-40
AAD
-60
-60
-80
-80
'•
-2000
3.9
-2500
o
AAD
-3000
.-"
o
'.-
oO
3.8
-3500 -4000 3.7
-4500 -5000 ....
90
i ....
95
i ....
100
i ....
105
i ....
110
i ....
115
i ' ' , I, i ....
120
125
i ....
130
i ....
135
i ....
140
i
3.6
145
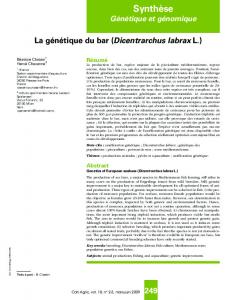
East Longitude Figure 1. Along-axis depth profile of the SoutheastIndian Ridge (SEIR) between 90øE and 145øE (data sourceswestto east; Semp6r6et al. [1997], West et al. [1994], and J. PhippsMorgan,unpublisheddata, 1995) and averagedRayleigh wave groupvelocities(shadeddots, with error barsrepresenting1 standarddeviation) afterKuo et al. [1996]. Inset showsgeographic locationsof the Rodrigues(RTJ) and Macquarie(MTJ) Triple Junctions,Amsterdam-Kerguelen(A-K) and Balleney-Tasmantid(B-T) hotspots,and the Australian-Antarctic Discordance(AAD). Both the depthand surfacewave anomaliesassociated with the AAD suggestthat it is a region of relative cool upper mantle temperaturescenterednear 120øE. AAD being a regionof low melt productionand thin crust. The axial valleys of the AAD are characterizedby lavas with high Na8.0 and low Fe8.0, while the axial ridgesof the SEIR to the east are characterizedby less sodic,more iron-richlavas [Pyle, 1994]. Gradientsin geochemicalparametersto the west of the AAD also demonstratethat the AAD is a region of low melt production [Christie et al., 1995], although between 98ø and 116øE, parameterssuchas Na8.0 and Fe8.0 vary more slowly with axial depth than the trends defined by the "global correlation" of Klein and Langmuir [1987] [Christie et al., 19951.
Various methodshave been usedto estimatethe temperature anomaly beneath the AAD. Forsyth et al. [1987] report that beneaththe AAD Rayleigh wave phasevelocitiesin the 20- to 100-s range are significantly faster than for regions of comparableage in the Pacific. The difference of about 0.35
kms-1 canbemodeled bya mantle temperature difference of less than 100øC and a change in melt fraction of about 8% [Forsyth, 1992]. Kuo [1993] jointly inverts geoid and topographyanomaliesof the SEIR and suggestsa temperature anomaly of 80 ø and 250øC beneath the AAD for layers extendingto depthsof 300 and 100 km, respectively. West et al. [1994] estimatea 50ø to 100øC variationbetweensegments in the western portion of the AAD and regions of the SEIR immediately to the east, using topographically corrected satellite gravity data and numerical models of mantle flow and
melt generation.Isostatica/'guments generallyfall within the range of 85ø to 150øC [Hayes, 1988; Semp•r• et al., 1997]. Using geochemicalmethods,Shenand Forsyth [1995] deduce a temperatureanomaly of not more than about 60øC to explain their trace element systematics. Their model predicts a
relatively small variation in the onset of melting and large variation in the final pressureof melting. The Shen and Forsyth [1995] estimate is less than the 100ø to 150øC variationrequiredby Klein and Langmuir [1987], who assume that the final pressureof melting is constantbeneaththe SEIR between -100 ø and 132øE. Thus, while individual estimates
may vary significantly,the data are generallycompatiblewith an upper mantle temperaturedecreaseof-100øC beneaththe AAD.
In addition to being associated with relatively cooler mantle temperatures,the AAD has also been postulatedas a sink for along-axis asthenosphericflow beneath the SEIR [Parmentier and Olivier, 1979; Vogt et al., 1984; Baumgardner, 1988; Alvarez, 1990; Marks et al., 1990, 1991; Klein et al., 1988; Kuo, 1993; Kuo et al., 1995; Semp•r• et al., 1996; 1997' B. P. West et al., manuscript in preparation,1997]. As such,the AAD appearsto be a unique portion of the global mid-ocean ridge network since it is associatedwith both a cooler upper mantle and along-axis
flow. Parmentierand Oliver [1979] modeledshallow,global mantle
circulation
due to the accretion
and subduction of
lithosphericplatesand predictedmantle flow aroundthe root of the northward-moving Australiancontinent. This modelis consistentwith sublithosphericmantle flow beneaththe SEIR that converges on the AAD in the wake of the Australian continent. Alvarez [1982, 1990] also proposedthat upper mantle flow convergeson the AAD around the root of the Australian continentowing to long-term shrinkageof the PacificOceanbasin. More recently,Marks et al. [1990, 1991] suggestedthat the uppermantlebeneaththe axis of the SEIR is currently downwelling beneath the AAD, based upon the
WEST
ET AL.: ASTHENOSPHERIC
FLOW
BENEATH
pattern of residual depth anomaliesand residual geoid to topography ratios.
Conceptualmodelsof mantleflow in and nearthe AAD fall into essentially two end-member classes: those involving convectiveflow with possibledownwellingbeneaththe AAD and thoseinvolving a passiveviscousresponseto coolerthan normal mantletemperatures. The first classassumeseitherthat mantle downwelling is providing dynamic support for the AAD depth anomalyor that material from the AmsterdamKerguelen and Balleny-Tasmantidhotspots (Figure 1) is forcing asthenosphere into the AAD [Marks et al., 1990, 1991]. The second class assumesthat the depth anomaly is due to local compensationof regionally thin crust with passivealong-axismantle flow to maintain masscontinuity over a stiff, cold mantlelayer beneaththe AAD [Forsythet al., 1987]. In this study, we examine numerically upper mantle flow that is driven by both continental separationand upper mantle temperature gradients. Our goal is to construct a simple model which can account for the anomalous geochemicaland geophysicalfeaturesof the SouthernOcean and AAD in a physicallyconsistentframework.
Observed Constraints on Upper Mantle Flow Along the SEIR Geochemical
Constraints
The unusual geophysical features of the AAD and surroundingSEIR are associatedwith a sharpdiscontinuityin the Sr, Nd, and Pb isotopic signaturesof SEIR lavas. This marksthe boundarybetween"Indian"and "Pacific"mid-ocean ridge basalt(MORB) sourceuppermantleprovinces[Klein et al., 1988; Pyle et al., 1992, 1995]. This transition in isotopic signatureis presentlylocated near a transformoffset of the SEIR
between
126.5 ø and 127øE and extends over less
than about 70 km along axis [Pyle et al., 1992].
Off-axis
THE SOUTHEAST
INDIAN
RIDGE
7785
samplesdredgedfrom 3-4 Ma seafloorin the easternmostAAD spreadingsegmentrecordthe presenceof Indian MORB mantle beneatha segmentthat is now eruptinglavas with Pacific type isotopic characteristics [Pyle et al., 1992]. This change in mantle source signature implies that Pacific mantle has migrated westward beneath the easternmostAAD spreading
segment ata minimum rateof25mmyr-1forthelast3-4Myr [Pyle et al., 1992, 1995]. Recent isotopic studies of basalts from Deep Sea Drilling Project (DSDP) sites surroundingthe AAD (Legs 28 and 29) (Figure 2) further constrain the relative positions of Pacific and Indian uppermantleat 70 Ma [Pyle et al., 1995], and have been interpreted to support arguments for the long-term westward migration of the isotopic boundary [Pyle et al., 1995]. Samplesfrom several DSDP sites in the SW Pacific, south of New Zealand (Figure 2), appearto be derived from a Pacific mantle source that presumablywas present along the easternmargin of Gondwanaprior to the rifting of Australia and Antarctica.
Furthermore, southeast Indian Ocean DSDP
sites between the Kerguelen Plateau and the AAD all have Indian MORB isotopiccharacteristics.Samplesthat eruptedat two sites along the western margin of the South Tasman Rise are of particular interest; basalts recovered from DSDP hole 280A (-47 Ma seafloor) fall within the field of Indian MORB compositions,while basalts from DSDP hole 282 (-55 Ma seafloor) exhibit moderately Pacific MORB isotopic signatures with compositions that closely resemble transitional samples recovered close to the present-day boundarywithin the AAD [Pyle et al., 1995]. Thesedata seem to indicate that Indian mantle was present near the western margin of the SouthTasmanRise at -60 Ma (Figure 2), well to the east of the intersectionof the residualdepth anomalywith the Australian continental margin. In addition, two highly altered 30-40 Ma basaltsdredgedto the east and north of the AAD (37ø46'S, 132ø19'E; and 39ø55'S, 131ø58'E) also have Indian type isotopicratios (Figure 2) [Lanyonet al., 1995].
120 ø
30 Ma b.p.
Figure 2. Tectonic reconstructionof the Australian and Antarctic continentsto 30 Ma [after Pyle et al., 1995 and Lawver et al., 1992] showing the distribution of Deep Sea Drilling Project (DSDP) sites in this region(dots)and distributionof the Indian and Pacificuppermantleisotopicprovinces(notedby text). Pyle et al. [1995] suggestthat all basaltsfrom DSDP siteseastof Tasmaniaat 30 Ma are derivedfrom a Pacific type upper mantle. Samples from sites 282 and 280A, however, show transitional and Indian mantle sources, respectively,as is currentlyobservedon axis within the AAD. The paleopositionof the Lanyonet al. [1995], Indian type samples(stars)are consistentwith the Pyle et al. [1995] hypothesis.
7786
WEST
ET AL.: ASTHENOSPHERIC
FLOW
BENEATH
Although the off-axis data described above are not conclusive [Pyle et al., 1995], they are consistentwith the suggestionthat Indian type mantle was presentfar to the east of the AAD at the time when SouthTasmanRise separatedfrom Australia, and that this mantle has migrated along axis to its current location within the AAD. Assuming a constant
THE
SOUTHEAST
Geophysical
INDIAN
RIDGE
Constraints
Marks et al. [1990, 1991] calculated residual depth anomalies for this region of the SouthernOcean and showed that anomalousseafloor can be traced in a "V"-shapedpattern into both the Australian and Antarctic continents (Figure 4). In addition to suggestingthe presenceof cooler upper mantle velocity, Pyle et al. [1995] suggestthat the isotopicboundary temperaturesand/or thinner crust, the V shapeof the residual has migrated at to its current location at a mean velocity of depth anomaly indicates westward motion within the mantle about 40mmyr-1 since 60Ma[Pyleetal.,i995](Figure 3). [Marks et al., 1990, 1991]. Marks et al. [ 1991] suggestthe In addition, the Lanyon et al. [1995] samples;which lie to the off-axis symmetryreflects westwardmigrationof the sourceof north-northeastof the AAD, constrain the mean velocity to a the residualdepth anomaly with respectto the axis of the SEIR minimum of -20 mmyr-1 since 30Ma. However, other than during the openingof the SouthernOcean (Figure 4). This, in the Lanyonet al. [1995] samples,no geochemical constraints turn, has been interpretedto reflect along-axisasthenospheric
15and25mmyr-1 thatadvects the exist on the isotopicboundaryfrom 50 to 5 Ma, and models flowata rateof between with variable migration velocitiescan satisfy the available depth anomaly sourcetoward the AAD from the east[Marks et al., 1990].
data.
125øE
1• '6 øE
128øE
13 0 øE
131 øE
! -'•J I/•-•Resfi tual Depth I•,•'('•• !• I
I
Anomaly
45øS
46øS
.........I •';•'
I
I
ß
I
.•4 •? I • I •;-•4 •
47øS
I•
s
48øS
• D••
••
'Ind•n'mantle ••• 2a
igraang •pe Boundary ••'
49øS
50øS
....
•'Pacific' mantl, 51øS
?•= •:/•..•.
•op, rga•ng Ridl'eTrace 52øS
Figure 3. Schematic of constraints on along-axis flow of asthenospherebeneath the SEIR and AAD (modified after Pyle et al. [1995]). The isotopictransitionbetweenIndian and Pacific upper mantle currently existsat approximately127øE within the AAD, and the inferred migrationof the boundaryis recordedby the thick solid line Pyle et al. [1995]. The off-axis trace of the residualdepth anomalyis taken from Marks et al. [1990], and its intersectionwith the easterntransformof the AAD (dashedline) approximatelyat magnetic anomaly 5b is coincidentwith the developmentof the strongly segmentedcharacterof the SEIR within the AAD. Propagatingridge traces also intersectthe easterntransform and suggestalong-axismotion within the upper mantle.
WEST ET AL.: ASTHENOSPHERIC
FLOW BENEATH
THE SOUTHEAST
120 'E
130 •E
INDIAN
RIDGE
7787
140 •E ......
:•.
.-.
/
45•S
50•S
60•S
.
110øE
!20•E
I$O'E
140•E
meters
..... ..
-1600
4400
-1200
-1000
-800
-600
-400
-200
0
200
400
Figure 4. The AAD's residualdepthanomaly[Markset al., 1991]. The AAD is associated with a residual depthanomalythat extendsNNE and SSE acrossthe Australianand Antarcticplates,respectively,to the continentalmargins.The broad, west facing, V shapeof the depth anomalysuggestsa slow westward
migration at 15-25mmyr-1[Marks etal.,1990]overthelast30Myr,andabout 30mmyr-1priortoits
intersectionwith the easternboundingtransformfault of the AAD. Overlaidin white are lineationsderived from satellitegravityanomalydata[Smithand Sandwell,1995]. In additionto north-south trendingtransform faults, multiple lineationsdefine westwardpointing,V-shapedstructuresthat reflect past episodesof rift propagationeastof the AAD.
Asthenosphericflow toward the AAD has also been suggested basedon episodesof ridgepropagation observedon the SEIR [Vogt et al., 1984; Marks et al., 1990, 1991; Sempdrdet al., 1996, 1997]. Oblique topographiclineations off axis, extendingboth eastand west of the AAD, have been identified with satellite gravity data [Phipps Morgan and Sandwell, 1994]. The most prominent of the off-axis lineations are associatedwith large propagatingrifts that convergeon the AAD from boththe eastandthe weston the SEIR [PhippsMorgan and Sandwell,1994; Semp•r•et al., 1996, 1997]. Many of the off-axis lineations and oblique structuresterminate at the easternboundingtransformof the AAD near the 25 Ma isochron,consistentwith the age of the
development of the roughgravityandbathymetric signature of this region(Figures3 and 4). The GeorgeV ridgetransform system(~139øE) appearsto havebeenthe locusof origin for manyof the propagating ridgeson the SEIR eastof the AAD (Figure4). Off-axistracesof thesepropagating ridgesindicate
a propagation rateof 30-45mmyr-1 toward the AAD. Althoughthe causeof rift propagationis poorly understood, thesepropagation ratescanbe interpretedas the flow velocity
of the asthenosphericflow within the melt column (Vogt et al., [ 1984], Marks et al. [ 1990, 1991], Semp•r• et al. [ 1996], also see discussion) and are similar to the flow velocity inferred from the migration of the Indian-Pacific isotopic boundary [Pyle et al., 1995] (Figure 3). Method
We study passiveand buoyant asthenospheric flow due to continental separationin a constant- and variable-viscosity upper mantle using a three-dimensional, finite-volume formulation of viscousfluid flow based on the Semi-Implicit Method for Pressure-LinkedEquationsShorTened(SIMPLEST) algorithm [Patankar, 1980]. In order to make the problem tractable,we approximatethe separationof the Australia and Antarctica continentsby diverging blocks in constant- and variable-viscosity mediums along a four-segment rift, representing the SEIR (Figure 5). Our models do not incorporatethe complex processof continental rifting and thus cannot be taken as representativeof the flow pattern immediately after continental separation (100-45 Ma). Our
7788
WEST ET AL.' ASTHENOSPHERIC
FLOW BENEATH
THE SOUTHEAST
165 øE, 33•S
INDIAN
RIDGE
Axis oftheSEIR 165 øE, 73•S
Pacific Ocean
-20 Ma b.p. North
/---:,•::••
1200km
?
120 øE,33 •S
Australia /
//
South
3210 km
120 øE, 73 •S 4440 km
Figure 5. Schematicof the model geometry. The lengthsand ridge segmentation are chosento approximate the configurationof the SouthernOcean(Figure 1); our model segmentation is representative of the gross
segmentation patternsof the SEIR over the last 40 Myr, includingthe Tasmanfracturezonecomplex. Our modelextendsfrom the AAD at.~120ø E, throughthe SouthTasmanRise to 165øE. In this Cartesianmodel, 1 km in modellatitudeis assumed to equal0.64 km in modellongitude,the approximate relationship at 50ø S.
geometryalsoneglectspossibleeffectsthe Pacificsubduction zone associatedwith the Macquarie Ridge may have on upper mantle circulationon this region [Baumgardner,1988]. The
focus of our study,however,is the first-orderupper mantle
dynamic pressure, g is the•ravitational acceleration, p isthe mantle density (3330 kg m-ø), a v is the volumetricexpansion
coefficient (3x10 -5 oC-1 ), To is thereference temperature (1350øC), •cisthethermal diffusivity (10-6 m2 s-l),p isthe
flow structure beneath the SEIR within the last 40 Myr
viscosity,and •5is a tracerwith a numericalvalueof either1 or
between 120øE and 136øE. We assume that the AAD at 120øE
0 assigned to the Indian and Pacific mantle reservoirs, respectively. In passiveflow simulations,in which buoyancy is neglected,the secondterm on the right-hand side of (2) is dropped. Equationsof the form of (4), in which the associated Peclet number approaches infinity, are associated with numerical diffusion when flow is oblique to control volume faces [Patankar, 1980]. In our models, we have attemptedto minimize numerical diffusion by orienting the grid lines orthogonal to the predominant flow in the region of interest and by employinga second-orderupwind differencingmethod [Spalding, 1979, 1980].
is an axis of symmetryand modelonly the easternhalf of the SouthernOcean. Our rectangularnumericaldomain,scaledto the presentoceanbasin,extends3210 km from eastto west, 4400 km from north to south, and 400 km in depth and is
dividedinto a regulargrid consistingof 25 x 28 x 25 control volumes.
Governing
Equations
The equationsfor Newtonian,incompressible convection solved by our algorithm are the equationsof continuity, momentum,energy,and conservationof a passivetracer:
Boundary V-u
=0
(1)
Conditions
In all simulations,the continentsare modeled as regionsof prescribedvelocities, correspondingto the half spreadingrate
of thesystem, 37mmyr-1. Thecontinents extend fromthe VP' = V * (/•Vu) + pav (T- TO)g
0T
•+ue
VT = K'V2T
Ot
05 --+uo Ot
V5 = 0
western end of the domain to approximatelyhalfway along
(2) strike oftheridge axis, beyond themodel Tasman Fracture (3)
(4)
where u is the velocity vector, T is the temperature,P' is the
Zone Complex, and extend to a depth of 200 km (Figure 5). The internal regions of the continents are held at a fixed temperatureof 1000øCbelow 50 km, decreasing to 0øC at the surface according to an error function relationship. These conditions mimic the expected thermal conditions of Cretaceous cratons [Guillou and Jaupart, 1995]. Where continents intersect the model boundaries, the continental
pressure and temperature conditions always override the boundaryconditionsascribedelsewhere.
WEST
ET AL.: ASTHENOSPHERIC
FLOW
BENEATH
In passiveflow models,the northern,southern,and bottom boundaries of the numerical domain are assigned a pressure condition correspondingto a dynamic pressureof 0.0 (e.g., (2)). This combination of velocity and pressure boundary conditionscan approximate the analytic, passive corner flow
THE SOUTHEAST
INDIAN
RIDGE
7789
to both the absolutelevel of the mean viscosity and contrasts in viscosity. Thus we explore solutions with reference
viscosities of 1019-10 21 Pas, a range thatspans current estimatesof oceanic upper mantle viscosities[Cathies, 1975; Turcotteand Schubert,1982]. To preservenumericalstability,
solutionsof Reid and Jackson[1981]andBatchelor [1967]
viscosities
without artificially forcing flow at the bottom boundary. In models including buoyancy forces, only the bottom boundary is assigneda dynamic pressureof 0.0 and the northern and southernboundariesare assignedvelocities derived from the passiveflow solution. The top surfaceis assigneda constant
minimum and maximum values of 0.005go and 1000go, respectively, thus limiting the total variation in viscosity
halfspreading rateoftheSEIRwithin theAAD•t thepresent and eastern
boundaries
of the model
are assumed
to be
symmetryplanesthroughwhich no flux of materialis allowed. Temperature boundary conditions are applied as flux conditionsto (3) such that the top surface, correspondingto the seafloor,is maintainedat a temperatureof 0øC. All side boundaries
are
assumed
adiabatic.
The
bottom
thermal
boundary condition is also adiabatic with only incoming material having a prescribedtemperature[Spalding, 1979, 1980]. Thus the temperatureat this boundaryis not "fixed," resultingin a more natural way of specifyingtemperatureson an artificial boundary within a larger convecting system [Spalding, 1980]. In simulations without an along-axis temperature anomaly, material passing into the numerical domain through the bottom is assigned a temperature of 1400øC. In simulationswith temperatureanomaliesbeneath the AAD, cooler than normal upper mantle temperaturesare prescribedby linearly decreasingthe influx temperaturefrom 1400øC at 145øE to a lower value at 120øE.
This
results in a
maximum temperatureanomaly centeredbeneaththe AAD at 120øE, as described by Kuo et al. [1996] (Figure 1), and a linear temperaturegradientalongthe SEIR.
our numerical
domain
are limited
to a
within our models to about 5 ordersof magnitude[Patankar, 1980; Ogawa et al., 1991].
velocity oneither sideof theriftof 37mmyr'1 theaverageInitial
time [Palmer et al., 1993]. Material is allowed to passthrough all but the top, eastern,and westernboundaries. The western
within
At
Conditions
40
Ma
all
noncontinental
material
west
of
approximately142øE is assignedto be an Indian type, while material east of this boundaryis assignedto be Pacific. This is in accordance with our current understanding of the distributionof mantle sourcesat that time [Pyle et al., 1995, Lanyon et al., 1995]. Throughout the simulation, material enteringthe bottom of the numericaldomain west of the 142øE boundaryis assignedto be Indian, while materialenteringto the east is assignedto be Pacific. At the startof each simulation,the continentsare separated by 500 km to approximatetheir configurationat 40 Ma. The initial temperatureconditionsfor all simulationsare those for the passive spreadingsolution to the model ridge geometry
anda spreading rateof 37 mm yr'1 but withoutthe complicatingfactors of continentsor along-axistemperature anomalies. In all solutionsflow is allowed to develop in the numericaldomain over a dimensionaltime of 40 Myr. Each time step covers 5 Myr and contains 3000 iterations on the flow equations.This ensuresconvergence to a stablevelocity, pressure,and temperaturesolution that satisfiesthe velocities and temperaturesimposedin the continents. The faces of the continents within the numerical box effectively act as boundary conditions for an expanding solution domain that correspondsto the upper mantle of the opening Southern Ocean.
Rheology
In variable viscosity simulations, the viscosity of the mantle is defined by an exponentialrelationshipdependenton both lithostatic pressureP (assumedto be a linear functionof depth) and temperature:
Benchmarks of the Finite-Volume
Algorithm
To ensure that our numerical algorithm is applicable to mantle flow problems, we benchmarked our finite-volume implementation against results of analytic corner flow
[Batchelor, 1967], and publishedconstant-viscosity, threedimensionalcornerflow [PhippsMorgan and Forsyth, 1988], (5) /a[T,P(z)]= goexp< two-dimensional variable-viscositycorner flow solutionsthat we obtainedwith the algorithm ConMan [King et al., 1989], lro J and the constant- and variable-viscosity natural convection benchmarks outlined by Blankenbach et al. [1989]. For where R istheuniversal gasconstant (Jmol'1K'1). Wehave constant- and variable- viscosity corner flow tests, our adopted values of activation volume, V=10 '5 m3 mof '1, and algorithmreproducedvelocity and temperaturefields well. For activation energy,E=520kJ mol'1, thatmatchaveragenatural convection benchmarks in a constant viscosity laboratory-determined values of an anhydrous medium, we obtained solutions also within the range of olivine/pyroxene composition [Goetz, 1978; Cooper and published values [Blankenbach et al., 1989]. However, for Kohlsted,1986]. This combinationof parametersproducesan natural convection benchmarkswith temperature-dependent order of magnitude change in viscosity over a temperature viscosityour Nusseltnumbersand root-mean-square velocities interval of approximately125øC at constantpressure. Owing are in error by about 10% of publishedvalues. to the pressure dependency of our viscosity relationship, a Previous work has shown that the poor convective twentyfold viscosity increase occurs over a pressureinterval solutions obtained using the SIMPLEST algorithm for equal to a depth increase of ~100 km. In passive flow temperature-dependent viscositiesare a result of the staggered simulationsthe choiceof referenceviscositygo is immaterial natureof the grid in which the fluid viscosityis definedat the
I
V
since only the contrasts in velocity affect the solution. However, solutions involving buoyancy forces are sensitive
cell centers while
velocities
[Ogawa et al., 1991].
are obtained on the cell walls
The harmonic mean interpolation
7790
WEST
ET AL.: ASTHENOSPHERIC
FLOW
BENEATH
THE SOUTHEAST
INDIAN
RIDGE
Pacific isotopic boundary from its initial position within the scheme,which is used to extrapolateviscositiesto the cell edges,resultsin significanterrors when there is a component Tasman transform complex to its presentaxial location within the AAD (Figure6). of flow perpendicularto steep viscositygradients. Thus, in the variable viscosity convection solutions,the algorithm is To compare our solutions with the along-axis flow velocitiesinferred from the tracesof propagatingrifts, we also inaccurate in regions where material enters and exits the thermal boundarylayers. We have not implementeda more calculate the horizontal trace of a particle that is initially at the George V fracture zone 25 Ma and that is confinedin the sophisticated viscosity interpolation scheme to minimize these errors for two reasons. First, in our models nonsubaxialmeltingregionat a depthof •-50 km. Thuswe assume dimensionalized flow-parallel viscosity gradients are much that propagatingrifts are tied to melting anomalieswhich are smaller than in the convection benchmarks. Second, advected along axis. As for the isotopic boundary, the numerical errors of about 10% within our solutions are calculated propagating ridge trace does not match inferred acceptable, given the other simplifications and along-axis flow velocities (Figure 6). The trace migratesin velocity of only12 mmyr-1 approximationsthat are incorporatedinto our regionalmodel. Figure6 withan average In our simulations, it is not our intention to model small-scale comparedto the observedpropagatingrift velocitiesof 30-45 calculations demonstrate theneed formore a complexity in the flow and temperaturefields beneath the mmyr-1.These complex model parameterizationto match the geophysicaland ridge axis but, rather,to define the-large-scale flow featuresof geochemical evidence for more extensive along-axis flow the upper mantle. beneath the SEIR.
Results of Calculations
Passive Flow in a Variable Passive Flow
in a Constant
Viscosity Upper
Viscosity Upper
Mantle
Mantle
Our first variable viscosity simulationincluded separation of the Australian and Antarctic continentsin a temperatureand pressure-dependent viscositymantle (equation(5)) with a constantbottominflux temperature.The results(Figure7) are yr-1) to fill in the narrowgapbetween the divergingsignificantly different from the constantviscositysimulation. continents. At this time, enhancedsubaxialupwelling is also In contrastto the constantviscosity calculations,large-scale presentbetween 120øE and 145øE since flow is focusedinto (.--1000 km) distributed flow perturbationsare not associated the narrow region between the continents. In this constant with the Tasmantransformfault complex(Figure7). The RTRviscosity simulation, Tasmania acts as an impediment to induced flow is of a lower magnitude than in the constant along-axis flow that would otherwisecome directly from the viscosity simulations and is localized to within ~150 km of Pacific and forces the horizontal flow to originate from the the RTR intersections. In addition, a "channel" of low south and east in early time steps. After 30 Ma, the increased viscositiesexists beneath the ridge axis, extendingthrough upwelling and longitudinal flow diminishes. The flow the transform complex and linking the model Indian and associated with the ridge between 120øE and 135øE is Pacific Oceanbasins. Higher off-axis viscositiesfocusalongsymmetric about the ridge axis and approximatesthe corner axis flow beneath the ridge axis and impede the off-axis flow solution [Reid and Jackson, 1981; Batchelor, 1967], development of the large-scale counterclockwisecirculation while the flow beneath the ridge-transform-ridge (RTR) observedin the constantviscositycalculations. intersections between 135øE and 150øE is similar in structure In variable viscosity calculations, mantle viscosities are to the flow solutionsof Phipps Morgan and Forsyth [1988] high beneath the continents owing to both the depth and Rabinowiczet al. [1993] for RTR geometries. The ridge- dependenceof (5) and the cooler mantle temperaturesthat transformgeometrywe employ to model the complexTasman result from holding the deeper portions of continents at transform zone distributes the associated mantle flow 1000øC. The viscositystructurecouplesthe continentsto the perturbationover a geographicrangeof--1000 km (Figure 6), underlying lower mantle regions effectively increasingthe and the combined effects of the RTR intersections and continental root (section b-b' in Figure 7). This coupling continentsresult in a general counterclockwiseperturbationof enhancesupwelling and reducesthe along-axisflow necessary the flow field. Flow into the wake of the divergingcontinents to satisfy continuity between the diverging continents migratesfrom the southand east,throughthe large transforms (subcontinentalregions in section b-b' of Figure 7). This associatedwith the Tasman fracturezone complex. effect also results in a lower propagating ridge velocity In all simulations we track the composition of material (Figure 7) compared with those shown in Figure 6. In within our domain using (4). To predict the volcanic(surface) variable-viscosity calculations which do not fix the expressionof the Indian-Pacific isotopic boundary, we plot continental temperature (that is, the thermal structurewithin the maximum westward displacementof the boundaryat the the continent varies proportionally to the square root of axis on the seafloor for a given time step. This parcel of distanceaway from the ridge axis), along-axisflow velocities seafloor then moves off-axis as part of the lithosphere. Thus are initially ~40% higherthan thosepresentedin Figure7. the predicted isotopic boundary on off axis seafloor is the As in the constantviscosity simulation,the flow field due maximumwestwarddisplacementof Pacific mantlebeneaththe to continentalseparationin a variable-viscosity uppermantle ridge axis at the time the seafloor formed. This predictsthe does not advectmodel Indian-Pacificisotopeboundaryfrom surface expression of the isotopic boundary that would be its initial locationjust west of Tasmaniato a positionwithin observed by off-axis dredging or drilling. For the constant the AAD (Figure 7). The boundarymigratesonly about 100 viscosity simulation, this calculation demonstratesthat the km along axis. Additionally, the trace of the simulated along-axis flow present is insufficient to advect the Indian- propagating ridgemigrates atonlyabout 5 mmyr-1,anorder Figure 6 showsthe resultsof our calculationsin a constantviscosity mantle. Initially, between 40 and 30 Ma, a significantcomponentof along-axisflow develops( >15 mm
WEST ET AL.' ASTHENOSPHERIC
FLOW BENEATH
135
THE SOUTHEAST
140
INDIAN
RIDGE
145
-35
:X::: • .
;• ,...
-40
.
-45
:::::::::::::::::::::::::::::::::::: ...... ,' * ' . .•..-*,..*:• ':::•:;i ..'::.:-;:::':::' .::.. ;::::•::,::.}}•;; :•:
::::;:•: .::.:..•:•
2500
2000
1500
1000
b'
a
Lon:'gtmde
a' 400
400
300 200 100 0
0
5•
1•
-50-45-.40-35-30-25-20-15-I0
15•
2•
-5
0
25•
5
3•
10
rnmyr'• Figure 6. Planformof present-daypassiveflow in a constant-viscosity mantledue to separationof the Australianand Antarcticcontinentsin a constantviscositymantle. This and subsequent figuresare arrangedas follows: (center)a horizontalplane at a depthof 80 km which approximates the baseof the melt column. (bottom),(labeleda-a'), a vertical slice beneaththe axis of the SEIR between120øEand 136øEand extending
alongstriketo the eastthrougholderlithosphere createdon the SEIR eastof the Tasmanfracturezones,and (left), (labeledb-b'), a verticalcrosssectionperpendicular to the axis at approximately128øE. White vectors
represent calculated mantleflow patterns.The thickwhiteline in thecenterrepresents the surface(volcanic) expression of the Indian-Pacificisotopicboundary(seetext), while at bottom,the white line represents the boundary throughout the mantle. A calculated propagating rift trajectory(seetext)is shownby the solidblack line. The positionof the continents is shownby blackblocks. The currentlocationsof the Australianand Antarcticcontinentsare tracedin white for comparison.The modelridgeaxis is indicatedby a solidline, and the observedridgeaxis in this coordinatesystemis tracedin white. The centeris annotatedand markedin geographic coordinates, whilecrosssections a-a' andb-b' are annotated in equivalent kilometers.Note thatat high latitudes,the geographic locationof the Antarcticcontinentplotswell beyondthe modellocationowing to the distortionthat our Cartesianmodel geometryintroducesin this region.
7791
7792
WEST
ET AL.'
ASTHENOSPHERIC
FLOW
BENEATH
THE
SOUTHEAST
12012,.5 •1130 135140
145
150
.1515
INDIAN
160
RIDGE
165 ß
'
-3.5
4(X)O
.4'0
-45
2500
20O0
-6O
500
•
0 0
200
b'
a
LongiO•e
•km
400 5•
0
•50 45 -40-35
a'
::•-•:•::::-•::-•:.:•: ............... ?:"'•'•'•'i.•'•'•' ........... •...................................... •'........................... •-•:........ •2•-m•m•-.-.-.--•.•: 4•
500
1•
15•
-30-25-20-15-10
2•
-5
0
2500
5
3ff>0
I0
mmyr't Figure 7. Planform of present-daypassiveupper mantle flow due to the separationof the Australianand Antarcticcontinentsin a mantlewith a temperatureand pressure-dependent viscosity.The influx temperature on the bottom boundary in this simulation is constant. In contrastto flow in a constantviscosity mantle, little axis-parallel flow occursoff axis owing to the focusingeffects of the low-viscosityzone beneaththe ridge axis. The high angle that the modelprqpagatingridge traceintersectsthe ridge axis (-70 ø) indicatesan along-axisflow componentof about5 mm yr- I , lower than that inferredfrom ridge tracesshownin Figure 4. of magnitudemore slowly than the velocity inferred from Figure 4. These results again demonstrate that further complexitiesin the modelparametersare requiredto reproduce the inferred magnitudeof along-axisflow. Passive Flow in a Variable Viscosity Upper Mantle With Temperature Gradients
Figures 8 and 9 show a solution for passive flow in a variable-viscosity upper mantle with a linear temperature
gradient. In this solution, the temperature of the mantle upwelling throughthe lower boundaryis 300øC cooler beneath the AAD than "normal"upwelling mantle east of 145ø E. The introduction of temperature anomalies beneath the ridge results in the developmentof sustainedalong-axis flow toward regions of cooler mantle (Figure 8). Owing to lower mantle temperatures, a wedge of high viscosities exists beneath the ridge axis of the AAD (Figure 9, sectiona-a' and Figure 10). A higher-viscositymantle at depth is more difficult to upwell, and thus along-axis flow in the low-viscosity region beneath
WEST ET AL.: ASTHENOSPHERIC FLOW BENEATH THE SOUTHEAST INDIAN RIDGE
7793
.120125 •30 135140145 -35 4000
-
-40 3500
-÷45
1500
1000
500
400 400
b'
a
Longi•e
,krn
a•
';i':'i/•½"'"'•'"•:':•'• 'v•'•:•:•...,.... i;½:
:;:,'! 400
300 ß
•: •...-:L... •::•
.::•..-•
ß ..:%;.......:•, ß•}: .....:.•.z.::.• •:•-.:...•::.•:•½:.•:.;...:..•:•:..•..: ....
,•- ..........
200
I00 o
0
500
1•
1500
20•
2500
3000
............... ß.............ß.... ":........ :•'::-::-::.. .....-'...•"½'•'•57'--'"'•'•:•:•i ..........
-50 .•.45-40 -35 -30 -25 -20 •15 -10 -5
0
5
IO
mmyr4 Figure 8. Planform of present-day passive upper mantle flow due to the separationof the Australian and Antarctic continentsin a mantle with a temperature- and pressure-dependent viscosity and a horizontal basal temperaturegradient. In this simulation,the influx temperaturedecreaseslinearly from 1400øC at 145øE to 1100øC at 120øE. Significant along-strikeflow developsand continuesto the presentday owing to higher mantle viscosities beneath the AAD. The along-strike flow is concentratedbeneath the ridge axis in the subaxial, low-viscosity region. The transform fault complex acts as a channel through which the along-axis flow is able to migrate without significant hindrance. The model-propagatingridge trace intersectsthe ridge axis at an angle similar to that shownin Figure 4, and the final along-axispositionof the isotopicboundaryis consistent with the observed location (Figure 3). Note that the propagating rift trace and the migrating isotopicboundarycrosssincethe propagatingrift marker is requiredto remain at a depth of 50 km beneaththe ridge axis, while the isotopicboundaryis advectedby the full, three-dimensionalflow field.
the ridge axis developsto fill the gap left by the separating vertical temperature inversion in the subaxial mantle (Figure continents.
This
flow
results
in the advection
of warmer
10, bottom).
In Figure 8, the along-axis flow velocity inferred from the asthenosphere into the low viscosityregion overlying cooler, deepermantleregions(Figure 10, bottom). This flow subdues off-axis trace of the model propagatingrift is about 35 mm 125ø and140øE.Figure11 shows themean the deeper horizontal temperaturegradient and results in a yr'1 between
7794
WEST
ET AL.'
ASTHENOSPHERIC
FLOW
BENEATH
THE SOUTHEAST
0 200400 1201,25 •0 135140
145
150
155
INDIAN
RIDGE
.160
165
t
ß 40OO
?'•!:i::i:!•.:iq• TM .......... •'•-• ;•...•
3500 .::
.. '• :-50 .
....
-:.• ::.
,.
-60
..
0 .............. 0
200
b'
..........
. .......
Longitude • a ,km •".•'•'•'"'"":'::": ß :..;:'-: .:.?• •":'":.::':'":':;'7.....
4(•)
a'
40(.) '•';;': . ,*:.'(:;:':.;i•. ':'•'" ':"½{• i(.'{•:' ;.?::::'," ---•:':' ......... •.`.•..•..•:.•m•::.::.`::.:?•?•..:`:: 400
•:•:•::•:3e:•:;•:;;•::•:*•.•3•3;::•;:•::l•ll==ll.:.=.l,l: llll•ll'll••••l:••l=:::=•:•:l=:•:•:l• ................ :.•:•:.:•::I:I:=:•:'